Multiaxial Fatigue Life Prediction on S355 Structural and Offshore Steel Using the SKS Critical Plane Model


1
Department of Civil and Materials Engineering, University of Malaga, C/Dr Ortiz Ramos s/n, 29071 Málaga, Spain
2
Department of Mechanical Engineering, University of Coimbra, 3000-370 Coimbra, Portugal
*
Author to whom correspondence should be addressed.
Metals 2018, 8(12), 1060; https://doi.org/10.3390/met8121060
Submission received: 13 November 2018
/
Revised: 5 December 2018
/
Accepted: 6 December 2018
/
Published: 13 December 2018
(This article belongs to the Special Issue High-Strength Low-Alloy Steels)
Abstract
:This work analyses the prediction capabilities of a recently developed critical plane model, called the SKS method. The study uses multiaxial fatigue data for S355-J2G3 steel, with in-phase and 90° out-of-phase sinusoidal axial-torsional straining in both the low cycle fatigue and high cycle fatigue ranges. The SKS damage parameter includes the effect of hardening, mean shear stress and the interaction between shear and normal stress on the critical plane. The collapse and the prediction capabilities of the SKS critical plane damage parameter are compared to well-established critical plane models, namely Wang-Brown, Fatemi-Socie, Liu I and Liu II models. The differences between models are discussed in detail from the basis of the methodology and the life results. The collapse capacity of the SKS damage parameter presents the best results. The SKS model produced the second-best results for the different types of multiaxial loads studied.
1. Introduction
Performing accurate fatigue design is crucial for making a difference between the efficient use of a material with a reliable security factor and a catastrophic failure that could endanger human lives. Since most mechanical systems are subjected to complex multiaxial loadings, it seems appropriate to apply specific theories, instead of uniaxial-based theories.
When a system is subjected to multiple loads, it is necessary to consider not only the stress state but also the response of the material, the interaction between the loads, and their effect on the nucleation and growth of cracks. Effects of mean stresses and strains on multiaxial fatigue were investigated by Socie and Kurath [1], observing the sensible detrimental effect over fatigue life of the mean stress. Studies about the material hardening for different loading paths in 304 stainless steel were carried out by Itoh et al. [2]. Interactions between sub-cycles of the loads were investigated by Erickson in order to develop a suitable damage parameter which includes such effects [3]. Fatigue life and crack growth planes predictions around notched specimens were also studied by Branco [4] under multiaxial conditions. Multiaxial fatigue theories try to encapsulate such information in a damage parameter that describes what happens throughout the load cycle. Instead of developing a single theory to cover all materials, load configurations and external factors, various theories have been postulated aimed at improving the predictions for a range of scenarios. Multiaxial fatigue theories can be classified into three main groups: (i) extended static yield criteria to fatigue [5,6,7,8]; (ii) cycle energy parameters [9,10,11,12]; and (iii) critical plane models [13,14,15,16]. Previous studies and observations have shown better results when applying critical plane models [13]. Critical plane models evaluate the damage in each cycle with a parameter, normally as combination of several stress-strain values, in the plane where the crack nucleates and grows. Critical plane models have shown positive results for various materials and industrial applications [17,18,19] and are already implemented in some recognised computer aided engineering tools widely used across structural, offshore and mechanical industries. For example, Fatemi-Socie and Wang-Brown models are included in MSC Fatigue and Comsol numerical software [20,21]. As in uniaxial fatigue, models with damage parameters based on stress data are more suited to high cycle fatigue and those methods based on strain data present better results for low cycle fatigue, as they account for plastic strain and other low cycle life effects [22]. Depending on the dominant cracking mode for the material, some models are more suitable for mode I [16] and other for mode II or III [13].
In this work, a recently introduced critical plane model is evaluated. It is a stress based model that was introduced previously by Sandip, Kallmayer and Smith [23]. We will refer to this recently introduced model as the SKS model. The SKS damage parameter is able to account for the material hardening/softening, the mean shear stress effect and the interaction between shear and normal stresses [23]. The SKS damage parameter includes two material parameters to be fitted with fatigue experimental data. Life is also estimated using other previously introduced critical plane models, namely Fatemi-Socie [13]; Wang-Brown [15]; Liu I and Liu II [14]. The fitness of the SKS critical plane model is assessed by comparing the results with the other well-established critical plane models on S355-J2G3 steel subjected to both in-phase and out-of-phase loadings.
2. Materials and Methods
The material utilised in this investigation is a low carbon steel S355-J2G3, commonly used in industry for both structural and offshore applications. This material exhibits good fatigue resistance and has environmental impacts for applications where no energy is consumed during the use phase of the component [24]. Its typical chemical composition is shown in Table 1.
The monotonic properties of the material are shown in Table 2 and were obtained from experimental testing, including tension, compression and torsion. Plane specimens were used to characterise tension properties and tubular specimens were used to characterise torsion/compression properties.
The cyclic uniaxial properties (Table 3 and Table 4) were obtained following the ASTM recommendations [25]; for ε-N curves, fifteen samples were tested with five different strain levels (i.e., three samples for each strain level), and for γ-N curves, twelve samples were tested with four different strain levels (i.e., three samples for each strain level). In both series of tests, the criterion to stop the test was a 20% drop from the maximum load.
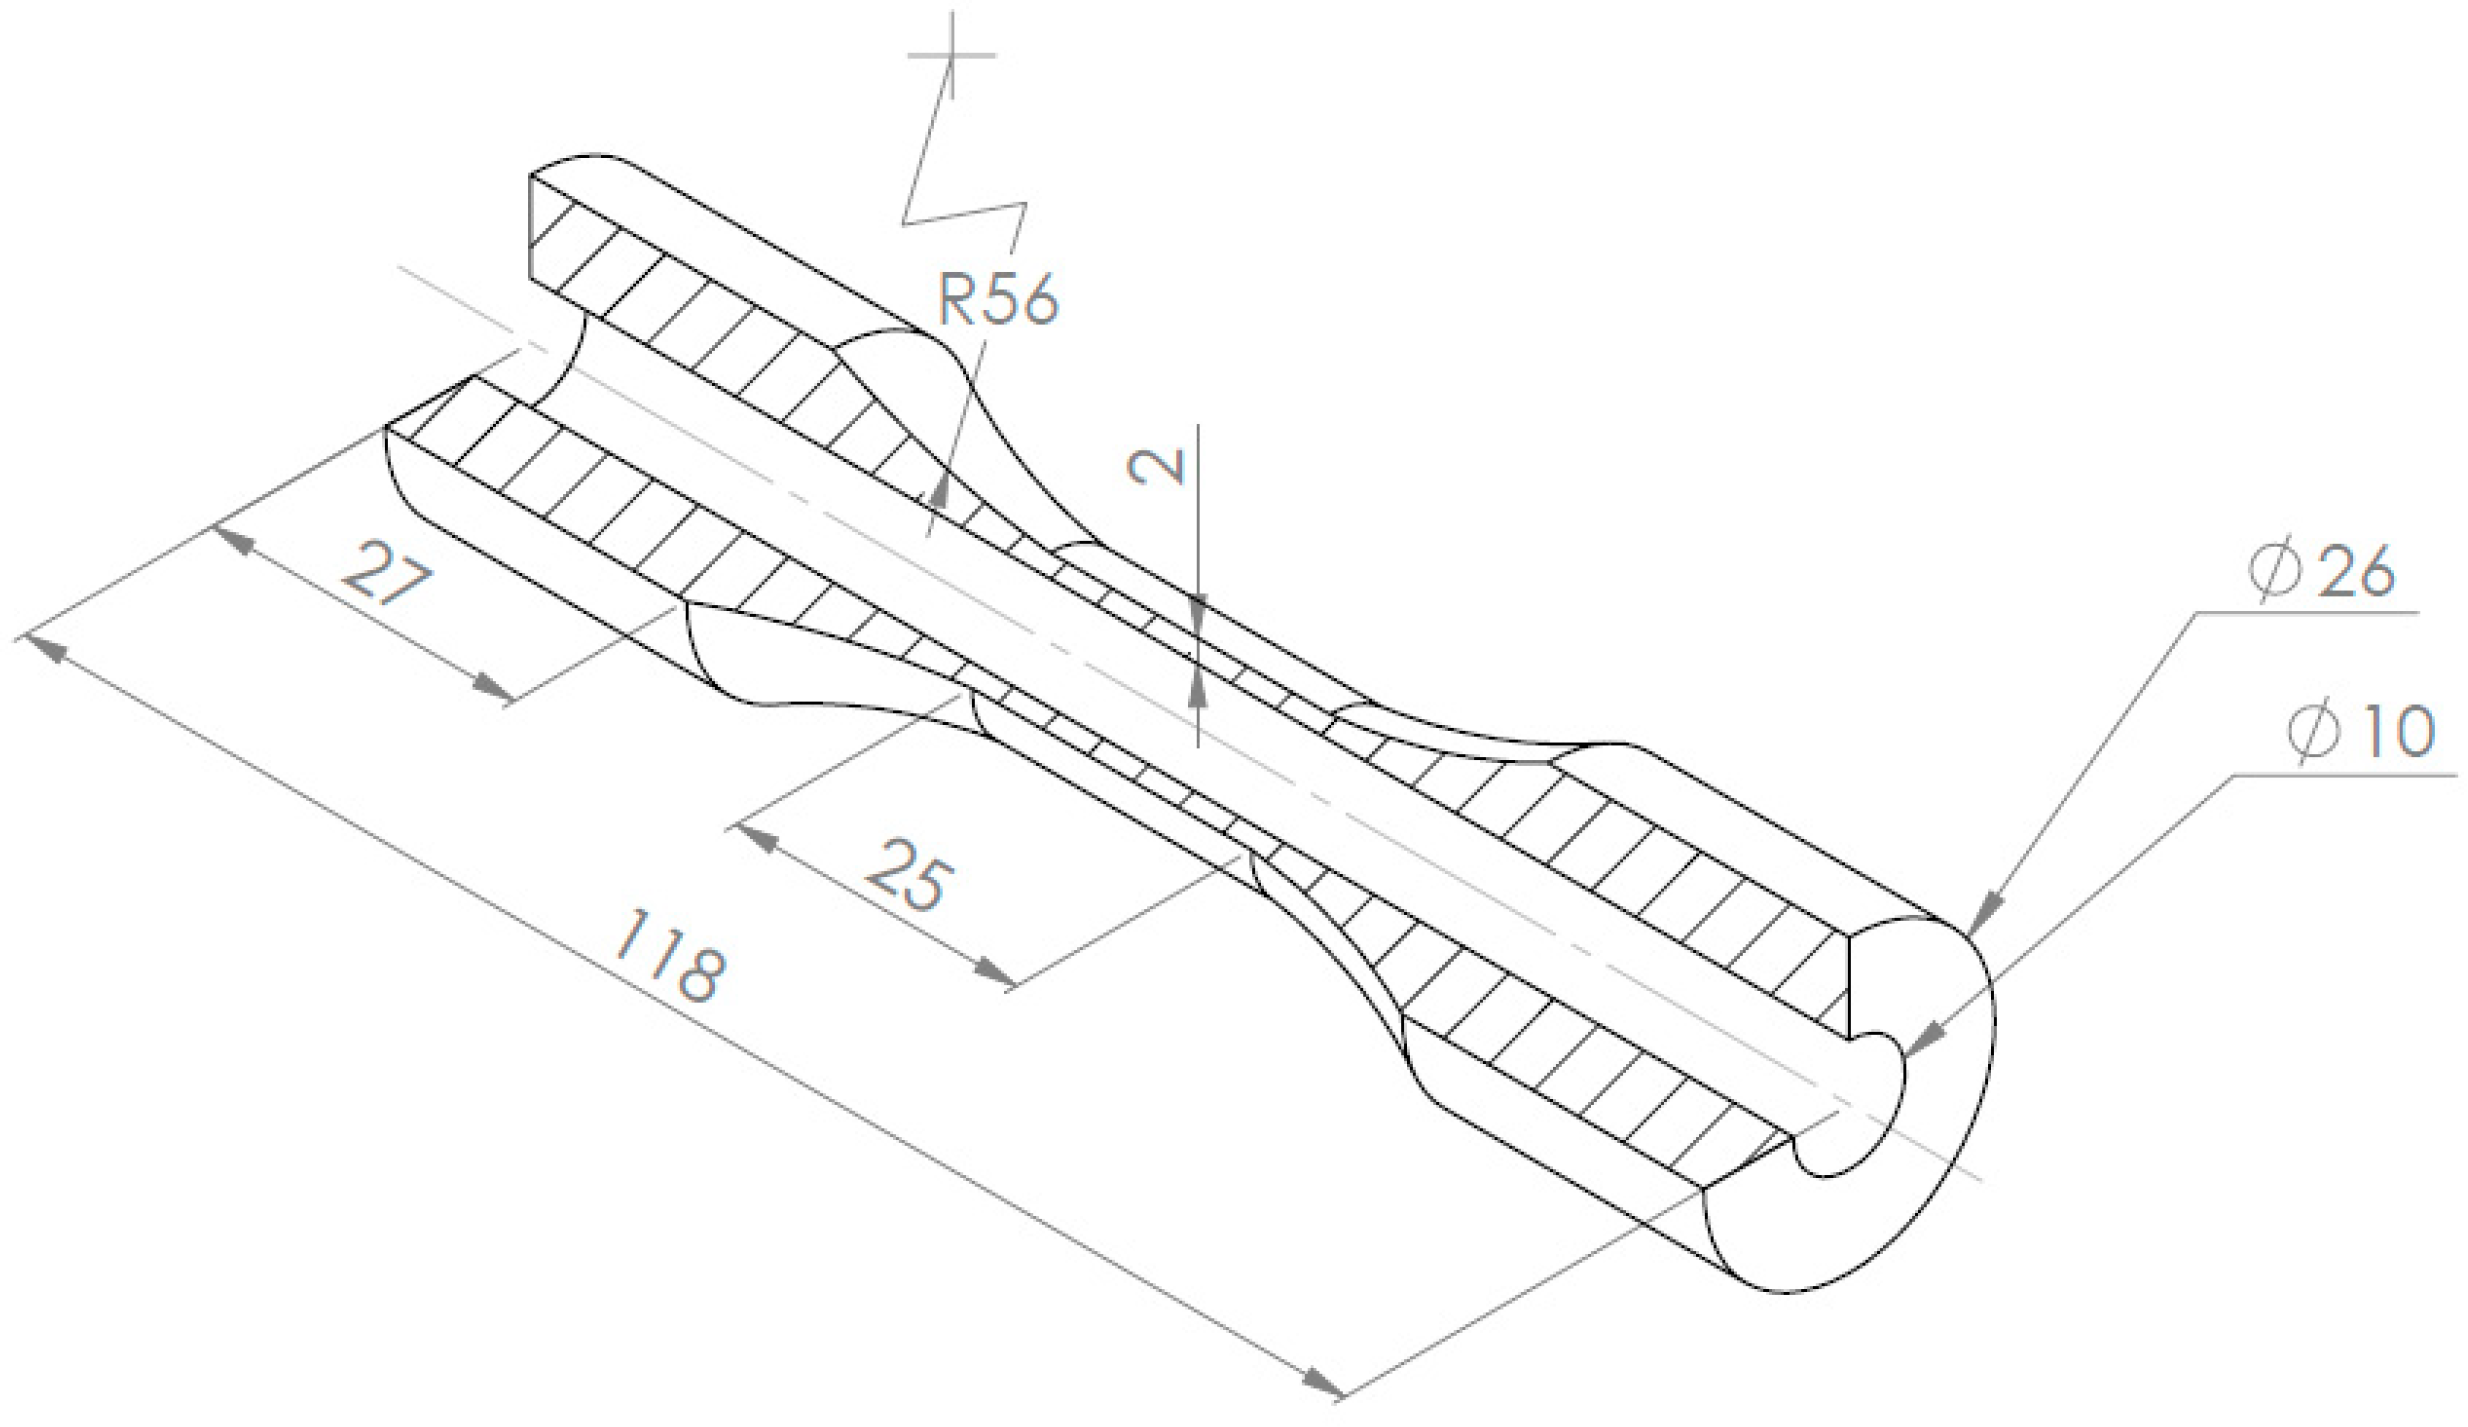
Multiaxial fatigue tests were conducted under strain control with total inversion with tubular specimens (Figure 1) [26]. The use of strain control rather than load control is more appropriate in order to define the stabilised stress-strain hysteresis loop, especially in the low cycle fatigue (LCF) regime when yield stress is exceeded and cross section reduction could be important [27]. A way to reduce the test time is to obtain the load stabilised values, and finish the test under load control with a higher frequency [28].
3. Critical Plane Models
Critical plane models are based on observations of crack nucleation and growth during loading. Therefore, depending on the material and service conditions, fatigue life will be calculated using parameters at planes dominated by shear loading parameters, axial loading parameters or a combination of both types of parameters [29,30]. The general procedure for implementing a critical plane model consists of three steps: (i) finding the critical plane φ*, along the cycle; (ii) quantifying the damage by the so-called damage parameter; and (iii) estimating the fatigue life with function depending on the damage parameter.
The critical plane is defined as the plane where a certain variable or the model damage parameter reaches its maximum value. Some implementations of the critical plane models assume that the critical plane is where one stress or strain component is at its maximum. Such a component can be the shear strain range [13,31], the shear stress range [32,33], the normal stress range [34] or the normal strain range [16]. Nevertheless, recent works tend to consider the plane where the maximum value of a damage combination is achieved [18,35,36]. The damage parameter often includes two of the above components. In this work, we have used the critical plane as it was defined by its authors.
3.1. Sandip-Kallmeyer-Smith Model (SKS)
The SKS critical plane damage parameter was initially proposed by Suman, Kallmeyer and Smith [23]. The SKS damage parameter is defined on the critical plane using the maximum shear strain range Δγ as:
where G is the shear modulus, Δγ is the shear strain range, τmax is the maximum shear stress, (στ)max is the maximum shear and tensile stress product value, σo is a factor used to maintain unit consistency, w and k are material fitting parameters.
The strain hardening effect that takes place in the LCF regime is taken into account by Δγ and τmax. The mean shear stress effect in the high cycle fatigue (HCF) regime is also taken into account by the shear ratio τmin/τmax. At the HCF regime, plastic strain is reduced, thereby the damage parameter could be rearranged as is shown in Equation (2). The parameter w weights the hardening and mean shear stress effect. The product (στ)max introduces the detrimental effect over fatigue life observed when sub-cycle load peaks are applied simultaneously. The parameter k gauges the interaction effect between the shear and the normal stresses.
Although some experiments have shown that mean shear stresses have a limited damaging effect for values of τmax below the shear yield stress [7], it really depends on the material under study [37]. Nevertheless, its effect is lower than the effect of mean normal stress. For mild-steels such as the S355-J2G3 studied in the present work, Sines observed a low effect of the mean shear stress [7]. The SKS critical plane was developed for assessing the multiaxial fatigue crack behaviour. No information was found regarding the usefulness of the SKS model for notched geometries.
An effective damage parameter should be able to collapse into a single curve all the experimental data with minimum scatter. The following expression used a double exponential law to relate the damage parameter with fatigue life Nf [3,23]:
where A, b, C, and d are material dependent parameters and Nf is the fatigue life in cycles. In order to analyse the effectiveness of the SKS damage parameter, it is compared to other well-established models, relating them with the same type of curve (Equation (3)), obtaining all the material parameter for the best fitting. The parameters are evaluated with an optimisation process based on a least square error minimisation [3] (Equation (4)). This reduces the error between the experimental damage parameter (DPexp), which defines the stress state on the critical plane and the calculated damage parameter (DPcalc) based on the mean life curve (Equation (3)). The initial values for the parameters are set to be close to the material properties defined on each model. For SKS, DPcalc exponent parameters are set to keep the negative exponential curve growth.
The SKS damage parameter is assessed based on the fatigue life prediction capacity, by fitting the 6 parameters required to fully define a model with Equations (1) and (3). The model works by predicting the fatigue life based on experimental fatigue data obtained under multiaxial conditions. If the experimental data employed for fitting the variables are not enough and/or have poor quality, the predictions are expected to be poor.
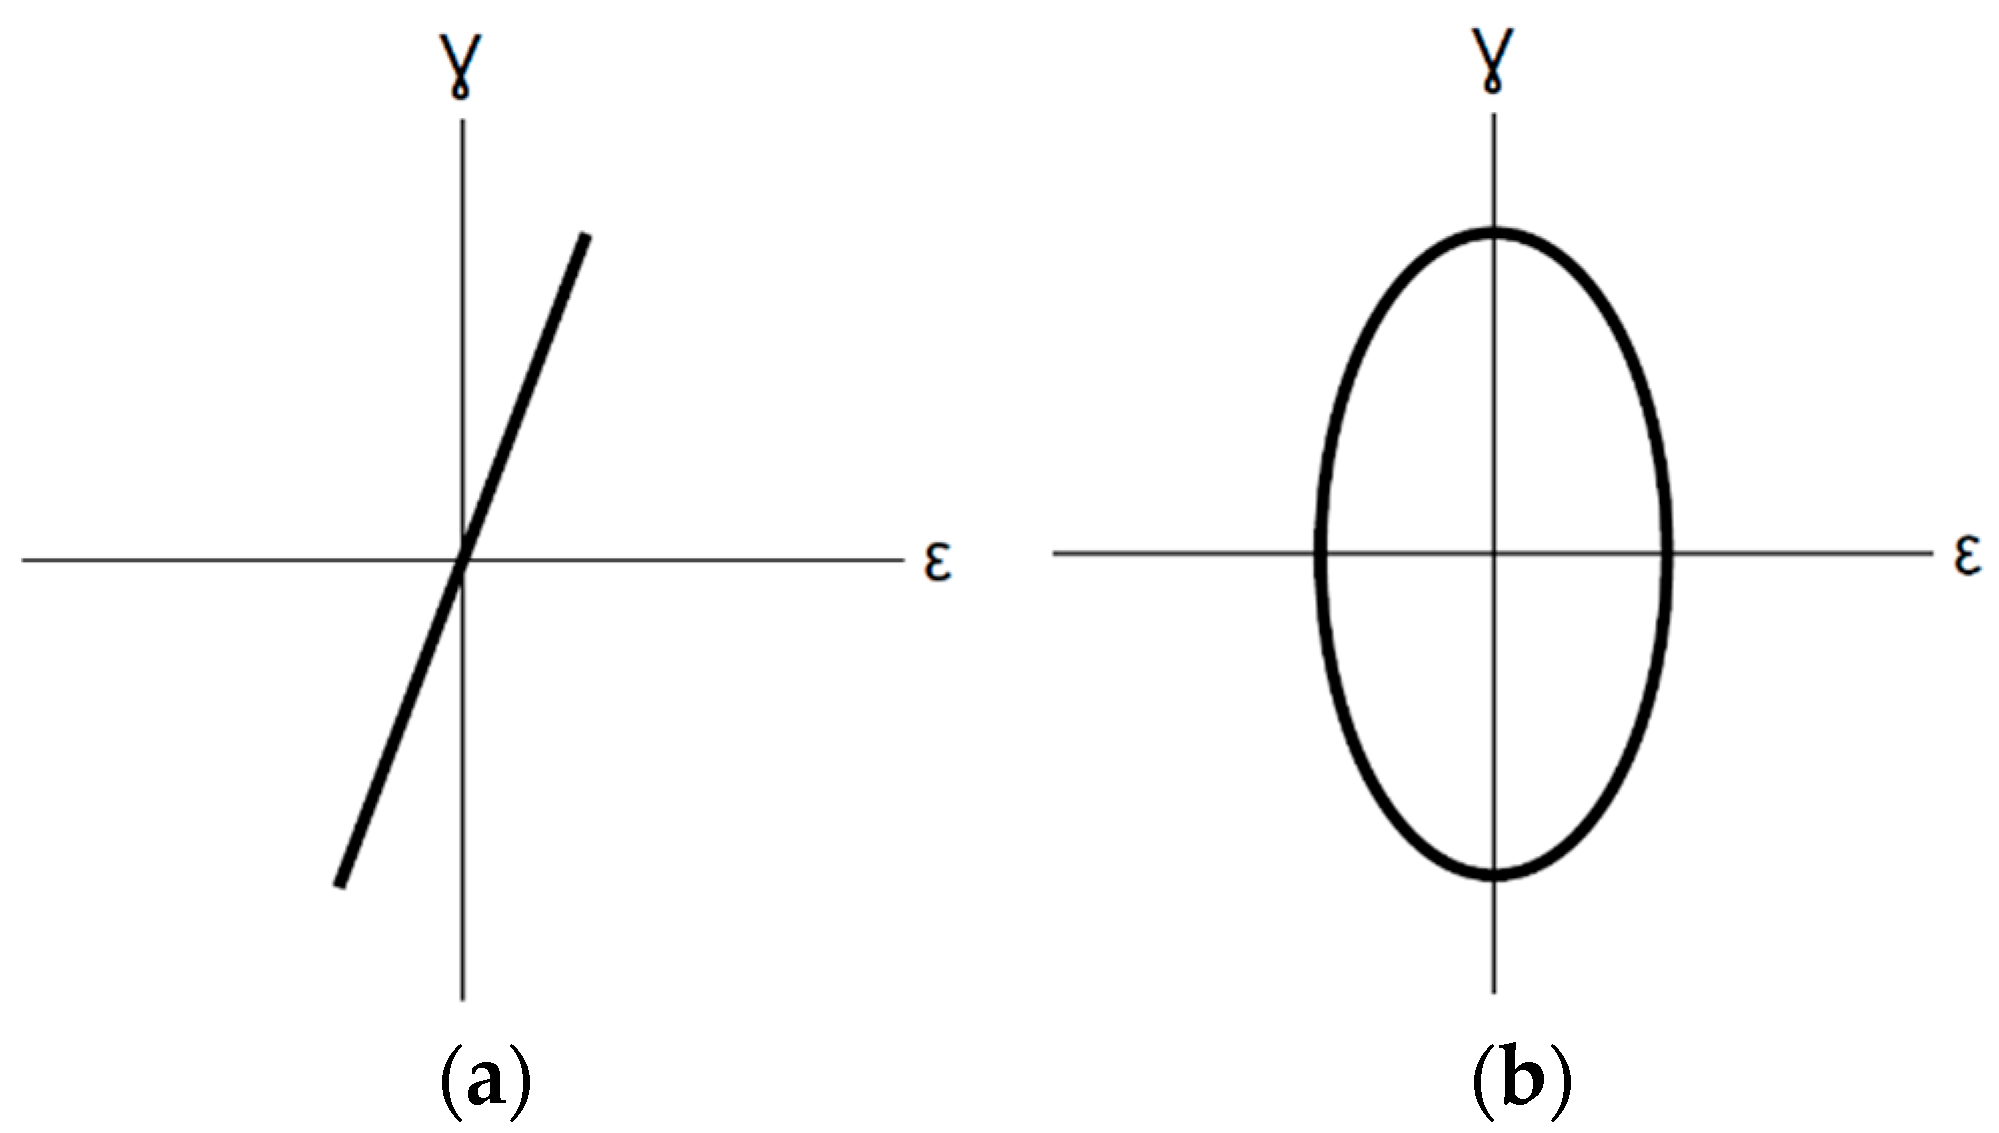
The material parameters are fitted using the information provided by different experiments conducted both in-phase and 90° out-of-phase (Table 5). Two different loading paths were used, and these are illustrated in Figure 2. The parameters of the SKS model were fitted using the tests shown in Table 5. Since the number of parameters required in the SKS model is six, a total of six multiaxial tests were used to obtain their values. Tests combine three different levels of normal strain for a constant shear strain and three levels of shear strain for a constant normal strain, between LCF and HCF regime [38]. The same number of tests with proportional and non-proportional loadings was used in order to avoid a polarised fit of the model. The parameters are fitted to minimise the fatigue life error rather than the error in the damage parameter.
The following values were obtained for the parameters: w = −0.35, k = 3.25, σo = 500, A = 193.1, b = −0.0687, c = 205.04 and d = −0.0682. The negative value of w increases the weight of τmax over Δγ. This is also in accordance with the material hardening behaviour, i.e., for a fixed shear stress amplitude, the shear strains decrease and for a fixed shear strain amplitude, the shear stresses will increase. Both cases will produce an increase in the damage. The positive value for k produces a negative effect over the fatigue life as this product increases and the magnitude is related to the value defined by σo.
3.2. Wang-Brown Model (WB)
The Wang-Brown model (Equation (5)) is a strain-type model. The damage parameter is defined on the plane φ* with the maximum shear strain range Δγ [15]. Both shear and normal strains in the critical plane φ* are taken into account in the damage parameter. Wang and Brown argued that the cyclic shear strain promotes crack nucleation and that the crack growth is a consequence of normal strain.
where Δγmax/2 is the maximum shear strain amplitude, Δεn is the range of normal strain, νe and νp are the Poisson’s ratios in the elastic and plastic regimes, respectively, E is the Young modulus, σ′f is the fatigue strength coefficient, b is the fatigue strength exponent, ε′f is the fatigue ductility coefficient and c is the fatigue ductility exponent, σn,mean is the mean normal stress at half fatigue life. S parameter defines the material sensitivity to the normal strain in the crack growth and can be estimated from the fatigue life, Nf, (Equation (6)).
where G is the shear modulus and τ′f is the shear fatigue strength coefficient, bγ is the shear fatigue strength exponent, γ′f is the shear fatigue ductility coefficient and cγ is the shear fatigue ductility exponent.
3.3. Fatemi-Socie Model (FS)
The Fatemi-Socie model (Equation (7)) is a strain type model [13], based on the model proposed by Brown and Miller [39]. They suggested substituting the normal strain component by a normal stress component. The damage parameter is defined on the plane φ* that maximises the shear strain range, Δγ.
where Δγmax/2 is the maximum shear strain amplitude, σn,max is the maximum tensile stress at φ*, σy is the yield stress, G is the shear modulus, τ′f is the shear fatigue strength coefficient, bγ is the shear fatigue strength exponent, γ′f is the shear fatigue ductility coefficient and cγ is the shear fatigue ductility exponent. K parameter can be estimated from the fatigue life, Nf, (Equation (8)).
where νe and νp are the Poisson’s ration in the elastic and plastic regimes, respectively, E is the Young modulus, σ′f is the fatigue strength coefficient, b is the fatigue strength exponent, ε′f is the fatigue ductility coefficient, c is the fatigue ductility exponent and σ′y is the cyclic yield stress.
3.4. Liu I and Liu II Models
Liu I (Equations (9) and (10)) and Liu II (Equations (11) and (12)) are energy type models [14]. Depending on the failure mode, Liu presents two parameters, one for a normal tension failure, ΔWI, and another one for shear tension failure, ΔWII. In this way, Liu models can also take into account whether the failure is ductile or brittle. Shear stresses and strains will normally show a higher weight for ductile materiales and normal stresses and strains will normally show a higher weight for brittle materials [14,40]. For normal tension failure, the plane φ* will be the one that maximises the axial work, ΔWI (Equation (9)). For shear tension failure, the plane φ* will be the one that maximises the shear work, ΔWII (Equation (11)). Once φ* is determined, the damage parameter is obtained as the sum of both the axial work and the shear work. The relation between the Liu damage parameters and the fatigue life, Nf, is given by Equations (10) and (12), respectively.
where Δσn is the normal stress range, Δεn is the normal strain range, Δτ is the shear stress range and Δγ is the shear strain range.
where σ′f is the fatigue strength coefficient, b is the fatigue strength exponent, ε′f is the fatigue ductility coefficient, c is the fatigue ductility exponent and E is the Young modulus.
where τ′f is the shear fatigue strength coefficient, bγ is the shear fatigue strength exponent γ′f is the shear fatigue ductility coefficient, cγ is the shear fatigue ductility exponent and G is the shear modulus.
4. Results and Discussion
Seventeen multiaxial tests were used in order to assess the SKS model. The key parameters of these tests are summarised in Table 6, with increasing fatigue life. The tests are classified into sinusoidal normal-shear strain with total in-phase inversion (Figure 2a), and 90° out-of-phase (Figure 2b). Strain amplitudes εa and γa were chosen based on previous results to obtain a number of cycles to failure in the range 104 to 106, so that both LCF and HCF regimes are evaluated. All tests employed in the evaluation are described in Table 6. Table 6 includes the following information of each test: axial εa and shear γa amplitudes; stress amplitudes σa and τa calculated from the axial and torsion load measured at half-life; and the total life obtained, Nexp, in number of cycles. A clear hardening effect can be observed between the tests with the same amplitude strains when the loads are applied out-of-phase (tests 10 to 17).
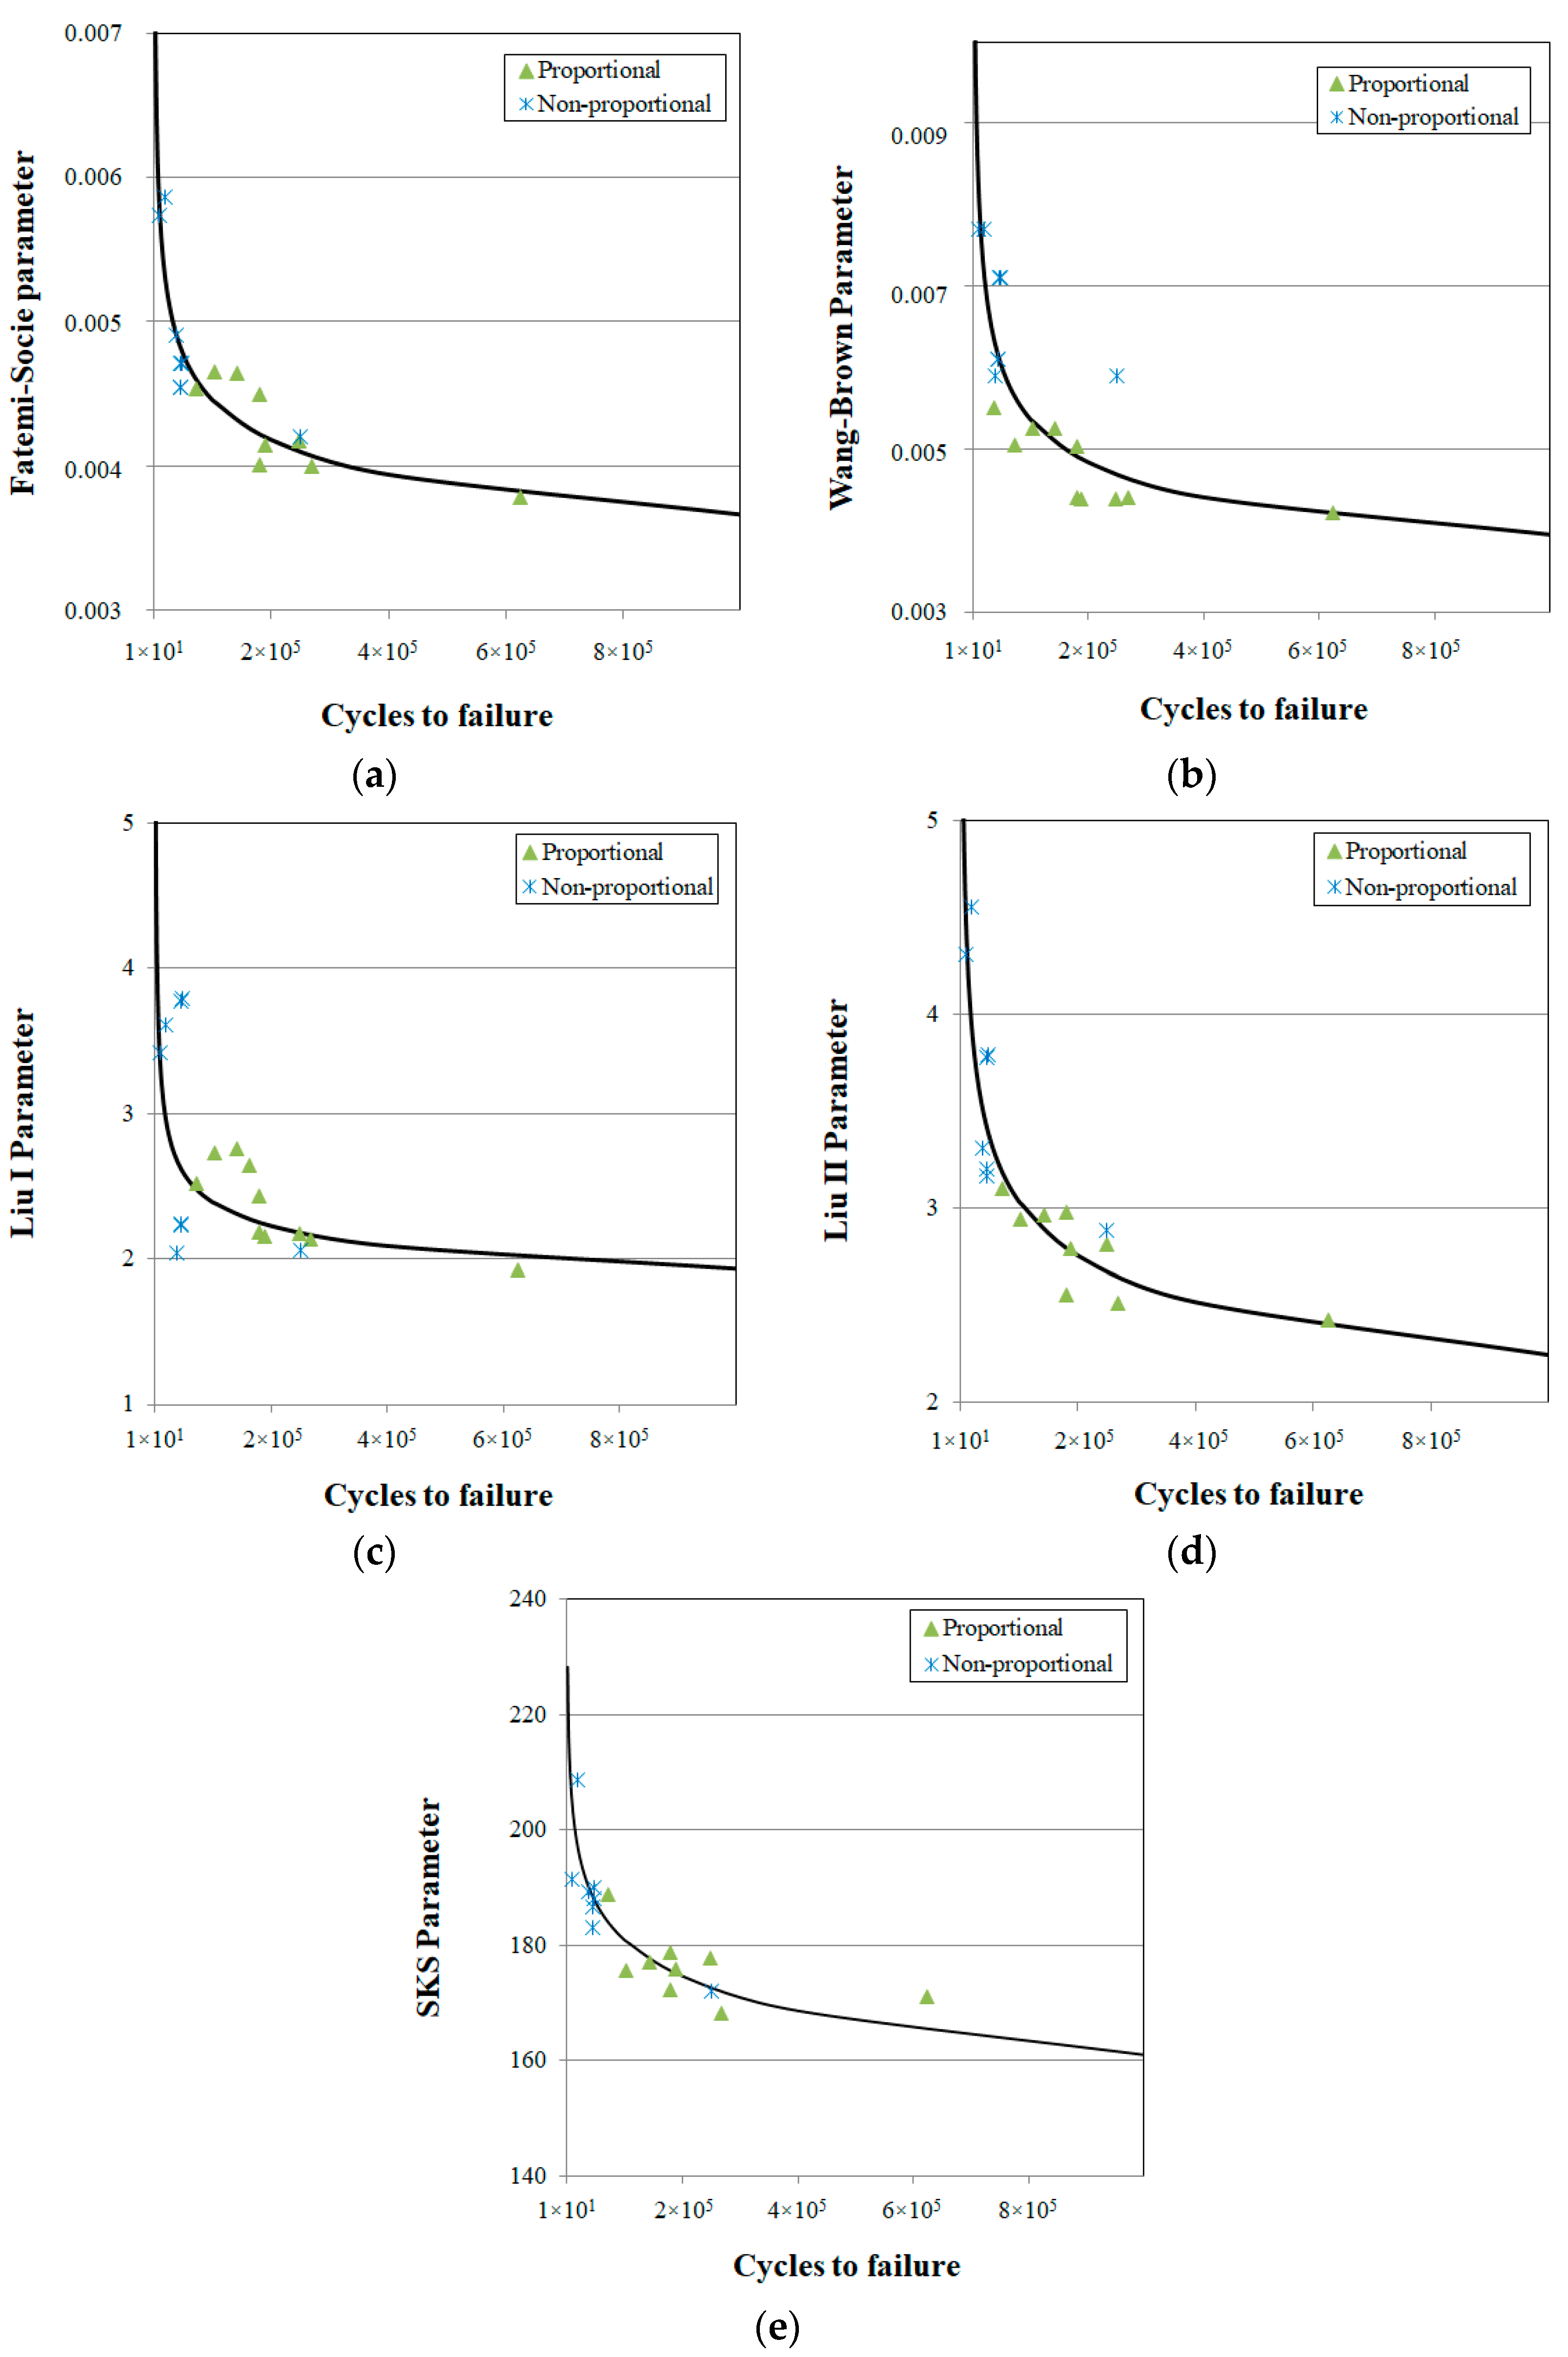
Figure 3 shows the correlation obtained for each damage parameter with the curve defined in Equation (3) for DPcalc. The experimental data obtained under proportional load appear as green triangles and the data obtained under non-proportional load appear in Figure 3 as blue asterisks. Each point is defined with the experimental fatigue life Nexp and the experimental damage parameter DPexp obtain from the experimental stresses and strain for each model. The experimental data that fall above the calculated damage parameter curve are considered conservative. The collapse ability is studied with the sum of relative error, as defined in Equation (4). Table 7 summarises the relative error obtained for each model. Table 7 indicates that the best correlation is obtained by SKS and FS models, followed by Liu II. It is worth noting that the damage parameter defined in Equation (11) does not include any material dependent parameter. Figure 3b shows that one of the non-proportional tests shifts the WB curve upwards, thus increasing the total error. Finally, Liu I (Figure 3c) shows the worst result, with a larger deviation in the LFC regime. The better collapse capacity of the SKS damage parameter is probably due to the additional number of material parameters that improve the model’s adaptability to different loading conditions.
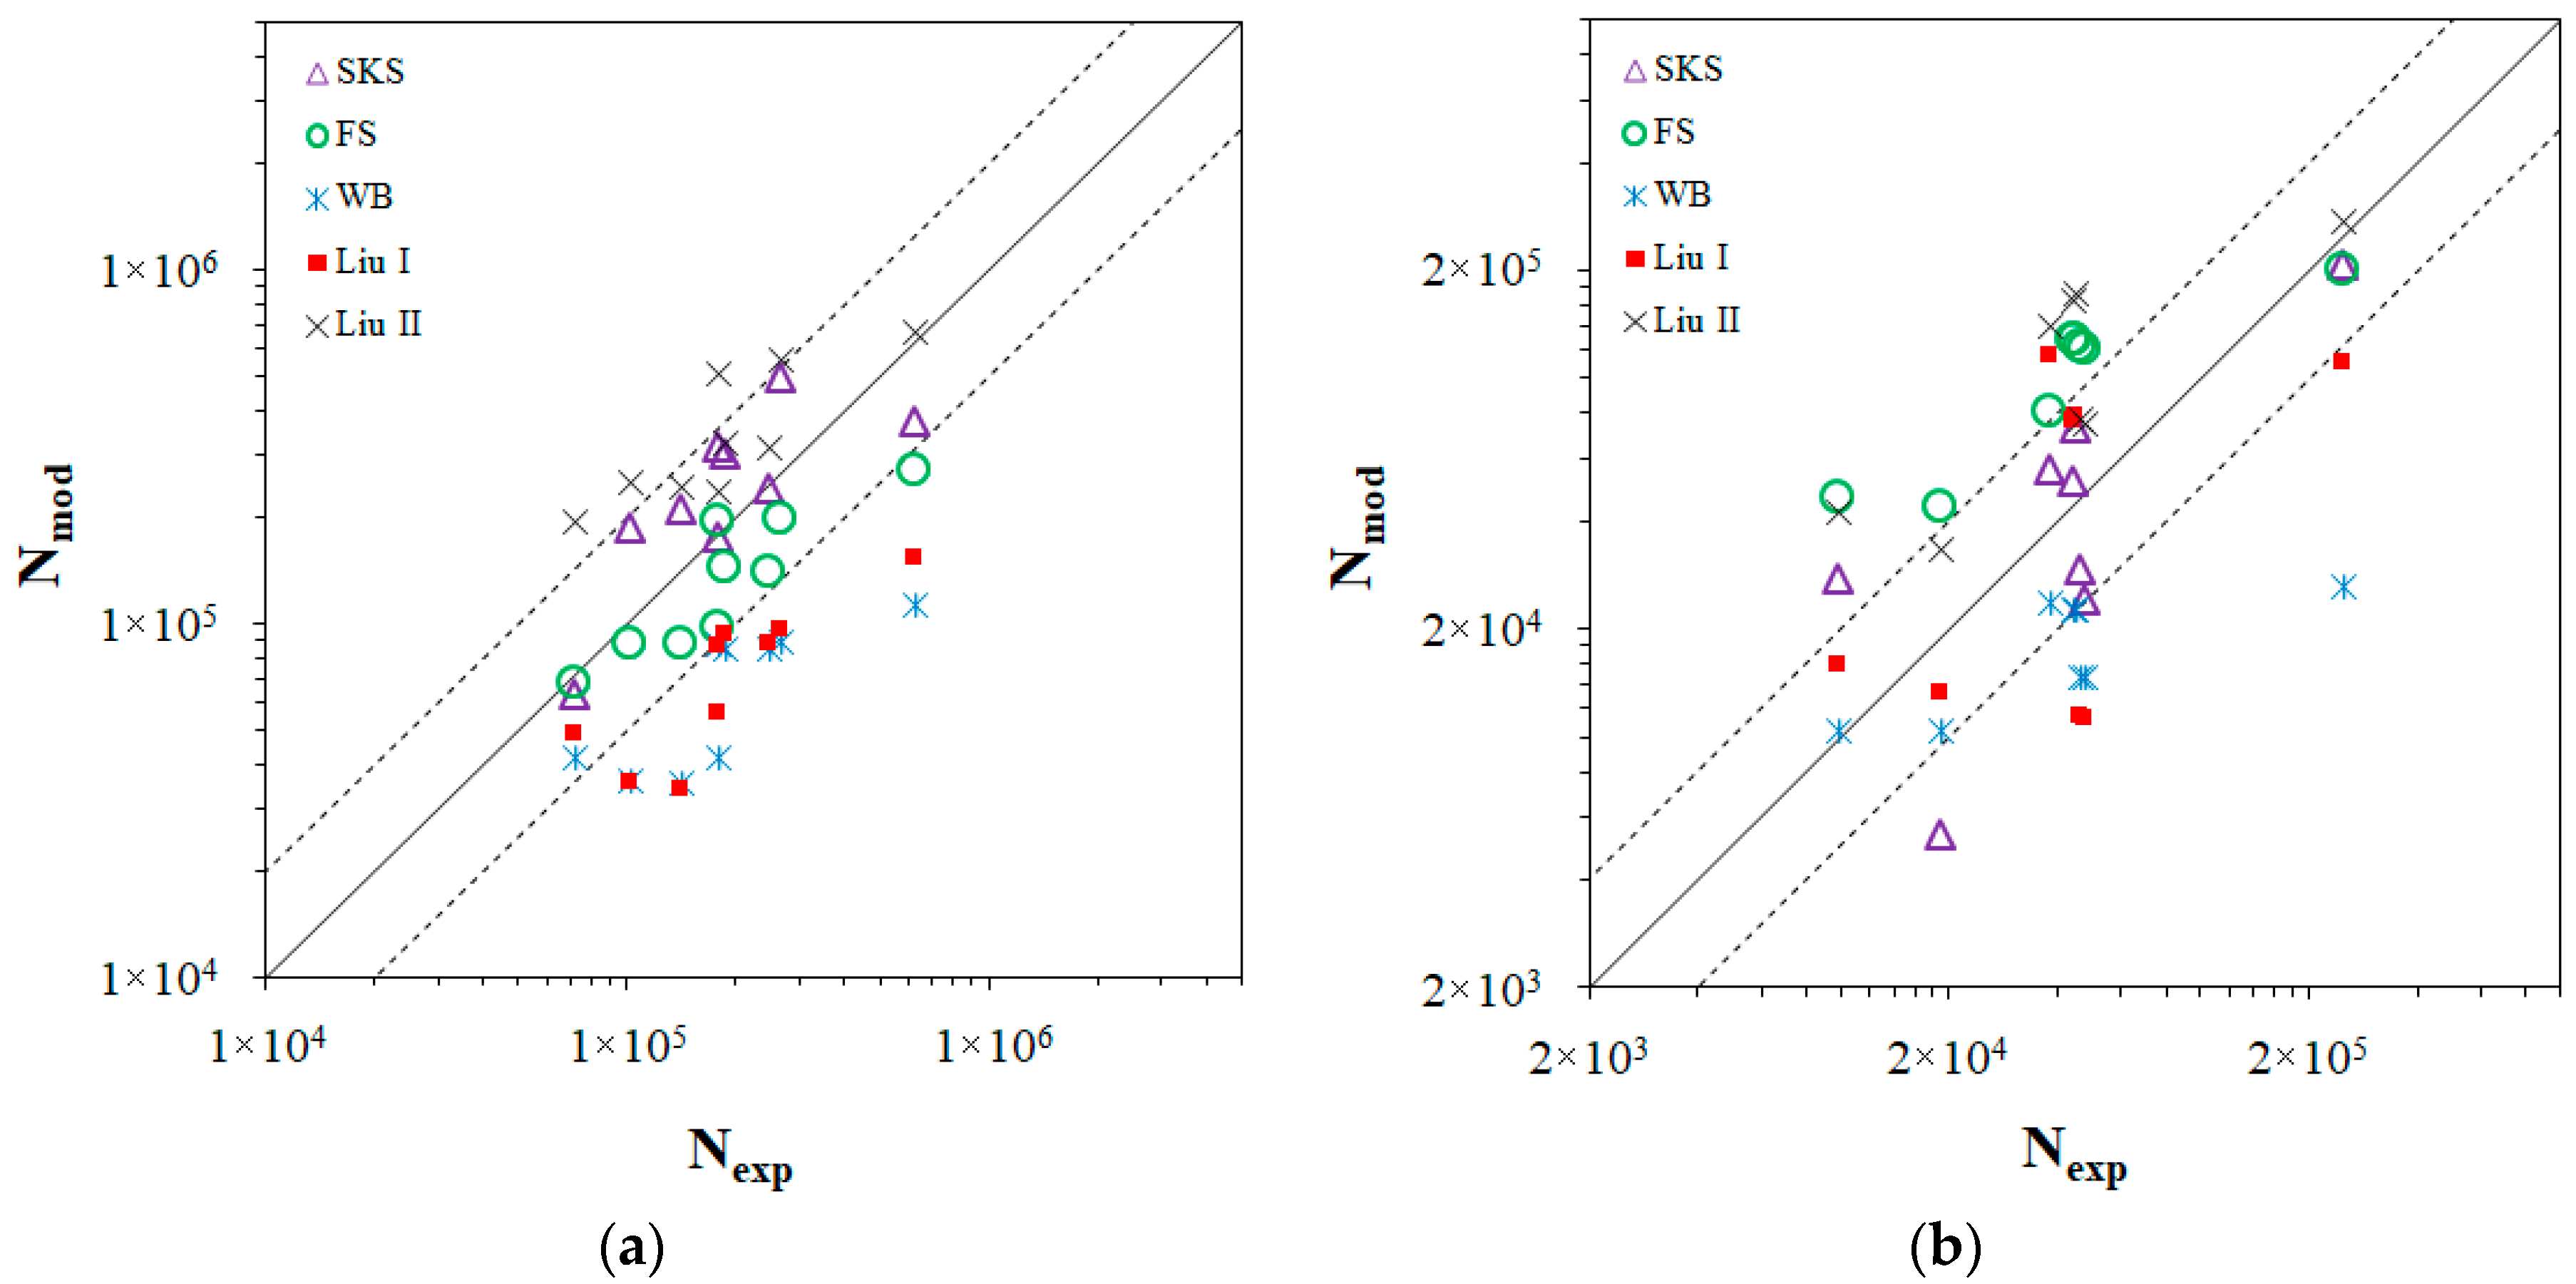
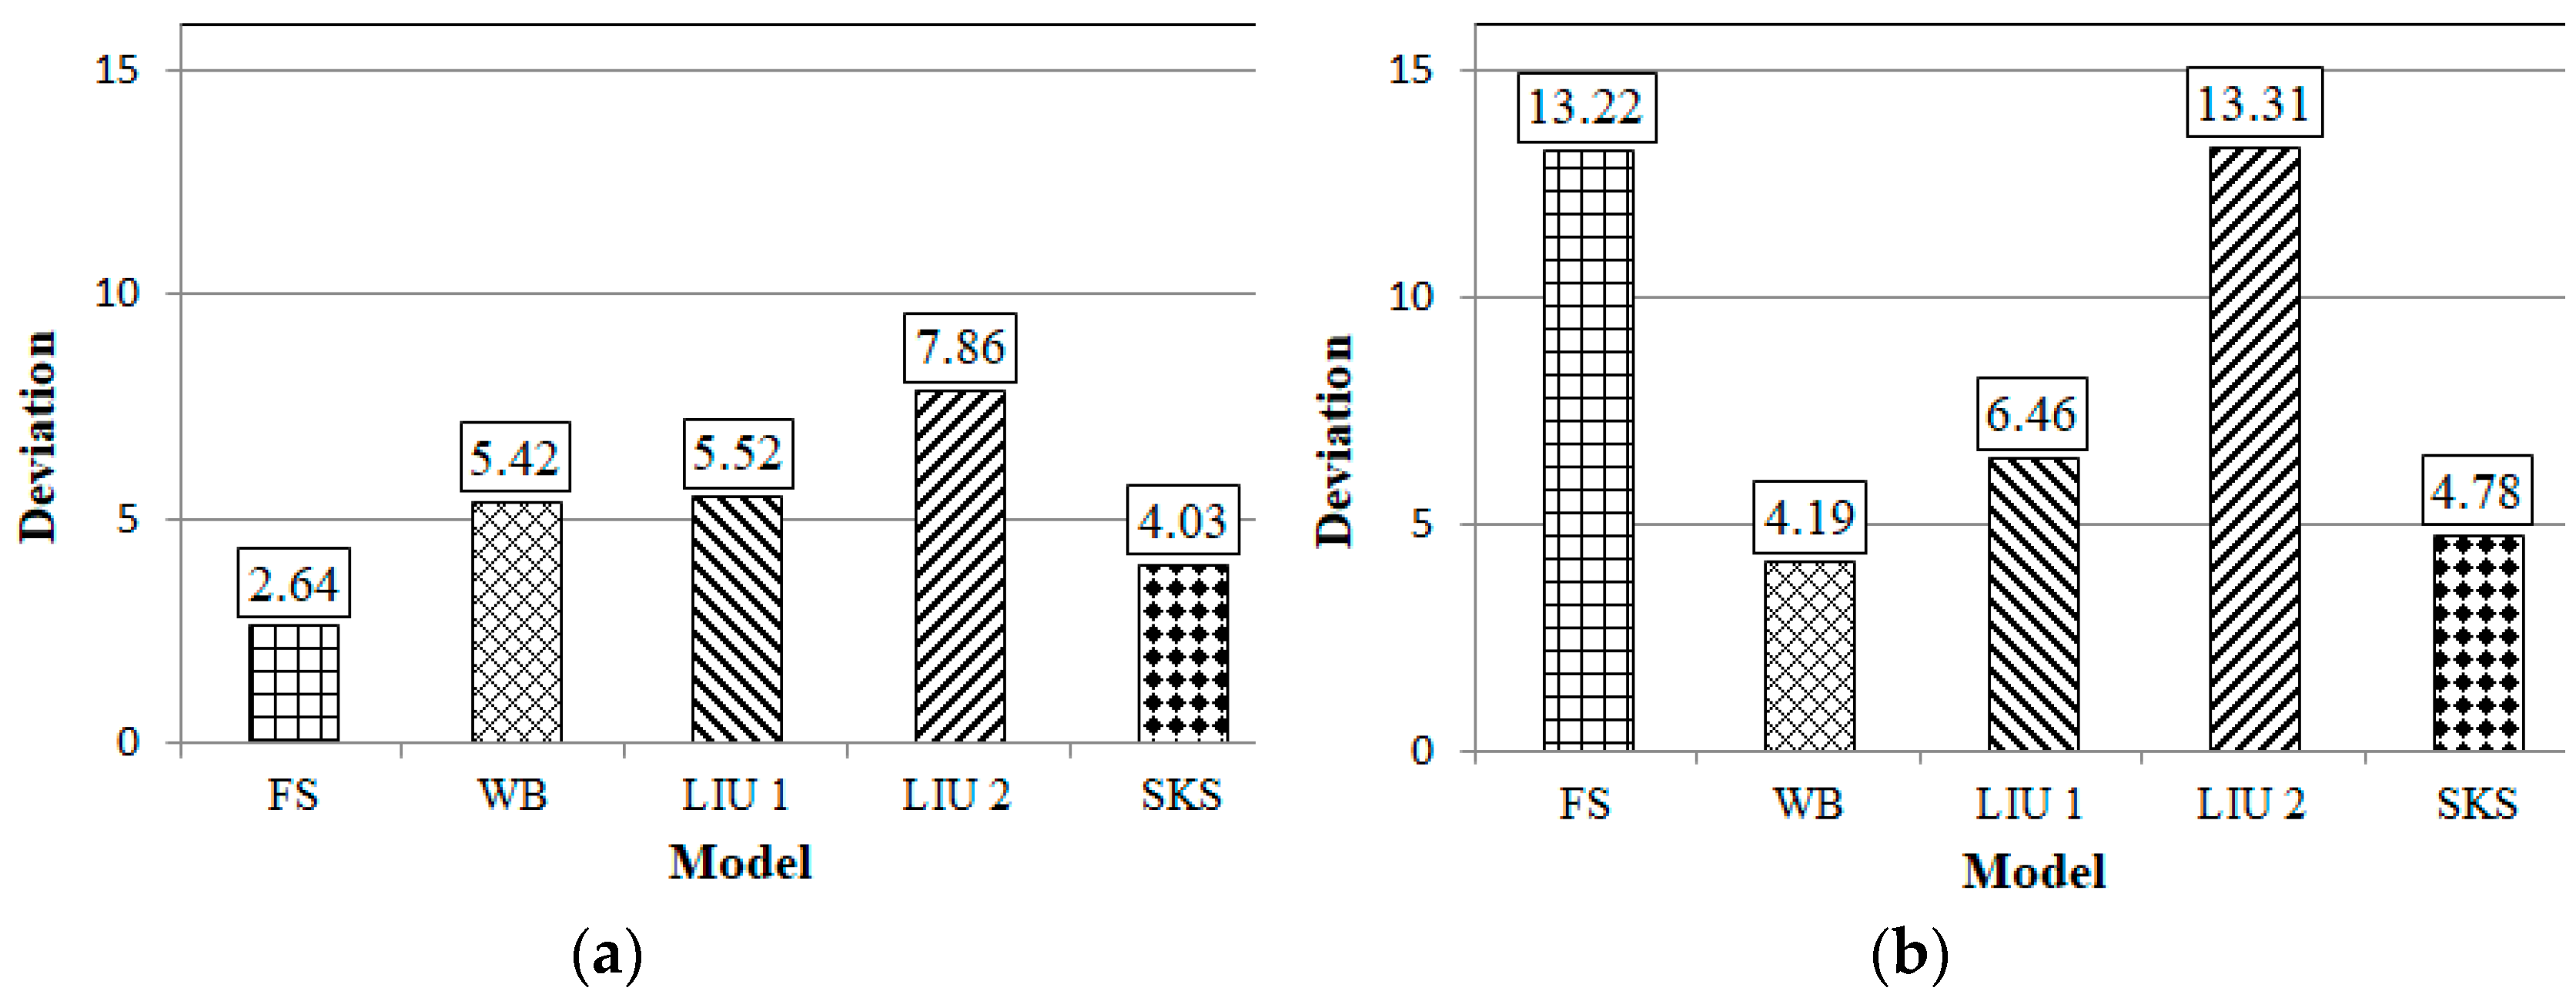
Figure 4 shows the life estimation for each model under in-phase (a) and out-of-phase (b) loading. The points falling right on the solid line have a perfect coincidence between the experimental fatigue life (Nexp) and the calculated fatigue life by each model (Nmod). The dashed lines indicate the twice (100%) and half (−50%) deviation from the calculated life with respect to the experimental life. The estimation of SKS is shown with purple triangles, FS with green circles, WB with blue asterisks, Liu I with red squares, and Liu II with black crosses. Figure 5 shows the sum of the relative fatigue life deviation for each model, for in phase (a) and out-of-phase (b) loading.
For in-phase loading, Figure 4a, SKS gives a good estimation, with values on the non-conservative side for most tests. This is probably caused by an underestimation of k value, because k parameter controls the shear and normal stress interaction. FS returns better predictions than SKS as can be seen on the sum of deviation shown on Figure 5a, with a conservative tendency with increasing fatigue life. Both WB and Liu I show similar results, mostly on the conservative side. Equations (5) and (9) indicate that WB and Liu I models increase the weight of Δε on the damage parameter. Equation (11) indicates the opposite behaviour in Liu II model, where the influence of the normal energy is smaller than for the Liu I model.
A comparison between Figure 4a,b indicate that out-of-phase loading shifts upwards the majority of the predictions given by all the models, thus making the predictions more on the non-conservative side. Figure 5 shows that the deviation results get worst for non-proportional loading (Figure 5b) as compared to proportional loading (Figure 5a) for all models with the exception of WB. A comparison between Figure 4a,b shows that the scatter increases for SKS model as a consequence of the non-proportionality of the loads. This is numerically confirmed by the 19% increment in the deviation, from Figure 5a to Figure 5b in the SKS values. Nevertheless, this increment is very similar to the increment exhibited by the Liu I model (17%), and much smaller than the increment displayed by the FS and Liu II models. It was found that the FS model yields better results by using a constant k value of 1, as recommended by Socie [22] instead of evaluating k according to Equation (8). WB results remain in the conservative side and predicted life present the lower sum of life deviation. Liu I shows a higher scatter with low fatigue life deviation. FS shows a better collapse capacity for some of the results compared to the SKS model (see Table 6, experiments 13 to 16). Table 6 shows that small variations are introduced in τa, unlike in γa. For the SKS fitted parameter, the compensation of Δγ effect over the damage parameter is accounted for by (στ)max factor only, and not (στ)max or τmax. Taking into account that the 90° shift between torsional and axial loads induces a very high level of hardening [41], if the shift between loads was smaller, the fatigue predictions would most likely improve. Hence, the results show that SKS model could be competitive both for proportional and non-proportional by fitting good quality experimental data. The results also indicate that the SKS model produces better estimations under in-phase loading than under out-of-phase loading, where a larger scattering of the data was observed.
5. Conclusions
The SKS critical plane damage parameter has been assessed on a S355 steel for in-phase and out-of-phase loadings. The SKS damage parameter has been compared to other established models, namely Fatemi-Socie, Wang-Brown, Liu I and Liu II. The results indicate that overall the collapse capacity of the SKS damage parameter appears to be better than that of the other models for the cases studied. The SKS damage parameter produces overall good predictions both under proportional and under non-proportional combinations of tension, compression and torsion loads. Among the different critical plane models evaluated, SKS produced the second-best results for both types of biaxial loads. The SKS model also showed good consistency in being able to adapt to different load scenarios. In a similar way to the other models, the quality of the data used for fitting the model parameters is crucial. One of the strengths of the SKS models is the simplicity of data fitting for evaluating the model parameters. The authors are currently working on testing the SKS model on other metals and different loading conditions.
Author Contributions
P.L.-C. and B.M. designed the experiments and reviewed the results; A.S.C. and F.V.A. analysed the data; B.M. performed the experiments; A.S.C. and P.L.-C. wrote the paper; P.L.-C., B.M. and F.V.A. reviewed the manuscript.
Funding
This research and the APC was funded by Ministerio de Economia y Competitividad (Spain) through grant reference MAT2016-76951-C2-2-P.
Acknowledgments
The authors would like to thank Jaime Dominguez from University of Seville (Spain) for interesting discussions and suggestions. Industrial support from Sandip Suman and UTC Aerospace Systems (CA, USA) is acknowledged.
Conflicts of Interest
The authors declare no conflict of interest.
References
- Fatemi, A.; Kurath, P. Multiaxial fatigue life predictions under the influence of mean-stresses. J. Eng. Mater. Technol. 1988, 110, 380–388. [Google Scholar] [CrossRef]
- Itoh, T.; Sakane, M.; Ohnami, M.; Socie, D.F. Nonproportional low-cycle fatigue criterion for type 304 stainless steel. J. Eng. Mater. Technol. ASME 1995, 117, 285–292. [Google Scholar] [CrossRef]
- Erickson, M.; Kallmeyer, A.R.; Van Stone, R.H.; Kurath, P. Development of a multiaxial fatigue damage model for high strength alloys using a critical plane methodology. J. Eng. Mater. Technol. 2008, 130, 0410081–0410089. [Google Scholar] [CrossRef]
- Branco, R.; Costa, J.; Antunes, F. Fatigue behaviour and life prediction of lateral notched round bars under bending-torsion loading. Eng. Fract. Mech. 2014, 119, 66–84. [Google Scholar] [CrossRef]
- Gough, H.J. Engineering steels under combined cyclic and static stresses. J. Appl. Mech. 1950, 50, 113–125. [Google Scholar] [CrossRef]
- Gough, H.J. The strength of metals under combined alternating stress. Proc. Inst. Mech. Eng. 1935, 131, 3–103. [Google Scholar] [CrossRef]
- Sines, G. Failure of Materials under Combined Repeated Stresses with Superimposed Static Stresses; National Advisory Committee for Aeronautics: Washington, DC, USA, 1955.
- Sines, G. Behavior of Metals under Complex Static and Alternating Stresses; McGraw-Hill: New York, NY, USA, 1959. [Google Scholar]
- Garud, Y. A new approach to the evaluation of fatigue under multiaxial loadings. J. Eng. Mater. Technol. ASME 1981, 103, 118–125. [Google Scholar] [CrossRef]
- Ellyin, F.; Kujawski, D. Plastic strain energy in fatigue failure. J. Press. Vessel Technol. 1984, 106, 342–347. [Google Scholar] [CrossRef]
- Macha, E.; Sonsino, C.M. Energy criteria of multiaxial fatigue failure. Fatigue Fract. Eng. Mater. Struct. 1999, 22, 1053–1070. [Google Scholar] [CrossRef]
- Park, J.; Nelson, D. Evaluation of an energy-based approche and a critical plane approche for predicting constant amplitude multiaxial fatigue life. Int. J. Fatigue 2000, 22, 23–39. [Google Scholar] [CrossRef]
- Fatemi, A.; Socie, D.F. A critical plane approach to multiaxial fatigue damage including out-of-phase loading. Fatigue Fract. Eng. Mater. Struct. 1988, 11, 149–165. [Google Scholar] [CrossRef]
- Liu, K.C.; Wang, J.A. An energy method for predicting fatigue life, crack orientation, and crack growth under multiaxial loading conditions. Int. J. Fatigue 2001, 23, 129–134. [Google Scholar] [CrossRef]
- Wang, H.; Brown, W. A path-independent parameter for fatigue under proportional and non-proportional loading. Fatigue Fract. Eng. Mater. Struct. 1993, 16, 1285–1298. [Google Scholar] [CrossRef]
- Smith, Kn.; Topper, T.H.; Watson, P. A stress-strain function for the fatigue of metals(Stress-strain function for metal fatigue including mean stress effect). J. Mater. 1970, 5, 767–778. [Google Scholar]
- Chen, X.; Gao, Q.; Sun, X.F. Damage analysis of low-cycle fatigue under non-proportional loading. Int. J. Fatigue 1994, 16, 221–225. [Google Scholar] [CrossRef]
- Chu, C. Multiaxial fatigue life prediction method in the ground vehicle industry. Int. J. Fatigue 1997, 19, 325–330. [Google Scholar] [CrossRef]
- Kim, K.S.; Park, J.C. Shear strain based multiaxial fatigue parameters applied to variable amplitude loading. Int. J. Fatigue 2000, 21, 475–483. [Google Scholar] [CrossRef]
- MSC Fatigue. Available online: http://www.mscsoftware.com/product/msc-fatigue (accessed on September 2018).
- Comsol. Available online: https://www.comsol.com/fatigue-module (accessed on September 2018).
- Socie, D.F.; Marquis, G.B. Multiaxial Fatigue; Society of Automotive Engineers, Inc.: Warrendale, PA, USA, 2000. [Google Scholar]
- Suman, S.; Kallmeyer, A.; Smith, J. Development of a multiaxial fatigue damage parameter and life prediction methodology for non-proportional loading. Frattura ed Integrità Strutturale 2016, 10, 224–230. [Google Scholar]
- Chaves, V. Ecological criteria for the selection of materials in fatigue. Fatigue Fract. Eng. Mater. Struct. 2014, 37, 1034–1042. [Google Scholar] [CrossRef]
- ASTM. Standard Test Method for Measurement of Fatigue Crack Growth Rates; ASTM E739; ASTM International: West Conshohocken, PA, USA, 2003. [Google Scholar]
- Lopez-Crespo, P.; Moreno, B.; Lopez-Moreno, A.; Zapatero, J. Study of crack orientation and fatigue life prediction in biaxial fatigue with critical plane models. Eng. Fract. Mech. 2015, 136, 115–130. [Google Scholar] [CrossRef]
- Lopez-Crespo, P.; Garcia-Gonzalez, A.; Moreno, B.; Lopez-Moreno, A.; Zapatero, J. Some observations on short fatigue cracks under biaxial fatigue. Theor. Appl. Fract. Mech. 2015, 80, 96–103. [Google Scholar] [CrossRef]
- Roessle, M.L.; Fatemi, A. Strain-controlled fatigue properties of steels and some simple approximations. Int. J. Fatigue 2000, 22, 495–511. [Google Scholar] [CrossRef]
- Ellyin, F.; Golos, K.; Xia, Z. In-phase and out-of-phase multiaxial fatigue. J. Eng. Mater. Technol. 1991, 113, 112–118. [Google Scholar] [CrossRef]
- Karolczuk, A.; Macha, E. A review of critical plane orientations in multiaxial fatigue failure criteria of metallic materials. Int. J. Fract. 2005, 134, 267–304. [Google Scholar] [CrossRef]
- Kanazawa, K.; Miller, K.J.; Brown, M.W. Low-Cycle Fatigue under Out-of-Phase Loading Conditions. J. Eng. Mater. Technol. 1977, 99, 222–228. [Google Scholar] [CrossRef]
- Stulen, F.; Cumming, H. A failure criterion for multi-axial fatigue stresses. ASTM 1954, 52, 822–835. [Google Scholar]
- Findley, W.N.; Coleman, J.J.; Hanley, B.C. Theory for combined bending and torsion fatigue with data SAE 4340 steel. In Proceedings of the International Conference on Fatigue of Metals, London, UK, 10–14 September 1956; pp. 138–149. [Google Scholar]
- Forsyth, P. A two-stage process of fatigue crack growth. In Symposium on Crack Propagation; The College of Aeronautics: Cranfield, UK, 1961; pp. 76–94. [Google Scholar]
- Anes, V.; Reis, L.; Li, B.; Freitas, M. Crack path evaluation on HC and BCC microstructures under multiaxial cyclic loading. Int. J. Fatigue 2014, 58, 102–113. [Google Scholar] [CrossRef]
- Shang, D.-G.; Wang, D. A new multiaxial fatigue damage model based on the critical plane approach. Int. J. Fatigue 1998, 20, 241–245. [Google Scholar]
- Findley, W.N. Combined Stress Fatigue Strength of 76S-T61 Aluminum Alloy with Superimposed Mean Stresses and Corrections for Yielding; National Aeronautics and Space Administration: Washington, DC, USA, 1953.
- Suresh, S. Fatigue of Materials; Cambridge University Press: Cambridge, UK, 2004. [Google Scholar]
- Brown, M.W.; Miller, K.J. A theory for fatigue failure under multiaxial stress-strain conditions. Proc. Inst. Mech. Eng. 1973, 187, 745–755. [Google Scholar] [CrossRef]
- Reis, L.; Freitas, M.J. Crack initiation and growth path under multiaxial fatigue loading in structural steels. Int. J. Fatigue 2009, 31, 1660–1668. [Google Scholar] [CrossRef]
- Kanazawa, K.; Miller, K.J.; Brown, M.W. Cyclic deformation of 1% Cr-Mo-V steel under out-of-phase loads. Fatigue Fract. Eng. Mater. Struct. 1979, 2, 217–228. [Google Scholar] [CrossRef]
Figure 1.
Geometry of the specimen. All dimensions are in mm.

Figure 2.
Schematic of the loading paths studied. In-phase (a) and out-of-phase load path (b).

Figure 3.
Correlation of S355-J2G3 fatigue data with (a) FS, (b) WB, (c) Liu I, (d) Liu II and (e) SKS damage parameters.
Figure 3.
Correlation of S355-J2G3 fatigue data with (a) FS, (b) WB, (c) Liu I, (d) Liu II and (e) SKS damage parameters.

Figure 4.
Fatigue life predicted by each model, Nmod, versus experimental fatigue life, Nexp, for in-phase loading (a) and out-of-phase loading (b).
Figure 4.
Fatigue life predicted by each model, Nmod, versus experimental fatigue life, Nexp, for in-phase loading (a) and out-of-phase loading (b).

Figure 5.
Fatigue life deviation for in-phase loading (a) and out-of-phase loading (b) for the five different critical plane models under study.
Figure 5.
Fatigue life deviation for in-phase loading (a) and out-of-phase loading (b) for the five different critical plane models under study.


Table 1.
Chemical composition (%).
| C | Mn | Si | P | S | Al | Cr | Ni | Mo |
|---|---|---|---|---|---|---|---|---|
| 0.17 | 1.235 | 0.225 | 0.01 | 0.0006 | 0.032 | 0.072 | 0.058 | 0.016 |
Table 2.
Monotonic properties of S355-J2G3 steel.
| Property | Value |
|---|---|
| Yield strength, σy | 386 MPa |
| Ultimate strength, σu | 639 MPa |
| Young’s Modulus, E | 206 GPa |
| Shear Modulus, G | 78 GPa |
| Critical buckling stress, σcr | 348 MPa |
Table 3.
Uniaxial properties of S355-J2G3 steel.
| Property | Value |
|---|---|
| Cyclic strength coefficient, K′ | 630.6 MPa |
| Cyclic hardening exponent, n′ | 0.10850 |
| Cyclic yield strength, σ′y | 321.3 MPa |
| Fatigue strength coefficient, σ′f | 564.4 MPa |
| Fatigue strength exponent, b | −0.0576 |
| Fatigue ductility coefficient, ε′f | 0.1554 |
| Fatigue ductility exponent, c | −0.4658 |
Table 4.
Torsional properties of S355-J2G3 steel.
| Property | Value |
|---|---|
| Cyclic torsional strength coefficient, K′γ | 593.8 MPa |
| Cyclic torsional hardening exponent, n′γ | 0.1553 |
| Cyclic torsional yield strength, τ′γ | 594.2 MPa |
| Fatigue torsional strength coefficient, τ′f | 486.9 MPa |
| Fatigue torsional strength exponent, bγ | −0.0668 |
| Fatigue torsional ductility coefficient, γ′f | 0.0662 |
| Fatigue torsional ductility exponent, cγ | −0.3191 |
Table 5.
Summary of the six experimental data used to fit the six parameters included in the SKS model.
Table 5.
Summary of the six experimental data used to fit the six parameters included in the SKS model.
| Path | ID | εa | γa | σa | τa | Nf |
|---|---|---|---|---|---|---|
| a | F-1 | 0.0015 | 0.0026 | 238 | 148 | 162119 |
| F-2 | 0.0011 | 0.0026 | 185 | 154 | 662706 | |
| F-3 | 0.0009 | 0.0026 | 152 | 162 | 870886 | |
| b | F-4 | 0.0009 | 0.0032 | 189 | 203 | 65674 |
| F-5 | 0.0009 | 0.0028 | 190 | 192 | 158248 | |
| F-6 | 0.0009 | 0.0026 | 189 | 182 | 248540 |
Table 6.
S355-J2G3 Fatigue experimental data.
| Path | ID | εa | γa | σa | τa | Nexp |
|---|---|---|---|---|---|---|
| a | 1 | 0.0011 | 0.0032 | 180 | 185 | 72011 |
| 2 | 0.0015 | 0.0028 | 234 | 151 | 103138 | |
| 3 | 0.0015 | 0.0028 | 238 | 151 | 141938 | |
| 4 | 0.0011 | 0.0028 | 183 | 165 | 179446 | |
| 5 | 0.0011 | 0.0032 | 177 | 176 | 179628 | |
| 6 | 0.0009 | 0.0032 | 143 | 183 | 188219 | |
| 7 | 0.0009 | 0.0032 | 146 | 184 | 248009 | |
| 8 | 0.0011 | 0.0028 | 178 | 163 | 268051 | |
| 9 | 0.0009 | 0.0028 | 151 | 172 | 624521 | |
| b | 10 | 0.0015 | 0.0032 | 291 | 200 | 9838 |
| 11 | 0.0015 | 0.0032 | 305 | 213 | 19078 | |
| 12 | 0.0009 | 0.0032 | 195 | 204 | 38376 | |
| 13 | 0.0011 | 0.0028 | 229 | 196 | 44319 | |
| 14 | 0.0011 | 0.0028 | 229 | 193 | 44800 | |
| 15 | 0.0015 | 0.0026 | 298 | 192 | 46196 | |
| 16 | 0.0015 | 0.0026 | 298 | 193 | 47996 | |
| 17 | 0.0011 | 0.0026 | 226 | 182 | 249996 |
Table 7.
Summary of the relative error between DPexp and DPcalc for each model.
| Model | FS | WB | Liu I | Liu II | SKS |
|---|---|---|---|---|---|
| In-phase test error | 0.01469 | 0.05385 | 0.07246 | 0.02077 | 0.00475 |
| Out-of-phase test error | 0.01817 | 0.09774 | 0.39104 | 0.06065 | 0.00824 |
| Total error | 0.03287 | 0.15159 | 0.46351 | 0.08142 | 0.01300 |
© 2018 by the authors. Licensee MDPI, Basel, Switzerland. This article is an open access article distributed under the terms and conditions of the Creative Commons Attribution (CC BY) license (http://creativecommons.org/licenses/by/4.0/).
Share and Cite
MDPI and ACS Style
Cruces, A.S.; Lopez-Crespo, P.; Moreno, B.; Antunes, F.V. Multiaxial Fatigue Life Prediction on S355 Structural and Offshore Steel Using the SKS Critical Plane Model. Metals 2018, 8, 1060. https://doi.org/10.3390/met8121060
AMA Style
Cruces AS, Lopez-Crespo P, Moreno B, Antunes FV. Multiaxial Fatigue Life Prediction on S355 Structural and Offshore Steel Using the SKS Critical Plane Model. Metals. 2018; 8(12):1060. https://doi.org/10.3390/met8121060
Chicago/Turabian StyleCruces, Alejandro S., Pablo Lopez-Crespo, Belen Moreno, and Fernando V. Antunes. 2018. "Multiaxial Fatigue Life Prediction on S355 Structural and Offshore Steel Using the SKS Critical Plane Model" Metals 8, no. 12: 1060. https://doi.org/10.3390/met8121060
Note that from the first issue of 2016, this journal uses article numbers instead of page numbers. See further details here.