Multi-Material Design in Welding Arc Additive Manufacturing


Institute of Welding and Machining, Clausthal University of Technology, D-38678 Clausthal, Germany
*
Author to whom correspondence should be addressed.
Metals 2019, 9(7), 809; https://doi.org/10.3390/met9070809
Submission received: 28 June 2019
/
Revised: 16 July 2019
/
Accepted: 19 July 2019
/
Published: 22 July 2019
(This article belongs to the Special Issue Arc-based Additive Manufacturing)
Abstract
:Due to the inherent properties of the process, arc-based generative manufacturing offers the possibility, of specifically applying different material properties locally. One possibility to realize this is the use of different materials. Three approaches are presented to illustrate this option. First, anisotropic behavior in the welding direction is generated. For this purpose, a FeNi36 is specifically combined with a low-alloy ultra-high-strength fine-grained structural steel filler metal. It will be shown that the integral component properties can be specifically adjusted in the welding direction. In addition, the metallurgical and welding characteristics will be discussed. As a second possibility, the use of well plasticizable materials to locally increase the material strength under cyclic loading with locally notched components is presented. For this purpose, an austenitic FeNi36 with good plasticizability and a good yield strength ratio for the application was applied to a fillet weld of a high-strength fine-grained structural steel in the weld seam toe. It is shown that the tolerable cyclic load can be improved by 35% by this procedure. Thirdly, it is shown that the required thickness of corrosion protection layers can be reduced by 50% through a targeted production sequence in arc-based generative manufacturing.
1. Introduction
The increasing importance of resource-efficient handling of raw materials is driving development to design components more efficiently. As a result, manufacturing processes are being changed and the trend is moving towards 3D printing processes, [1,2,3,4,5]. By means of generative manufacturing processes, such as wire arc additive manufacturing (WAAM), a more efficient use of materials can be realized, [6]. In addition, in arc-based generative manufacturing, a wide variety of alloy systems can be used and combined by changing the necessary filler material. Thus, among other things, graded components made of different materials can be realized [7].
If this idea is extended to the targeted local application of different materials, a multimaterial design can also be realized. For this purpose, different materials are specifically combined with each other in order to adjust local mechanical properties to the anticipated load. In addition, to conventional alloying systems, novel material concepts such as high-entropy alloys are increasingly being used in additive manufacturing [8].
This development was made possible, among other things, by new welding process variants in the short arc range [9,10,11] developed in recent decades, as well as by findings regarding the importance of welding sequence and energy input on the shape accuracy and the mechanical properties occurring in the material, [12,13,14,15].
Objectives
The following work, presented in three steps, will show that the targeted use of different materials in additively manufactured components can provide clear advantages over conventionally manufactured components in terms of component properties. In addition, it will be shown that the manufacturing strategy can have a direct influence on the properties of additively manufactured components. First, it is shown that the mechanical properties can be adapted to the load direction by using strengthening volume fractions in a rather soft, easily deformable matrix. Secondly, it is shown that the local adaptation of the properties through the targeted use of other materials can also lead to an increase in strength under fatigue. The third part of the work illustrates the possibility of targeted control of dilution in additive manufacturing. Using the example of corrosion protection layers, it will be shown that the required thickness of corrosion protection layers can be significantly reduced by targeted control of the dilution by strategic planning of the welding sequence. The main goal is to provide a first glimpse of the possibility to realize multi material design in additive manufacturing for a load dependent adjustment of material properties in a load bearing component.
2. Property Modification Adapted to Load Direction
Due to the immanent process conditions, arc-based generative manufacturing offers the possibility of locally adjusting the material properties in a load dependent manner. To illustrate this, the following investigations on the production of load direction dependent modified generatively manufactured components are presented. In order to illustrate the multi material approach, two different iron based materials are combined with each other.
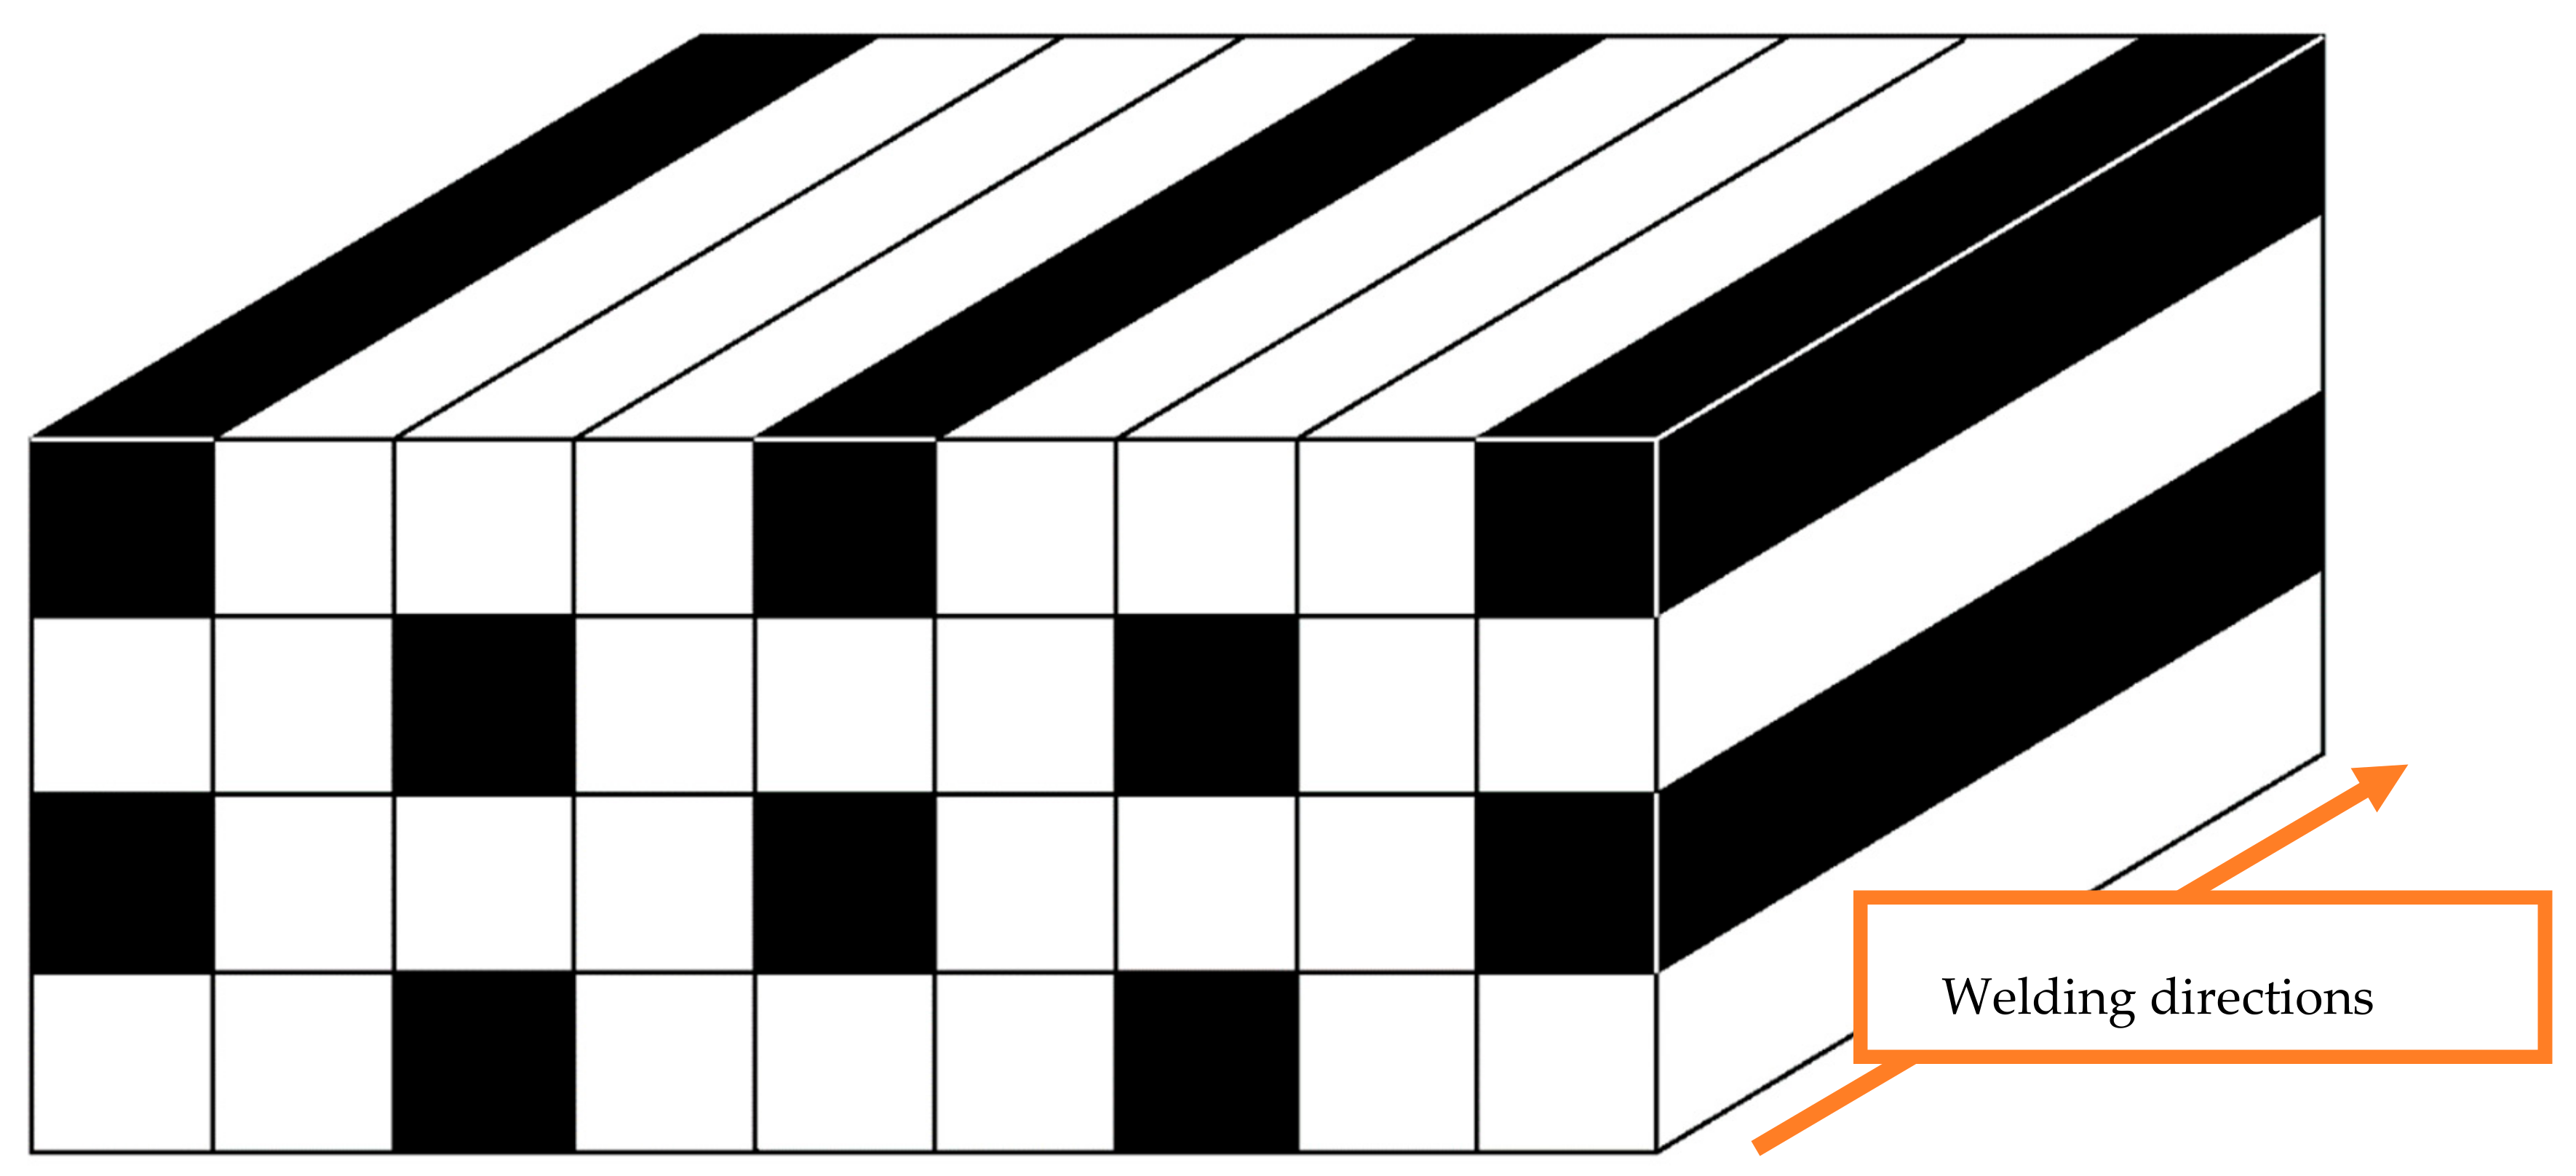
A FeNi36 filler is used as the matrix material. Due to special properties, it is expected that the residual stresses normally occurring in austenitic and ferritic compounds can be reduced due to the different coefficients of thermal expansion of the FeNi36 compared to other austenitic materials. The second material used is a filler for high-strength fine grained structural steels (DIN EN ISO 16834-A G 69 6 M21 Mn4Ni1, 5CrMo). The basic layer structure is shown in Figure 1. The soft matrix represents a proportion of the 75% of the specimen in which the solid material is embedded.
This section may be divided by subsections. It should provide a concise and precise description of the experimental results, their interpretation as well as the experimental conclusions that can be drawn. This pattern was chosen because there will be no interference between the high-strength regions, to have the same dilution in each high strength region.
2.1. Sample Preparation with Preferred Direction
Due to the different welding filler materials used, different welding parameters are required to produce the specimen with alternating beads. The parameters listed in Table 1 have shown a particularly good surface quality between the individual bead layers.
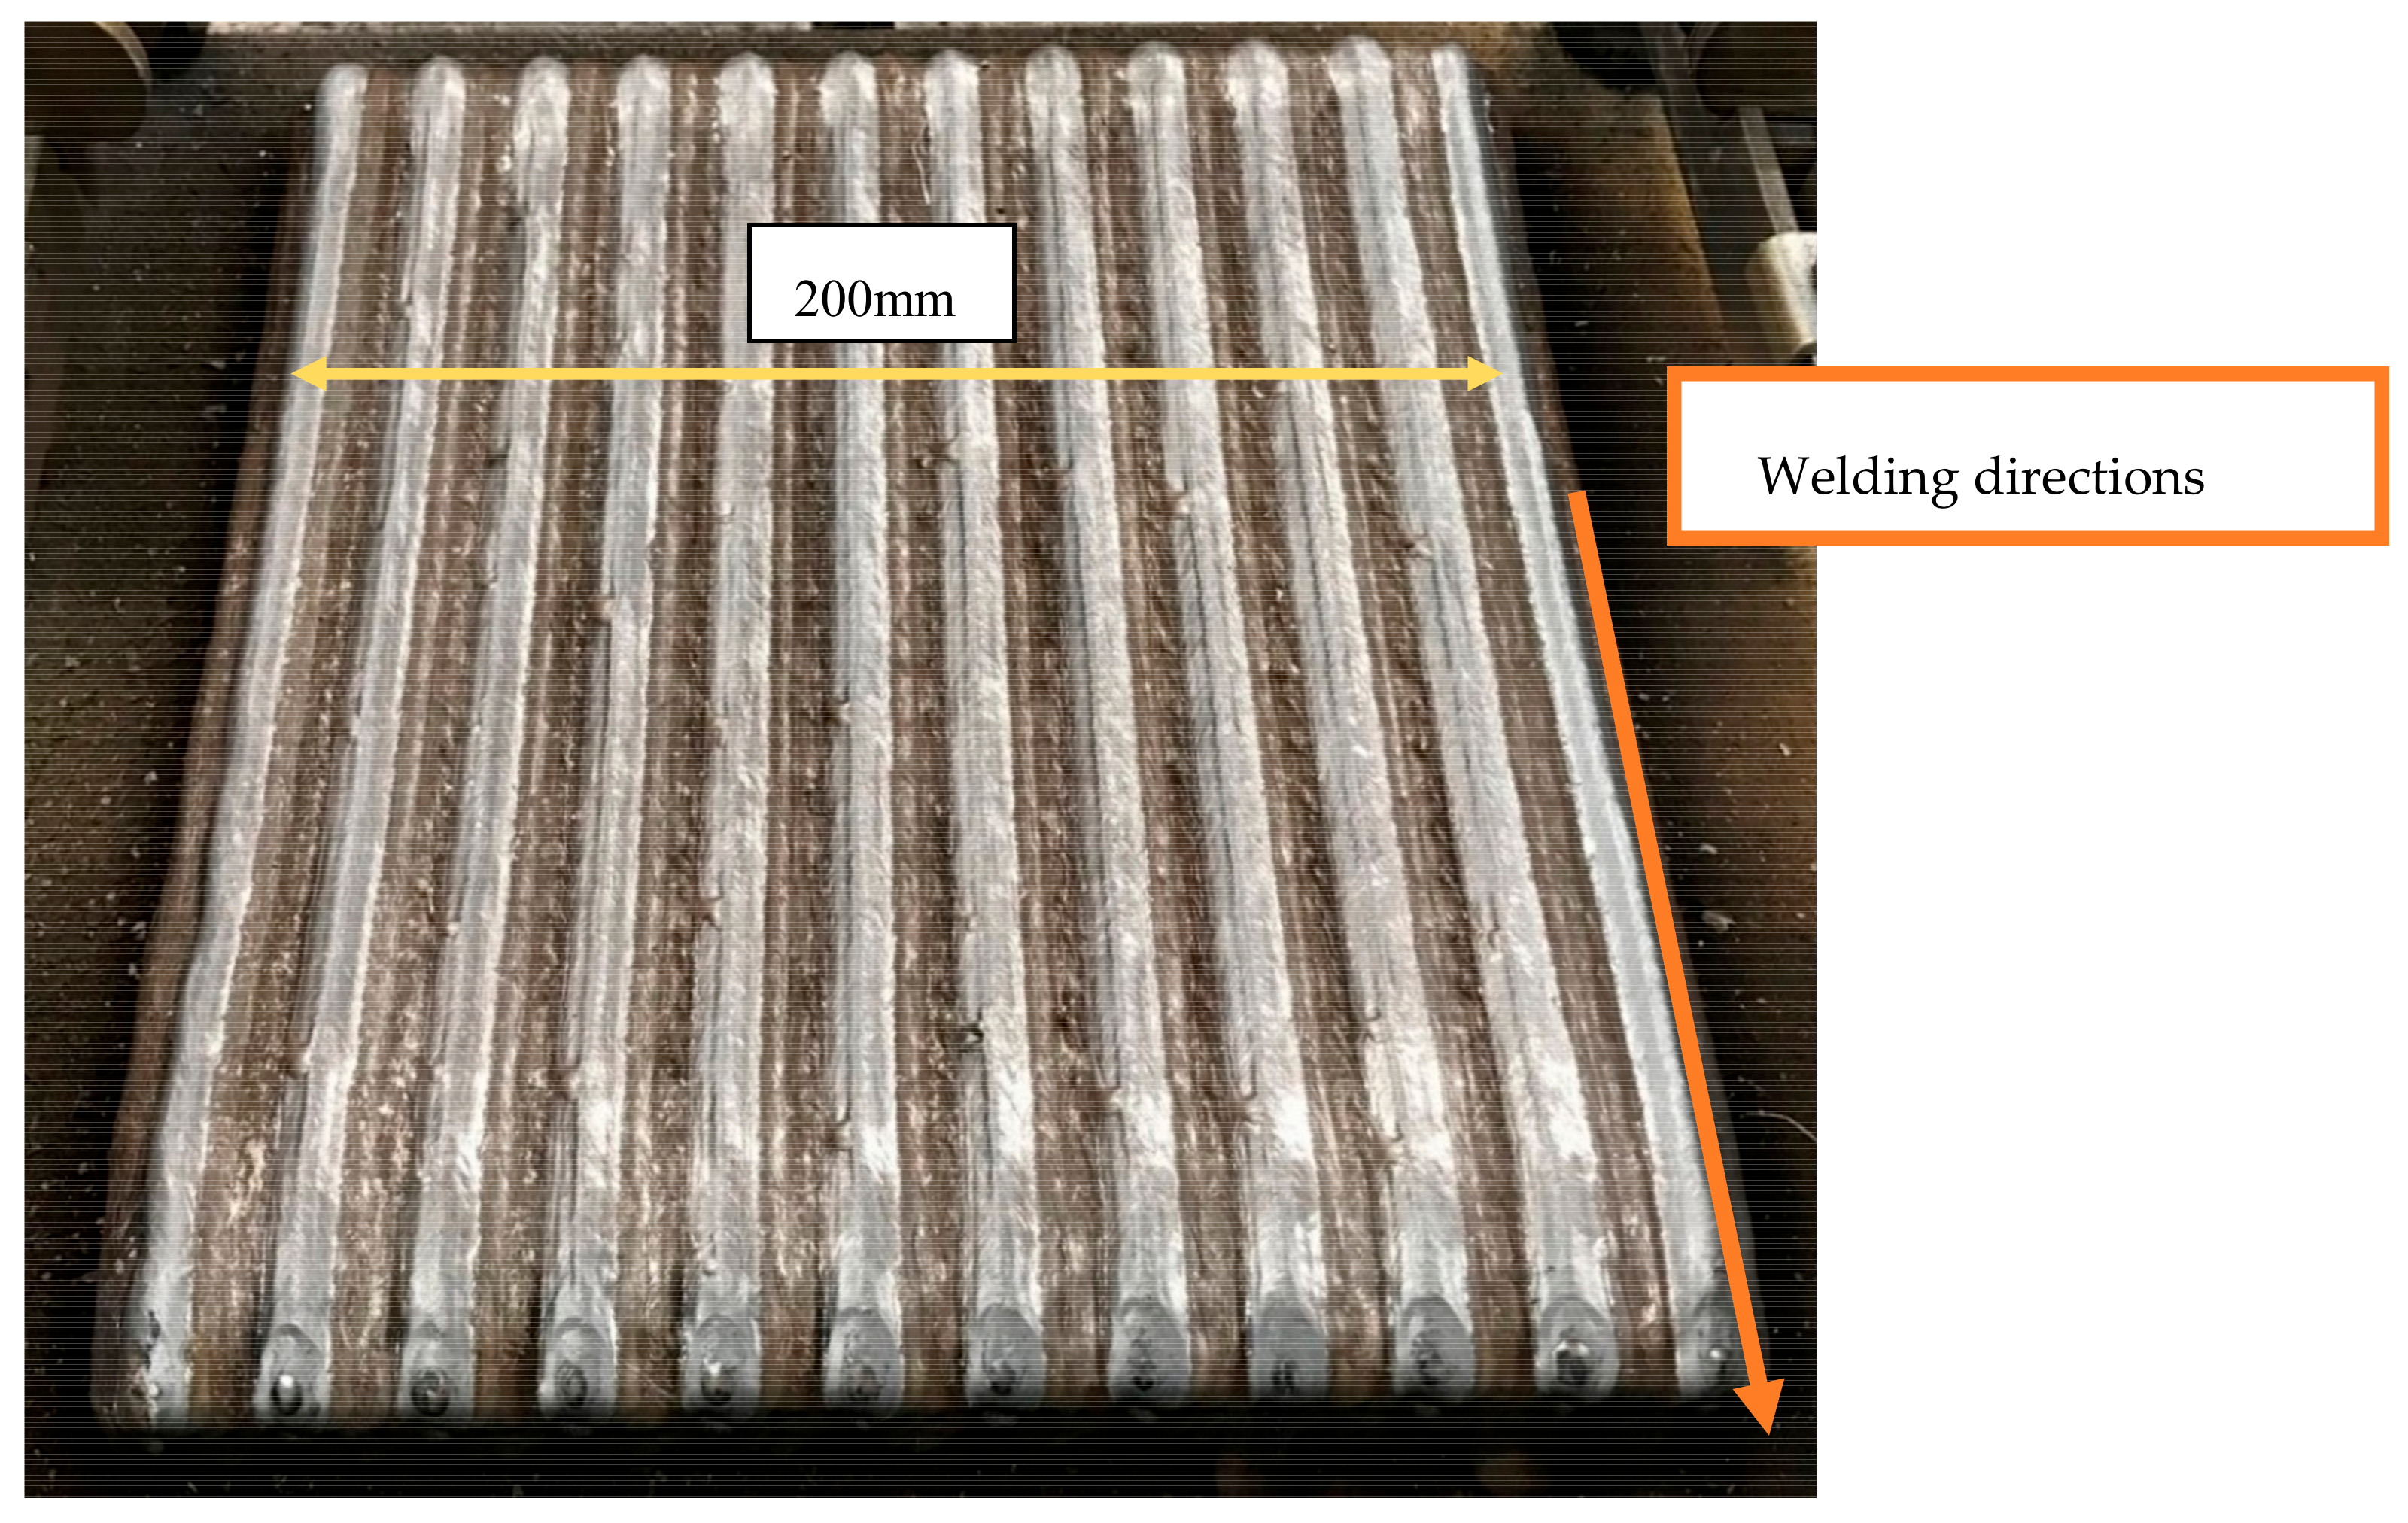
Three FeNi36 welding seams were alternately welded to one Mn4Ni1.5CrMo seam to produce the specimen. The welded test piece was built up ten layers upwards according to the schematic drawing in Figure 1. The welded specimen is shown in Figure 2.
To investigate the mechanical-technological properties of the multi-material design and a possible anisotropy, tensile samples were taken. These were manufactured in different orientations to the weld layers and then destructively tested in tensile tests.
The alignments were transverse upright to the welding direction, transverse flat to the welding direction and longitudinal upright the welding direction. These orientations are shown schematically in Figure 3. The different alignments were used to investigate whether an anisotropic behavior occurs and whether the multi-material design is realistic.
The proposed area fraction of the strengthening part was 25%, according to the pattern already shown. Due to different welding parameters and different wire diameters, as well as the process-related dilution, the desired proportion of reinforcement in the real test block does not result. In the real test component, the reinforcement took up 20% of the surface area in the cross section. The calculated value from wire feed speed and wire diameter of area fraction in the cross section was 29.25%. The missing of around 9% of the area fraction is due to dilution of the strengthening part into the FeNi36 at the top on each strengthening layer, as shown in Figure 4.
In addition, a micrograph and a specimen for hardness measurement were prepared from the welded test piece. Furthermore, the microstructures were analyzed. Figure 4 shows a micrographic cross section transverse to the welding direction. The different materials are clearly distinguishable. Furthermore, due to the different etching behavior, zones of different dilution in the low-alloy material can also be identified.
2.2. Results for the Anisotropic Strengthening
For the microstructure analysis cross sections were taken and grinded, polished and etched with Nital and V2A etchant. In a polished state, a hardness measurement according to Vickers HV10 was conducted. Furthermore tensile test specimens were cut out with a flat shape and tested according to DIN ISO 6892. The tensile specimen geometry was 40 mm × 15 mm × 5 mm in the parallel region of the specimens. The clamping area of the specimen was formed in accordance to DIN ISO 6892. This geometry was chosen, due to the limitation of the use tensile test bench towards 100kN and the consideration to have at least on strengthening part in very specimen.
Considering the microstructure in the cross section, the microstructural morphologies of the individual phases were examined in detail. A martensitic microstructure was present in the high-strength deposits. The soft matrix, on the other hand, consists entirely of austenite.
Figure 5a shows the transition from high strength deposition to soft matrix. This shows two microstructural morphologies which are separate from each other. Furthermore, no pores, cracks or inclusions are visible. Figure 5a shows that martensitic and austenitic microstructures can exist side by side without a pronounced interface region. In the top layer, a clear martensitic microstructure can be determined, as shown in Figure 5b. Two layers beneath the top layer a tempered martensite can be determined.
Looking at the overview of the hardness distribution in Figure 6, it can be clearly seen that the hardness of the soft FeNi36 matrix was homogeneously distributed. A drop in hardness can be found around the strengthening parts due to dilution. The high strength depositions are clearly visible in the hardness measurement. To evaluate the mechanical properties, the tensile strength of the welded specimen was determined. A possible anisotropy was detected by comparing the yield strength and tensile strength between the three different specimen orientations. The mechanical properties of the base materials are listed in Table 2 for illustration purposes.
Based on the mechanical properties of the base materials, the aim was to achieve an improvment in yield strength and tensile strength compared to FeNi36 and to approximate the yield strength and tensile strength of Mn4Ni1.5CrMo, while increasing ductility. However, welding errors cannot be excluded. These reduce the elongation at break under certain circumstances.
The mechanical properties of the weld specimens in Table 3 (mean value of three specimens) show that the yield strength as well as the tensile strength of the specimens was higher compared to FeNi36. Thus a supporting effect can be achieved with the high strength parts in the soft matrix. If the yield strengths are calculated according to the mixing rule using the phase fractions of FeNi36 and Mn4Ni1.5CrMo, the calculated yield strength is Rp0.2 = 412 N/mm2. This value was below the experimentally determined values of multimaterial design. The phase fraction of the Mn4Ni1.5CrMowas higher, especially in the case of the specimen on edge. This is where the yield strength is the highest. The calculated tensile strength also results in a lower value than in the experimental determination. The tensile strength calculated according to the mixing rule is Rm = 565 N/mm2. The behavior of the tensile strength is analogous to that of the yield strength and withstands the highest loads when the layer is aligned longitudinally to the load direction.
The strengthening effect and the anisotropic behavior can clearly be seen in the tensile strength. The anisotropic effect in the yield strength was quiet small. The yield strength points out the beginning of plastic deformation and can be seen as a localized value of the weakest part of the specimen where deformation begins. The tensile strength can be seen as an integral value, considering maximum force for the deformation of the weakest specimen cross section.
The yield and tensile strength exceeded the upper limit of the mixing rule, due to the effects of dilution. The Microstructure of the well-known filler material for the strengthening can mostly be determined as bainitic. Due to the 9% Ni in the weld metal, the microstructure was changed to a martensitic one, as shown in Figure 5b.
If the tensile strength and yield strength values were compared on the basis of the different layer orientation, it can be seen that an anisotropic behavior was achieved in the workpiece by using GMA welding layers, [16].
3. Multi-Material Design for Local Plasticization
Under cyclic loads in the fatigue strength regime, local plasticization in the notch base can be used to reduce stress peaks and increase fatigue strength, [17]. This behavior can now also be specifically used in additive manufacturing with multi-material design to increase the fatigue strength of a component. In order to present this option, however, the additive production of an entire component is avoided and the local modification of a fillet weld is carried out, to reduce welding times. It is presumed that the results can easily be transferred to additively manufactured components, by welding a material with high plasticization potential in a notch-base.
3.1. Sample Preparation for Local Plastification
To illustrate this anticipated effect, a layer of FeNi36 was welded into a prepared groove (5 mm deep and 10 mm wide) of a S700M base plate (200 mm × 300 mm × 15 mm) at the base of the fillet weld, which could be easily plasticized and deformed. The plates dimensions welded on the base plate were 100 mm × 300 mm × 15 mm. The distance between the two grooves made were 25 mm from inner edge to inner edge. The welding parameters of the pendulum bead were chosen in such a way that no pronounced heightening compared to the base material occurred, Figure 7.
In addition, the welded layer was subsequently abraded. Afterwards, the 3-layer fillet weld was welded. Figure 7 shows the finished model component. The multilayer fillet weld (right) and the welded FeNi36 layer (left) are clearly visible. A three-layer fillet weld without FeNi36 layer was used as a basis for comparison. Figure 8 shows the 3-layer fillet weld in cross section. The bright proportion of FeNi36 is clearly visible. The welding parameters are shown in Table 4.
Samples with a thickness of 5 mm were taken out by milling from the fillet welds for investigations under fatigue using the notch stress concept. The tests were carried out on a resonance testing machine of the type Rumul Testronik 110 kN (Russenberger Prüfmaschinen AG, Neuhaus am Rheinfall, Switzerland). The T-sample is loaded by bending, Figure 6. This causes a local tensile load in the seam transition area in the area of a metallurgical and geometric notch. These fatigue samples were then tested under cyclic bending up to fracture with the help of a resonance testing machine under the stress ratio R = 0.1. The calculation of the notch stresses was carried out by means of FEM (finite element method) simulation based on the procedure presented in Eurocode3–9.
3.2. Comparison of Strengths under Cyclic Load
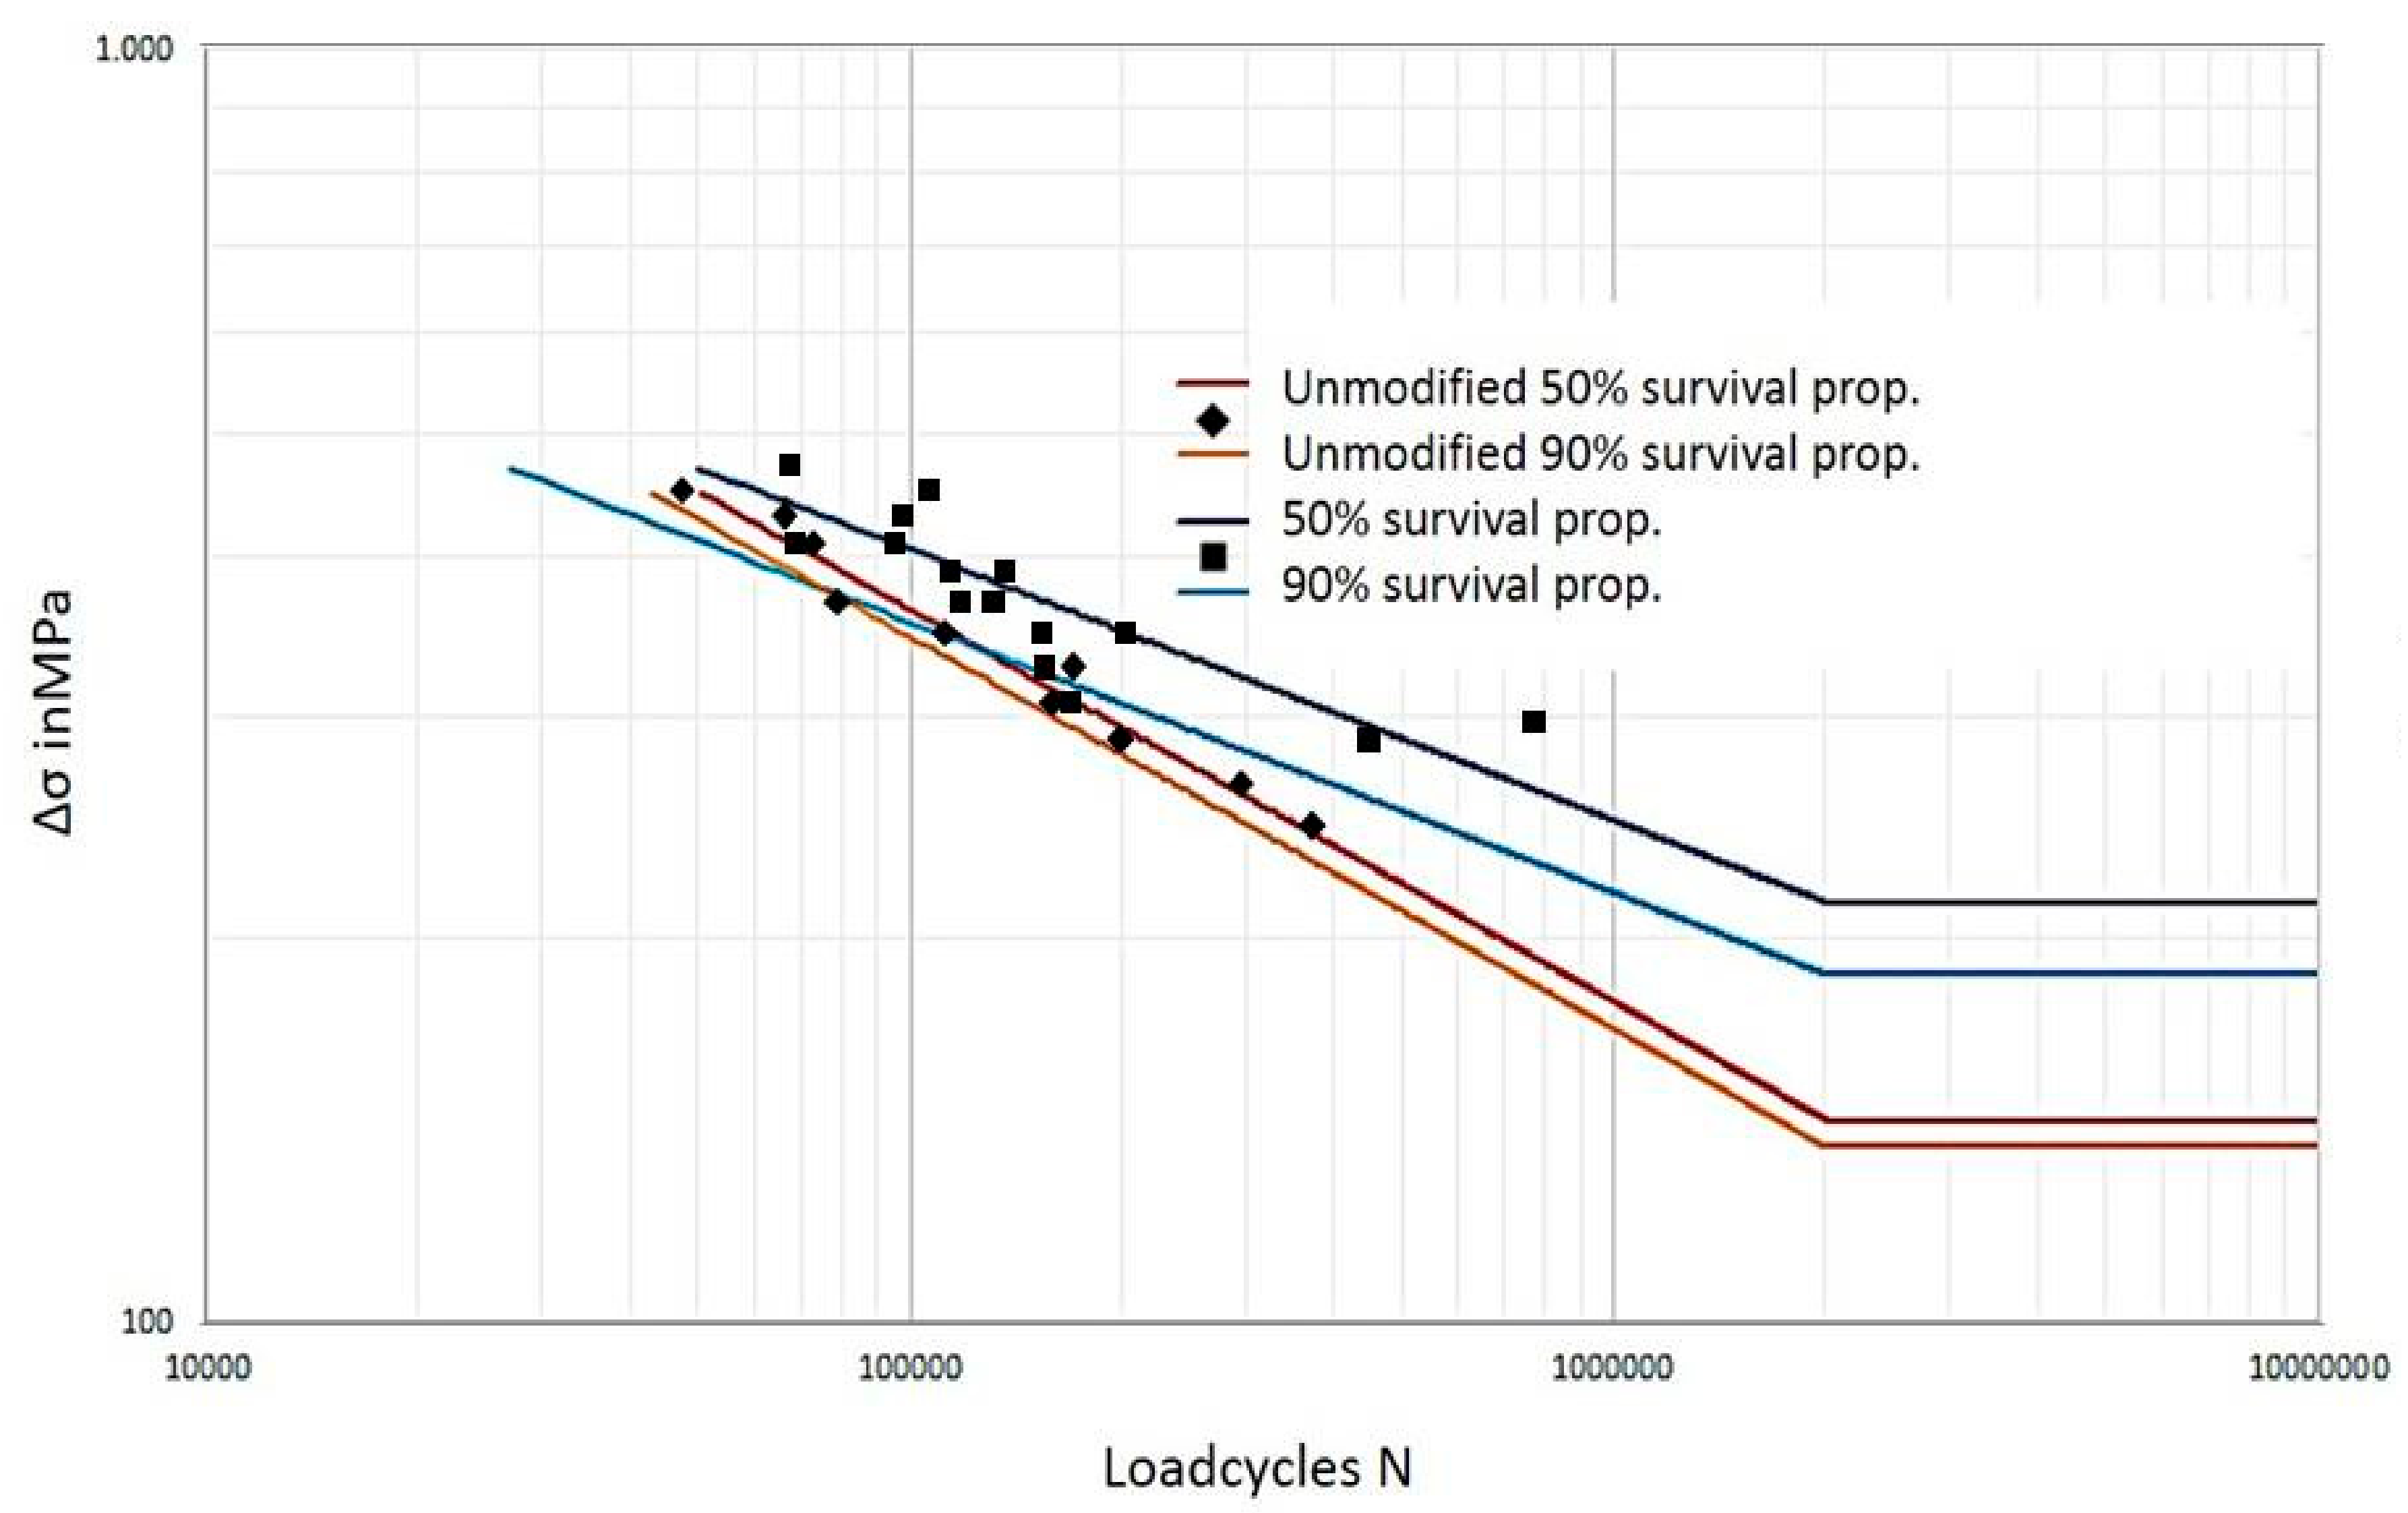
To determine the behavior of the joint under fatigue, S/N curves according to DIN 50100 were taken. For the unmodified joint 10 specimen in the of the fatigue strength straight line were test. For the modified joint 15 specimen in the fatigue strength line were tested. It can be seen that the FAT-class could be increased by more than 35% due to the good plastifiable layer in the notch base of the highest loaded position at the weld toe, Figure 9.
This leads to the conclusion that the local properties can be adjusted to different load types (static or cyclic) through the local use of different materials in additive manufacturing, thus achieving particularly high component strengths and service lives. This applies in particular in combination with the results presented in Chapter 2.
4. Targeted Dilution Control
To illustrate the procedure for the targeted control of dilution processes, corrosion resistant coatings are ideally suited, as the smallest changes in the chemical composition due to dilution can be clearly identified. In general, corrosive resistant coatings generated by welding techniques are applied in three layers in order to avoid dilution effects. If the dilution is now shifted from the corrosion protection layer to the structural component, a significant reduction of the corrosion resistance layer can be achieved, Figure 10.
4.1. Welding Parameter for Targeted Dilution Control
A flux cored wire of nickel alloy 625 and a SG 3 were used for sample preparation. The lower layers of the conventional layer structure made of SG 3 were produced (Table 5) with a welding current of 101 A at a voltage of 23.4 V and a wire feed rate of 5 m/min. In addition, the process was pulsed. The pendulum width was 24 mm with a pendulum speed of 6 cm/min and a welding speed of 5 cm/min. The upper layers consisting of the nickelbased alloy were applied without pulsation, at a welding current of 122 A, a voltage of 18.6 V and a wire feed rate of 3.5 m/min. The welding speed was 11.5 cm/min with a pendulum speed of 7.5 cm/min.
With the additive layer structure, the bead of nickel alloy 625 was applied unpulsed at 122 A and 19.3 V with a wire feed rate of 3.5 m/min. The welding speed here was 31 cm/min. The SG 3 was welded with the same parameters as before and oscillated next to the line beads.
4.2. Specimen Preparation
Two different manufacturing strategies were used to represent the different dilution processes. On the one hand, an additive structure was formed by pendulum tracks of a low-alloy steel (SG3) and then welded over with alloy 625 in the same way, Figure 11 on the left. On the other hand, first 3-layers were welded from alloy 625 and then a pendulum layer SG3 was placed at the base. Afterwards, Alloy625 and SG3 were alternately built up over 10 layers. After 10 layers the missing layers SG3 were filled up, Figure 11 right.
4.3. Experimental Determination of Corrosion Resistance
In order to compare the resistance of the produced layers against corrosion with each other, samples, as already described, were prepared from the weldings according to the schematic drawings shown. Samples were then taken from the corrosion protection layer. The method was based on generative manufacturing and made sure that the samples were only taken from the 4th layer onwards, as mixing by the base plate used had to be expected below the 4th layer.
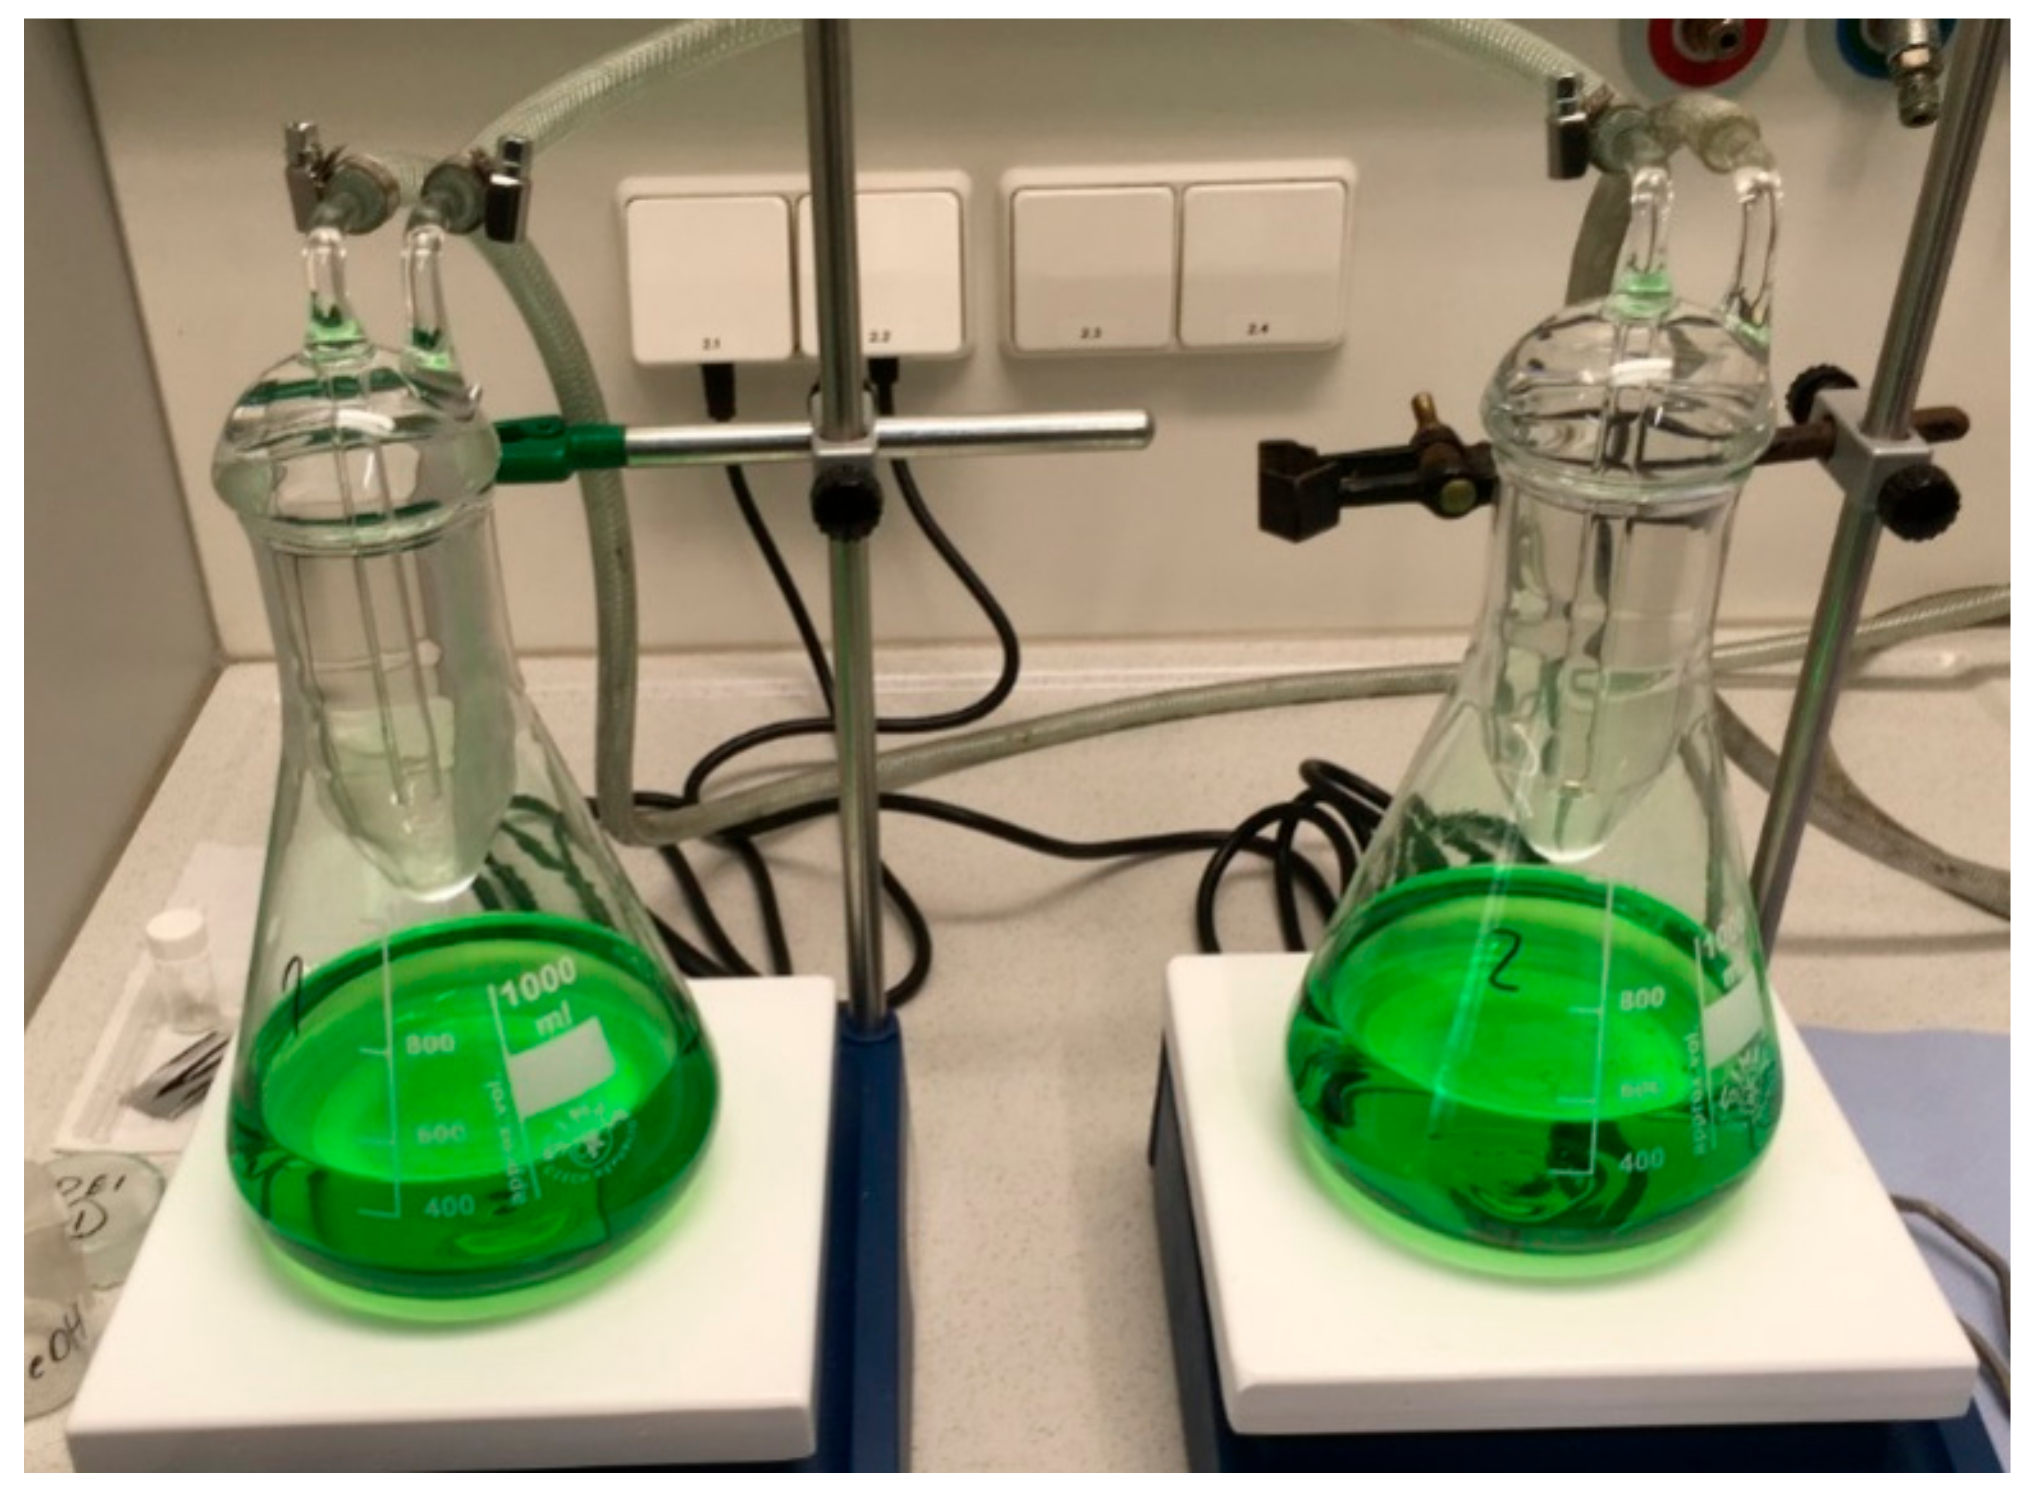
Sample preparation and testing were carried out in accordance with ASTM G48-A. The test medium used was an acid in accordance with “Green Death” with the composition (11.5% H2SO4, 1.6% HCl, 1% FeCl3, 1% CuCl2, 84.9% H2O) at a temperature of 40 °C. The pH value of the solution was 0. Figure 12 shows the test setup. The material loss due to corrosive processes was determined at various intervals. The chemical composition was determined by EDX (energy-dispersive X-ray spectroscopy) analysis.
4.4. Result of the Corrosion Tests
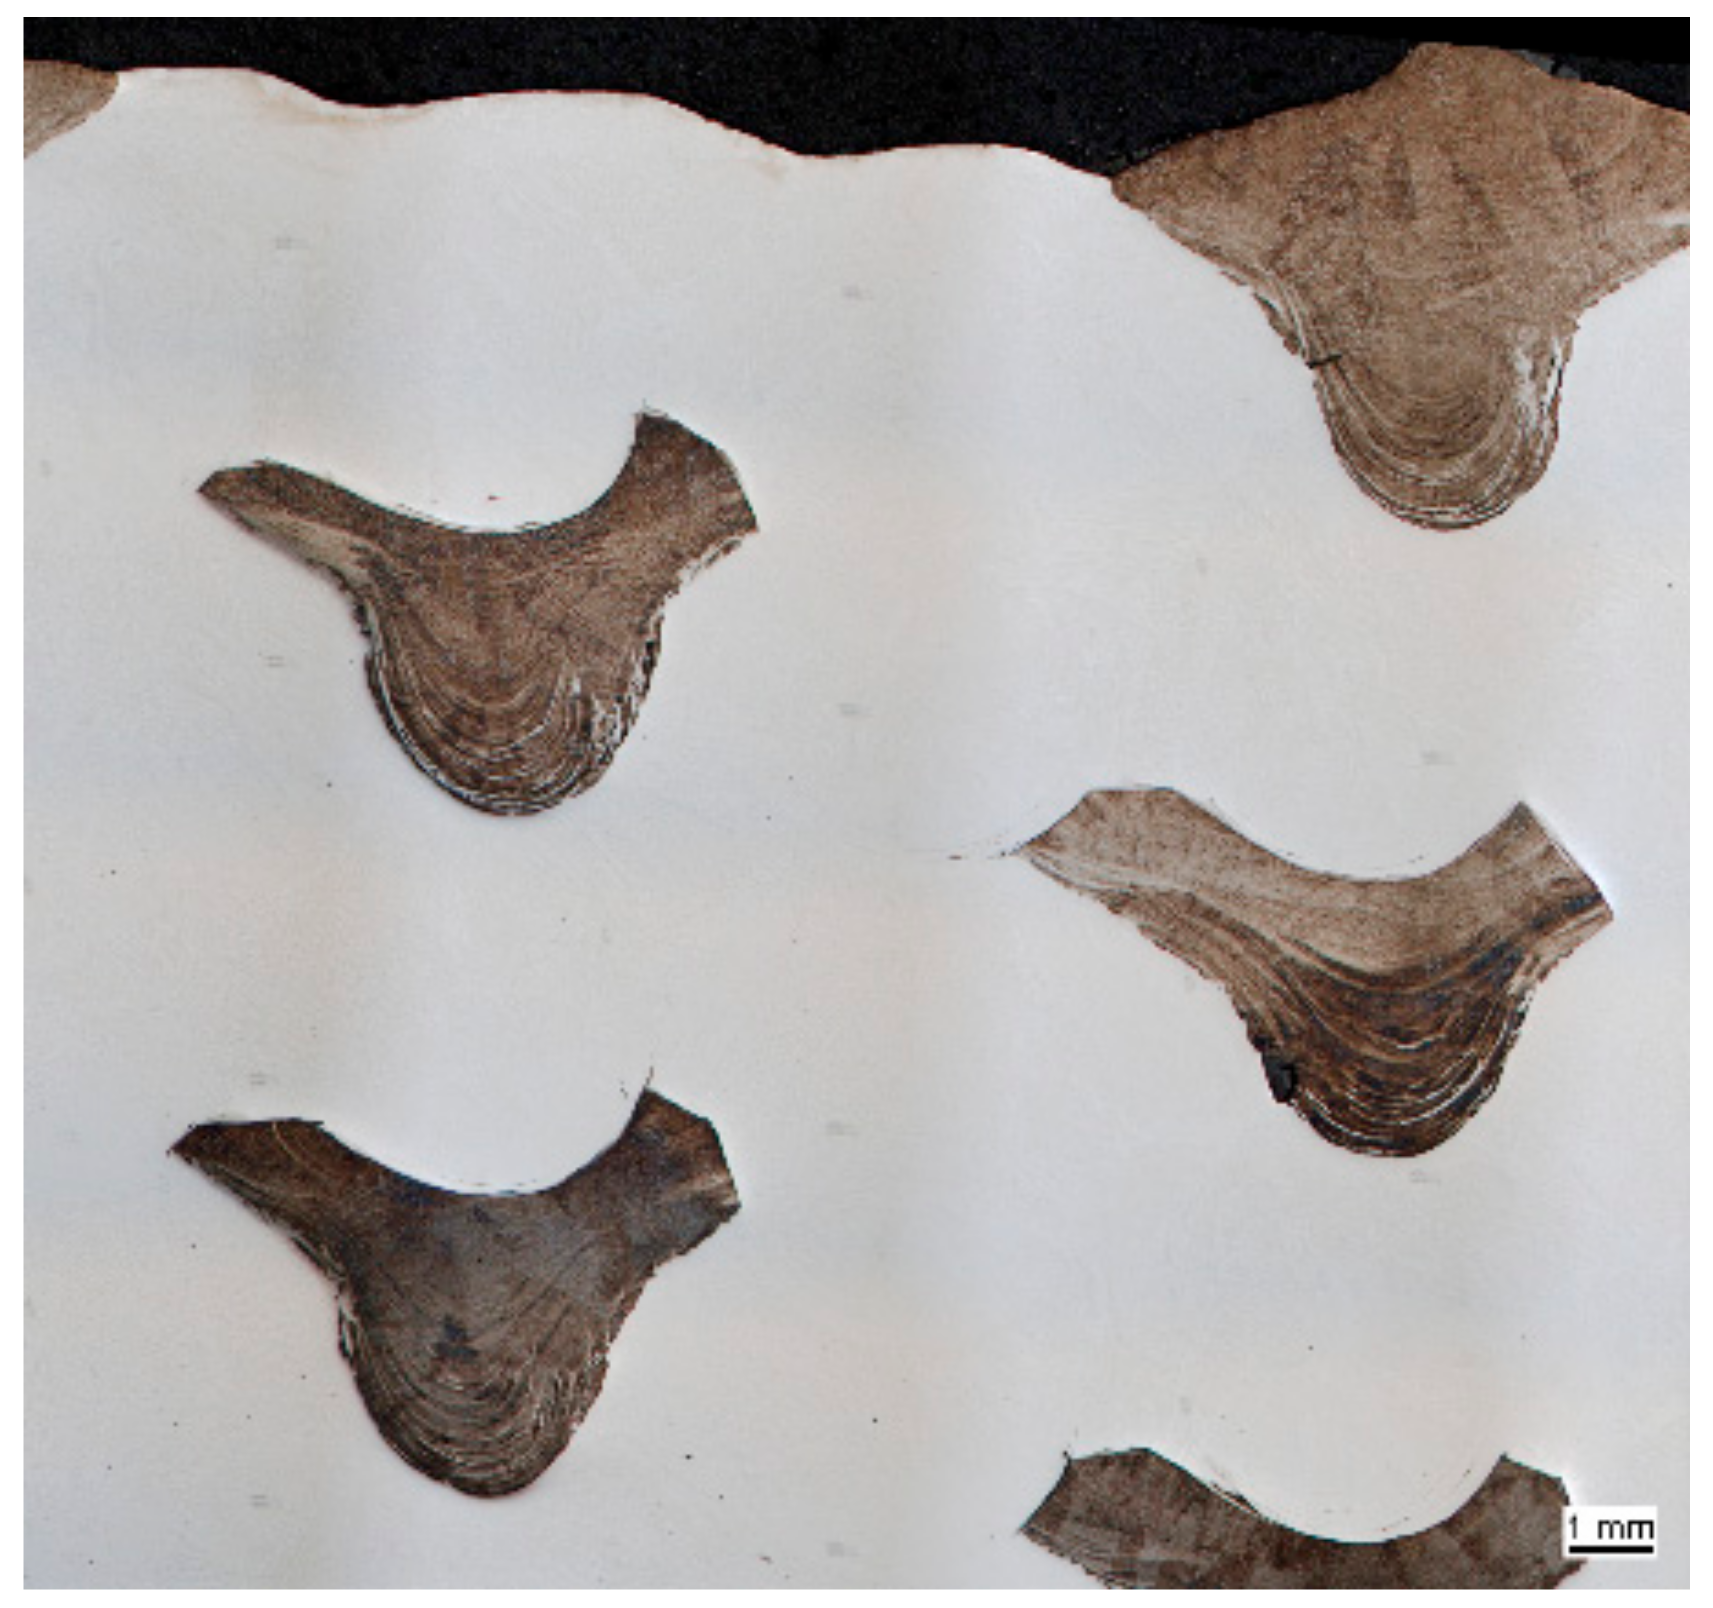
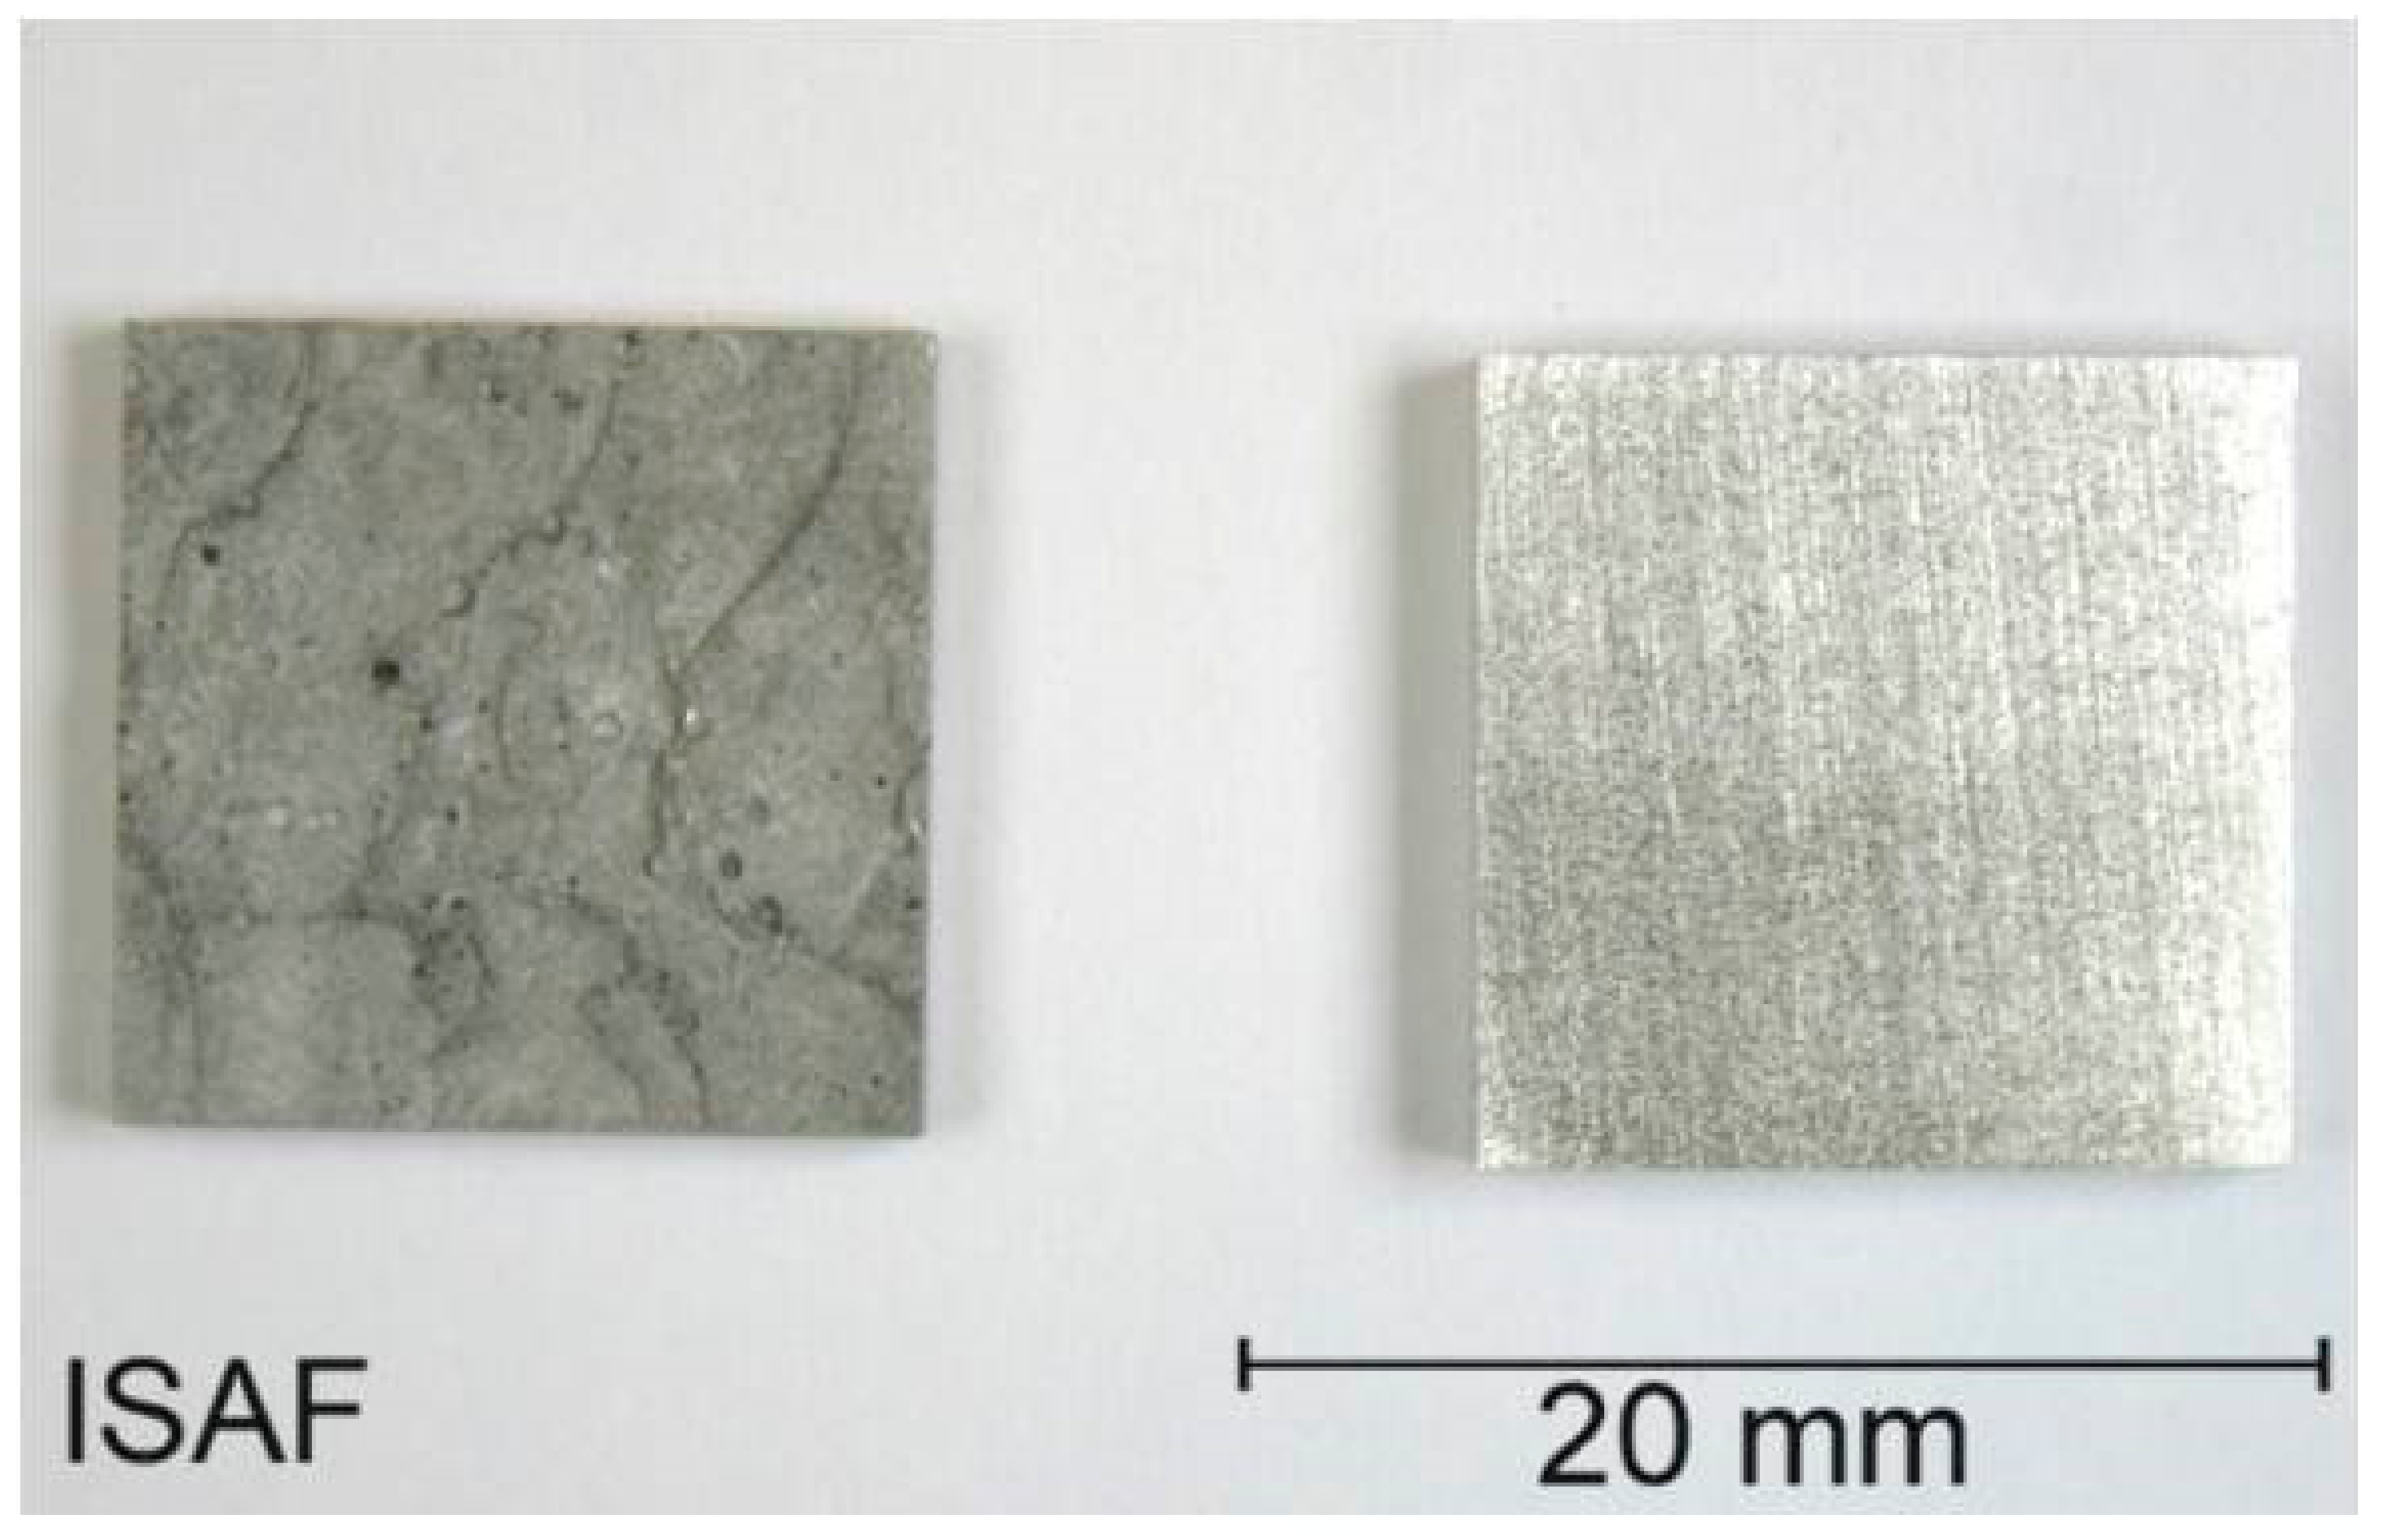
Figure 13 shows the samples after 24 h exposure in the acid. The differences on the sample surface are clearly visible. The occurring corrosion phenomena can be assigned to pitting corrosion.
Even when looking at the material loss, it can be seen that the single layer protective layer diluted by the non-corrosion resistant material clearly loses material, while the sample produced generatively with targeted control of the dilution shows almost no removal, Figure 14.
This behavior can also be confirmed relatively easily by determining the chemical composition by optical emission spectrometry. Table 6 shows the chemical composition of the two sample sets. It is shown that the composition of the test material Alloy 625 can be achieved in the “first layer” by the targeted control of the mixing.
5. Conclusions
The presented investigations show that a multi-material component design can be achieved in arc based additive manufacturing. Furthermore, it was shown that through the multi-material design the material properties can be adapted locally to the load and an adaptation of the local properties can lead to an increased part performance. In addition, it was shown that the buildup strategy in additive manufacturing can have a direct influence on the local part properties.
In detail:
- Direction-dependent increase in strengthThe introduction of high-strength layer volume fractions into additively manufactured components can, depending on mixing processes, at least increase the tensile strength disproportionately in a preferred direction. In the presented material system (welding consumables: FeNi36 and DIN EN ISO 16834-A G 69 6 M21 Mn4Ni1, 5CrMo) this increase can exceed the maximum, anticipated by the mixing rule. In this case, the tensile strength and yield strength could be increased by at least 34% compared to FeNi36. In the preferred direction, the elongation at break was slightly reduced compared to Mn4Ni1, 5CrMo. A pronounced anisotropy could only be demonstrated for tensile strength and elongation at break.
- Local increase of the pacification potential to increase the fatigue strength:By introducing a well plasticizable layer in the notch base of the selected sample geometry made of FeNi36, the fatigue strength could be increased by 35% compared to the unmodified compound.
- Target-oriented control of the dilution process through strategic planning of welding sequence:The additive manufacturing offers the possibility to adjust the direction of the dilution in a targeted way and to keep it away from materials sensitive to dilution in areas subject to corrosion. The comparison of conventionally produced corrosion layers with anti-corrosion layers with reduced dilution through previous planning of the welding sequence shows that corrosion can be avoided through targeted planning.
However, for the realization of multi material design, the metallurgical processes involved in the dilution of the two materials must be taken into account as a function of the welding process parameters.
Author Contributions
Conceptualization, K.T. and V.W.; methodology, K.T., T.B., S.K., M.L. and V.W.; validation, K.T. and V.W.; investigation, K.T., T.B., S.K., M.L. and V.W.; writing—original draft preparation, K.T.; writing—review and editing, K.T.; visualization, K.T., T.B., S.K. and M.L.; supervision, V.W. and K.T.; project administration, V.W.; funding acquisition, V.W. and K.T.
Funding
This research was funded by the Clausthal University of Technology.
Conflicts of Interest
The authors declare no conflicts of interest.
References
- Fraizier, W. Metal additive manufacturing: A review. J. Mater. Eng. Perform. 2014, 23, 1917–1928. [Google Scholar] [CrossRef]
- Queguineur, A.; Rückert, G.; Cortial, F.; Hascoet, J.Y. Evaluation of wire arc additive manufacturing for large-sizedcomponents in naval applications. Weld. World 2018, 62, 259–266. [Google Scholar] [CrossRef]
- Ahn, D.-G. Direct metal additive manufacturing processes and their sustainable applications for green technology: A review. Inter. J. Precis. Eng. Manuf. 2016, 3, 381–394. [Google Scholar] [CrossRef]
- Busaci, A.; Erkoyuncu, J.; Colegrove, P.; Drake, R.; Watts, C.; Wilding, S. Additive manufacturing applications in defence support services: Current practices and framework for implementation. Inter. J. Syst. Assur. Eng. Manage. 2018, 9, 657–674. [Google Scholar]
- Zhang, D.; Sun, S.; Qiu, D.; Gibson, M.A.; Dargusch, M.S.; Brandt, M.; Qian, M.; Easton, M. Metal alloys for fusion-based additive manufacturing. Adv. Eng. Mater. 2018, 20, 1700952. [Google Scholar] [CrossRef]
- Ding, D.; Pan, Z.; Cuiuri, D.; Li, H. Wire-feed additive manufacturing of metal components: Technologies, developments and future interests. Inter. J. Adv. Manuf. Technol. 2015, 81, 465–481. [Google Scholar] [CrossRef]
- Shen, C.; Pan, Z.; Cuiuri, D.; Roberts, J.; Li, H. Fabrication of Fe-FeAl functionally graded material using the wire-arc additive manufacturing process. Metall. Mater. Trans. B 2016, 47, 763–772. [Google Scholar] [CrossRef]
- Li, X. Additive Manufacturing of advanced multi-component alloys: Bulk metallic glasses and high entropy alloys. Adv. Eng. Mater. 2018, 20, 1700874. [Google Scholar] [CrossRef]
- Posch, G.; Chladil, K.; Chladil, H. Material properties of CMT—metal additive manufactured duplex stainless steel blade-like geometries. Weld. World 2017, 61, 873–882. [Google Scholar] [CrossRef]
- Rodriguez, N.; Vázquez, L.; Huarte, L.; Arruti, E.; Tabenero, I.; Alvarez, P. Wire and arc additive manufacturing: A comparison between CMT and TopTIG processes applied to stainless steel. Weld. World 2018, 62, 1083–1096. [Google Scholar] [CrossRef]
- Hoefer, K.; Haelsig, A.; Mayr, P. Arc-based additive manufacturing of steel components-comparison of wire- and powder-based variants. Weld. World 2018, 62, 243–247. [Google Scholar] [CrossRef]
- Li, F.; Chen, S.; Wu, Z.; Yan, Z. Adaptive process control of wire and arc additive manufacturing for fabricating complex-shaped components. Inter. J. Adv. Manuf. Technol. 2018, 96, 871–879. [Google Scholar] [CrossRef]
- Lu, X.; Zhou, Y.; Xing, X.; Shao, L.; Yang, Q.; Goa, S. Open-source wire and arc additive manufacturing system: Formability, microstructures, and mechanical properties. Inter. J. Adv. Manuf. Technol. 2017, 93, 2145–2154. [Google Scholar] [CrossRef]
- Shi, J.; Li, F.; Chen, S.; Zhao, Y.; Tian, H. Effect of in-process active cooling on forming quality and efficiency of tandem GMAW–based additive manufacturing. Inter. J. Adv. Manuf. Technol. 2019, 101, 1349–1356. [Google Scholar] [CrossRef]
- Fu, Y.; Wamg, G.; Zhang, H.; Liang, L. Optimization of surface appearance for wire and arc additive manufacturing of Bainite steel. Inter. J. Adv. Manuf. Technol. 2017, 91, 301–313. [Google Scholar]
- Leicher, M.; Treutler, K.; Kamper, S.; Wesling, V. Multimaterialdesign in der additiven Fertigung—Validierung der Machbarkeit. In Proceedings of the 3rd Niedersächsisches Symposium Materialtechnik, Clausthal-Zellerfeld, Germany, 14–15 February 2019; Shaker Verlag GmbH: Düren, Germany. [Google Scholar]
- Radaj, D.; Vormwald, M. Ermüdungsfestigkeit—GrundlagenfürIngenieure; Springer: Berlin, Germany, 2007. [Google Scholar]
Figure 1.
Distribution of layers (white: Soft matrix, black: High-strength inclusions).

Figure 2.
Welded test specimen.

Figure 3.
Orientation of the tensile specimens in layers (black represents Mn4Ni1.5CrMo); (a) transverse upright, (b) transverse flat, (c) longitudinal upright.
Figure 3.
Orientation of the tensile specimens in layers (black represents Mn4Ni1.5CrMo); (a) transverse upright, (b) transverse flat, (c) longitudinal upright.

Figure 4.
Representation of layer structure in cross section (cutout).

Figure 5.
(a) Transition from Mn4Ni1.5CrMo to FeNi36; (b) microstructure in strengthening part.

Figure 6.
Hardness overview of the welded test piece measured in HV10.

Figure 7.
Geometry to illustrate the multi-material design under cyclic load.

Figure 8.
Metallographic grinding of the modified fillet weld.

Figure 9.
S-N curves for both states.

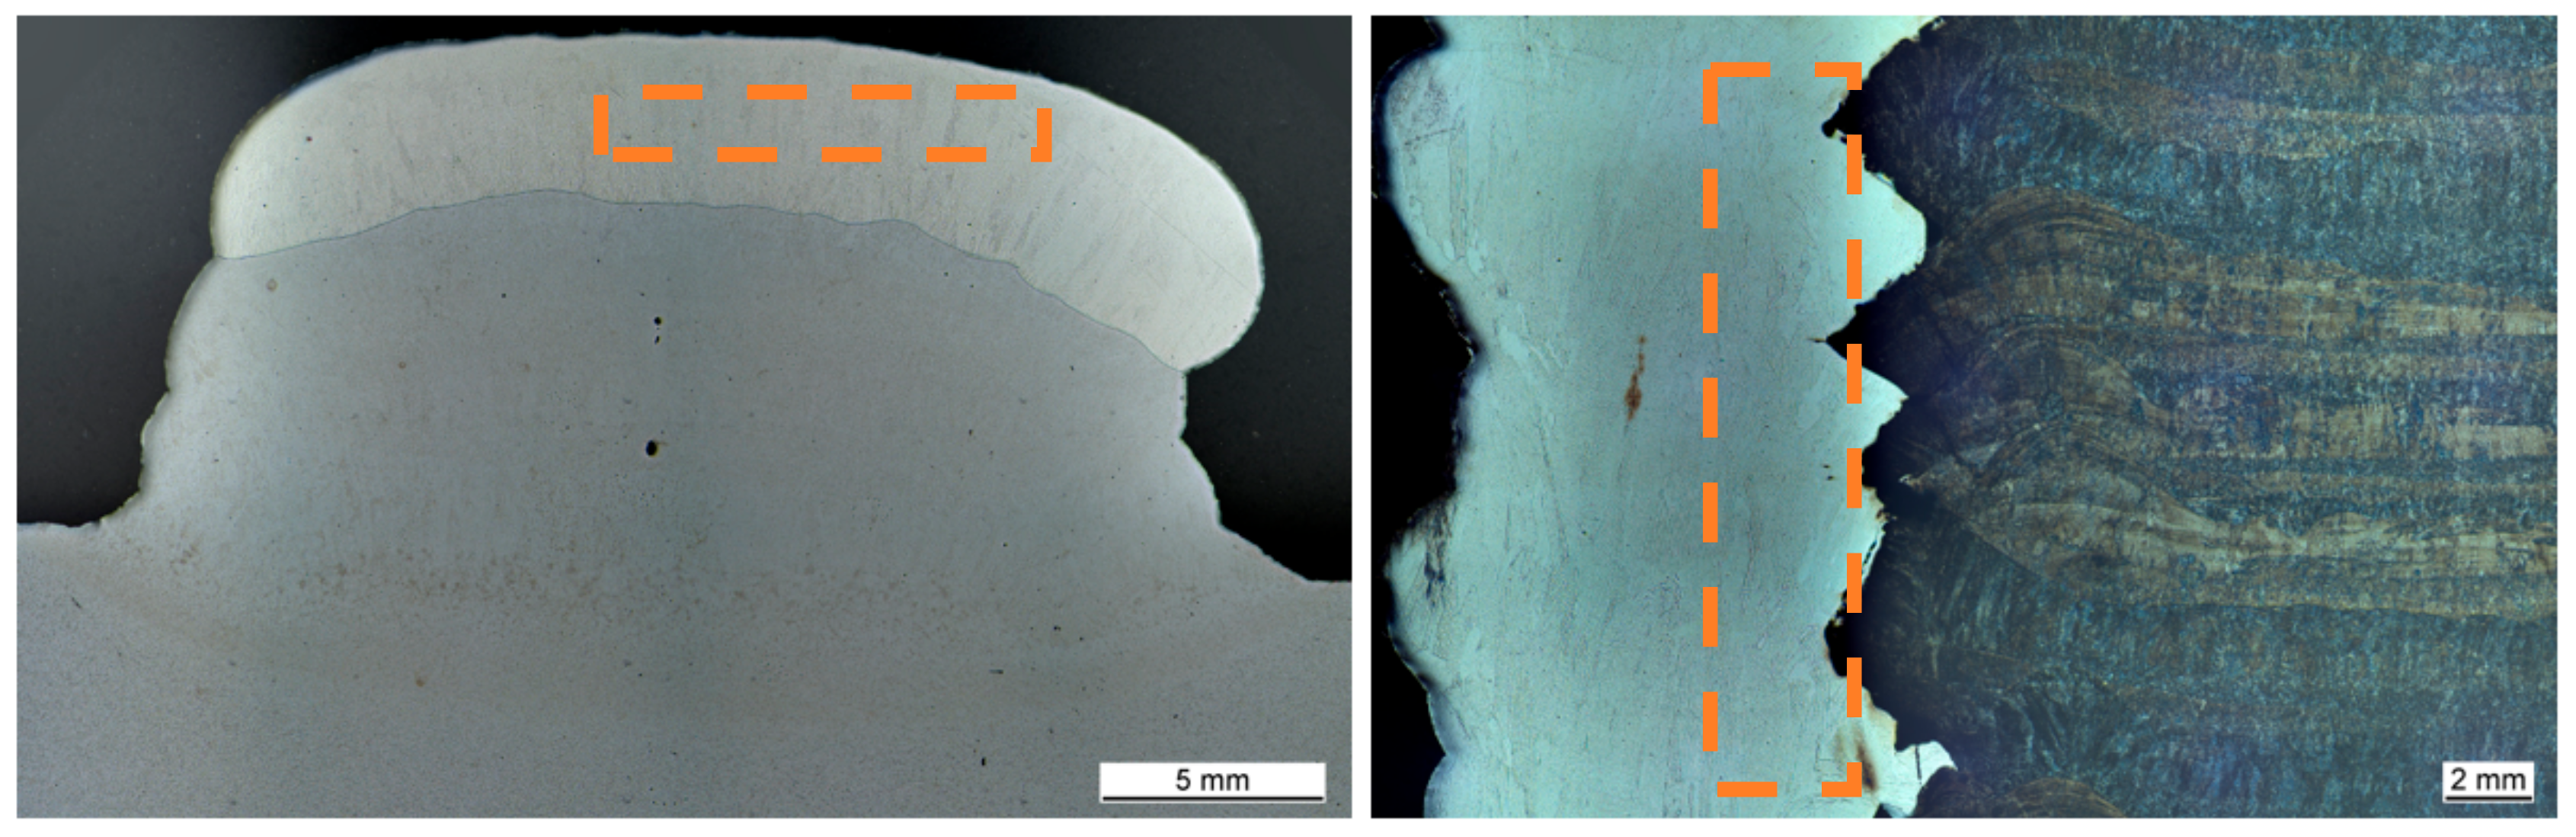
Figure 10.
Illustration of the dilution processes (box: schematic specimen position).

Figure 11.
Microsection of the additive corrosion protection layers (box: derived specimen position).
Figure 11.
Microsection of the additive corrosion protection layers (box: derived specimen position).

Figure 12.
Sample exposure setup.

Figure 13.
Corrosion samples after 2 h exposure (left: single layer, right: single layer generative).
Figure 13.
Corrosion samples after 2 h exposure (left: single layer, right: single layer generative).

Figure 14.
Material loss over exposure time.


Table 1.
Welding parameters for preferred direction specimens.
| Filler | FeNi36 | Mn4Ni1.5CrMo |
|---|---|---|
| Wire diameter [mm] | 1.14 | 1.2 |
| Wire feed [m/min] | 4.5 | 5.0 |
| Welding speed [cm/min] | 30 | 30 |
| Shielding gas | M21 | M21 |
| Current | 152 | 165 |
| Voltage | 14.7 | 15.2 |
Table 2.
Mechanical properties of unaffected base material according to data sheet.
| Material | Rp0,2 [MPa] | Rm [MPa] | TEL [%] |
|---|---|---|---|
| FeNi36 | 310 | 490 | 30 |
| Mn4Ni1.5CrMo | 720 | 790 | 17 |
Table 3.
Mechanical properties of weld specimens.
| Direction | Rp0,2 [MPa] | Rm [MPa] | TEL [%] |
|---|---|---|---|
| Transverse upright | 439 | 591 | 8 |
| Transverse flat | 433 | 567 | 7 |
| Longitudinal upright | 459 | 657 | 15 |
Table 4.
Welding parameters for lokal plasticized specimen.
| Filler | FeNi36 | Mn4Ni1.5CrMo |
|---|---|---|
| Wire diameter [mm] | 1.14 | 1.2 |
| Wire feed [m/min] | 4.5 | 6.5 |
| Welding speed [cm/min] | 6 | 30 |
| Weaving width [mm] | 10 | - |
| Weaving frequency [Hz] | ca. 1.5 | - |
| Shielding gas | M21 | M21 |
Table 5.
Welding parameters for dilution controlled specimens.
| Layer Material and Welding Sequence | Current in A | Voltage in V | Wire Electrode Speed in m/min | Welding Speed in cm/min | Oscillation Speed in cm/min |
|---|---|---|---|---|---|
| Ni 625 (String bead) | 122 | 19.3 | 3.5 | 31 | - |
| Ni 625 (oscillated bead) | 122 | 18.6 | 3.5 | 11.5 | 7.5 |
| SG 3 (oscillated bead) | 101 | 23.4 | 5 | 5 | 6 |
Table 6.
Chemical composition of the anticorrosive layer of different production.
| Mass Content in % | |||||||
|---|---|---|---|---|---|---|---|
| Element | Fe | Cr | Ni | Mo | Si | Nb | |
| Oreder | |||||||
| one layer | 41 | 12 | 37 | 5 | 0.6 | 1.7 | |
| one layer gen. | 4 | 21 | 61 | 9 | 0.9 | 3.6 | |
| 625 Datash. | 0–5 | 21–23 | 58–71 | 8–10 | 0–0.4 | 3.2–3.8 | |
© 2019 by the authors. Licensee MDPI, Basel, Switzerland. This article is an open access article distributed under the terms and conditions of the Creative Commons Attribution (CC BY) license (http://creativecommons.org/licenses/by/4.0/).
Share and Cite
MDPI and ACS Style
Treutler, K.; Kamper, S.; Leicher, M.; Bick, T.; Wesling, V. Multi-Material Design in Welding Arc Additive Manufacturing. Metals 2019, 9, 809. https://doi.org/10.3390/met9070809
AMA Style
Treutler K, Kamper S, Leicher M, Bick T, Wesling V. Multi-Material Design in Welding Arc Additive Manufacturing. Metals. 2019; 9(7):809. https://doi.org/10.3390/met9070809
Chicago/Turabian StyleTreutler, Kai, Swenja Kamper, Marcel Leicher, Tobias Bick, and Volker Wesling. 2019. "Multi-Material Design in Welding Arc Additive Manufacturing" Metals 9, no. 7: 809. https://doi.org/10.3390/met9070809
Note that from the first issue of 2016, this journal uses article numbers instead of page numbers. See further details here.