Optimal Design of a Miniaturized Cruciform Specimen for Biaxial Testing of TA2 Alloys

1
School of Mechanical and Power Engineering, Nanjing Tech University, Nanjing 211816, China
2
Jiangsu Key Lab of Design and Manufacture of Extreme Pressure Equipment, Nanjing 211816, China
*
Author to whom correspondence should be addressed.
Metals 2019, 9(8), 823; https://doi.org/10.3390/met9080823
Submission received: 25 June 2019
/
Revised: 20 July 2019
/
Accepted: 23 July 2019
/
Published: 25 July 2019
Abstract
:The biaxial tensile testing of cruciform specimens is an effective way to create complex loading, and is a feasible experimental method for studying the subsequent yield behavior. However, relevant knowledge gaps still exist in the geometric design of miniaturized cruciform specimens which are applicable to test machines with maximum load less than 5000 N. The present work outlines the systematic investigations of the optimal design of the miniaturized cruciform specimen of a commercial pure titanium TA2 for biaxial tensile testing. Finite element modeling (FEM) coupled with the orthogonal design is employed to explore the influence of various geometric parameters, i.e., the thickness of the central gauge region, the width, the length, and the number of the slit, and the radius of the inner chamfer, on the stress distribution of the central gauge region. The optimal geometric design of the miniaturized cruciform specimen is successfully obtained, simultaneously considering the stress uniformity in the central gauge region and economic factors. The full-field strain distributions are also determined via the digital image correction (DIC) technique, which confirm the accuracy of the results achieved from FEM. This work provides a complete and reliable procedure for optimizing the geometry of miniaturized cruciform specimens, whose application can be expanded to other metals in the future.
1. Introduction
Commercial pure titanium, e.g., TA2, has been widely used in medical, aerospace, and automotive fields due to its high specific strength, good biocompatibility, excellent heat resistance, and corrosion resistance [1]. In general, TA2 tends to be in the states of biaxial or even more complicate stresses in service under multiaxial loading. As a result, there is little existing capability to evaluate the biaxial mechanical response via uniaxial tensile testing alone. According to prior works of plastic yield behavior of pure titanium plates under different loading paths [2,3], the biaxial tensile testing of cruciform specimens was found to be one of the most realistic techniques to create biaxial stress states that are closer to the actual situation. For the biaxial tensile testing, the basic principle is that the four cross arms of the cruciform specimen are stretched separately and the plastic flow should be restricted in the central region of the specimen.
Shiratori [4,5] proposed a biaxial tensile testing technique using a cross-shaped specimen for the first time. However, the load-bearing area of the cross-arm section is much smaller than the central gauge section, leading to the problem that the specimen failed outside the gauge area. With the development of the biaxial tensile testing technology, the design of test specimens has been greatly improved. For instance, according to the proposal made by Lebedev [6,7], a row of thorough slits oriented parallel to the respective principal axes of the specimen were machined in one arm. This design effectively reduced the mutual influence of the tensile biaxial loading and produced a uniform stress field over a large part of the area where the arms overlapped, resulting in improved reliability of the experimental data. In 1992, Makinde et al. [8] employed a statistical method coupled with the finite element modeling (FEM) to optimize the geometry of cruciform specimens with a circular reduced central region for the purpose of minimizing the effects of specimen geometry on the testing results. In 2014, the international standard ISO/CD16842 [9] for biaxial tensile testing using a cruciform test piece was published. Standard shape and dimensions of the cruciform specimen were recommended; hence, this type of cruciform testing specimen has been extensively adopted for measuring stress-strain curves. It is at least worth noting, however, that the thinning of the central gauge was not proposed in this standard. Meanwhile, other strategies for specimen design have also been suggested [10,11,12,13,14,15,16], such as multistage thinning, unilateral thinning, etc., but these specimen designs never gained wide acceptance. In addition, the Wu research group [17,18,19,20,21] have also studied the stress-strain distribution of cruciform specimens designed with several previous, mature strategies, such as “slitting on the arm”, “central thinning”, and “fillet”. These studies focus on the optimal design of the cruciform specimen via experimental methods but lack a comprehensive analysis on the effect of specimen geometry. In fact, the experimental results are affected by the geometric variables, e.g., the thickness of the specimen, the radius of the fillet on the arm, the width of the slit, the length of the slit, and the number of slits. On the other hand, to date, the shape and dimensions of cruciform specimen studied in prior works is designed for testing on a high-power test machine, while the design of miniaturized specimens tested on low-power testing machines (the maximum applied load P ≤ 5000N) remains challenging.
In the present work, the biaxial tensile testing method using a miniaturized cruciform specimen is applied to evaluate the biaxial mechanical responses of sheet TA2. The FEM, accompanied by experiments using the digital image correlation (DIC) measurement method, are utilized to optimize the shape and dimensions of the cruciform specimen. An optimal design of the miniaturized specimen that is applicable to the low-power stretching machine is successfully attained.
2. Optimal Design of the Cruciform Specimen via FEM
2.1. Design Requirements for the Biaxial Testing of Cruciform Specimens
The requirements for an ideal biaxial tensile test of a cruciform specimen are as follows:
- It is of great importance to confine the majority of deformation in the center region of the specimen; that is to say, the initial yielding, necking, or rupture should occur in the central gauge area of the specimen.
- The stress-strain distributions in the gauge area of the specimen should be as homogeneous as possible.
- Stress concentration should be avoided in the regions outside the central gauge area of the specimen.
- Once the above requirements are satisfied, the economics of the processing of the test piece should be considered.
2.2. FEM
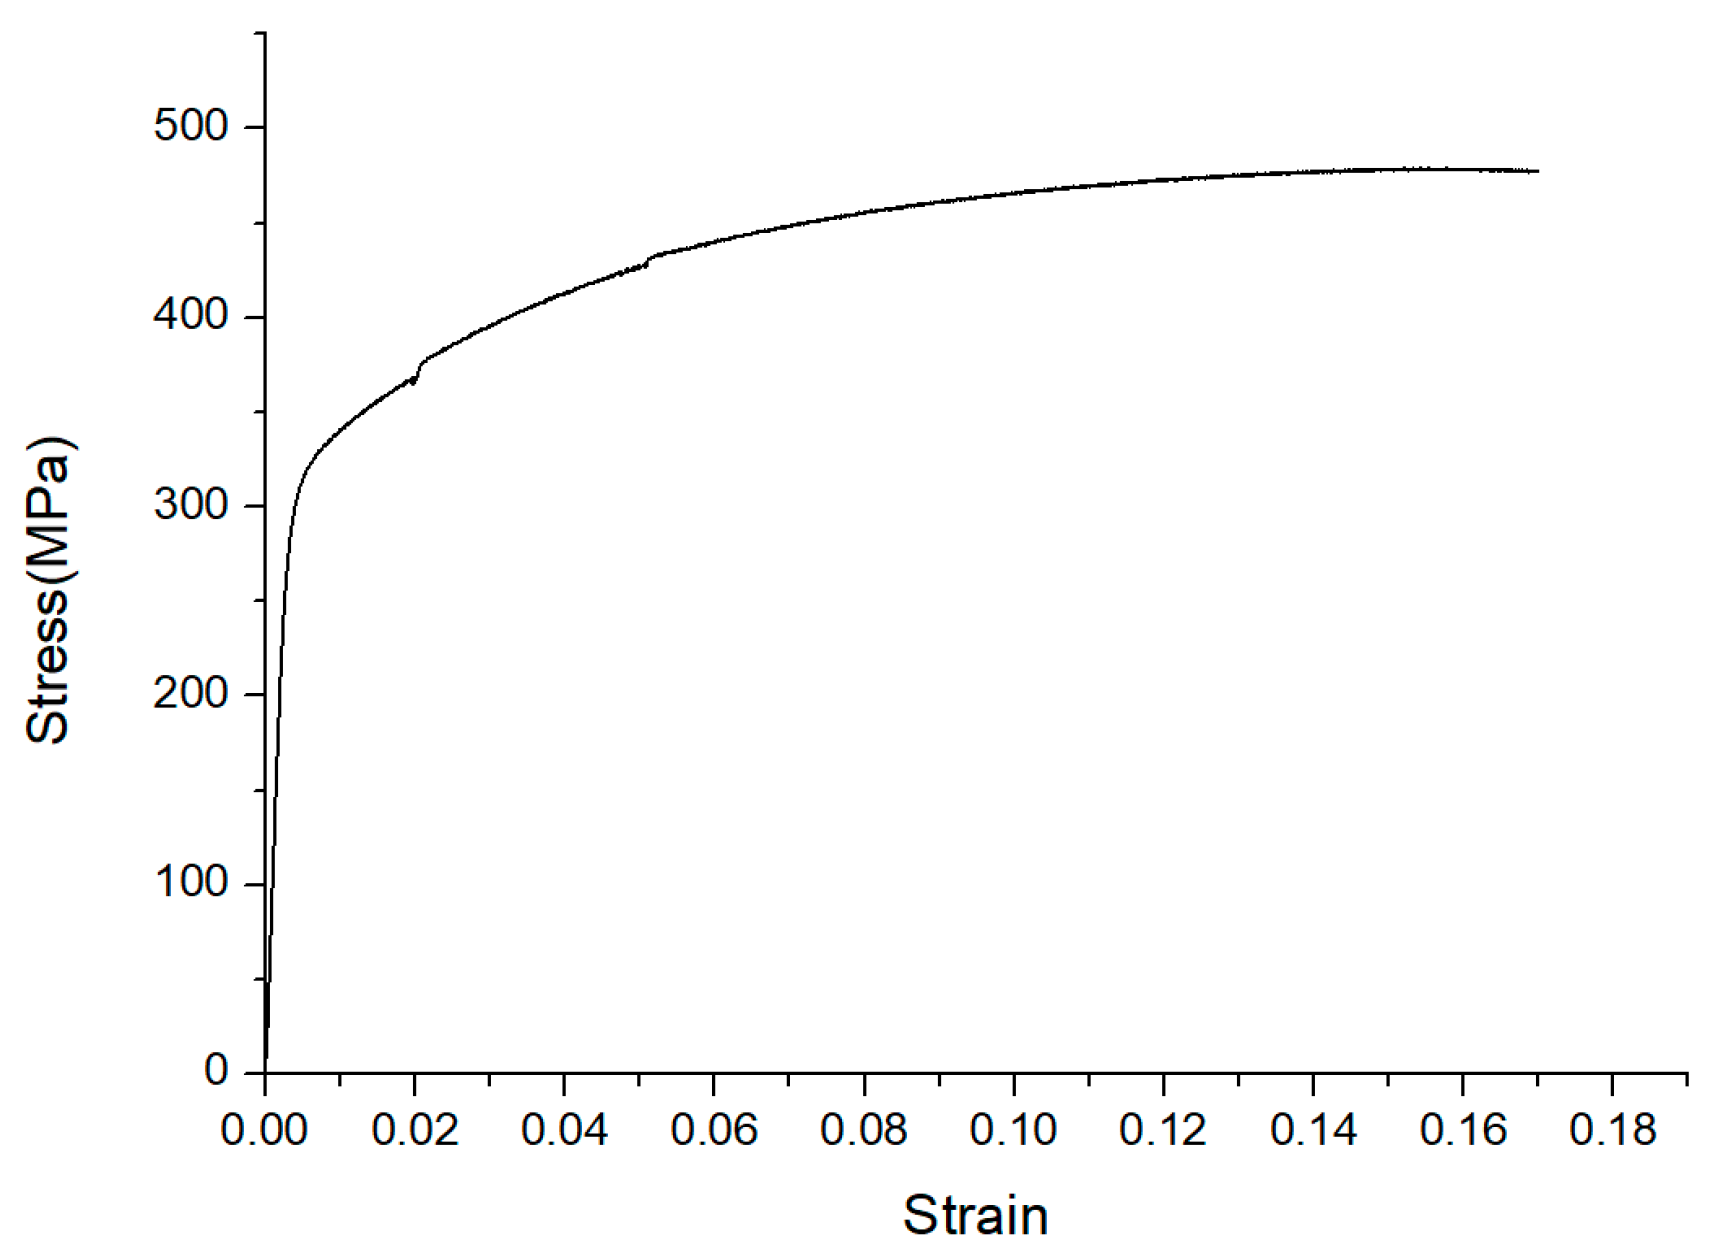
The geometric shape and stress-strain distributions of cruciform specimens have four-fold symmetry Thus, for simplicity, a 1/4 axisymmetric model is established, using ANSYS 16.0 commercial software (ANSYS, Pittsburgh, PA, USA). The solid 45 unit has eight nodes, and each node has two degrees of freedom. The grid size of the central gauge area is 0.2 mm, and that of the other regions is 0.4 mm. The material parameters of the material tested, i.e., TA2, are obtained from the corresponding uniaxial tensile testing, details of which are as follows: the elastic modulus is 122.07 GPa, the Poisson’s ratio is 0.337, and the yield strength is 310 MPa. A true stress-strain curve is employed and inputted in the simulation, which is attained from the uniaxial tensile test, as shown in Figure 1.
2.3. The Influence of the Geometric Shape of the Transition Section
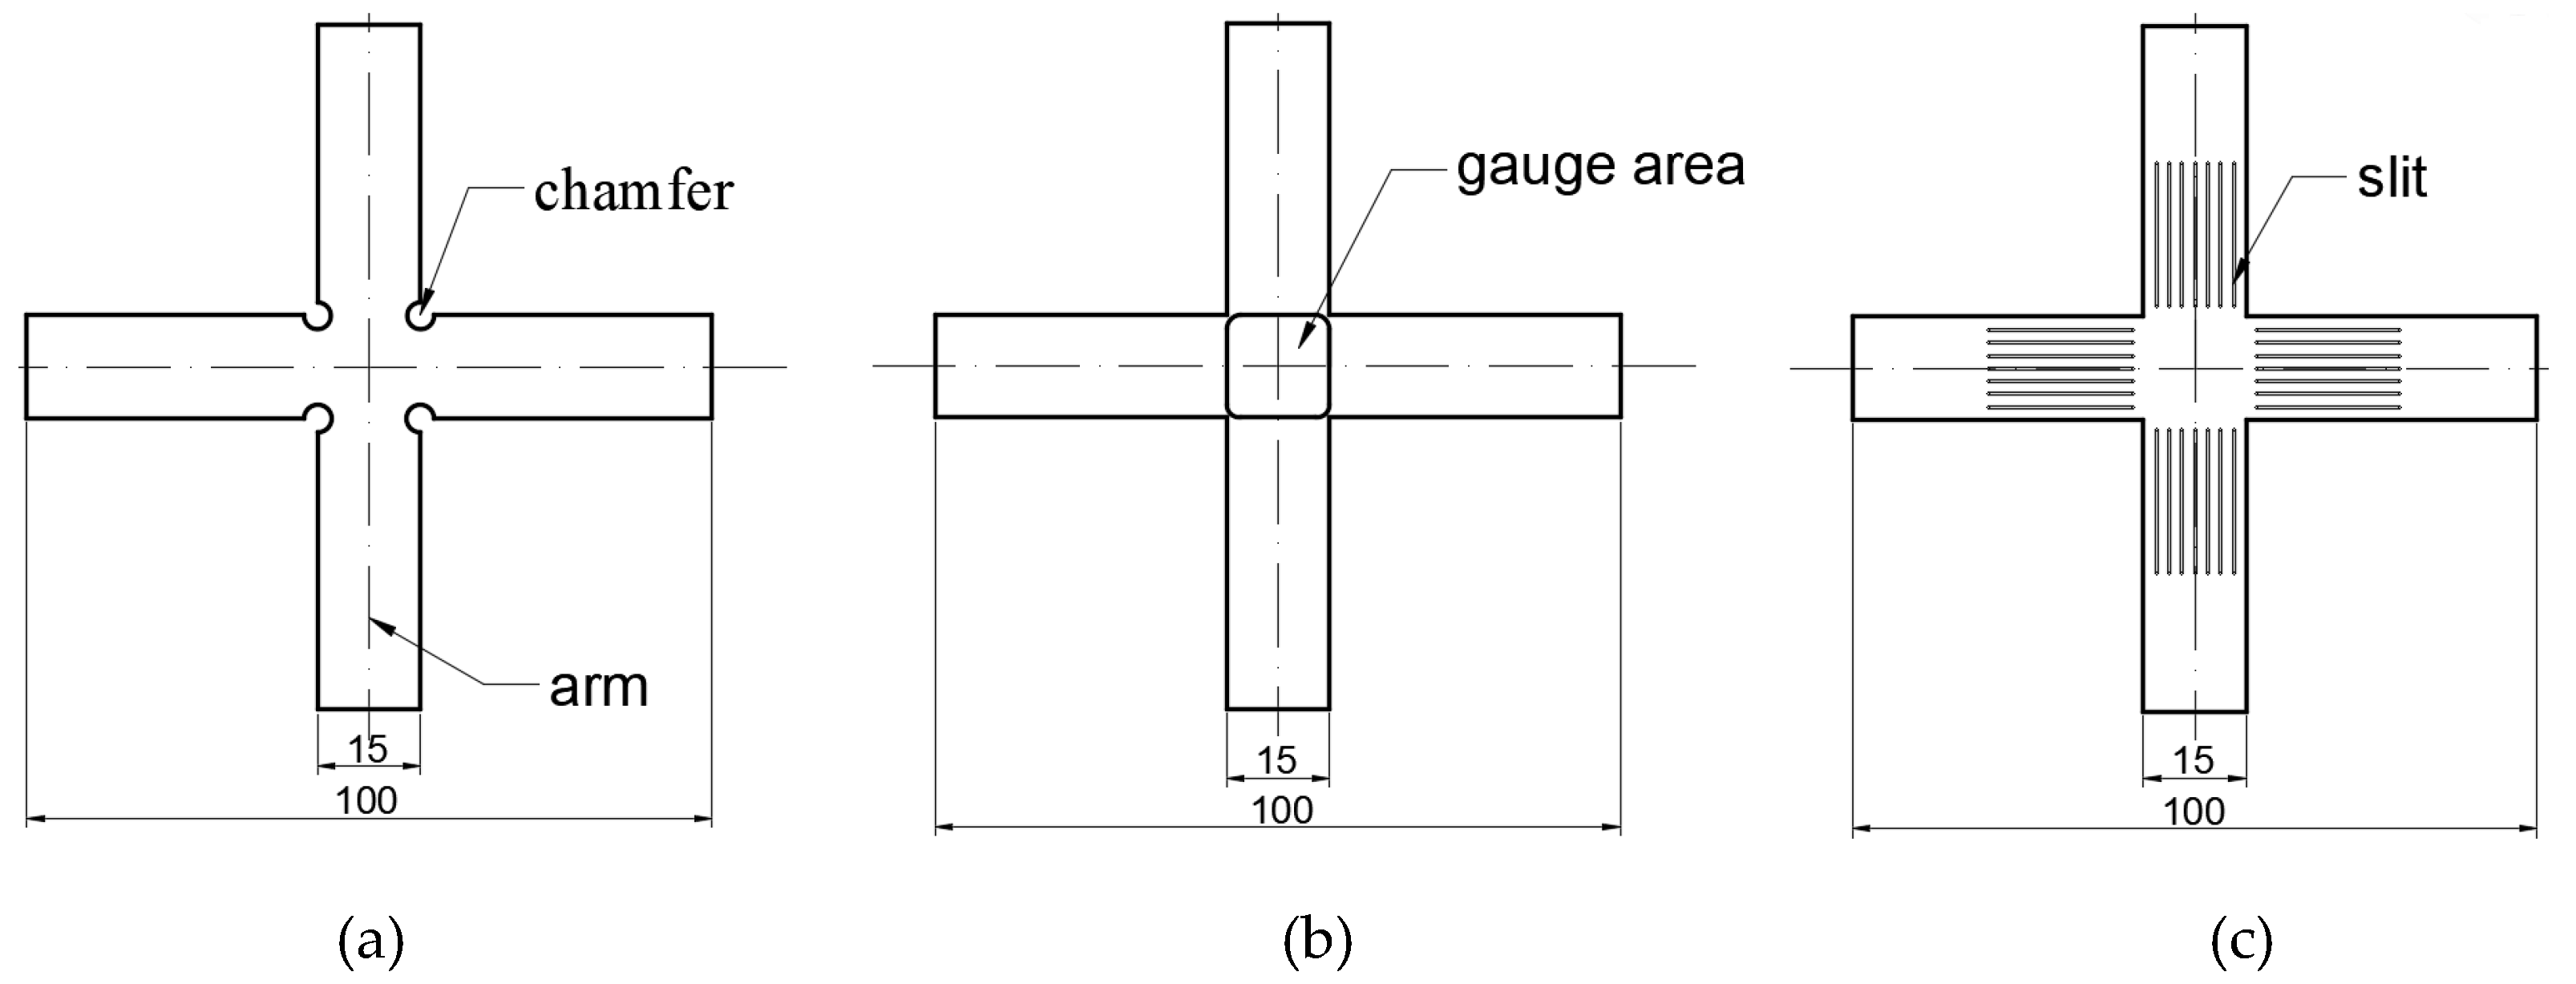
Based on the aforementioned requirements, three types of test specimens are discussed here, as shown in Figure 2. For the first type of specimen, a chamfer is made at the junctions of the arms to the gauge area, in order to reduce stress concentration at the corners (Figure 2a). For the second type of specimen, the thickness of the central gauge region is reduced to avoid stress concentration developed on the arms, and to ensure that the failure preferentially occurs in the gauge (Figure 2b). For the third type of specimen, a row of slits is made on each arm to eliminate the influence of shear stress and to produce a more homogeneous stress distribution (Figure 2c).
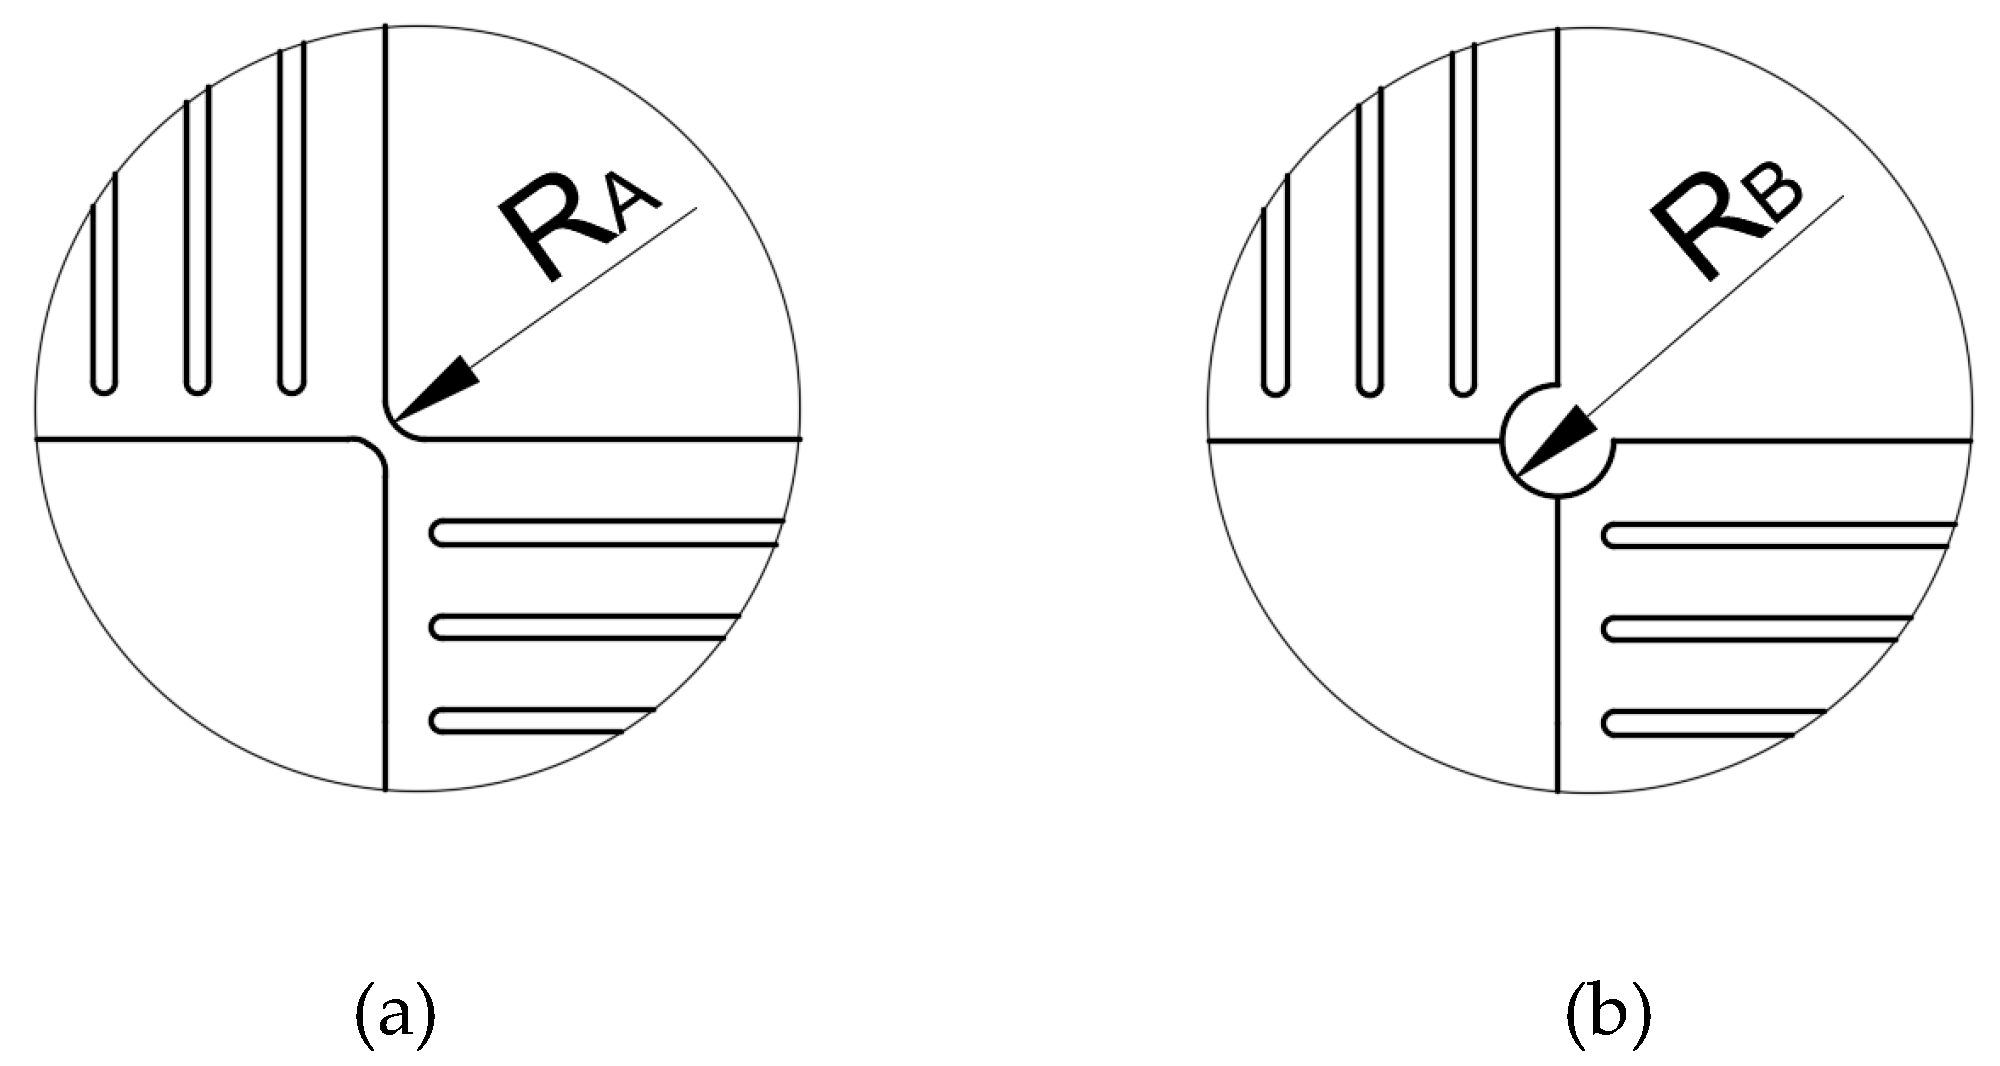
Here, two different corner shapes at the junctions of arms to the gauge area are proposed, as shown in Figure 3. For the first one, the outer chamfer is designed, where RA denotes the corner radius. For the second one, the "inner chamfer" is designed, where RB denotes the corner radius.
To explore the effect of corner shape on the stress distribution, four types of cruciform specimen with dimensions of 100 mm (length) × 15 mm (arm width) × 1.6 mm (thickness) were designed, as shown in Figure 4. In terms of manufacturing, the first three types (i.e., A, B, and C) are identical, wherein only their corner radii are different (i.e., the radii are 1, 2, and 3 mm for type A, type B, and type C, respectively). On the other hand, for the modified specimen, i.e., type D, the inner chamfer with a radius of 1.5 mm is made at the junctions of arms to the gauge area (a word of caution is in order here. The radius is variable and is not limited to that shown in Figure 4, whose influence will be investigated in Section 2.5.2). The illustration of the finite element model for specimen type D is displayed in Figure 5.
A three-dimensional finite element model is established for each type of specimen proposed before, where the stress distribution can be calculated. For convenience, the anisotropic properties of the TA2 sheet are not considered here. A series of applied stresses are employed in the FEM. The stress applied at the horizontal arm is defined as , whose values are set as 200, 300, and 400 MPa, respectively. Meanwhile, the stress applied at the vertical arm is defined as n, where the values of n, i.e., the load ratio in the Y direction are 0, 0.25, 0.5, 0.75, and 1, respectively.
In the extreme case of n = 0, only the horizontal arm is loaded, corresponding to a uniaxial stress state. In the case of n = 1, an identical load is simultaneously applied at the horizontal and vertical arms, corresponding to a biaxial state.
When 200 MPa and n = 0, the calculated distributions of (axial stress in the x direction) for four types of specimen are as shown in Figure 6. Prominent stress concentration can be observed at the corner edges for all four specimens. Specimen type D exhibits the highest maximum stress of 342.8 MPa, and the values of for specimen type A, B, and C are 320.5, 304.6, and 291.1 MPa, respectively. The of the four types of specimens are listed in Table 1, including the stress at the central gauge area and the ratio for comparison. The can be used to evaluate the degree of stress concentration to some extent, where the that approaches equal to 1 was suggested to correspond to have a gentle stress gradient and an relative uniform stress distribution.
For type D specimen, the stress at the center gauge area ( MPa) is the largest, and is closest to the stress applied at the arm end ( = 200 MPa), which reflects that the applied load can be fully transmitted from the arm end to the center of the specimen.
For first three types of specimen (i.e., A, B, and C), the decrease with an increase in the corner radius, indicating that a lager corner radius contributes to a more homogeneous stress distribution. Meanwhile, the stress concentration extends from the corner edge to the interior of the specimen. In addition, the of first three types of specimens are obviously smaller than the stress applied, which means that this kind of geometric design opposes the transmission of load.
For the specimen type D, the are much larger than those of first three types of specimens. However, it is worthy to note that the of specimen type D is the smallest in all four types of specimens, showing that the type D specimen has an optimal geometric design to reduce the stress concentration of the corner. The of the type D specimen approaches the applied stress.
When 200 MPa and n = 1, the distributions of Mises stress () of the four types of specimens are shown in Figure 7. Significant stress concentration is developed at the corner edges in all four test specimens. The type A specimen exhibits a highest maximum stress of 345.7 MPa, and the values of for specimen type B, C, and D are 327.2, 313.3, and 342.4 MPa, respectively. The of four types of specimens are summarized in Table 2, including the Mises stress at the central gauge area and the ratio. Similarly, to some degree, the stress concentration also can be indirectly assessed by , whose value closer to 1 corresponds to a more uniform stress distribution.
For the first three types of specimen (i.e., A, B, and C), the decreases with an increasing corner radius (Table 2). Most importantly, the specimen type D has the lowest and the highest , which is desirable for the biaxial tensile testing of cruciform specimens. In a word, consistent with the results in Table 1, the type D specimen exhibits a desirable stress distribution, as indicated by the ratio.
In order to study the stress distribution in the central gauge area of a specimen under different loading ratios, the Type D specimen is taken as the research object. Figure 8 shows the Mises stress distribution in the Type D specimen with the n = 0.25, 0.5, 0.75, and 1, respectively. The main conclusions are summarized as follows:
- —
- The of the test piece is almost constant with an increase in the applied stress in the Y direction.
- —
- With an increasing applied stress in the Y axis direction, the overall distribution of Mises stress in the specimen tends to be symmetrical, implying a more homogeneous stress in the central gauge area.
- —
- When n = 1, the Mises stress of the specimen is symmetrical with respect to a 45° diagonal line.
The as a function of the n value under various applied stress is plotted in Figure 9. The trends of varying with the n value for various types of specimens are identical, and remains invariant with an increasing applied stress. Moreover, for different n value, the value of specimen type D is always the lowest, which means that the stress distribution of the type D specimen is the most homogeneous.
In summary, the geometric design of specimen type D is chosen for the following reasons: firstly, the value of / of specimen type D is the lowest (Table 1); secondly, the value of / of specimen type D is the lowest and closest to 1 (Table 2), indicating the most uniform stress distribution in specimen type D; thirdly, the values of specimen type D are always the lowest under varying applied stress (Figure 9).
2.4. Effect of the Thickness of the Central Gauge
Even a homogeneous stress distribution can be anticipated in the central gauge area of specimen type D, yet the is still significantly smaller than the localized in the arms (Figure 7, Figure 8 and Figure 9), owing to an obvious biaxial strengthening effect. In order to avoid the failure occurring outside the central gauge area, a thinning process of the gauge should be adopted in the specimen design. This reduced thickness ensures that a highest stress level can be obtained in the gauge area. Moreover, a line of slits made on each arm was found to be very effective in mitigating the biaxial strengthening effect and contributing to the uniform stress-strain distributions within the gauge region. In the present work, thus, the thickness of gauge area is chosen as the variable parameter, and five slits with a width of 0.8 mm are introduced on each arm. The gauge thickness H decreases from 1.6 to 0.4 mm, in order to explore the effect of H on the biaxial stress state of the type D specimen.
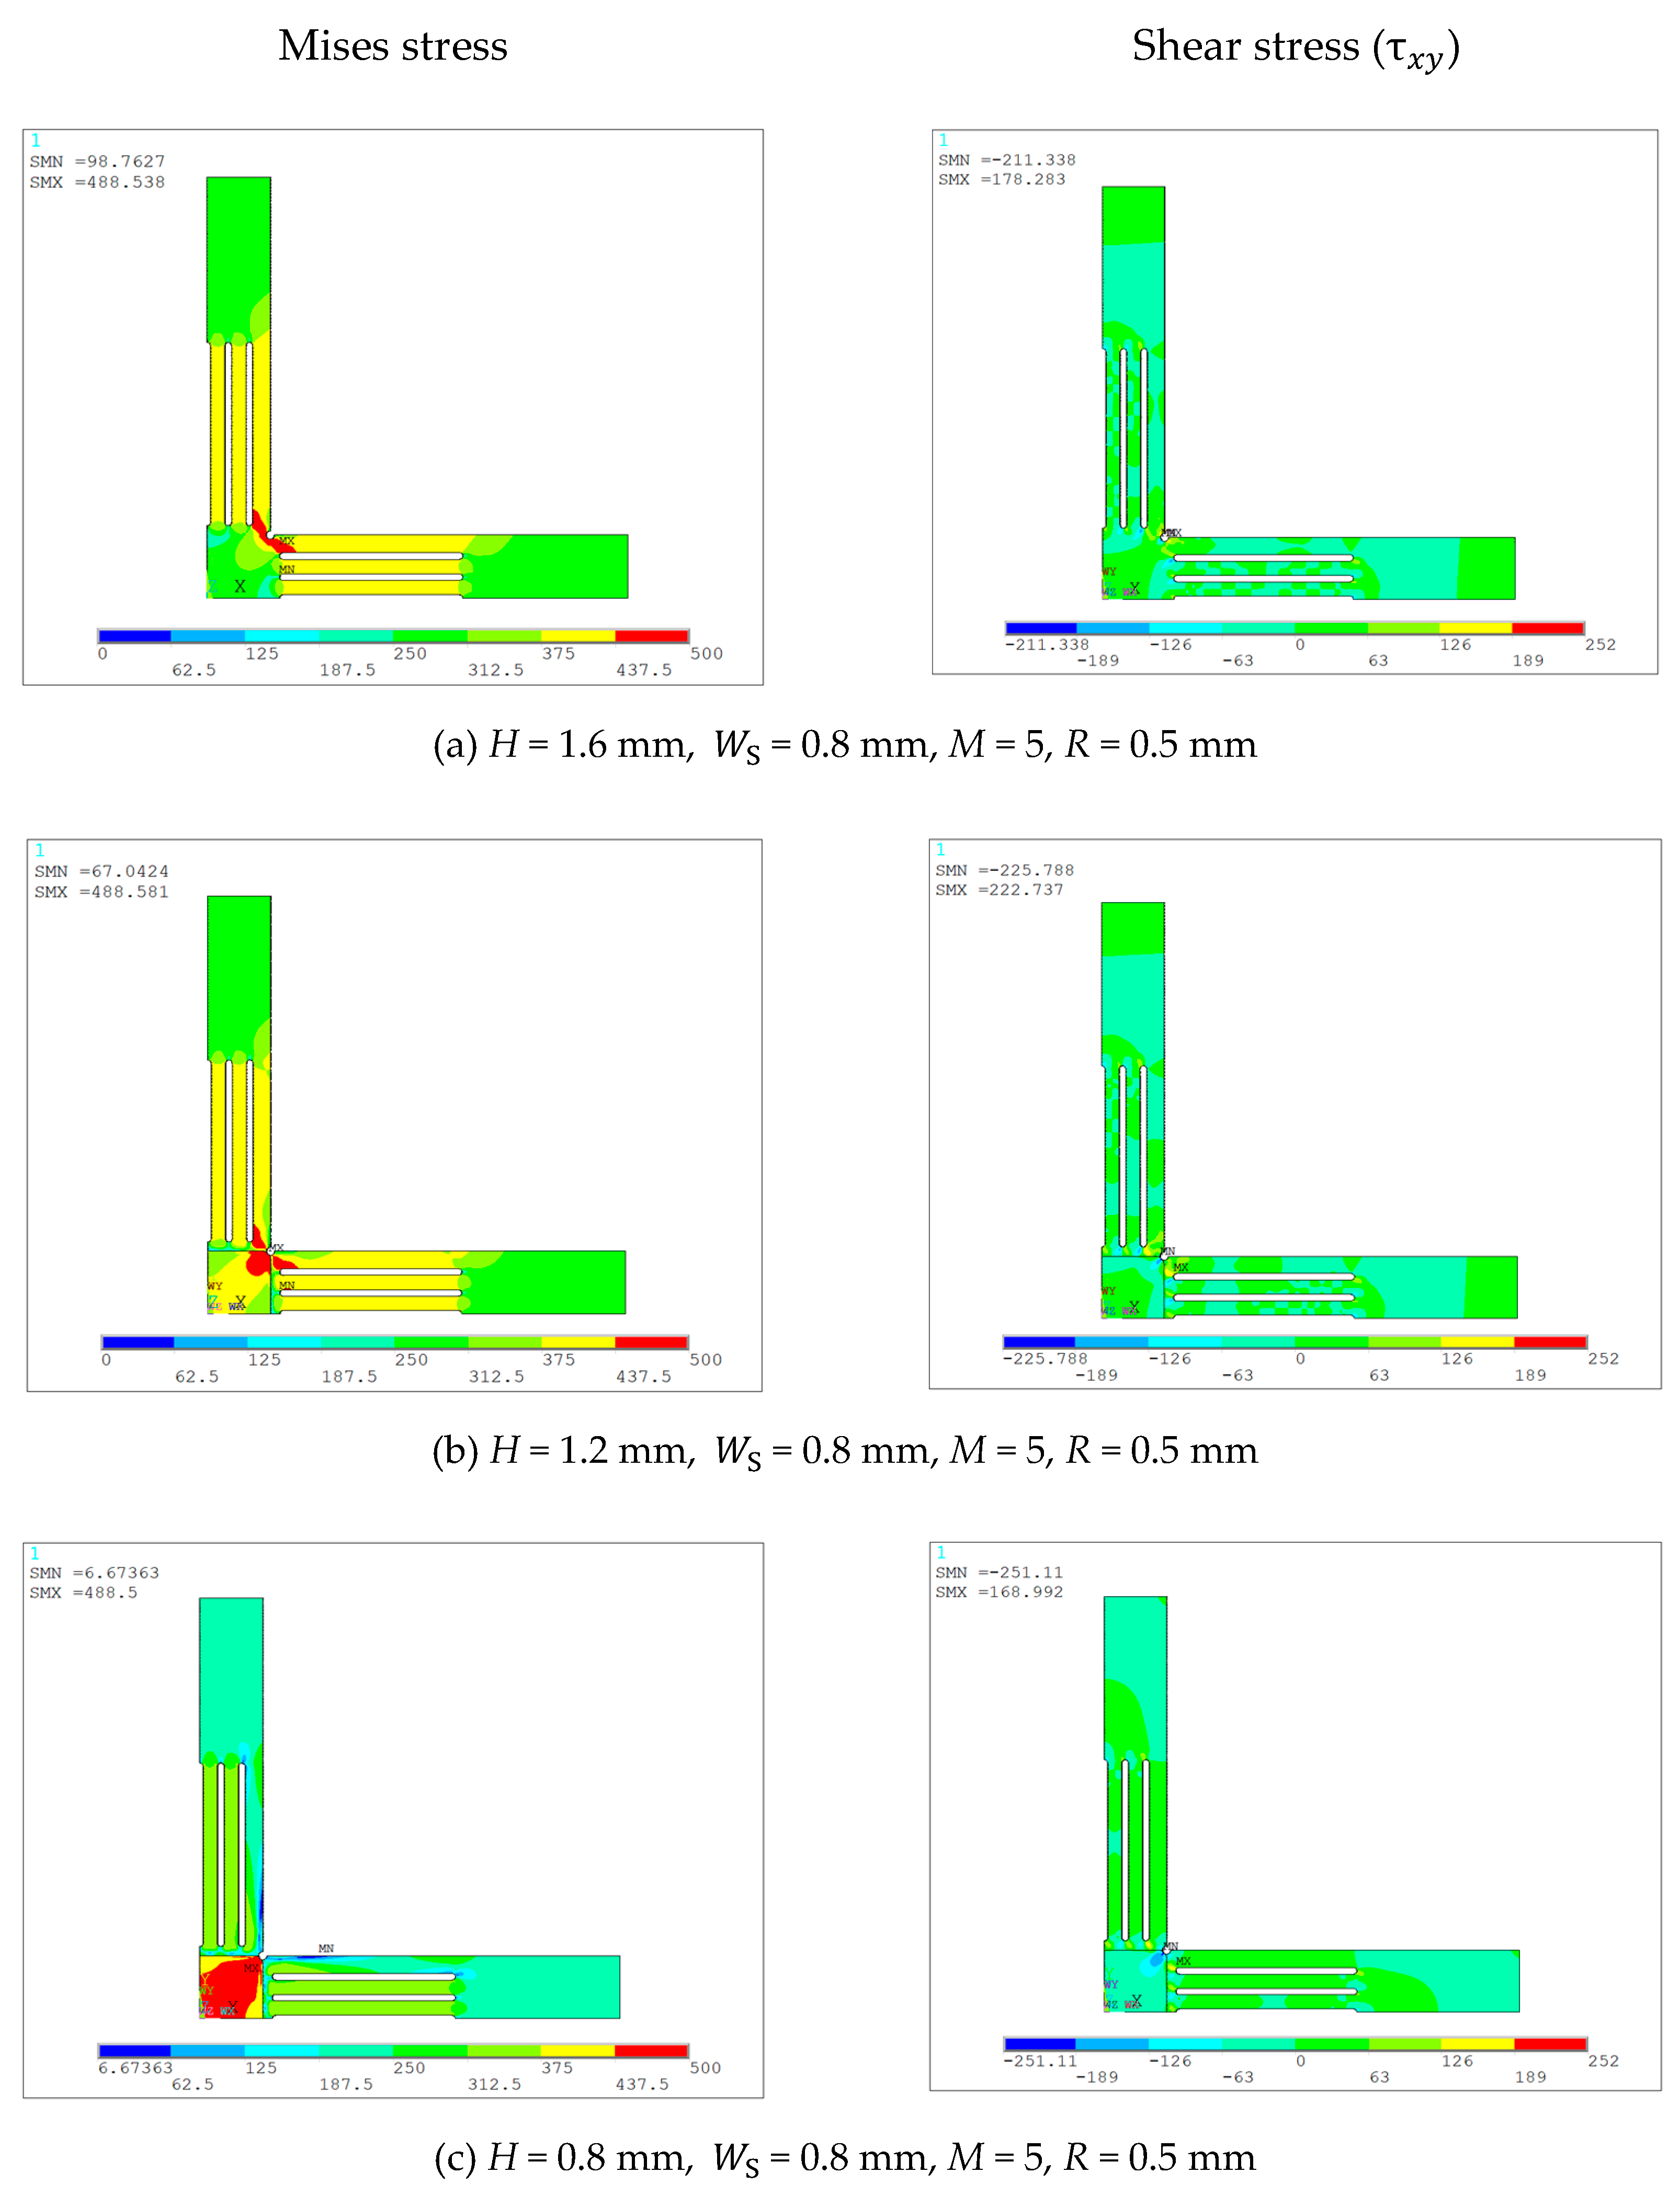
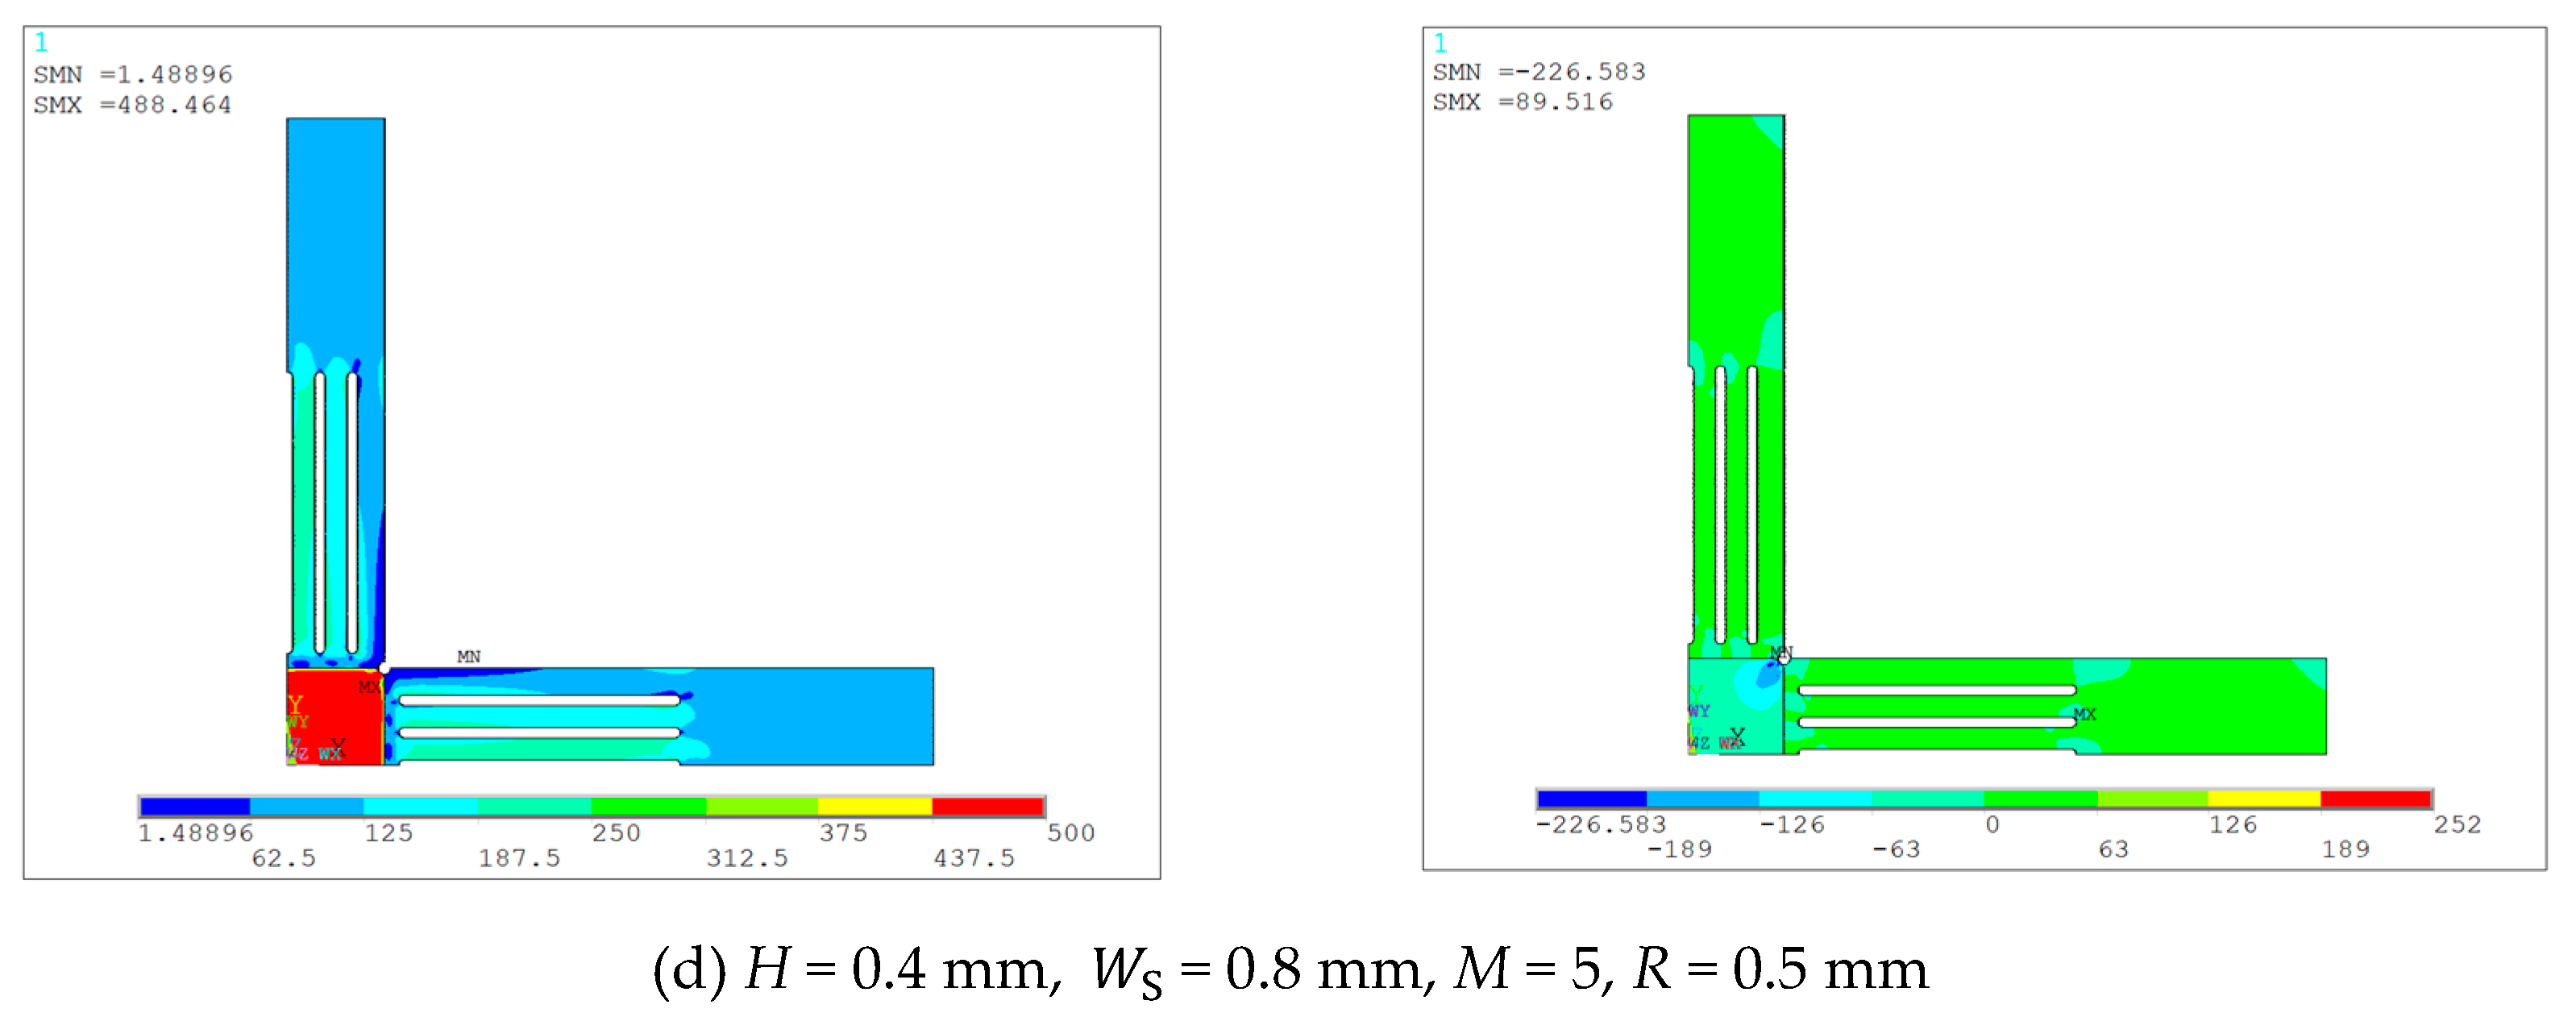
The Mises stress and shear stress distributions calculated by FEM are presented in Figure 10, and the maximum Mises stress on the arms , the maximum Mises stress of the gauge area , the / ratio, and the shear stress of the gauge area are listed in Table 3. With a decrease in the gauge thickness H, the gradually exceeds (Figure 10 and Table 3). When the thickness H is reduced to 0.4 mm, the is much higher than the , and the . This manifests that the maximum deformation indeed occurs in the central gauge area due to a thinning process, leading to a preferential rupture of the gauge. At the same time, the stress concentration at the corner also diminishes. Moreover, with a decreasing gauge thickness H, the negative shear stress of the gauge area almost remains unchanged, while the positive shear stress gradually decreases (Table 3). When H0.4 mm, the positive shear stress is only 50.2% of that in the specimen without a thinning process (H1.6 mm). In addition, a thickness thinning process mainly has a significant influence on the deformation ability of sheet materials, rather than microstructure and mechanical properties [22]. In conclusion, a thinning process is beneficial for preferential rupture of the gauge and the reduced positive shear stress of the specimen.
2.5. Orthogonal Design of Cruciform Specimens
2.5.1. Stress Uniformity in the Central Gauge Region
The homogeneity of biaxial stress in the central gauge receives much attention in test specimen design, and is significantly affected by various geometric parameters, e.g., the thickness of the gauge area, the number of slits made per arm, the width of slits, etc. Here, the concept of “stress uniformity in the central gauge region” is introduced to evaluate the degree of homogeneity of the biaxial stress. In consideration of symmetry, a three-dimensional FEM model of 1/4 of the central gauge region is employed and schematically shown in Figure 11. The gauge center is selected as the starting node, and the remaining five nodes are distributed outwards at constant intervals along the 45° axis. Thus, the stress uniformity in the central region is defined as follows:
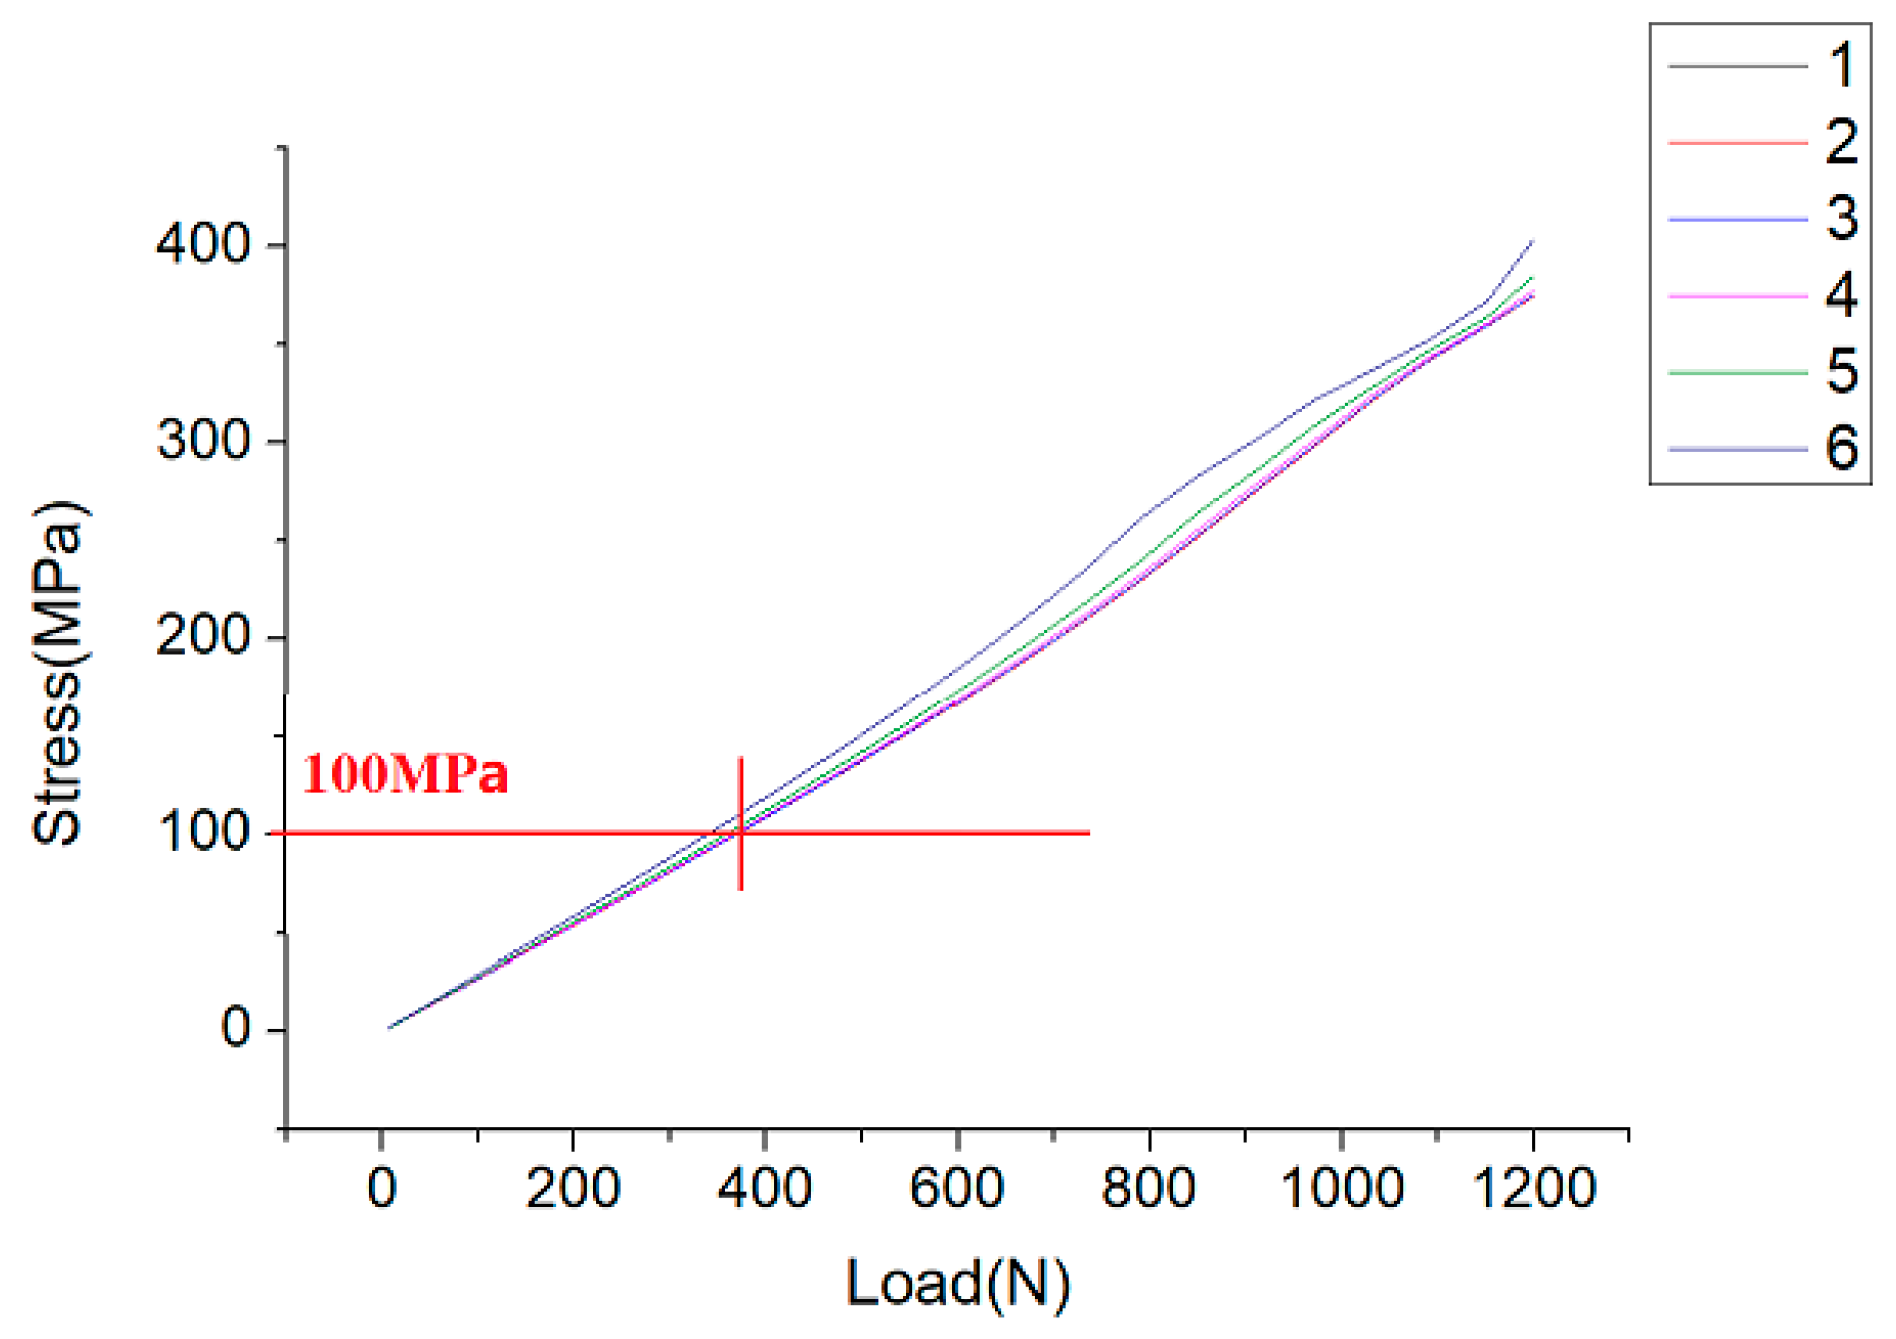
where m is the number of selected reference nodes (m = 6, Figure 11) and is the Mises stress of each reference node. When reaches 100 MPa with an increasing applied stress, the Mises stress of the five remaining nodes (i.e., −) are determined from the calculated Mises stress-load curves (Figure 12). Here, 100 MPa is an artificially defined threshold ensuring that the specimen is subjected to the elastic state.
2.5.2. Orthogonal Design Scheme
The geometric factors considered in this experiment are: the thickness of the central gauge region H, the width of the slit WS, the length of the slit L, the number of slit M, and the radius of the inner chamfer R. The levels of each factor are listed in Table 4. The number of factors and levels are 5 and 4, respectively, thus, the orthogonal table is used.
Taking A1B1C1D1E1 as an example, when the is 100 MPa, the Mises stresses of the remaining five nodes and the γ are determined and given in Table 5.
Similarly, the Mises stress of each node and the of the other test specimens can also be calculated, as listed in Table 6 and Table 7. Furthermore, the degree of the impact of various geometric factors on can be obtained using Statistica software, as exhibited in Figure 13.
As shown in Figure 13, when the thickness of the central gauge area is 0.8 mm (A1), its impact on is the smallest. When the thickness of the central gauge area is 0.2 mm (A4), its impact on is the largest. The impact of other factors on can also be evaluated in the same way. Based on Figure 13a, the specimen A1B4C4D3E1 is found to possess an optimal geometric design, wherein the thickness of the central gauge area is 0.8 mm, the slit width is 0.8 mm, the slit length is 20 mm, the number of slits is five, and the radius of the inner chamfer is 0.5 mm, showing a smallest γ of 1.035 (Table 8) under an applied stress of 100 MPa (Table 6). Similarly, the specimen A1B3C1D3E1 possesses an optimal geometric design (Figure 13b). However, when the thickness of the central gauge area is 0.8 mm (A1), the force required to rupture the corresponding biaxial tensile testing specimen of sheet TA2 exceeds the maximum load (5000 N) of the machine. In addition, the difference in of each specimen at 310 Mpa is obviously less than that at 100 Mpa, the of the specimen at an applied stress of 100 Mpa, thus, should be taken as criterion for geometric design. Therefore, in light of these concerns, the thickness of the central gauge area should be decreased to 0.4 mm. Besides, for the convenience of manufacture, the width and length of the silts should be increased from 0.6 mm (B3) and 5 mm (C1) to 0.8 mm (B4) and 20 mm (C4), respectively, as the impact of these two factors on are quite limited (Figure 13b). Furthermore, the of specimen A3B4C4D3E1 is close to that of the specimen A1B4C4D3E1 (Table 8). Finally, after comprehensive consideration, specimen A3B4C4D3E1 is believed to have the optimal geometric design.
3. Experiment
Conventional methods for strain measurement, e.g., strain gages and video extensometer, are powerless to evaluate the full-field strain distribution of the gauge area; only the average strain can be acquired. Thus, an advanced experimental technique for the full-field strain measurement is absolutely necessary in order to study the strain distribution of the gauge area of a cruciform specimen under biaxial tension. As an advanced experimental technique for the full-field strain measurement, digital image correlation (DIC) technology was originally proposed by Peters and Ranson [23] in the early 1980s. By comparing the speckle images of the gauge surface before and after deformation, the full-field strain of the gauge area can be obtained using a specific algorithm. The DIC technique has been successfully applied in the characterization of local deformation behavior for various materials with heterogeneous microstructure, because of its noncontact characteristic and wide suitability [10].
The cold-rolled annealed sheet TA2 is used for the biaxial tensile testing in the present work, and its chemical composition is given in Table 9.
The full-field strain distribution is determined by the MTI noncontact strain measurement system, based on the DIC technique (Figure 14). The DIC criterion used is the zero-normalized sum of squared differences (ZNSSD), and the subset size is 21 px. The resolution of the camera is five megapixels, using the HF50SA-1 lens produced by FUJIFILM, and the shooting angle is 9.70 (horizontal). A speckle pattern needs be sprayed on the surface of the specimen in order to measure the strain distribution, as shown in Figure 14c. The Gaussian prefiltering method is used to reduce the deviation error of the displacement measurement. Then, a set of filtered images is analyzed by affine shape function and bicubic spline interpolation [24].
The biaxial tensile testing of sheet TA2 was carried out on an in situ biaxial testing machine (IPBF-5000, CARE Measurement & Control Co., Ltd, Tianjin, China), and the load-controlling mode was employed during the loading process. The tensile specimens with three different geometric types are shown in Figure 15.
The combined specimens A4B2C3D1E4, A2B4C3D2E1, and A3B4C4D3E1 were tested experimentally. When the stress in the central region reaches 100 MPa and 310 MPa, respectively, the Mises strain of the specimens is shown in Figure 16.
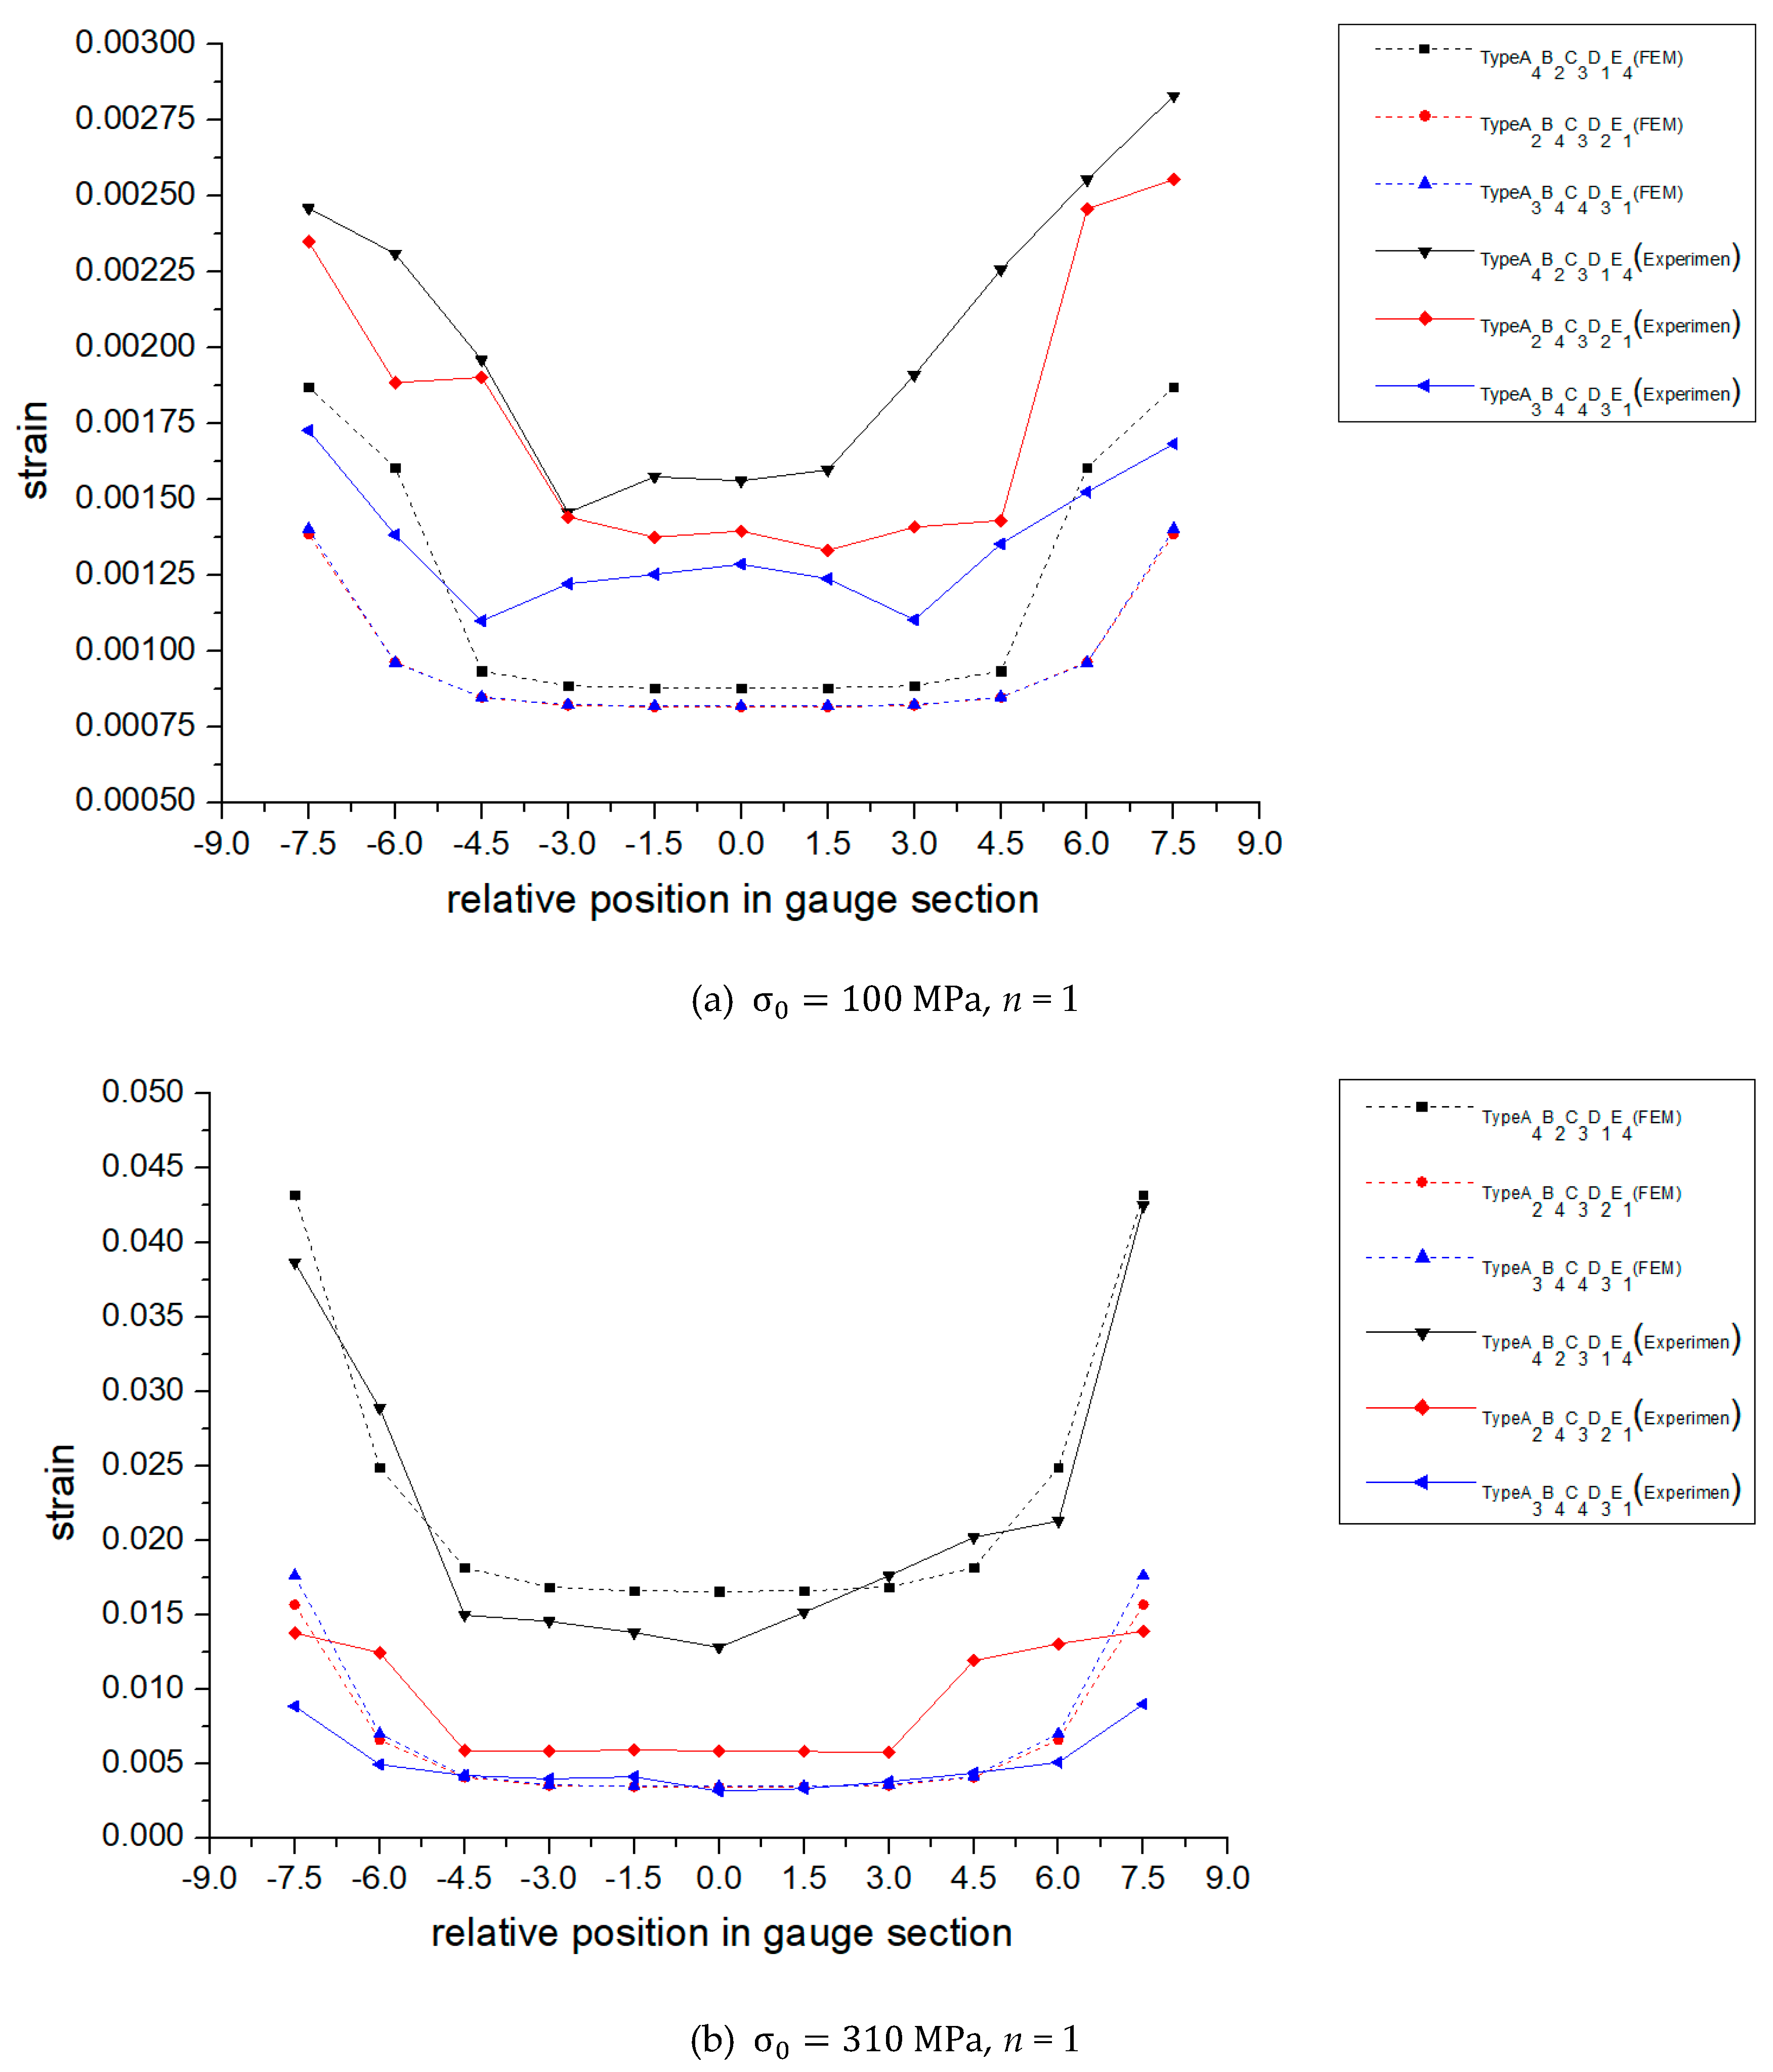
Figure 16 shows that inhomogeneous strains have been accumulated at the corners in all specimens upon loading, implying a developed stress concentration. In fact, this kind of strain concentration at the corners of the gauge area is inevitable, unless the thickness of the gauge area gradually decreases toward the center zone. However, the strain field is quite nonhomogeneous in the thickness-tapered specimen, and the corresponding ultimate strength is difficult to determine due to the varying thickness of the gauge area. In this work, these experimental results are in line with those of FEM. Moreover, due to the anisotropic properties of sheet TA2 and the inevitable manufacturing error, the strain distributions are not ideally symmetric. For instance, as the thickness of the central gauge area is only 0.2 mm in specimen A4B2C3D1E4, a lot of traces generated during the milling process would have a significant effect on the symmetry of the strain distribution, especially at the junctions of arms to the central gauge area. It is of great significance to note that the full-field strain distributions presented in Figure 16 verify that specimen A3B4C4D3E1 displays an optimal stress uniformity in the central gauge area. Based on the full-filled strain distributions (Figure 16), the strain distribution of each specimen along the 45° axis are determined and shown in Figure 17, including those obtained from FEM for comparison. In the present work, in order to reduce the effect of stress concentration at the corner, the strain field within the center square area of 10 × 10 mm2 was evaluated. For the strain distributions obtained from experiments and FEM, their variations exhibit an identical trend for various specimens, where only minor differences exist in the strain levels. Obviously, specimen A3B4C4D3E1 has the best strain uniformity, specimen A2B4C3D2E1 is the second, and specimen A4B2C3D1E4 is the third (Figure 17). In addition, the strain levels of the area closing to the corners are relatively higher due to the existing stress concentration at the corners. The strain level of specimen A4B2C3D1E4 is higher than those of the other two specimens (Figure 17). The radius of the inner chamfer in specimen A4B2C3D1E4 is the largest (2 mm), leading a smallest effective area of the central gauge. As a result, the same load applied on the arm will generate a largest stress level in specimen A4B2C3D1E4, resulting in the largest strain level. Furthermore, the issue about the effective area of the central gauge in cruciform specimens deserves further investigations in the future. In brief, specimen A3B4C4D3E1 displays a favorable combination of various geometric factors.
4. Conclusions
The geometric design of a miniaturized biaxial tensile testing specimen of sheet TA2 has been systematically investigated. The main results of this work are summarized below:
- (1)
- An inner chamfer is introduced to the design of the cruciform specimen, which is effective in contributing to a reduced degree of stress concentration and a more homogeneous stress distribution in the center region, resulting in a decreased of 1.77.
- (2)
- The plastic flow can be effectively restricted in the center region of the cruciform specimen via the thinning process. As the thicknesses of the center gauge and the arm are 0.4 and 1.6 mm, respectively, the is less than 1, avoiding the preferential rupture of the arm during the biaxial tensile testing.
- (3)
- According to the results of orthogonal design, with the attendant comprehensive analysis, an optimal geometric design has been successfully attained for the cruciform specimen, in which the thickness of the central gauge region, the width, the length and the number of slits, and the radius of the inner chamfer are 0.4 mm, 0.8 mm, 20 mm, five, and 0.5 mm, respectively.
- (4)
- The full-field strain distribution of the center region for the cruciform specimen has been measured using the advanced DIC technique and is well in line with the results computed by FEM. The validity of the design method of this paper is verified.
- (5)
- This work reports a promising methodology for optimizing the geometry of a miniaturized cruciform specimen of sheet TA2 that shows great potential in the design of specimens for biaxial tensile testing of other sheet metals.
Author Contributions
Conceptualization, Z.Z. and X.H.; methodology, Z.Z.; software, Z.Z.; validation, Z.Z., C.Z. and X.H.; formal analysis, Z.Z.; investigation, Z.Z. and Z.L.; resources, W.F.; data curation, P.Z.; writing—original draft preparation, Z.Z.; writing-review and editing, X.H.; visualization, Z.L.; supervision, C.Z.; project administration, X.H.
Funding
This research was funded by National Natural Science Foundation of China (grant numbers 51675260 and 51475223). And the APC was funded by National Natural Science Foundation of China.
Conflicts of Interest
The authors declare no conflict of interest.
References
- Banerjee, D.; Williams, J.C. Perspectives on Titanium Science and Technology. Acta Mater. 2013, 61, 844–879. [Google Scholar] [CrossRef]
- Ye, H.D. Some Considerations on Tensile Testing Standard of Metallic Materials. Phys. Test. Chem. Anal. 2014, 50, 394–395. [Google Scholar]
- Xiao, R.; Li, X.X.; Li, R.F.; Chen, Y.K.; Ge, Y.L.; Yang, Y.F. Biaxial Tensile Testing of Cruciform Specimens. Phys. Test. Chem. Anal. 2017, 5308, 538–543. [Google Scholar]
- Shiratori, E.; Ikegami, K. A new biaxial tensile testing machine with flat specimen. Bull. Tokyo Inst. Technol. 1967, 82, 105–118. [Google Scholar]
- Shiratori, E.; Ikegami, K. Experimental study of the subsequent yield surface by using cross-shaped specimens. J. Mech. Phys. Solids 1968, 16, 373–394. [Google Scholar] [CrossRef]
- Lebedev, A.A.; Boiko, A.V.; Muzyka, N.R. Method of testing materials in uniform biaxial tension. Strength Mater. 1982, 14, 252–254. [Google Scholar]
- Lebedev, A.A.; Muzyka, N.R. Design of cruciform specimens for fracture toughness tests in biaxial tension (Review). Strength Mater. 1998, 30, 243–254. [Google Scholar] [CrossRef]
- Makinde, A.; Thibodeau, L.; Neale, K.W. Development of an apparatus for biaxial testing using cruciform specimens. Exp. Mech. 1992, 32, 138–144. [Google Scholar] [CrossRef]
- ISO/CD 16842. Metallic Materials—Sheet and Strip—Biaxial Tensile Testing Method Using Cruciform Specimen; ISO: Geneva, Switzerland, 2014. [Google Scholar]
- Smits, A.; Van Hemelrijck, D.; Philippidis, T.; Cardon, A. Design of a cruciform specimen for biaxial testing of fibre reinforced composite laminates. Compos. Sci. Technol. 2006, 66, 964–975. [Google Scholar] [CrossRef]
- Teaca, M.; Charpentier, I.; Martiny, M.; Ferron, G. Identification of sheet metal plastic anisotropy using heterogeneous biaxial tensile tests. Int. J. Mech. Sci. 2010, 52, 572–580. [Google Scholar] [CrossRef]
- Hu, J.J.; Chen, G.W.; Liu, Y.C.; Hsu, S.S. Influence of Specimen Geometry on the Estimation of the Planar Biaxial Mechanical Properties of Cruciform Specimens. Exp. Mech. 2014, 54, 615–631. [Google Scholar] [CrossRef]
- Tiernan, P.; Hannon, A. Design optimisation of biaxial tensile test specimen using finite element analysis. Int. J. Mater. Form. 2014, 7, 117–123. [Google Scholar] [CrossRef]
- Deng, N.; Kuwabara, T.; Korkolis, Y.P. Cruciform Specimen Design and Verification for Constitutive Identification of Anisotropic Sheets. Exp. Mech. 2015, 55, 1005–1022. [Google Scholar] [CrossRef]
- Xiao, R.; Li, X.X.; Lang, L.H.; Chen, Y.K.; Yang, Y.F. Biaxial tensile testing of cruciform slim superalloy at elevated temperatures. Mater. Des. 2016, 94, 286–294. [Google Scholar] [CrossRef]
- Xiao, R.; Li, X.X.; Lang, L.H.; Song, Q.; Liu, K.N. Forming limit in thermal cruciform biaxial tensile testing of titanium alloy. J. Mater. Process. Technol. 2017, 240, 354–361. [Google Scholar] [CrossRef]
- Wu, X.D.; Wan, M.; Zhou, X.B.; Chen, G.P. Biaxial tensile experimental study on the yield loci of steel sheet BH220. J. Plast. Eng. 2004, 1, 39–42. [Google Scholar]
- Wan, M.; Hong, Q.; Wu, X.D.; Zhou, X.B. Establishment and Loading Accuracy Analysis of Bidirectional Deep Drawing Test System for Cruciform Specimens. Chin. J. Mech. Eng. 2001, 1, 57–62. [Google Scholar] [CrossRef]
- Wu, X.D.; Wan, M.; Zhou, X.B. Finite element simulation and analysis of cross biaxial tension test. Chin. J. Plast. Eng. 2001, 2, 57–59. [Google Scholar]
- Han, F.; Wan, M.; Wu, X.D.; Wang, H.B. Design of Cross Bi-directional Tensile Specimens Based on Ultimate Stress Analysis. J. Beijing Univ. Aeronaut. Astronaut. 2007, 5, 600–604. [Google Scholar]
- Han, F.; Wan, M.; Wu, X.D.; Wang, H.B. Study on Tensile Properties of Cruciform Specimens with Thinned Center Area. J. Plast. Eng. 2007, 6, 55–58. [Google Scholar]
- Hong, Q. The Optimal Design of Biaxial Tensile Cruciform Specimens Using Finite Element Method. Unpublished MA dissertation, Beihang University, Beijing, China, 2000. [Google Scholar]
- Peters, W.H.; Ranson, W.F. Digital Imaging Techniques in Experimental Stress Analysis. Opt. Eng. 1982, 21, 213427. [Google Scholar] [CrossRef]
- Sun, P.Y.; Zhu, Z.K.; Su, C.Y.; Lu, L.; Zhou, C.Y.; He, X.H. Experimental characterisation of mechanical behaviour for a TA2 welded joint using digital image correlation. Opt. Lasers Eng. 2019, 115, 161–171. [Google Scholar] [CrossRef]
Figure 1.
True stress-strain curve for TA2.

Figure 2.
Geometric shapes of the cruciform specimens. (a) Chamfer, (b) center thinning, (c) open slit on arm.
Figure 2.
Geometric shapes of the cruciform specimens. (a) Chamfer, (b) center thinning, (c) open slit on arm.

Figure 3.
Diagram of the corner shape at the junctions of arms to the gauge area. (a) Outer chamfer, (b) inner chamfer.
Figure 3.
Diagram of the corner shape at the junctions of arms to the gauge area. (a) Outer chamfer, (b) inner chamfer.

Figure 4.
Shape and dimensions of the designed test specimen (unit: mm).

Figure 5.
Illustration of the finite element model for specimen type D.

Figure 6.
Horizontal stress distribution in specimens type A, B, C, and D (n0, 200 MPa).

Figure 7.
Mises stress distribution of specimen types A, B, C, and D (n = 1, = 200 MPa).


Figure 8.
Mises stress distribution varying with n in specimen type D (= 200 MPa).


Figure 9.
as a function of the n values under different applied stresses.

Figure 10.
The distributions of Mises stress and shear stress of the specimens with various thickness of gauge (n = 1, = 300 MPa). Here, and M refers to the slit width and the number of slits, respectively.
Figure 10.
The distributions of Mises stress and shear stress of the specimens with various thickness of gauge (n = 1, = 300 MPa). Here, and M refers to the slit width and the number of slits, respectively.


Figure 11.
Location of nodes.

Figure 12.
Mises stress-load curves of six nodes of the specimen.

Figure 13.
The influence of various factors on under different applied stresses: (a) 100 MPa, (b) 310 MPa.
Figure 13.
The influence of various factors on under different applied stresses: (a) 100 MPa, (b) 310 MPa.

Figure 14.
DIC system for biaxial tensile testing.

Figure 15.
The specimen with various geometric types for biaxial tensile testing.

Figure 16.
The full-field strain distributions obtained using DIC technology of the specimens with various types: (a–c) , n = 1, (d–f) , n = 1.
Figure 16.
The full-field strain distributions obtained using DIC technology of the specimens with various types: (a–c) , n = 1, (d–f) , n = 1.

Figure 17.
The Mises strain distributions along the diagonal line in the three cruciform geometries. The results of FEM are presented for comparison.
Figure 17.
The Mises strain distributions along the diagonal line in the three cruciform geometries. The results of FEM are presented for comparison.


Table 1.
for Type A, B, C, and D specimens (n = 1, = 200 MPa).
| Specimens | |||
|---|---|---|---|
| Type A | 320.5 | 152.8 | 2.10 |
| Type B | 304.6 | 147.2 | 2.07 |
| Type C | 291.1 | 141.8 | 2.05 |
| Type D | 342.8 | 193.9 | 1.76 |
Table 2.
The of type A, B, C, and D specimens (n = 1, = 200 MPa).
| Specimens | |||
|---|---|---|---|
| Type A | 345.6 | 152.9 | 2.26 |
| Type B | 327.2 | 147.2 | 2.22 |
| Type C | 313.3 | 141.8 | 2.21 |
| Type D | 342.4 | 193.9 | 1.77 |
Table 3.
,,/, and of the specimens with various gauge thickness (n = 1, = 300 MPa).
| Specimens | ||||
|---|---|---|---|---|
| H = 1.6 mm | 421.8 | 284.8 | 1.48 | −211.3178.3 |
| H = 1.2 mm | 422.1 | 385.4 | 1.10 | −225.8222.7 |
| H = 0.8 mm | 335.3 | 454.8 | 0.70 | −251.1169.0 |
| H = 0.4 mm | 170.6 | 451.1 | 0.40 | −226.689.5 |
Table 4.
The levels of each geometric factor.
| Levels | A | B | C | D | E |
|---|---|---|---|---|---|
| Central Gauge Region Thickness H (mm) | (mm) | Slit Length L (mm) | Number of Slit M | Radius of the Inner Chamfer R (mm) | |
| Level 1 | 0.8 | 0.2 | 5 | 1 | 0.5 |
| Level 2 | 0.6 | 0.4 | 10 | 3 | 1 |
| Level 3 | 0.4 | 0.6 | 15 | 5 | 1.5 |
| Level 4 | 0.2 | 0.8 | 20 | 7 | 2 |
Table 5.
The Mises stress of each node and the γ for specimen A1B1C1D1E1.
| Node Number n | 1 | 2 | 3 | 4 | 5 | 6 |
|---|---|---|---|---|---|---|
| Mises stress(MPa) | 100.0 | 100.0 | 100.2 | 100.9 | 103.1 | 109.2 |
| 1.046 | ||||||
Table 6.
Orthogonal table and simulation results (100 MPa).
| Test Numbers | Factors | Experimental Scheme | |||||
|---|---|---|---|---|---|---|---|
| A | B | C | D | E | |||
| 1 | 1 | 1 | 1 | 1 | 1 | 1.046 | A1B1C1D1E1 |
| 2 | 1 | 2 | 2 | 2 | 2 | 1.067 | A1B2C2D2E2 |
| 3 | 1 | 3 | 3 | 3 | 3 | 1.091 | A1B3C3D3E3 |
| 4 | 1 | 4 | 4 | 4 | 4 | 1.097 | A1B4C4D4E4 |
| 5 | 2 | 1 | 2 | 3 | 4 | 1.127 | A2B1C2D3E4 |
| 6 | 2 | 2 | 1 | 4 | 3 | 1.096 | A2B2C1D4E3 |
| 7 | 2 | 3 | 4 | 1 | 2 | 1.064 | A2B3C4D1E2 |
| 8 | 2 | 4 | 3 | 2 | 1 | 1.048 | A2B4C3D2E1 |
| 9 | 3 | 1 | 3 | 4 | 2 | 1.083 | A3B1C3D4E2 |
| 10 | 3 | 2 | 1 | 3 | 1 | 1.051 | A3B2C1D3E1 |
| 11 | 3 | 3 | 4 | 2 | 4 | 1.141 | A3B3C4D2E4 |
| 12 | 3 | 4 | 2 | 1 | 3 | 1.120 | A3B4C2D1E3 |
| 13 | 4 | 1 | 4 | 2 | 3 | 1.104 | A4B1C4D2E3 |
| 14 | 4 | 2 | 3 | 1 | 4 | 1.145 | A4B2C3D1E4 |
| 15 | 4 | 3 | 2 | 4 | 1 | 1.073 | A4B3C2D4E1 |
| 16 | 4 | 4 | 1 | 3 | 2 | 1.075 | A4B4C1D3E2 |
Table 7.
Orthogonal table and simulation results (310 MPa).
| Test Numbers | Factors | Experimental Scheme | |||||
|---|---|---|---|---|---|---|---|
| A | B | C | D | E | |||
| 1 | 1 | 1 | 1 | 1 | 1 | 1.035 | A1B1C1D1E1 |
| 2 | 1 | 2 | 2 | 2 | 2 | 1.044 | A1B2C2D2E2 |
| 3 | 1 | 3 | 3 | 3 | 3 | 1.044 | A1B3C3D3E3 |
| 4 | 1 | 4 | 4 | 4 | 4 | 1.035 | A1B4C4D4E4 |
| 5 | 2 | 1 | 2 | 3 | 4 | 1.040 | A2B1C2D3E4 |
| 6 | 2 | 2 | 1 | 4 | 3 | 1.044 | A2B2C1D4E3 |
| 7 | 2 | 3 | 4 | 1 | 2 | 1.037 | A2B3C4D1E2 |
| 8 | 2 | 4 | 3 | 2 | 1 | 1.044 | A2B4C3D2E1 |
| 9 | 3 | 1 | 3 | 4 | 2 | 1.043 | A3B1C3D4E2 |
| 10 | 3 | 2 | 1 | 3 | 1 | 1.037 | A3B2C1D3E1 |
| 11 | 3 | 3 | 4 | 2 | 4 | 1.035 | A3B3C4D2E4 |
| 12 | 3 | 4 | 2 | 1 | 3 | 1.046 | A3B4C2D1E3 |
| 13 | 4 | 1 | 4 | 2 | 3 | 1.044 | A4B1C4D2E3 |
| 14 | 4 | 2 | 3 | 1 | 4 | 1.064 | A4B2C3D1E4 |
| 15 | 4 | 3 | 2 | 4 | 1 | 1.039 | A4B3C2D4E1 |
| 16 | 4 | 4 | 1 | 3 | 2 | 1.034 | A4B4C1D3E2 |
Table 8.
The of selected specimens (100 MPa).
| Specimen | A1B4C4D3E1 | A3B4C4D3E1 |
|---|---|---|
| 1.035 | 1.040 |
Table 9.
Chemical composition of sheet TA2 (wt. %).
| Fe | C | N | H | O | Al | V | Ti |
|---|---|---|---|---|---|---|---|
| 0.061 | 0.028 | 0.006 | 0.002 | 0.087 | - | - | 99.816 |
© 2019 by the authors. Licensee MDPI, Basel, Switzerland. This article is an open access article distributed under the terms and conditions of the Creative Commons Attribution (CC BY) license (http://creativecommons.org/licenses/by/4.0/).
Share and Cite
MDPI and ACS Style
Zhu, Z.; Lu, Z.; Zhang, P.; Fu, W.; Zhou, C.; He, X. Optimal Design of a Miniaturized Cruciform Specimen for Biaxial Testing of TA2 Alloys. Metals 2019, 9, 823. https://doi.org/10.3390/met9080823
AMA Style
Zhu Z, Lu Z, Zhang P, Fu W, Zhou C, He X. Optimal Design of a Miniaturized Cruciform Specimen for Biaxial Testing of TA2 Alloys. Metals. 2019; 9(8):823. https://doi.org/10.3390/met9080823
Chicago/Turabian StyleZhu, Zhikang, Zheng Lu, Peng Zhang, Wei Fu, Changyu Zhou, and Xiaohua He. 2019. "Optimal Design of a Miniaturized Cruciform Specimen for Biaxial Testing of TA2 Alloys" Metals 9, no. 8: 823. https://doi.org/10.3390/met9080823
Note that from the first issue of 2016, this journal uses article numbers instead of page numbers. See further details here.