Enhanced Corrosion Resistance of SA106B Low-Carbon Steel Fabricated by Rotationally Accelerated Shot Peening

1
Collaborative Innovation Center of Steel Technology, University of Science and Technology Beijing, Beijing 100083, China
2
Nano and Heterogeneous Materials Center, School of Materials Science and Engineering, Nanjing University of Science and Technology, Nanjing 210094, China
*
Author to whom correspondence should be addressed.
Metals 2019, 9(8), 872; https://doi.org/10.3390/met9080872
Submission received: 29 May 2019
/
Revised: 19 July 2019
/
Accepted: 2 August 2019
/
Published: 8 August 2019
(This article belongs to the Special Issue Advances in Low-carbon and Stainless Steels)
Abstract
:The corrosion resistance of a SA106B carbon steel with a gradient nanostructure fabricated by rotationally accelerated shot peening (RASP) for 5, 10, 15 and 20 min was investigated. Electrochemical tests were carried out in the 0.05 M H2SO4 + 0.05 M Na2SO4 and 0.2 M NaCl + 0.05 M Na2SO4 solutions. The experimental results showed that the sample RASP-processed for 5 min exhibited the best corrosion resistance among them. TEM analysis confirmed that the cementite dissolution and formation of nanograins, which improved the corrosion resistance of the steel. Prominent micro-cracks and holes were produced in the samples when the RASP was processed for more than 5 min, resulting in the decrease of corrosion resistance.
1. Introduction
Nanocrystalline (NC) metallic materials have a high-strength without sacrificing toughness and ductility [1,2,3,4,5]. In general, a NC metallic layer with a certain thickness has often been utilized to improve the environmental service behavior [6,7]. The rotationally accelerated shot peening (RASP) technique can produce nanograins due to the generation of defects and interfaces (grain boundaries), the increasing of polycrystalline free energy, and the inducing of grain refinement, through the application of high strains at high strain rates [8,9,10,11]. The material exhibits unique mechanical and corrosion properties on account of strengthening the metal surface with the high density nanocrystals and interfaces.
Recently, some researchers have studied the corrosion mechanism of the surface nanocrystallization material. For instance, Balusamy et al. [12] studied whether, or not, the surface changes had a direct impact on the electrochemical activity of the metallic materials. The grain boundaries and the matrix structure formed numerous tiny electrochemical cells. Ye et al. [13] proposed that nanocrystalline 309 stainless steel (SS) by a DC magnetron sputtering exhibited different corrosion resistance changes in different solutions. Huang et al. [14] reported that the surface mechanical attrition treatment induced grain refinement and dislocations, had positive effects on the corrosion behavior of the Ti-25Nb-3Mo-3Zr-2Sn alloy, annealing experimental results further indicated that the improved corrosion resistance was mainly due to the grain refinement. Li et al. [15] reported that the effect of the grain size on the corrosion resistance of a NC low-carbon steel fabricated through an ultrasonic shot peening technique in a 0.05 M H2SO4 + 0.05 M Na2SO4 solution. When grain size was less than 35 nm, the corrosion rate increased as grain size decreased. They understood this was attributed to the increased number of the active sites caused by surface nanocrystallized low-carbon steel. Zhang et al. [16] found that in a saturated Ca(OH)2 solution with and without Cl−, the micro-cracks in the surface layer of the supersonic fine-particles (about 3 μm) bombarding the low-carbon steel did not degrade its passivity properties and pitting resistance. The interesting work of Chen et al. [17] proposed that stainless steel having underwent the RASP process showed a good corrosion resistance. However, the corrosion mechanisms of the nano-carbon steel and nano-stainless steel were very different. Normally, we think that surface nanocrystalline may worsen corrosion. In contrast, we found corrosion resistance performance of carbon steel increased after the RASP. The influence of RASP on the corrosion behavior of the carbon steel will be discussed below.
The RASP is a newly developed surface nanocrystallization technology for fabricating gradient structure with the grain size varying from nanometer to micrometer without changing the overall chemical compositions of a carbon steel. SA106B low-carbon steel after the RASP has excellent mechanical and corrosion properties, making them ideal for the secondary loop in a nuclear power plant to reduce the flow-accelerated corrosion. In this work, the surface nanocrystallization SA106B carbon steel was fabricated by RASP. The influence of the RASP on the corrosion behavior of the carbon steel has been investigated.
2. Experimental Procedures
2.1. Material
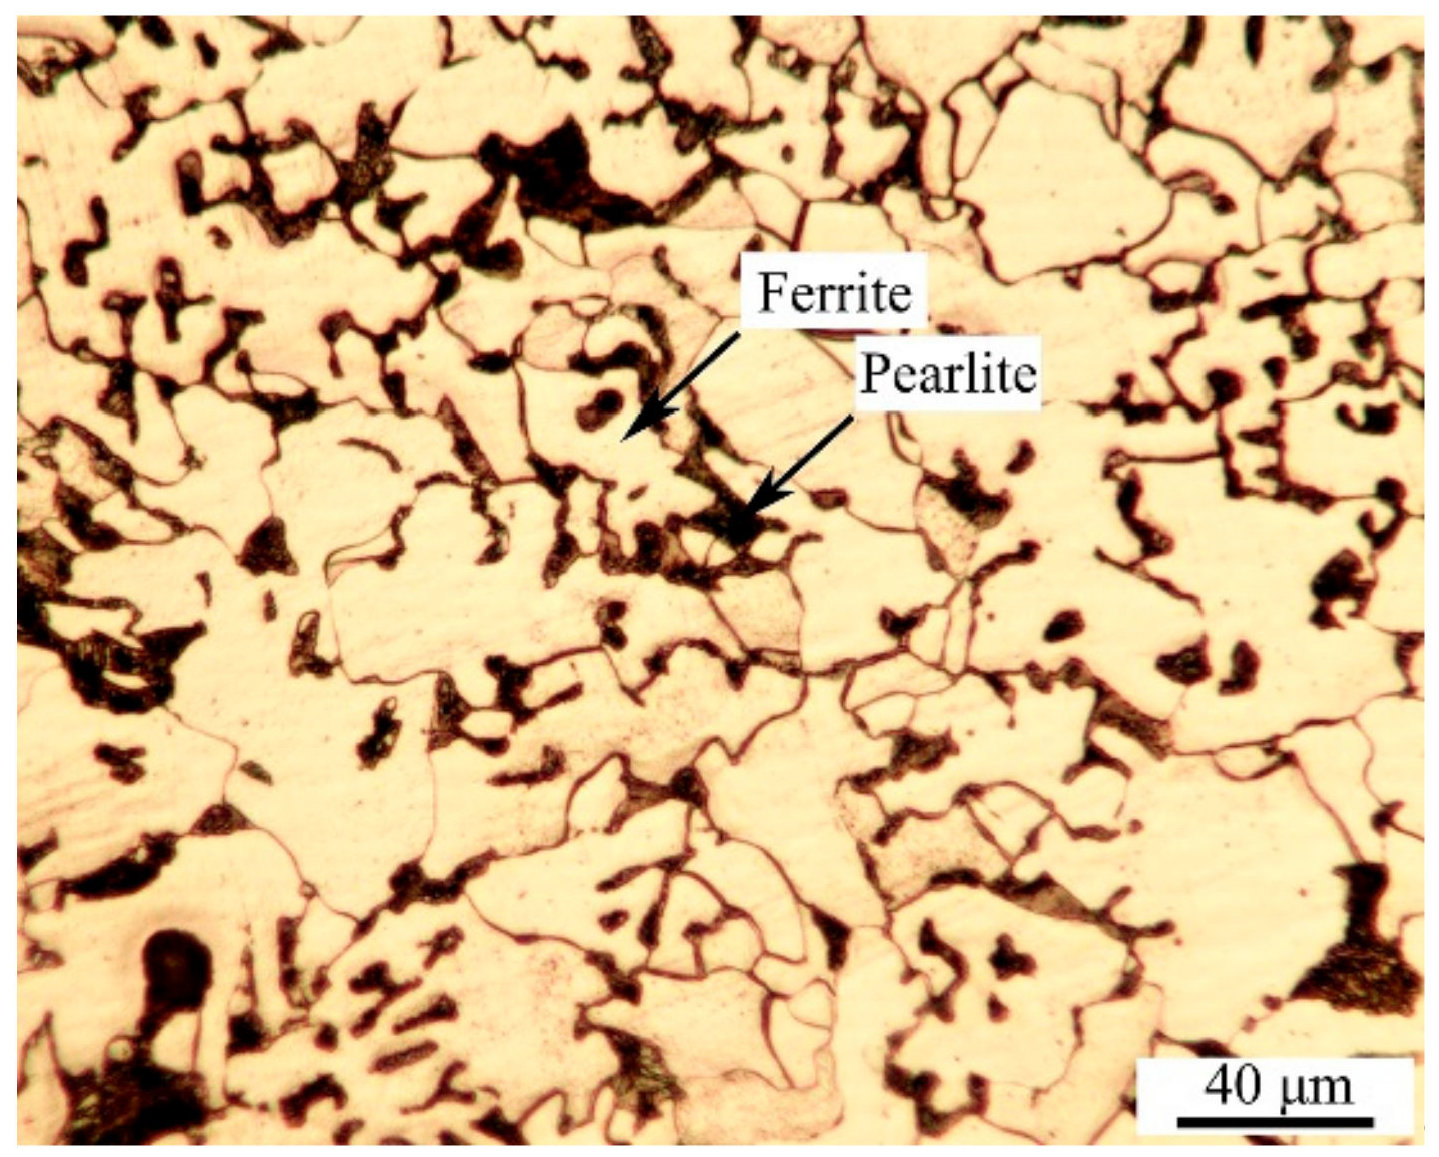
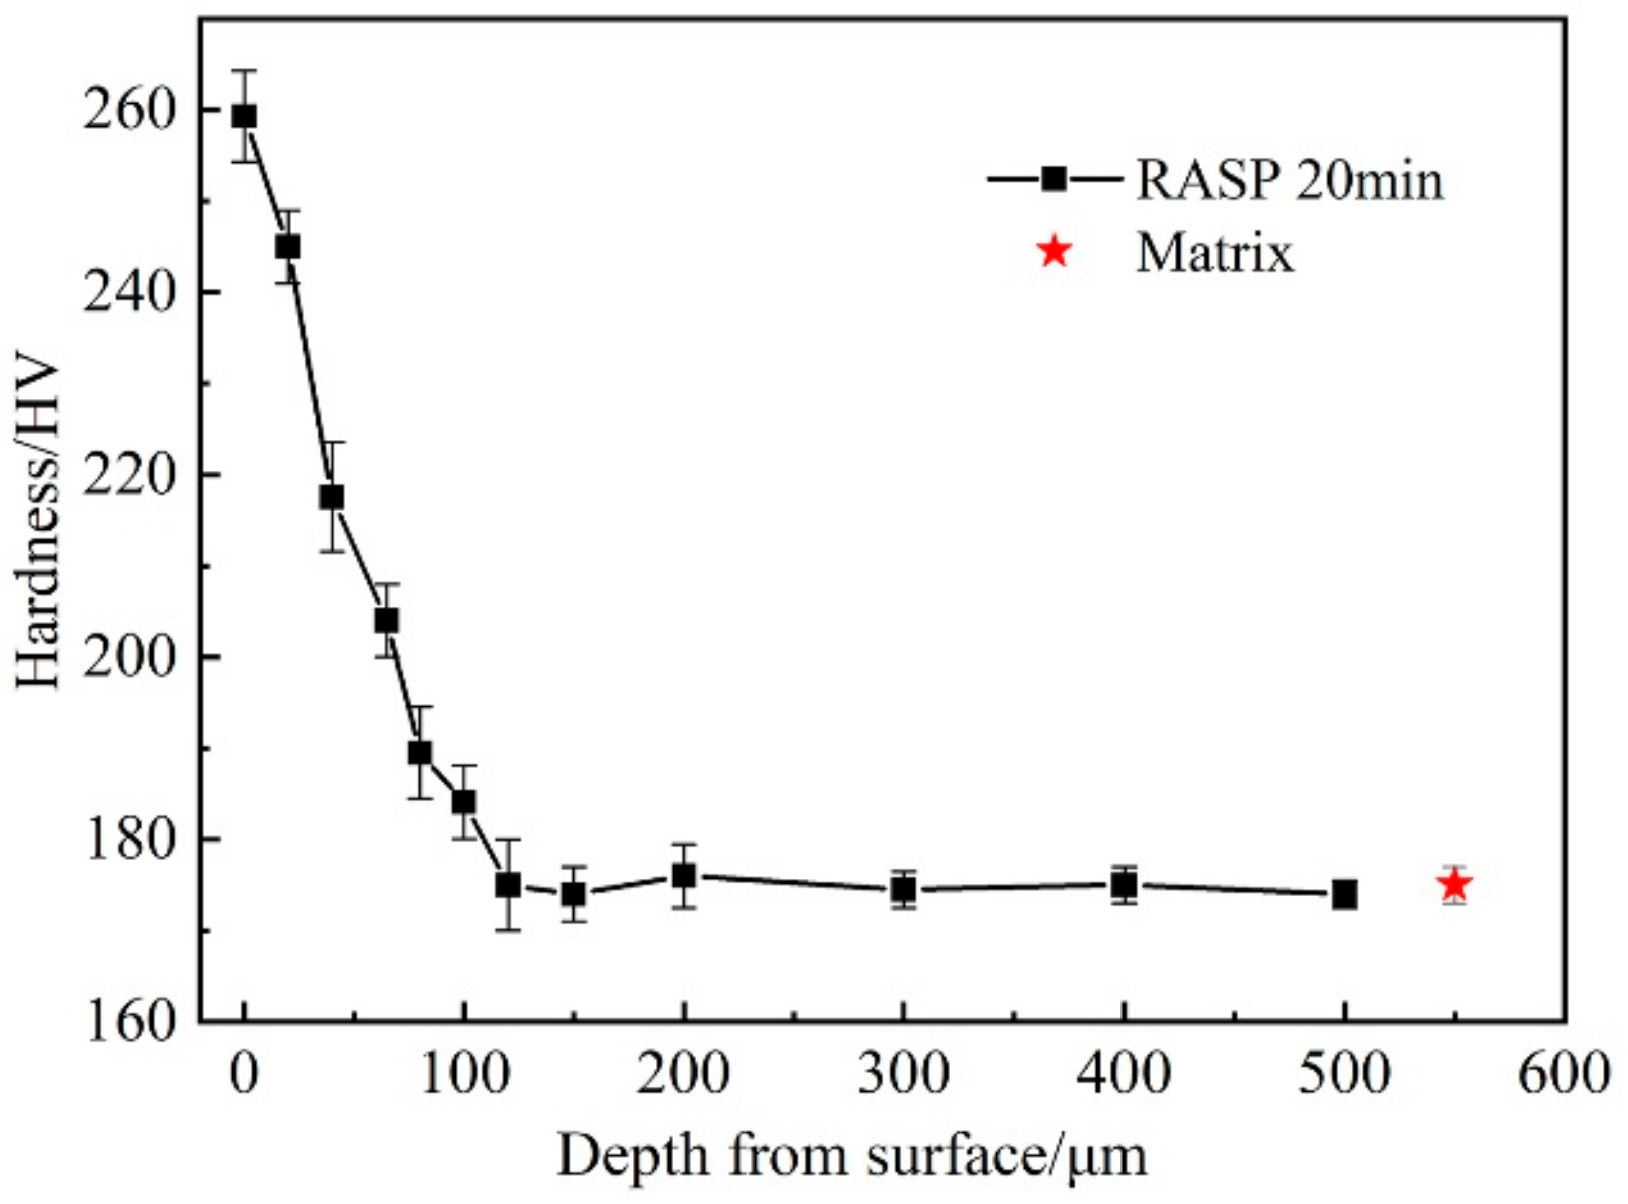
The material in this work is SA106B carbon steel, and its chemical composition is given in Table 1. The specimens were cut from the Jiangsu Chengde steel tube share Co., Ltd in China. Mainly, its metallographic structure consists of ferrite and pearlite, as shown in Figure 1, and its mean grain size is 30 µm. The projectile used for the shot peening was made of GCr15 balls with a diameter of 0.8 mm, and the shot velocity was 80 m/s. The process was carried out for 5, 10, 15 and 20 min, periods. The samples were rotated during the shot peening process. For the RASP-processed for 20 min SA106B carbon steel specimen, the average hardness at the top surface is 260 HV (Figure 2). The hardness decreased gradually from the surface to the inner, and finally approached a stable value (175 HV) at a depth of 120 µm. Furthermore, according to the well-known Hall–Petch equation, the changes in hardness are inversely proportional to the variation in the size of grains formed by RASP [18]. Therefore, the smaller the grain size, the higher the hardness will be.
2.2. Electrochemical Measures
The specimens with a size of 10 mm × 10 mm × 5 mm were used in the electrochemical tests. They were spot-welded to the back of the samples with copper lines for the electrical contact. Prior to each electrochemical experiment, the exposed surface (with an area of 1 cm2) of the specimens were wet ground with a series of SiC papers ranging from #600 to #3000, cleaned thoroughly with alcohol, acetone, and deionized water in sequence, and then dried quickly with flowing compressed hot air. The samples were polished first and then immersed in the 0.05 M H2SO4 + 0.05 M Na2SO4 and 0.2 M NaCl + 0.05 M Na2SO4 solutions, respectively. The electrochemical measurements were performed at room temperature. The potentiodynamic polarization and electrochemical impedance spectroscopy (EIS) experiments were conducted by using a three-electrode system. A platinum sheet was used as the auxiliary electrode. A saturated calomel electrode (SCE) as the reference electrode, and a specimen as the work electrode. The samples were washed with distilled water and immediately dried to analyze the corrosion morphology after the electrochemical measurements. To confirm the data reproducibility, the polarization tests were performed at least three times. The EIS tests were carried out at the open circuit potential (OCP) with a sinusoidal potential amplitude of 10 mV, running from 100 kHz to 10 MHz
3. Results and Discussion
3.1. Microstructure Characterizations
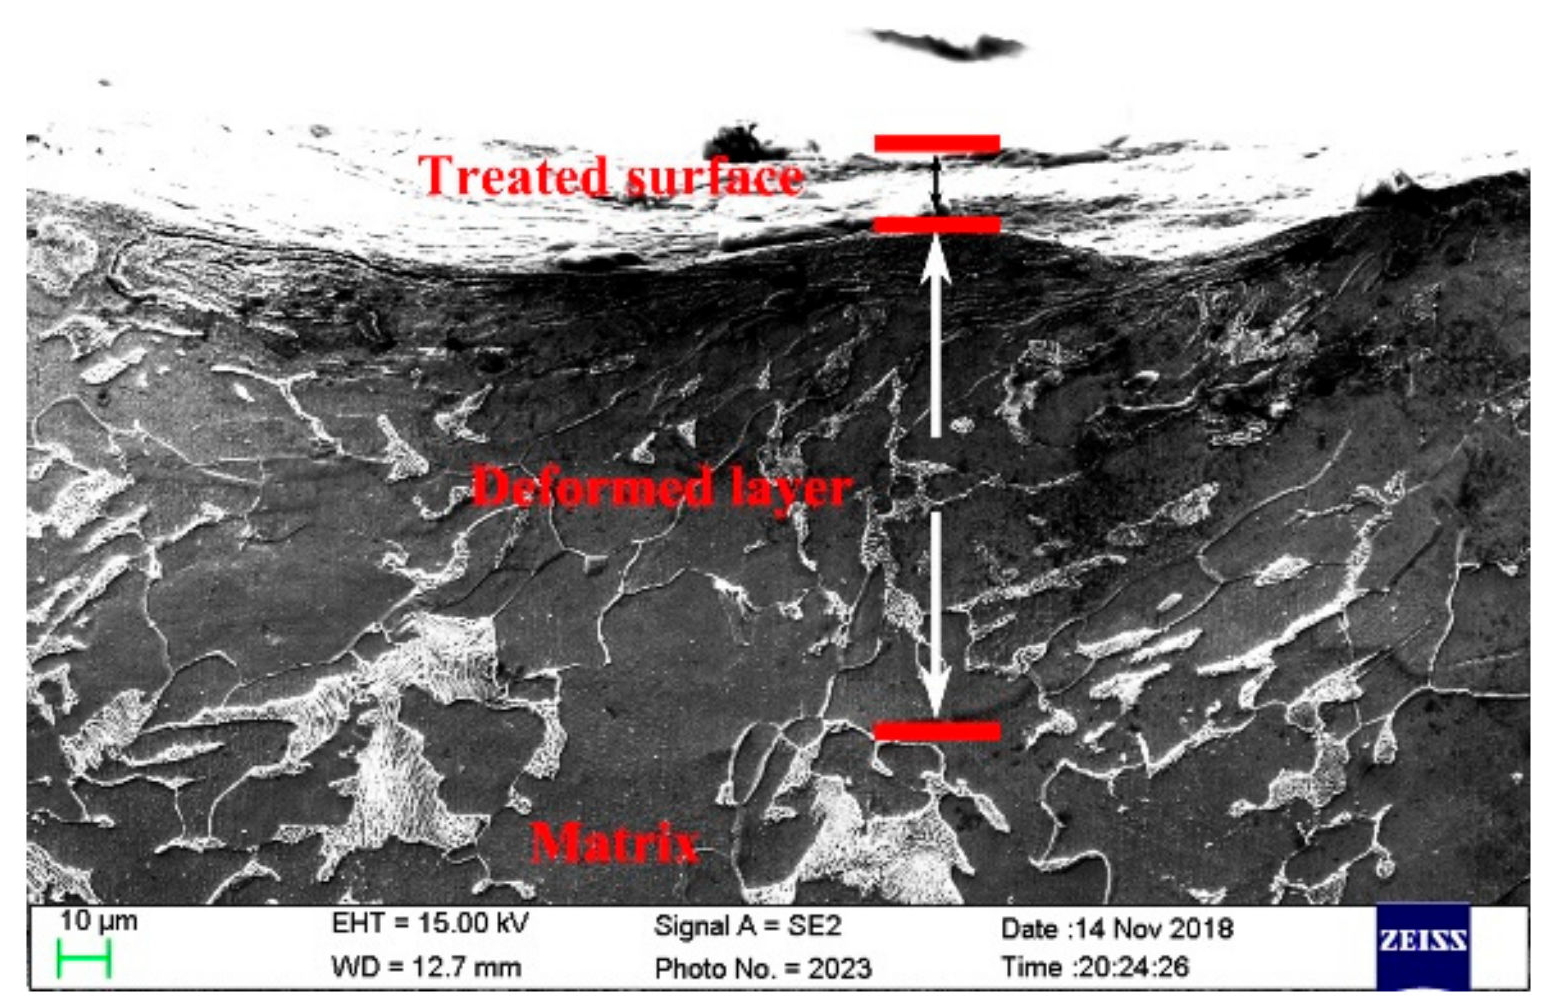
Figure 3 shows the SEM image of the RASP-processed sample in cross-section. According to the grain deformation degree, we found that the depth of the deformation layer of the carbon steel processed 20 min by the RASP was about 120 µm. It was shown that the top surface of the sample produced a distinct plastic deformation and the grain within the layer was remarkably refined. Black and white arrows indicate the treated surface and deformed region of the sample, respectively. It shows that the RASP successfully produced a steel with a structural gradient. Some bending striations were found near the surface. Duan et al. [19,20] also found these deformation characteristics under high strain, and two competing factors were suggested. One was the work-hardening effect through the increase of strain. The other was the thermal-softening effect caused by adiabatic temperature rise. In this study, severe plastic deformation (SPD) was introduced into the surface, resulting in the enhancement of the lattice distortion and micro-strain. This is a reason why the bending striations were formed.
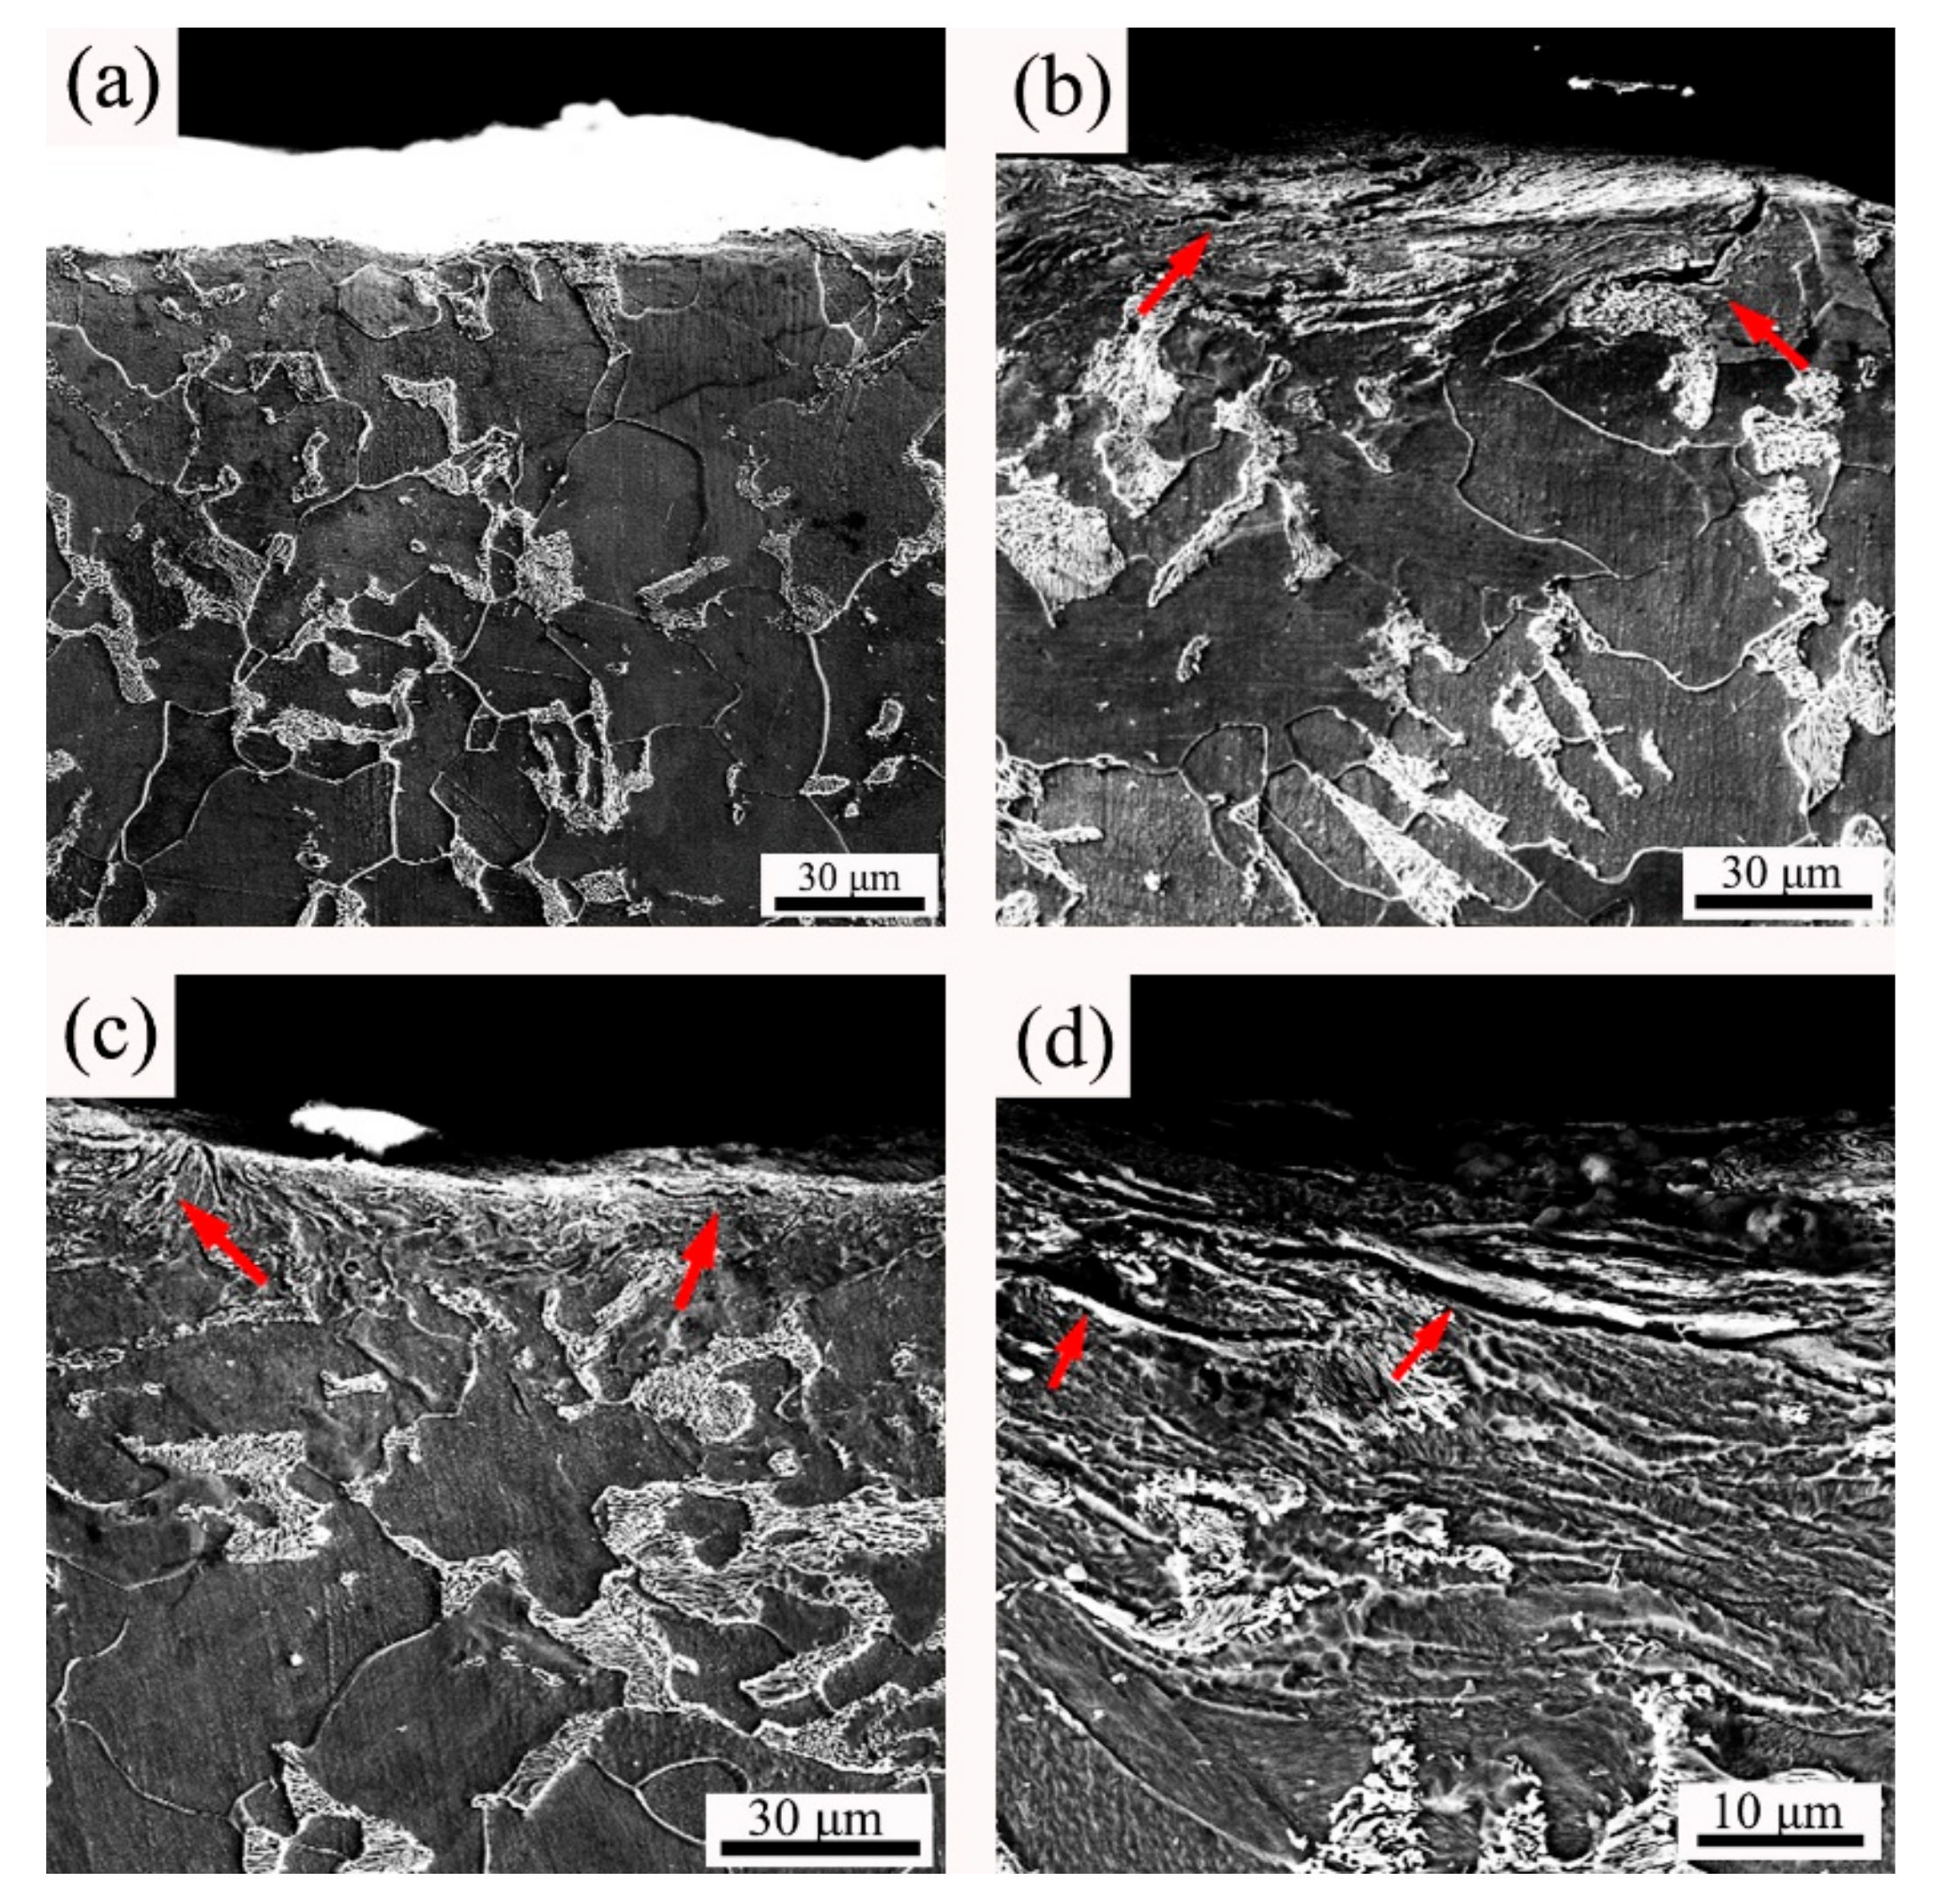
Figure 4 shows the SEM images of the different RASP-processed samples in cross-sections. One can see that with the prolongation of the RASP time, the thickness of the deformed layer at the top surface increased. With a peening time of 5 min, the sample had a harder surface without defects. However, prominent micro-cracks and holes were produced easily in the samples when the RASP was processed for more than 5 min, as shown in Figure 4 by the red arrows.
3.2. Potentiodynamic Polarization Results
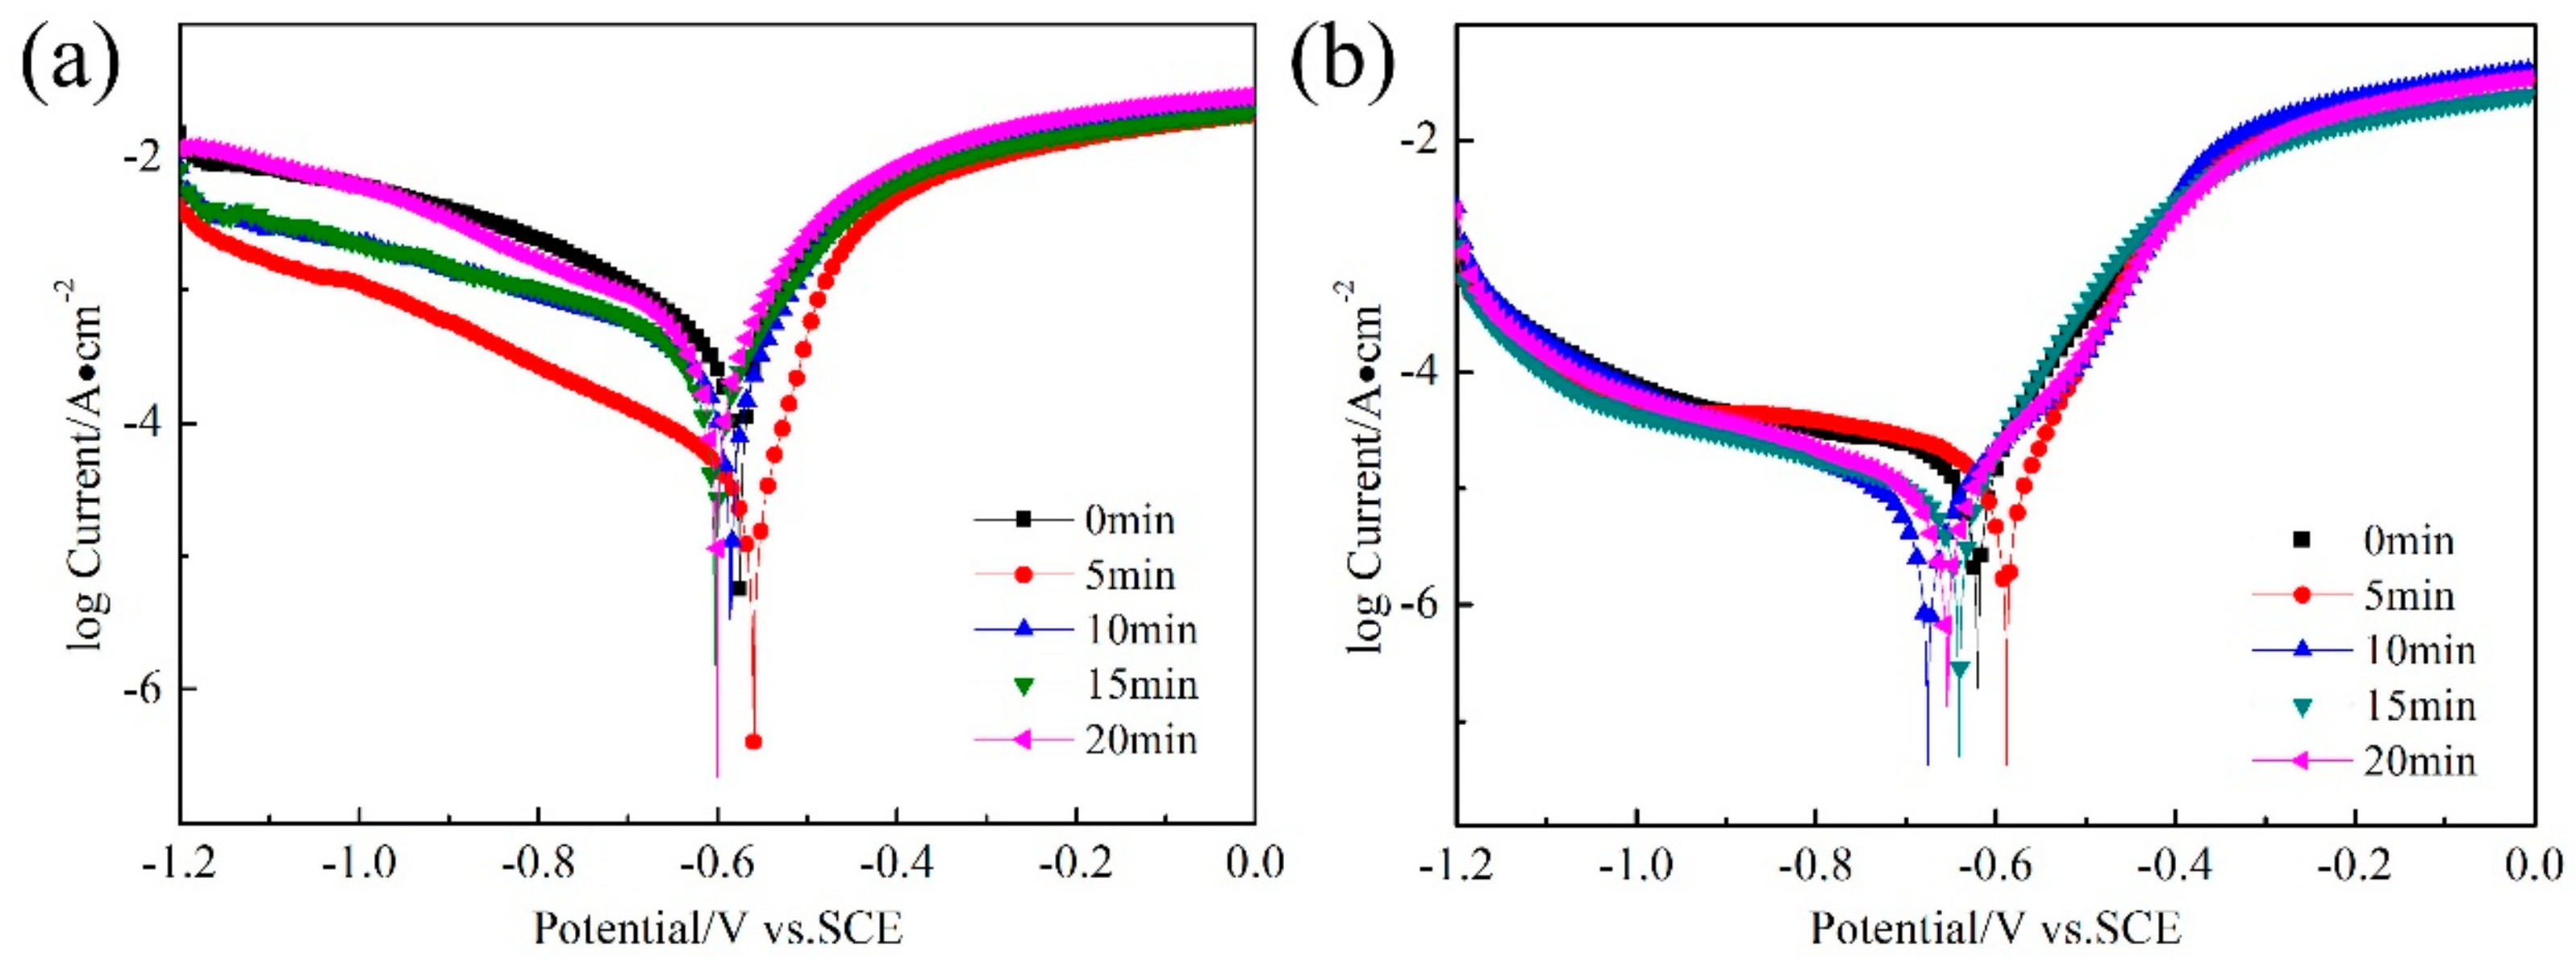
The potentiodynamic polarization curves of the RASP-processed SA106B low-carbon steel with various duration times are shown in Figure 5. The potentiodynamic polarization test has usually been used to characterize the corrosion properties of materials [21]. The corrosion current density (Icorr) can be used to calculate the corrosion rate of metals. The Icorr is determined from the Tafel plot by extrapolating the linear portion of the polarization curve near corrosion potential (Ecorr) [22]. As illustrated by the curve in Figure 5, all the potentiodynamic polarization curves show similar characteristics. When the polarization potential was higher than the corrosion potential, the current of the steel increased sharply with the increase of the polarization potential, indicating that the low-carbon steel exhibited the activation state in the solution. These results were consistent under two different electrolyte solutions, as indicated in Table 2 and Table 3. The Icorr values decreased after the RASP, indicating the corrosion resistances for the samples were improved. It can also be seen that the Icorr increased slightly at a longer RASP time, the increasing corrosion rate can be attributed to the microscopic changes of the samples.
The carbon steel which differs from a passive material, like a stainless steel, is a material with active dissolution behavior [23,24]. When we estimate its corrosion resistance, the primary factor parameter is the Icorr, followed by the Ecorr. The corrosion resistance of the 5-min RASP-processed steel exhibited the best corrosion resistance among all of the samples. The original carbon steel had the worst corrosion resistance.
3.3. EIS Study
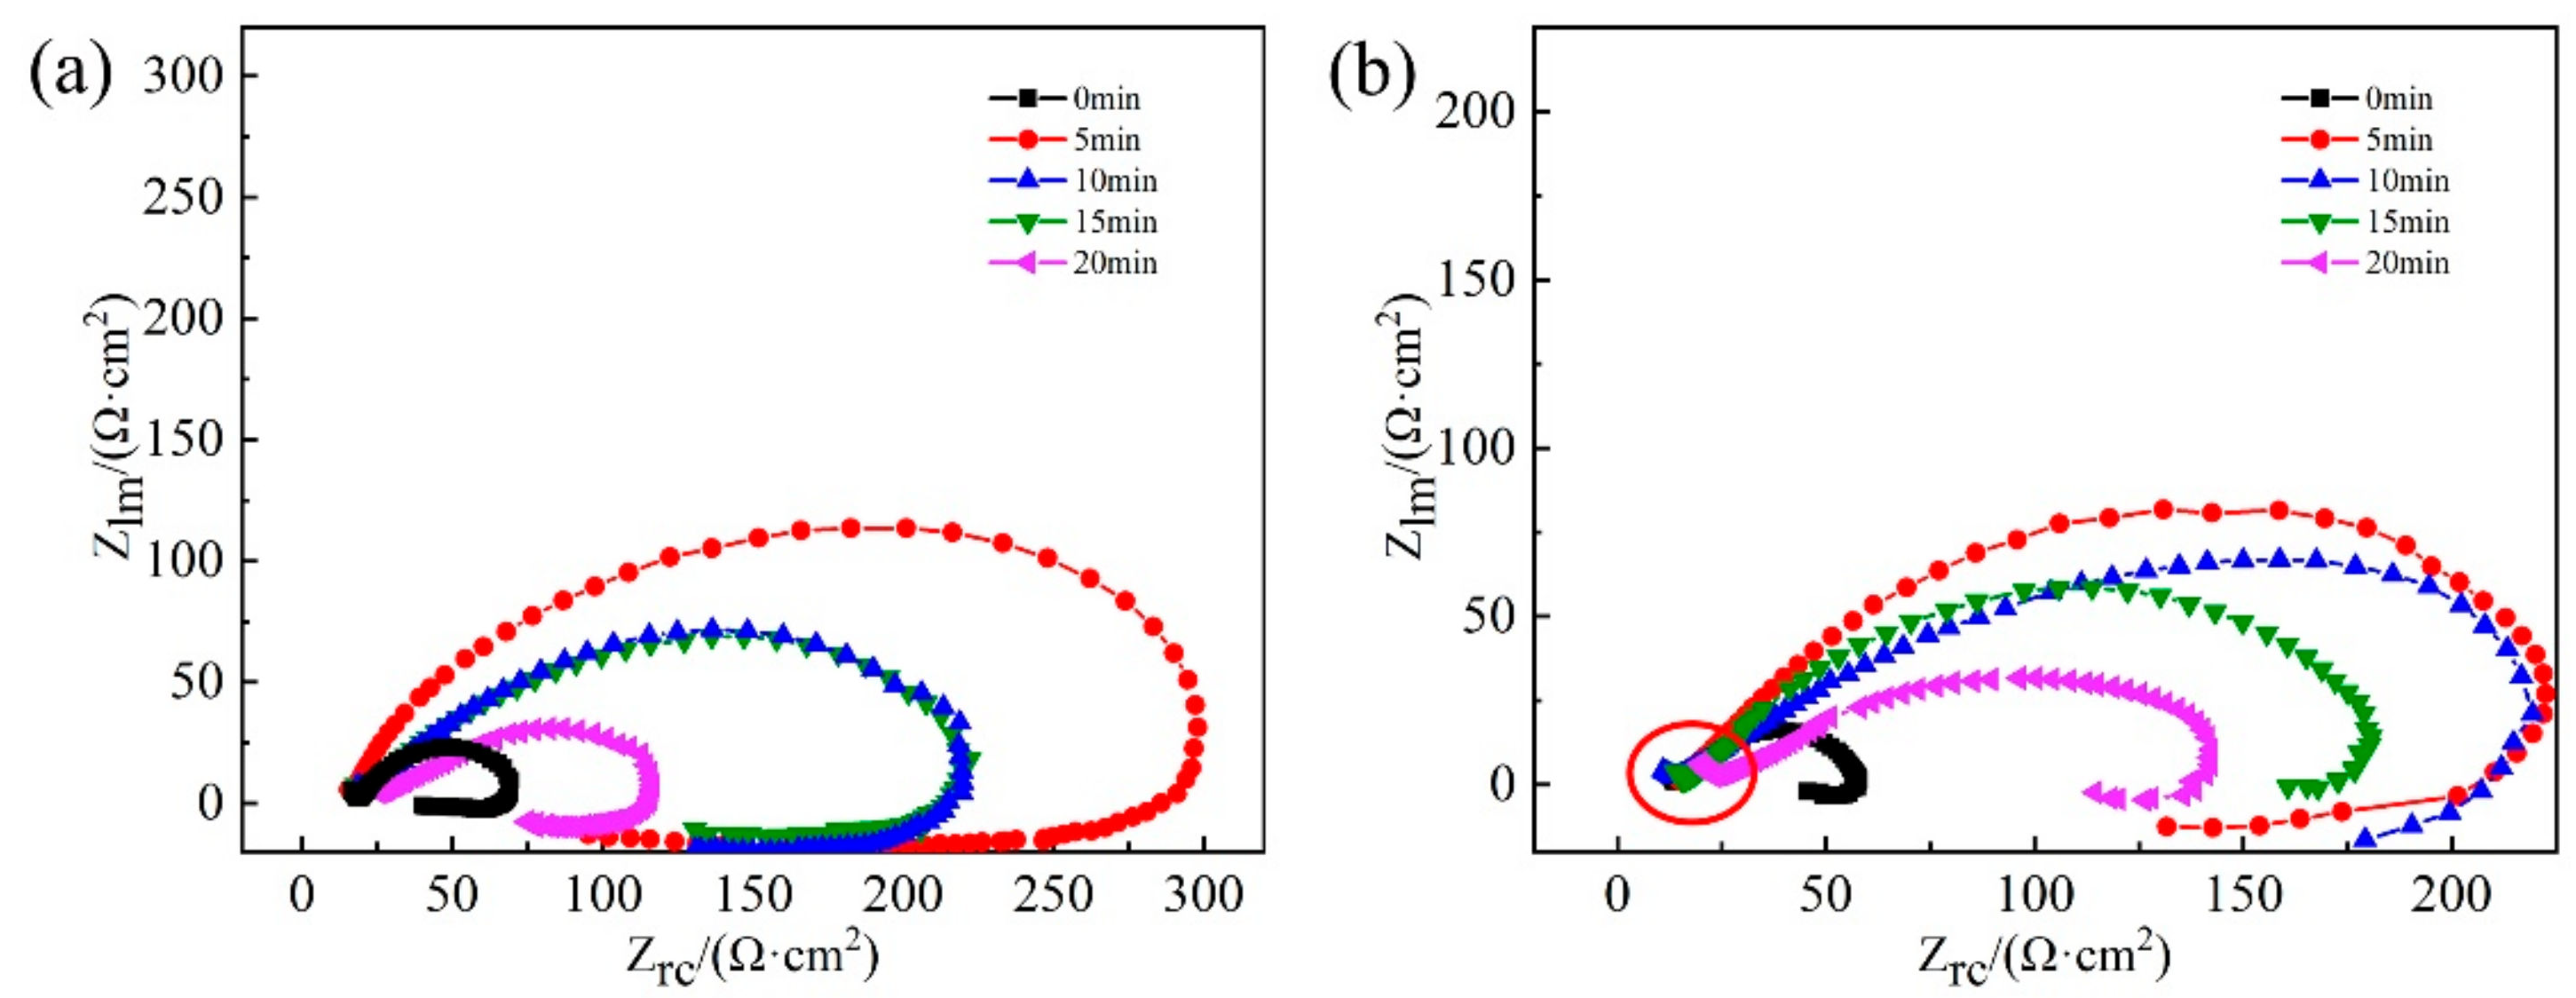
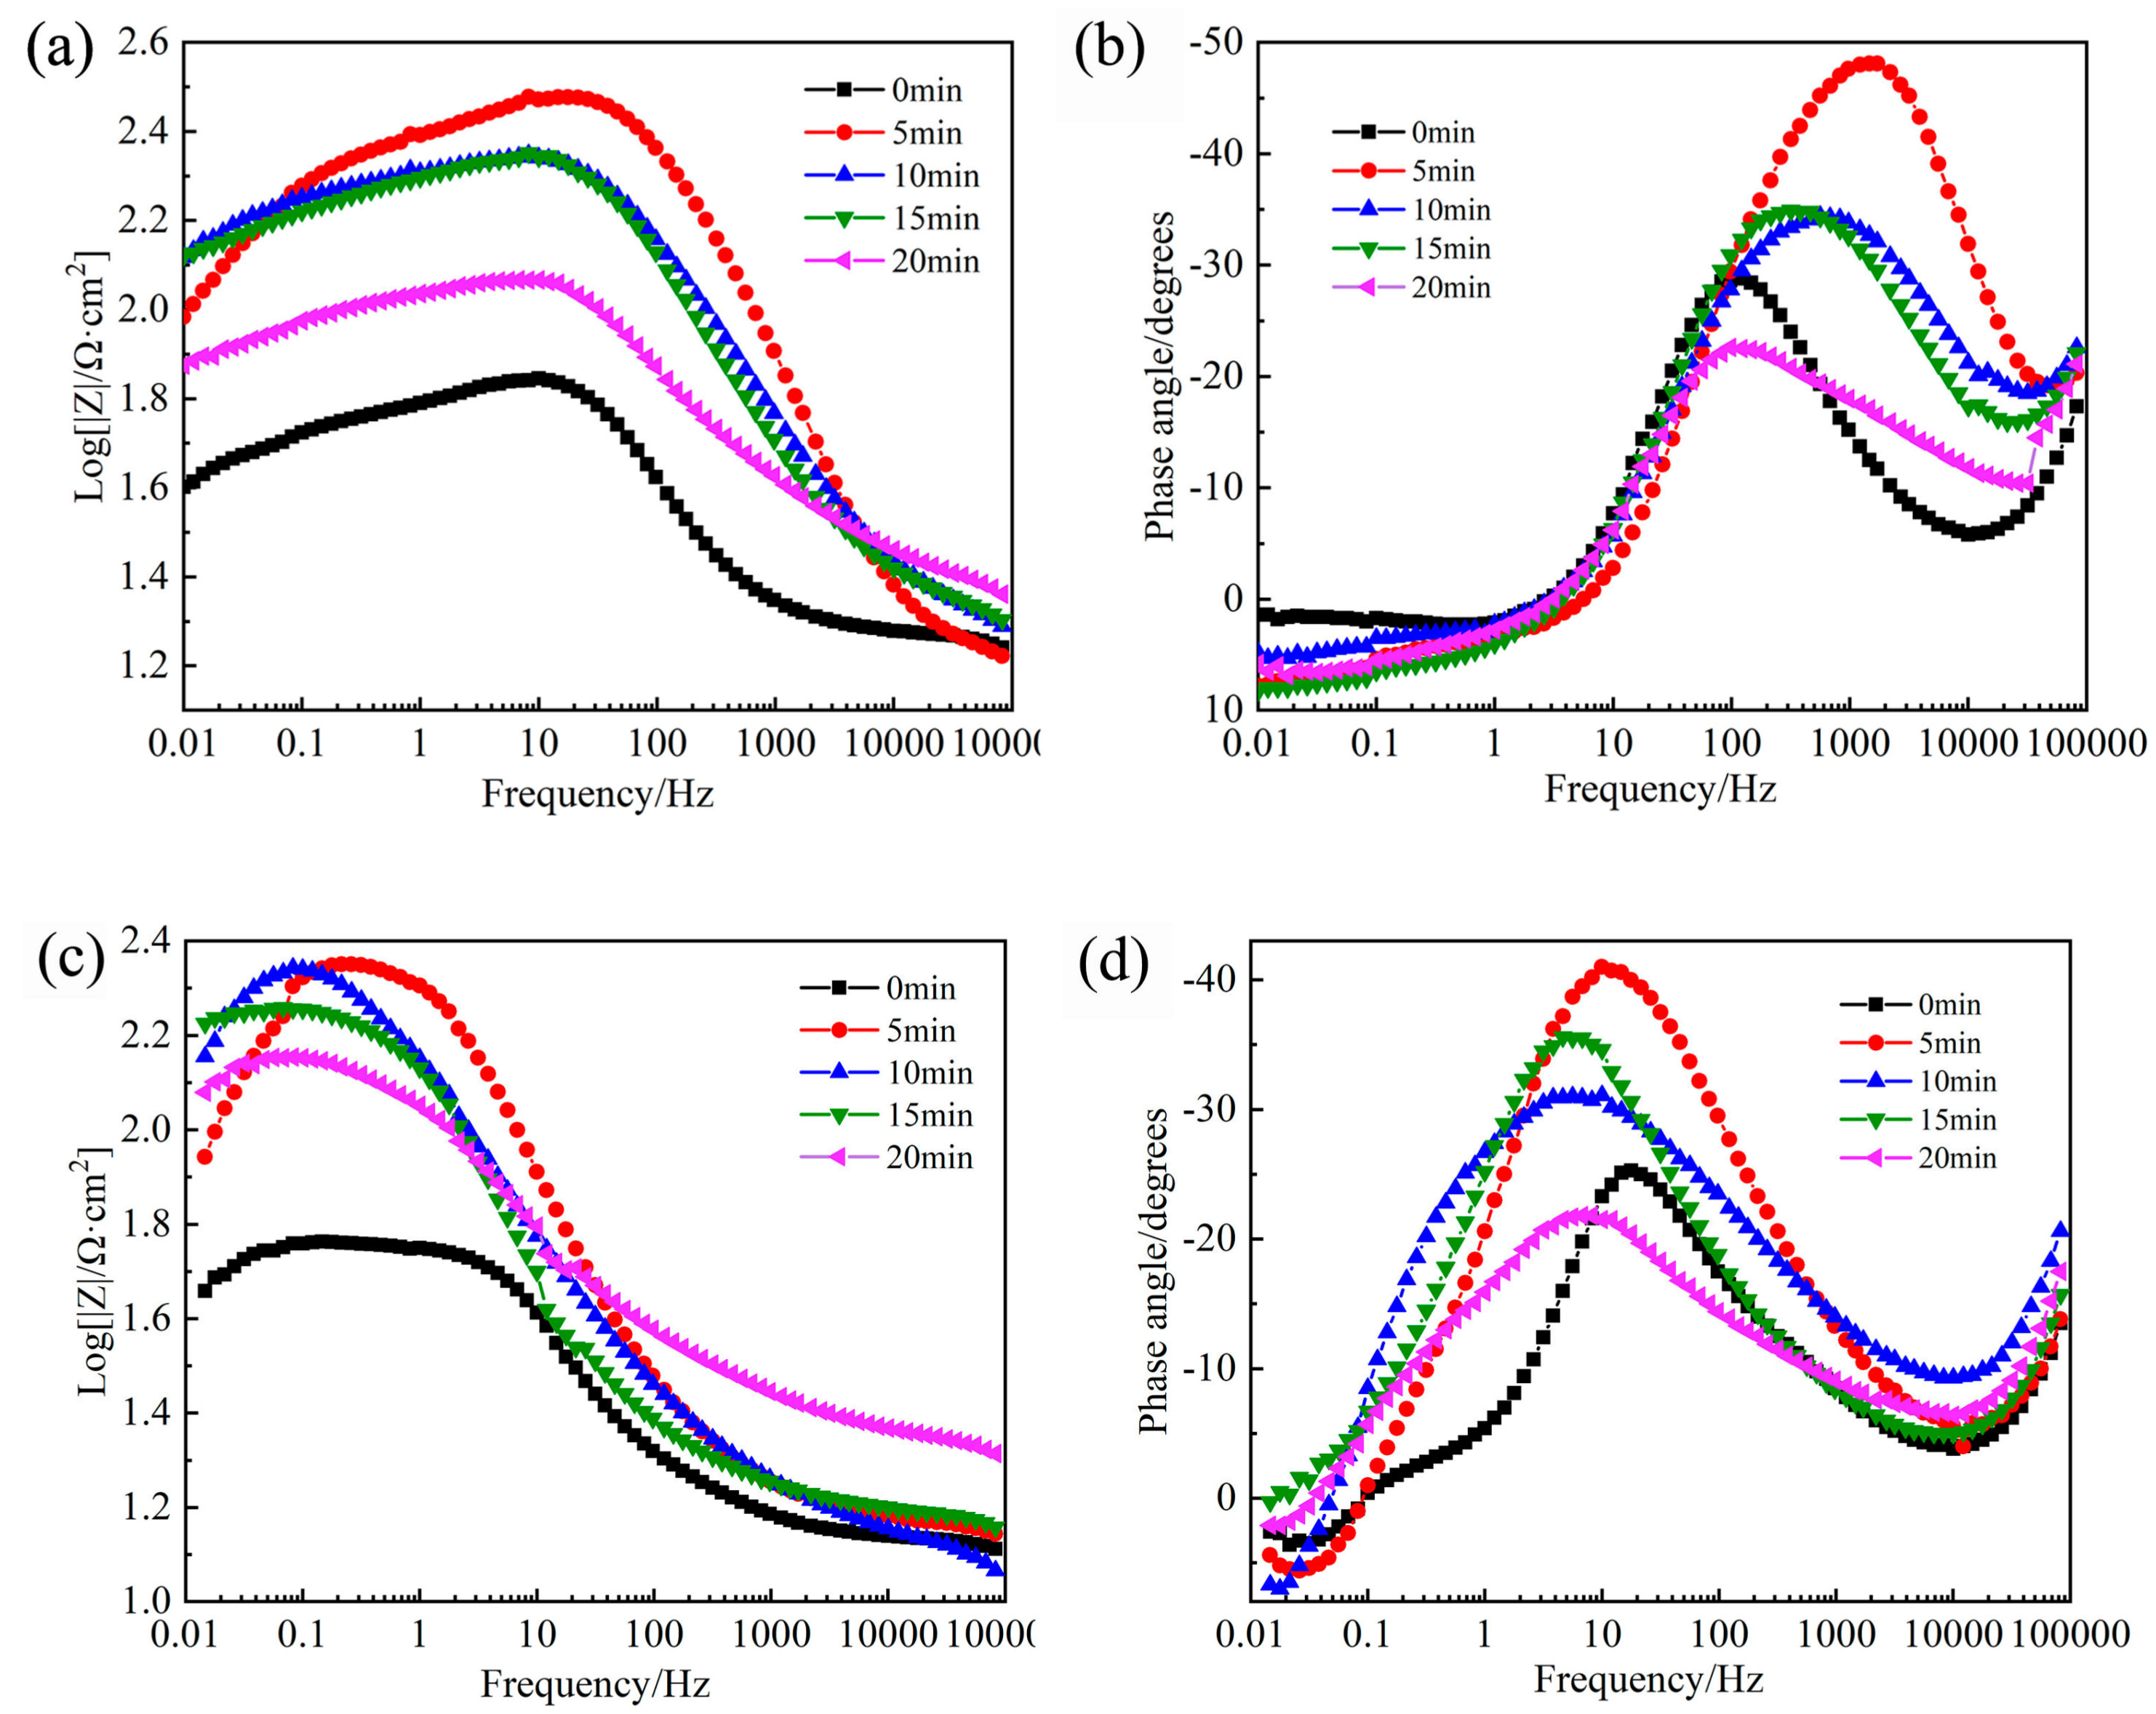
In studying corrosion and passivation processes, electrochemical impedance is a powerful tool to provide more information about the electrochemical processes. The impedance responses of these systems are given in Figure 6 and Figure 7 in Nyquist and Bode formats, respectively. Figure 6 shows the effect of the RASP-processed time on the Nyquist plots of the SA106B low-carbon steel. One can see that the samples exhibited a high-frequency capacitive reactance arc and low-frequency inductance arc characteristics. At least two time constants are clearly observed in the Nyquist and Bode representations. With the increase of the RASP-processed time, the diameter of the semicircle decreased. The electrochemical impedance spectroscopy diagram shows that the larger the capacitive reactance arc, the better the corrosion resistance. We can conclude that the corrosion resistance of the samples improved after the RASP. The red circle with small capacitive reactance arc or inductive arc in the high-frequency part may be caused by the high-frequency phase shift. For the exact details, please refer to the specific introduction of Mansfeld [25]. A capacitive reactance generally above 10 kHz is essentially not a reflection of the electrochemical process.
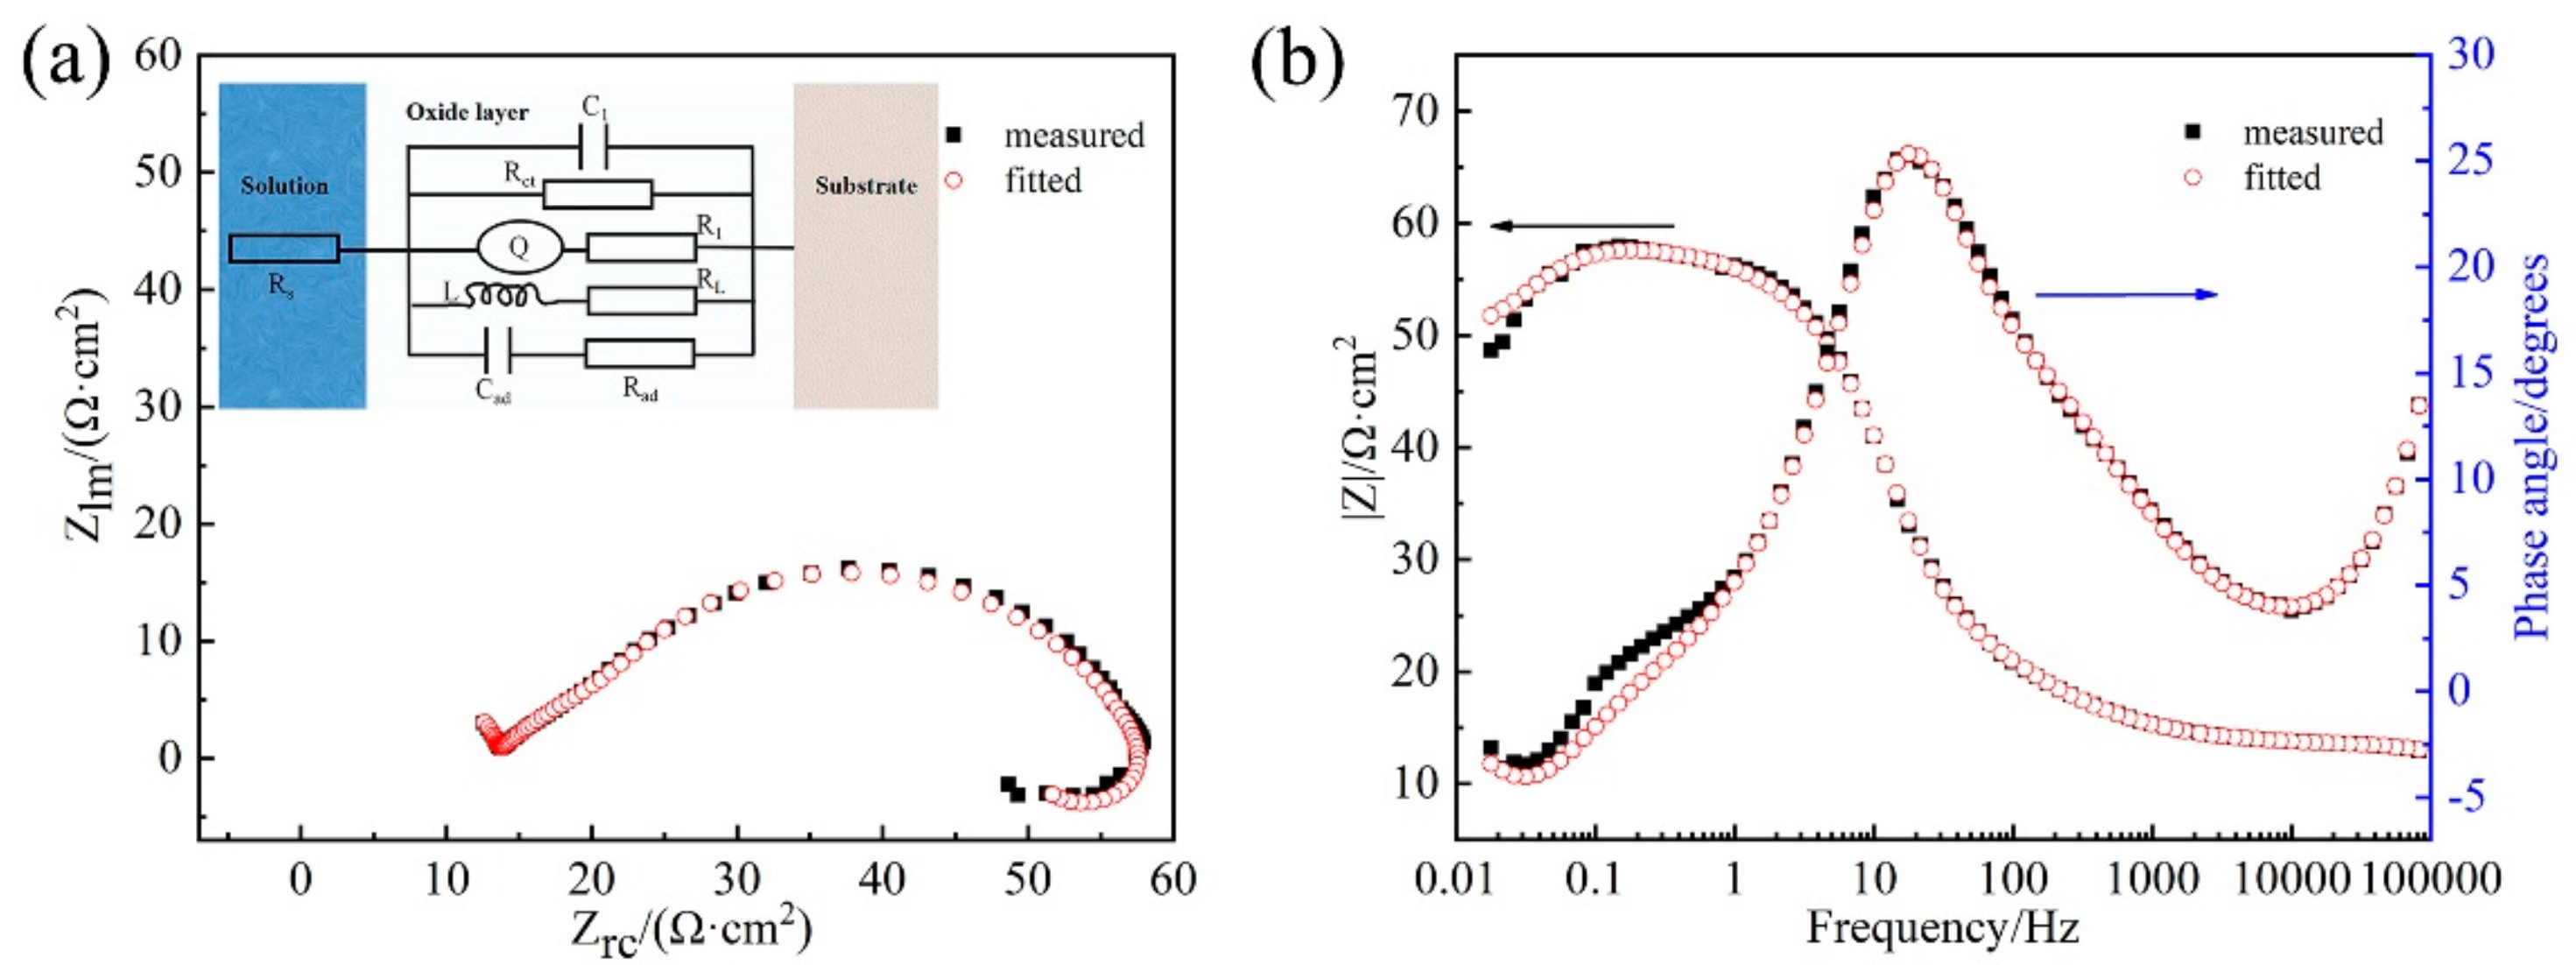
The fitted result for the impedance spectrum measured after potentiodynamic polarization in the 0.2 M NaCl + 0.05 M Na2SO4 solution with equivalent circuits in the inset of Figure 8a, as a representative example, is shown in Figure 8. The impedance data were fitted with ZSimpWin 3.50 version software (Ann Arbor, Michigan, MI, USA) using an equivalent circuit. It can be seen that the fitted and measured results match quite well in both Nyquist and Bode plots. The shrinkage of the Nyquist plots at the real parts are usually interpreted as the typical corrosive pitting appearing during the test [26]. It shows that intermediate products appear in the electrode reaction, producing a surface-adsorbing complex with the surface of the metal electrode. The oxidation film on the surface is slightly damaged and has not changed the original surface properties. Table 4 and Table 5 list the fitted electrochemical parameters. Rs is the resistance of the solution affecting the charge transfer process, and Rct is the charge transfer resistance of the surface electrode reaction of the low-carbon steel, which can reflect the surface of the electrode due to electricity generation. RL is the inductance resistance and L is the inductance. C1 is the interfacial capacitance and Cad is the adsorption capacitance. Q is the constant phase element (CPE) which represents the capacitance of double layer. The CPE, which has non-integer power dependence on the frequency, is used to represent the capacitances of double layer to account for the deviation from the ideal capacitive behavior due to surface inhomogeneity, roughness and adsorption effects. The impedance of CPE is described by the expression
where Y0 is a proportional factor, j is the imaginary unit, w is the angular frequency, and α is the phase shift, which is a measure of the capacitance dispersion. For α = 0, Q represents a resistance with R = Y0−1; for α = 1, it represents a capacitance with C = Y0; for α = 0.5, it represents a Warburg element and for α = −1, it represents an inductance with L = Y0−1. The Rct value continuously decreased with the increase of the RASP-processed time (Table 4 and Table 5), indicating that the corrosion resistance decreased, which may be related to the changes in the thickness, homogeneity, and composition of the oxidation film.
3.4. SEM Photomicrographs
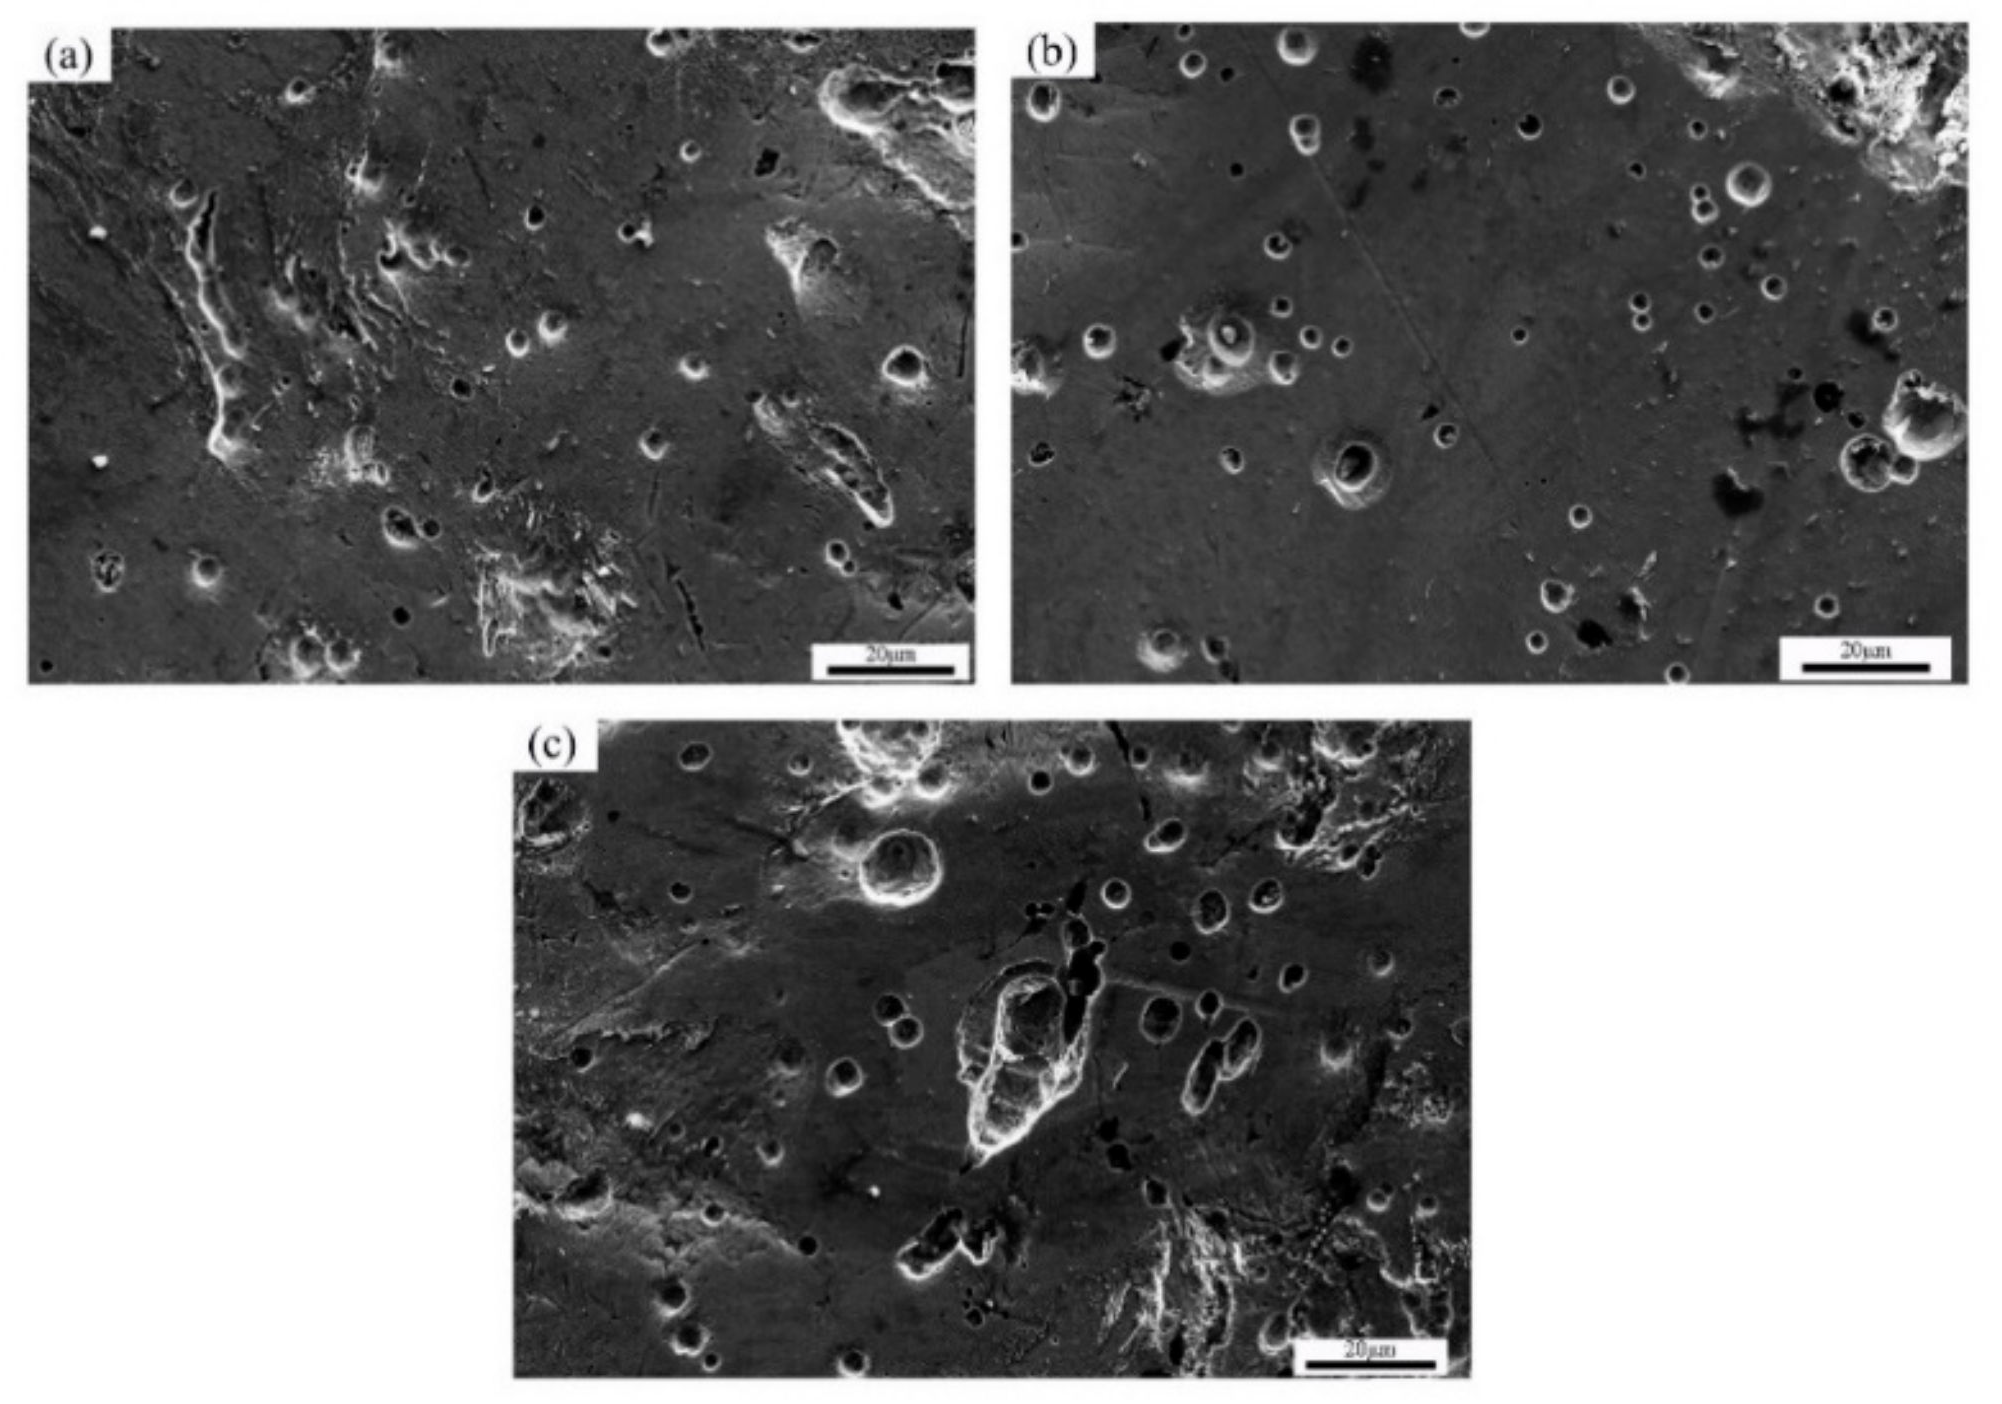
Figure 9 illustrates the dissolution morphologies of the SA106B low-carbon steel after the polarization tests. Some pitting pits were found in both ferrite and pearlite. The pearlite consists of ferrite and cementite phases. The cementite phases as the cathode have a higher potential compared to the ferrite phases, leading to the severe galvanic corrosion which can induce and worsen pitting [27,28]. With the prolongation of holding time, pits numbers gradually increased. Moreover, their size enlarges and the depth increases due to the micro-cracks effect and the roughness of carbon steel specimens treated by the peening. Thus, the corrosion resistance of the RASP-processed samples decreased. Among them, the sample RASP-processed for 5 min exhibited the best corrosion resistance. This is consistent with the results of the polarization curves and the impedance spectrum, as shown in Figure 5 and Figure 6.
3.5. TEM Analysis
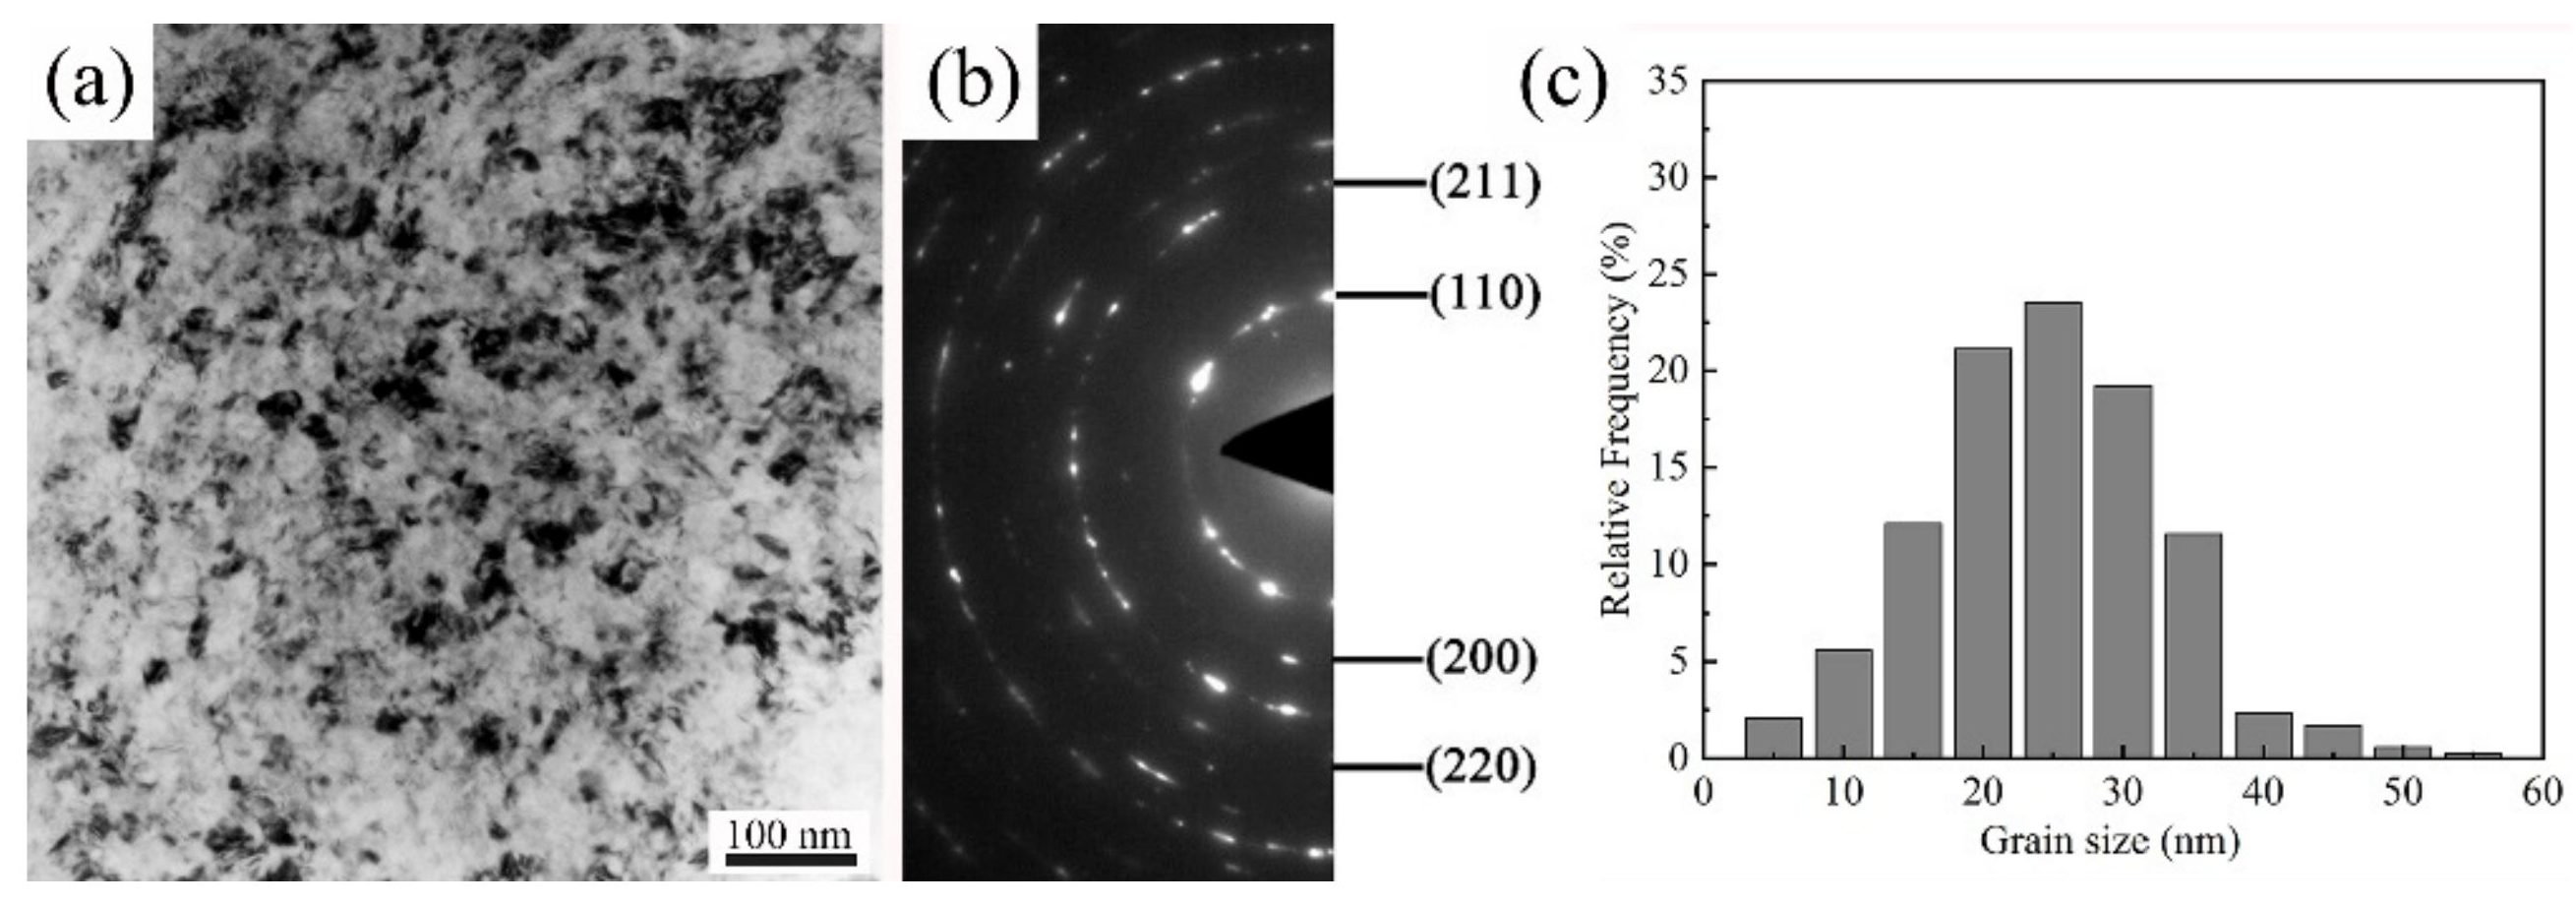
TEM image of the SA106B carbon steel sample was depicted in Figure 10a. Figure 10a, b show TEM bright-field micrograph and selected-area electron diffraction (SAED) patterns, respectively, in the top surface layer of the sample RASP-processed for 5 min. One can note that the crystal grains have been refined into nanocrystal grains of relatively equiaxed and uniformly distributed compared with the irregular crystal grains of the matrix. The mean grain size is 25 nm (Figure 10c). Note that the SAED pattern of the sample consists of rings. It is known that the more continuous the rings, the smaller the grain sizes within the selected field of the view and the more uniform the distribution of grains [29]. The result demonstrates that the grain size of the steel can be markedly reduced when they are RASP-processed for 5 min. It is noteworthy that some spots spreading along the rings (Figure 10b) were found, indicating that there are also some coarse grains in the samples.
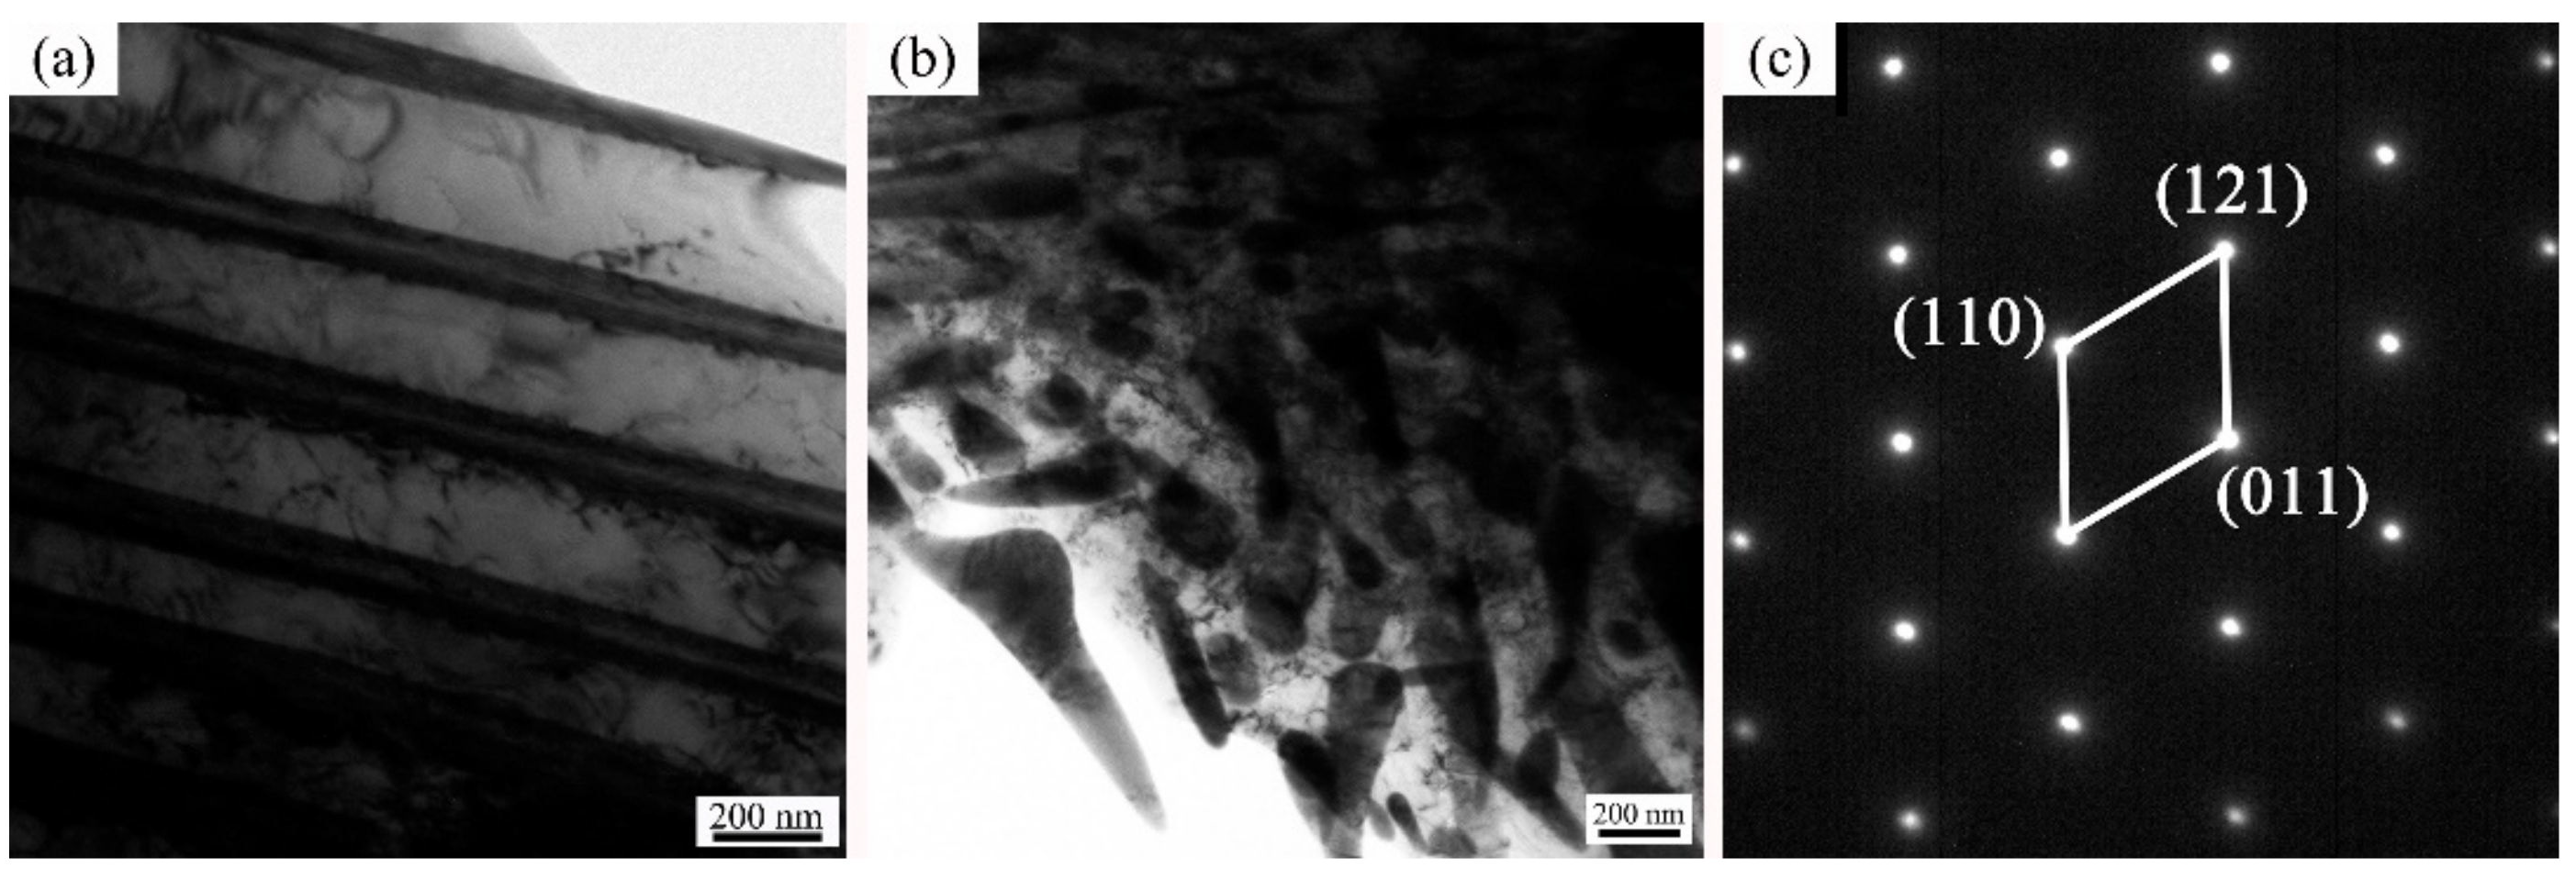
Figure 11 shows typical TEM images of the SA106B low-carbon steel, (a) RASP-processed for 0 min, (b) RASP-processed for 5 min and (c) shows the corresponding SAED pattern. In the carbon steel specimens untreated by the peening, one can see that the cementite is parallel, evenly distributed and the width of lamellar spacing is about 200 nm, as shown in Figure 11a. As shown in Figure 11b, the main result concerns the cementite phase which underwent a dissolution, at least partial, during SPD. The parallel distributions were changed severely. The diffraction spot, as shown in Figure 11c, confirmed the formation of supersaturated carbon atom ferrite. It is plausible that because the dislocation activity and cementite dissolution occurred simultaneously during plastic deformation, the carbon atoms can be dragged out of the cementite by mobile dislocations [30]. One study [31] has shown that cementite dissolution takes place through a global mechanism involving the whole volume of each individual lamellae, resulting in a carbon concentration gradient from cementite to ferrite. Indeed, as cementite partly dissolves, a large amount of carbon atoms is released, and must therefore be partitioned in the ferrite. Owing to the importance of the dissolution, the average carbon content in the ferrite may reach 1–2 at.%. After the cementite dissolution, a solid solution formed, which increased the electrode potential of the matrix [32]. Thus, the number of micro batteries reduced and the corrosion film was more stable and the surface layer of the sample was flattened.
4. Conclusions
In the present work, the influence of corrosion resistance of a SA106B low-carbon steel with gradient nanostructure produced by RASP was investigated. The main conclusions can be drawn as follows:
- (1)
- The RASP-processed SA106B carbon steel surface formed a deformation layer with a depth about 120 µm. The mean grain size is 25 nm in the top surface layer.
- (2)
- The sample RASP-processed for 5 min exhibited the best corrosion resistance due to the cementite dissolution and formation of nanograins.
- (3)
- Prominent micro-cracks and holes were produced in the steel when the RASP was processed more than 5 min, resulting in the decrease of corrosion resistance.
Author Contributions
Writing-original draft preparation, figures and data curation, C.L.; data analysis, C.L., X.C., Y.C. and B.Y.; literature search, X.C.; study design, Y.L. and B.Y.; Writing—review and editing, B.Y.
Funding
This research was founded by the Beijing Municipal Natural Science Foundation under No 2162026 and the Beijing Municipal Science and Technology Commission under No Z181100005218005.
Conflicts of Interest
The authors declare no conflict of interest.
References
- Moering, J.; Ma, X.; Chen, G. The role of shear strain on texture and microstructural gradients in low carbon steel processed by surface mechanical attritiontreatment. Scr. Mater. 2015, 108, 100–103. [Google Scholar] [CrossRef]
- Zhu, Y.T.; Lowe, T.C.; Langdon, T.G. Performance and applications of nanostructured materials produced by severe plastic deformation. Scr. Mater. 2004, 51, 826–830. [Google Scholar] [CrossRef]
- Fang, T.H.; Li, W.L.; Tao, N.R. Revealing extraordinary intrinsic tensile plasticity in gradient nano-grained copper. Science 2011, 331, 1587–1590. [Google Scholar] [CrossRef] [PubMed]
- Mishra, R.; Balasubramaniam, R. Effect of nanocrystalline grain size on the electrochemical and corrosion behavior of nickel. J. Corros. Sci. 2004, 46, 3019–3029. [Google Scholar] [CrossRef]
- González, J.; Peral, L.-B.; Colombo, C.; Fernández-Pariente, I. A study on the microstructural evolution of a low alloy steel by different shot peening treatments. Metals 2018, 8, 187. [Google Scholar] [CrossRef]
- Segal, V.M. Severe plastic deformation: simple shear versus pure shear. Mater. Sci. Eng. A 2002, 338, 331–344. [Google Scholar] [CrossRef]
- Lu, K.; Lu, J. Nanostructured surface layer on metallic materials induced by surface mechanical attrition treatment. Mater. Sci. Eng. A 2004, 375, 38–45. [Google Scholar] [CrossRef]
- He, J.W.; Ma, S.N.; Ba, D.M. Investigation of surface nanocrystallization by pre-forceing rolling technology. Adv. Mater. Res. 2013, 750, 1963–1966. [Google Scholar] [CrossRef]
- Sun, J.C.; Sheng, G.R.; Wang, Y.T. Surface self-nanocrystallization on industrial pure iron by high energy shot peening. (In Chinese). Heat Treat. Met. 2010, 35, 38–41. [Google Scholar]
- Wang, X.; Li, Y.S.; Zhang, Q. Gradient structured copper by rotationally accelerated shot peening. J. Mater. Sci. Technol. 2016, 7, 758–761. [Google Scholar] [CrossRef]
- Li, J.; Soh, A.K. Enhanced ductility of surface nano-crystallized materials by modulating grain size gradient. Modell. Simul. Mater. Sci. Eng. 2012, 20, 085002. [Google Scholar]
- Balusamy, T.; Sankara Narayanan, T.S.N.; Ravichandran, K. Influence of surface mechanical attrition treatment (SMAT) on the corrosion behaviour of AISI 304 stainless steel. Corros. Sci. 2013, 74, 332–344. [Google Scholar] [CrossRef]
- Ye, W.; Li, Y.; Wang, F. Effects of nanocrystallization on the corrosion behavior of 309 stainless steel. Electrochim. Acta 2006, 51, 4426–4432. [Google Scholar] [CrossRef]
- Huang, R.; Han, Y. The effect of SMAT-induced grain refinement and dislocations on the corrosion behavior of Ti-25Nb-3Mo-3Zr-2Sn alloy. Mater. Sci. Eng. 2013, 33, 2353–2359. [Google Scholar] [CrossRef] [PubMed]
- Li, Y.; Wang, F.; Liu, G. Grain size effect on the electrochemical corrosion behavior of surface nanocrystallized low-carbon steel. Corros. Sci. 2004, 60, 891–896. [Google Scholar] [CrossRef]
- Zhang, L.; Ma, A.; Jiang, J. Electrochemical corrosion properties of the surface layer produced by supersonic fine-particles bombarding on low-carbon steel. Surf. Coat. Technol. 2013, 232, 412–418. [Google Scholar] [CrossRef]
- Chen, X.D.; Li, Y.S.; Zhu, Y.T. Improved corrosion resistance of 316LN stainless steel performed by rotationally accelerated shot peening. Appl. Surf. Sci. 2019, 481, 1305–1312. [Google Scholar] [CrossRef]
- Chabok, A.; Dehghani, K. Formation of nanograin in IF steels by friction stir processing. Mater. Sci. Eng. A 2010, 528, 309–313. [Google Scholar] [CrossRef]
- Duan, C.; Wang, M. A review of microstructural evolution in the adiabatic shear bands induced by high speed machining. Acta Metal. 2013, 26, 97–112. [Google Scholar] [CrossRef]
- Duan, Z.Q.; Li, S.X.; Huang, D.W. Microstructures and adiabatic shear bands formed by ballistic impact in steels and tungsten alloy. Fatigue. Fract. Eng. Mater. Struct. 2003, 26, 1119–1126. [Google Scholar] [CrossRef]
- Chen, Y.F.; Chen, X.D.; Dai, X. Effect of spinodal decomposition on the pitting corrosion resistance of Z3CN20.09M duplex stainless steel. Mater. Corros. 2017, 69, 527–535. [Google Scholar] [CrossRef]
- Yu, Y.C. Electrochemistry basics tutorial, 2nd ed.; Beijing Chemical Industry Press: Beijing, China, 2019; pp. 118–120. [Google Scholar]
- Guo, H.X.; Lu, B.T.; Luo, J.L. Interaction of mechanical and electrochemical factors in erosion-corrosion of carbon steel. Electrochim. Acta. 2005, 51, 315–323. [Google Scholar] [CrossRef]
- Kolawole, S.K.; Kolawole, F.O.; Enegela, O.P. Pitting corrosion of a low carbon steel in corrosive environments: experiments and models. Adv. Mater. Res. 2015, 1132, 349–365. [Google Scholar] [CrossRef]
- Mansfeld, F.; Kending, M.W.; Lorenz, W.J. Corrosion inhibition in neutral, aerated media. J. Electrochem. Soc. 1985, 132, 290–296. [Google Scholar] [CrossRef]
- Li, Y.R.; Lin, W.M.; Wei, Y.H. Electrochemical corrosion behavior of mechanical attrition treated surface layer with nanocrystallines on Cu-10Ni alloy. Corros. Sci. Prot. Technol. 2012, 24, 397–400. [Google Scholar]
- Clover, D.; Kinsella, B.; Pejcic, B. The influence of microstructure on the corrosion rate of various carbon steels. J. Appl. Electrochem. 2005, 35, 139–149. [Google Scholar] [CrossRef]
- Simoes, A.M.; Bastos, A.C.; Ferreira, M.G. Use of SVET and SECM to study the galvanic corrosion of an iron-zinc cell. Corros. Sci. 2007, 49, 726–739. [Google Scholar] [CrossRef]
- Wu, X.; Tao, N.; Hong, Y. Microstructure and evolution of mechanically-induced ultrafine grain in surface layer of AL-alloy subjected to USSP. Acta Mater. 2002, 50, 2075–2084. [Google Scholar] [CrossRef]
- Bang, C.W.; Seol, J.B.; Yang, Y.S. Atomically resolved cementite dissolution governed by the strain state in pearlite steel wires. Scr. Mater. 2015, 108, 151–155. [Google Scholar] [CrossRef]
- Danoix, F.; Julien, D.; Sauvage, X.; Copreaux, J. Direct evidence of cementite dissolution in drawn pearlitic steels observed by tomographic atom probe. Mater. Sci. Eng. A 1998, 250, 8–13. [Google Scholar] [CrossRef]
- Murayama, M.; Horita, Z.; Hono, K. Microstructure of two-phase Al-1.7 at% Cu alloy deformed by equal-channel angular pressing. J. Acta Mater. 2001, 49, 21–29. [Google Scholar] [CrossRef]
Figure 1.
Optical microscope of SA106B low-carbon steel before the rotationally accelerated shot peening (RASP).
Figure 1.
Optical microscope of SA106B low-carbon steel before the rotationally accelerated shot peening (RASP).

Figure 2.
Hardness gradient as a function of depth for the RASP-processed for 20 min sample.

Figure 3.
SEM image of the RASP-processed for 20 min sample.

Figure 4.
SEM images of the RASP-processed samples: (a) 5 min, (b) 10 min, (c) 15 min, (d) 20 min.

Figure 5.
Potentiodynamic polarization curves of SA106B low-carbon steel for various RASP-processed periods ranging from 0 min to 20 min: (a) 0.05 M H2SO4 + 0.05 M Na2SO4 solution; (b) 0.2 M NaCl + 0.05 M Na2SO4 solution at room temperature.
Figure 5.
Potentiodynamic polarization curves of SA106B low-carbon steel for various RASP-processed periods ranging from 0 min to 20 min: (a) 0.05 M H2SO4 + 0.05 M Na2SO4 solution; (b) 0.2 M NaCl + 0.05 M Na2SO4 solution at room temperature.

Figure 6.
The effect of the RASP-processed time on the Nyquist plots of the SA106B low-carbon steel measured at open-circuit potential with a sinusoidal potential amplitude of 10 mV, running from 100 kHz to 10 MHz in the (a) 0.05 M H2SO4 + 0.05 M Na2SO4 solution and (b) 0.2 M NaCl + 0.05 M Na2SO4 solution at room temperature.

Figure 7.
Bode plots of the RASP-processed SA106B specimens. (a) Frequency-impedance relation and (b) frequency-phase relation in the 0.05 M H2SO4 + 0.05 M Na2SO4 solution. (c) Frequency-impedance relation and (d) frequency-phase relation in the 0.2 M NaCl + 0.05 M Na2SO4 solution.
Figure 7.
Bode plots of the RASP-processed SA106B specimens. (a) Frequency-impedance relation and (b) frequency-phase relation in the 0.05 M H2SO4 + 0.05 M Na2SO4 solution. (c) Frequency-impedance relation and (d) frequency-phase relation in the 0.2 M NaCl + 0.05 M Na2SO4 solution.

Figure 8.
The fitted electrochemical impedance spectroscopy (EIS) of original specimen after potentiostatic polarization in the 0.2 M NaCl + 0.05 M Na2SO4 solution: (a) Nyquist plots and (b) Bode plots. The inset of (a) shows the equivalent electrical circuit for the specimen.
Figure 8.
The fitted electrochemical impedance spectroscopy (EIS) of original specimen after potentiostatic polarization in the 0.2 M NaCl + 0.05 M Na2SO4 solution: (a) Nyquist plots and (b) Bode plots. The inset of (a) shows the equivalent electrical circuit for the specimen.

Figure 9.
SEM micrographs for the samples RASP-processed for (a) 5 min, (b) 10 min and (c)15 min after potentiodynamic polarization in the 0.2 M NaCl + 0.05 M Na2SO4 solution.
Figure 9.
SEM micrographs for the samples RASP-processed for (a) 5 min, (b) 10 min and (c)15 min after potentiodynamic polarization in the 0.2 M NaCl + 0.05 M Na2SO4 solution.

Figure 10.
(a) TEM image of the top surface layer of the sample RASP-processed for 5 min; (b) the corresponding selected-area electron diffraction (SAED) pattern in (a); (c) grain size distribution in the top surface layer.
Figure 10.
(a) TEM image of the top surface layer of the sample RASP-processed for 5 min; (b) the corresponding selected-area electron diffraction (SAED) pattern in (a); (c) grain size distribution in the top surface layer.

Figure 11.
TEM images of the SA106B low-carbon steel. (a) RASP-processed for 0 min; (b) RASP-processed for 5 min; (c) The corresponding selected-area electron diffraction (SAED) pattern in (b).
Figure 11.
TEM images of the SA106B low-carbon steel. (a) RASP-processed for 0 min; (b) RASP-processed for 5 min; (c) The corresponding selected-area electron diffraction (SAED) pattern in (b).


Table 1.
Chemical composition of the SA106B carbon steel (wt. %).
| C | Mn | Si | S | P | Cr | Mo | V | Fe |
|---|---|---|---|---|---|---|---|---|
| 0.21 | 0.53 | 0.26 | 0.008 | 0.011 | 0.02 | 0.01 | 0.01 | Balance |
Table 2.
Electrochemical parameters of SA106B low-carbon steel for various RASP-processed periods ranging from 0 min to 20 min in the 0.05 M H2SO4 + 0.05 M Na2SO4 solution.
Table 2.
Electrochemical parameters of SA106B low-carbon steel for various RASP-processed periods ranging from 0 min to 20 min in the 0.05 M H2SO4 + 0.05 M Na2SO4 solution.
| RASP Time (min) | Ecorr (mVSCE) | Icorr (μA/cm2) |
|---|---|---|
| 0 | −576 (±10) | 490 (±11) |
| 5 | −560 (±8) | 44 (±6) |
| 10 | −586 (±9) | 227 (±8) |
| 15 | −601 (±12) | 295 (±15) |
| 20 | −603 (±5) | 380 (±26) |
Table 3.
Electrochemical parameters of SA106B low-carbon steel for various RASP-processed periods ranging from 0 min to 20 min in the 0.2 M NaCl + 0.05 M Na2SO4 solution.
Table 3.
Electrochemical parameters of SA106B low-carbon steel for various RASP-processed periods ranging from 0 min to 20 min in the 0.2 M NaCl + 0.05 M Na2SO4 solution.
| RASP Time (min) | Ecorr (mVSCE) | Icorr (μA/cm2) |
|---|---|---|
| 0 | −620 (±11) | 19.80 (±1.79) |
| 5 | −588 (±15) | 7.78 (±0.37) |
| 10 | −676 (±12) | 8.50 (±0.29) |
| 15 | −641 (±9) | 8.90 (±0.31) |
| 20 | −645 (±12) | 9.55 (±0.43) |
Table 4.
Equivalent-circuit element values for EIS data corresponding to the SA106B low-carbon steel treated for different times in 0.05 M H2SO4 + 0.05 M Na2SO4 solution.
Table 4.
Equivalent-circuit element values for EIS data corresponding to the SA106B low-carbon steel treated for different times in 0.05 M H2SO4 + 0.05 M Na2SO4 solution.
| RASP Time (min) | Rs (Ω·cm2) | Rct (Ω·cm2) | Q Parameters | C1 (F/cm2) | Cad (F/cm2) | R1 (Ω·cm2) | Rad (Ω·cm2) | RL (Ω·cm2) | L (H·cm2) | |
|---|---|---|---|---|---|---|---|---|---|---|
| Y0 (µF/cm2) | α | |||||||||
| 0 | 4.1 | 63.4 | 20.83 | 0.91 | 5.59 × 10⁻⁸ | 2.16 × 10⁻⁵ | 33.3 | 45.1 | 168.2 | 84.3 |
| 5 | 8.3 | 282.1 | 2.73 | 0.92 | 1.20 × 10⁻⁷ | 1.42 × 10⁻⁶ | 12.7 | 248.1 | 320.3 | 398.4 |
| 10 | 10.3 | 202 | 11.63 | 0.79 | 1.23 × 10⁻⁷ | 3.05 × 10⁻⁶ | 15.8 | 222.2 | 534.6 | 718.6 |
| 15 | 10.2 | 201.7 | 12.93 | 0.83 | 1.15 × 10⁻⁷ | 3.99 × 10⁻⁶ | 16.8 | 164.4 | 416.6 | 483.2 |
| 20 | 11.0 | 101.9 | 16.75 | 0.78 | 8.55 × 10⁻⁸ | 1.10 × 10⁻⁵ | 23.9 | 95.5 | 231.4 | 381.5 |
Table 5.
Equivalent-circuit element values for EIS data corresponding to the SA106B low-carbon steel treated for different times 0.2 M NaCl + 0.05 M Na2SO4 solution.
Table 5.
Equivalent-circuit element values for EIS data corresponding to the SA106B low-carbon steel treated for different times 0.2 M NaCl + 0.05 M Na2SO4 solution.
| RASP Time (min) | Rs (Ω·cm2) | Rct (Ω·cm2) | Q Parameters | C1 (F/cm2) | Cad (F/cm2) | R1 (Ω·cm2) | Rad (Ω·cm2) | RL (Ω·cm2) | L (H·cm2) | |
|---|---|---|---|---|---|---|---|---|---|---|
| Y0 (µF/cm2) | α | |||||||||
| 0 | 1.8 | 56.9 | 1394 | 0.64 | 4.40 × 10⁻⁸ | 0.000102 | 19.4 | 58.1 | 321.9 | 1656 |
| 5 | 8.2 | 222.3 | 684 | 0.67 | 1.65 × 10⁻⁷ | 0.000107 | 7.2 | 141.2 | 186.5 | 867 |
| 10 | 7.0 | 208.7 | 837.6 | 0.61 | 2.64 × 10⁻⁷ | 0.000200 | 7.9 | 154.8 | 386.0 | 1867 |
| 15 | 5.5 | 199.9 | 1171 | 0.58 | 8.59 × 10⁻⁸ | 0.000142 | 12.2 | 74.4 | 1308.0 | 3746 |
| 20 | 3.5 | 172.1 | 1939 | 0.53 | 3.51 × 10⁻⁸ | 0.000064 | 21.3 | 78.5 | 520.9 | 2847 |
© 2019 by the authors. Licensee MDPI, Basel, Switzerland. This article is an open access article distributed under the terms and conditions of the Creative Commons Attribution (CC BY) license (http://creativecommons.org/licenses/by/4.0/).
Share and Cite
MDPI and ACS Style
Lei, C.; Chen, X.; Li, Y.; Chen, Y.; Yang, B. Enhanced Corrosion Resistance of SA106B Low-Carbon Steel Fabricated by Rotationally Accelerated Shot Peening. Metals 2019, 9, 872. https://doi.org/10.3390/met9080872
AMA Style
Lei C, Chen X, Li Y, Chen Y, Yang B. Enhanced Corrosion Resistance of SA106B Low-Carbon Steel Fabricated by Rotationally Accelerated Shot Peening. Metals. 2019; 9(8):872. https://doi.org/10.3390/met9080872
Chicago/Turabian StyleLei, Chaonan, Xudong Chen, Yusheng Li, Yuefeng Chen, and Bin Yang. 2019. "Enhanced Corrosion Resistance of SA106B Low-Carbon Steel Fabricated by Rotationally Accelerated Shot Peening" Metals 9, no. 8: 872. https://doi.org/10.3390/met9080872
Note that from the first issue of 2016, this journal uses article numbers instead of page numbers. See further details here.