Niobium Additions to a 15%Cr–3%C White Iron and Its Effects on the Microstructure and on Abrasive Wear Behavior

1
Foundry Department, Metallurgical Research institute, Michoacan University of Saint Nicholas of Hidalgo, PC 58000 Morelia, Michoacán, Mexico
2
Faculty of Mechanical Engineering, Autonomous University of the State of Hidalgo, PC 43990 Cd Sahagun, Hidalgo, Mexico
*
Author to whom correspondence should be addressed.
Metals 2019, 9(12), 1321; https://doi.org/10.3390/met9121321
Submission received: 10 November 2019
/
Revised: 2 December 2019
/
Accepted: 2 December 2019
/
Published: 7 December 2019
(This article belongs to the Special Issue Cast Irons: Properties and Applications)
Abstract
:From the present study, niobium additions of 1.79% and 3.98% were added to a 15% Cr–3% C white iron, and their effects on the microstructure, hardness and abrasive wear were analyzed. The experimental irons were melted in an open induction furnace and cast into sand molds to obtain bars of 45 mm diameter. The alloys were characterized by optical and electron microscopy, and X-ray diffraction. Bulk hardness was measured in the as-cast conditions and after a destabilization heat treatment at 900 °C for 30 min. Abrasive wear resistance tests were undertaken for the different irons according to the ASTM G65 standard in both as-cast and heat-treated conditions under three loads (58, 75 and 93 N). The results show that niobium additions caused a decrease in the carbon content in the alloy and that some carbon is also consumed by forming niobium carbides at the beginning of the solidification process; thus decreasing the eutectic M7C3 carbide volume fraction (CVF) from 30% for the base iron to 24% for the iron with 3.98% Nb. However, the overall carbide content was constant at 30%; bulk hardness changed from 48 to 55 hardness Rockwell C (HRC) and the wear resistance was found to have an interesting behavior. At the lowest load, wear resistance for the base iron was 50% lower than that for the 3.98% Nb iron, which is attributed to the presence of hard NbC. However, at the highest load, the wear behavior was quite similar for all the irons, and it was attributed to a severe carbide cracking phenomenon, particularly in the as-cast alloys. After the destabilization heat treatment, the wear resistance was higher for the 3.98% Nb iron at any load; however, at the highest load, not much difference in wear resistance was observed. Such a behavior is discussed in terms of the carbide volume fraction (CVF), the amount of niobium carbides, the amount of martensite/austenite in matrix and the amount of secondary carbides precipitated during the destabilization heat treatment.
1. Introduction
High-chromium white irons are widely used in the mineral processing industry due to their excellent wear behavior under abrasive conditions. A microstructure consisting of a network of hard eutectic M7C3 carbides in a mainly austenitic (as-cast) or martensitic (after a heat treatment) matrix makes these irons very suitable for severe wear applications [1,2,3,4]. To improve abrasive behavior in the as-cast iron, an increase in carbon and chromium would increase the carbide volume fraction. Other way to improve wear behavior is to apply a destabilization heat treatment to precipitate secondary carbides and to transform the austenitic matrix into a martensitic one [5,6,7,8,9,10]. However, these two actions would decrease fracture toughness in the alloy; which is important, particularly when abrasive wear is accompanied by repetitive impact. Under this basis, big efforts have been made to improve wear behavior without affecting considerably fracture toughness in the as-cast conditions. A strategy for this has been to reinforce the as-cast austenitic matrix with harder primary carbides such as niobium, vanadium or titanium carbides. The use of titanium is commonly limited to amounts lower than 2% in these alloys due to difficulty of adding higher amounts in an open furnace during the alloy making [11,12,13]. Additions of more than 2% titanium would only be possible by using a vacuum induction furnace. To get primary vanadium carbides, at least vanadium amounts of 5% are necessary, other way vanadium only reinforces the M7C3 carbide [14,15,16]. In the case of niobium, most works studying the effect of this carbide-forming element are limited to amounts of less than 3% [11,12,17,18,19,20,21,22,23] but up to 5% have been also produced along with high amounts of Mo and W [24]. Niobium forms primary carbides in the liquid and are later enclosed by austenite upon solidification; the size and distribution of which depends on the solidification rate (thickness of the casting). Thin castings may produce small well distributed NbC while thick castings will produce large segregated NbC carbides. The wear behavior of these Nb alloyed irons will depend the amount, size and distribution of these carbides which are much harder than the eutectic M7C3 (2400 HV and 1500 HV respectively) [25]. The present work analyzes the effect of 2% and 4% Nb in a 15% Cr–3% C iron cast into 45 mm diameter bars, and the abrasive wear behavior is described as a function of the NbC content and the applied load.
2. Experimental Procedure
The experimental alloys for the present work were melted in an open induction furnace by using high purity raw materials. Three 15% Cr–3% C irons with 0%, 2% and 4% Nb were cast at 1500 °C into sand molds to obtain bars of 45 mm diameter. Chemical analysis was undertaken by spectrometry from chill samples obtained during casting for each alloy, and the results are shown in the next section.
The solidification sequence and the final microstructure for each iron was predicted by JMatPro® version 9.0 (Sente Software LTD, Guildford, UK) and verified during the subsequent characterization. For the three alloys, a destabilization heat treatment was undertaken at 900 °C for 30 min followed for an air cooling to room temperature. Samples for metallographic characterization and wear tests, were undertaken from the bars in the as-cast and heat treated conditions. Sample cutting was carried out by mean of abrasive discs; cutting was driven as slow as possible in order to avoid excessive overheating that may cause cracking in the samples. Additionally, copious amounts of water as coolant were used.
Samples for metallographic characterization were prepared in the traditional way of abrasive paper and then polished on nylon cloths by diamond paste (6 μm and then 1 μm). Once polished, the specimens were etched with Villela’s reagent (5 mL HCl and 1 g picric acid in 100 mL ethanol) for 30 s to reveal the microstructure. Carbide volume fraction was measured by image analysis on digital micrographs from deep etched samples. Phase constitution was undertaken by X-ray diffraction (XRD) in a BRUKER D8 (Bruker, Karlsruhe, Germany), diffractometer by using Co-kα radiation in a 2θ range of 30°–130°. An SEM JEOL 6400 (JEOL LTD, Peabody, MA, USA) was also used for imaging by secondary and backscattered electrons. The wear behavior of the high- chromium irons in the as-cast and heat treated conditions was undertaken under abrasive wear by using a rubber wheel testing machine and silica sand as abrasive.
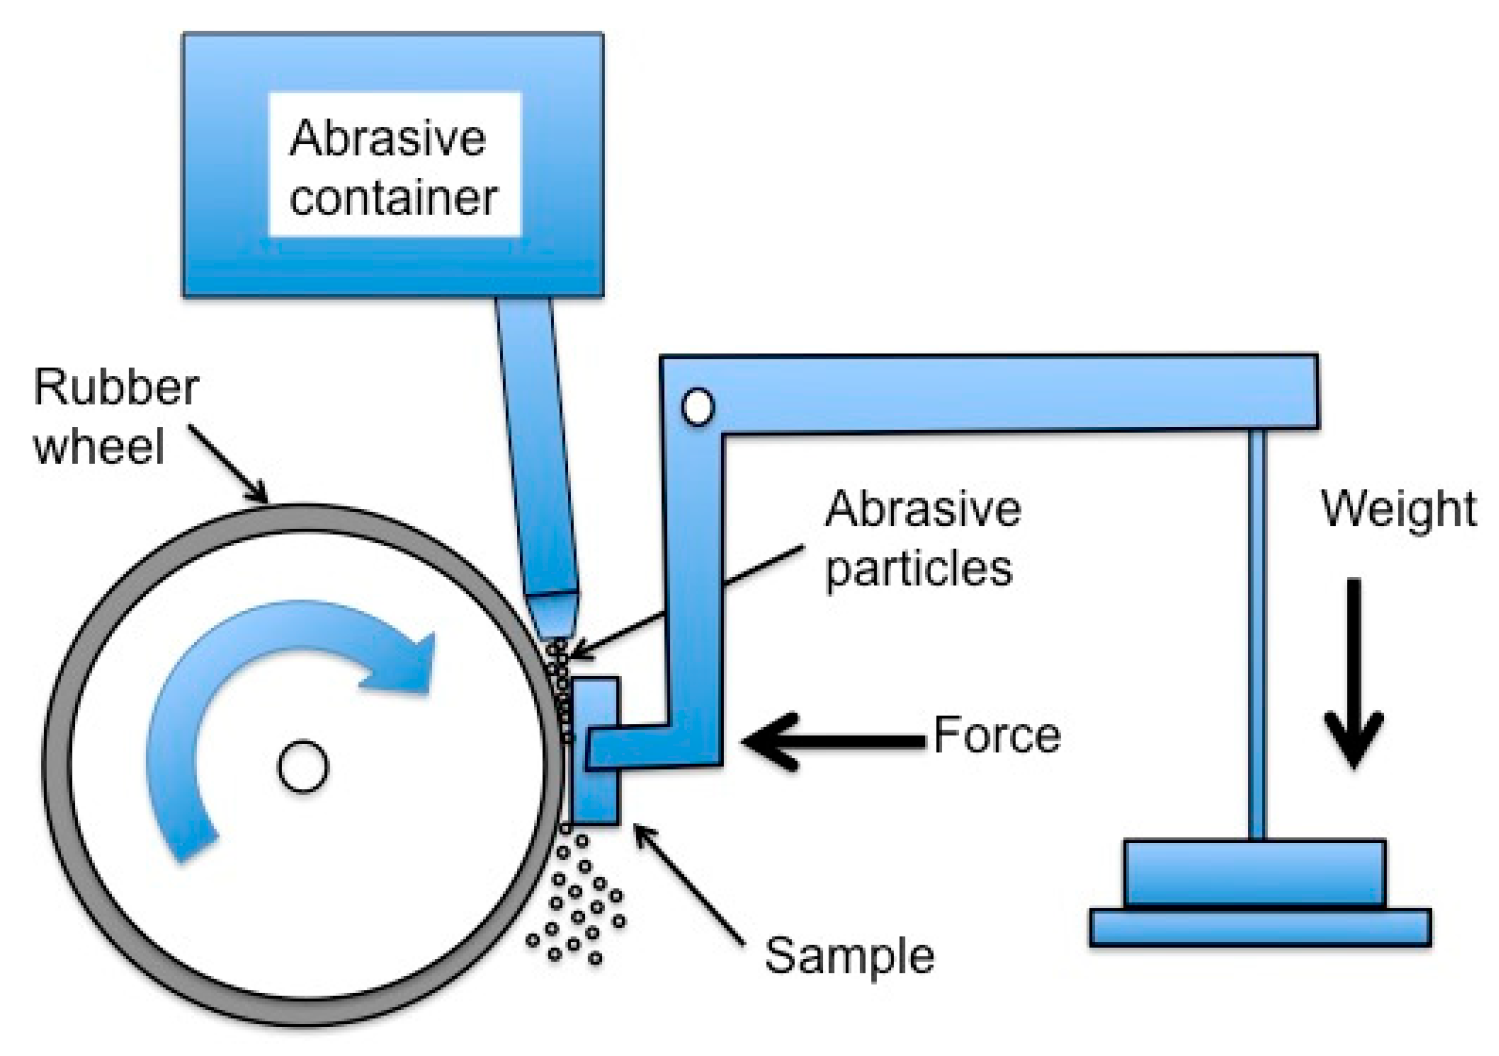
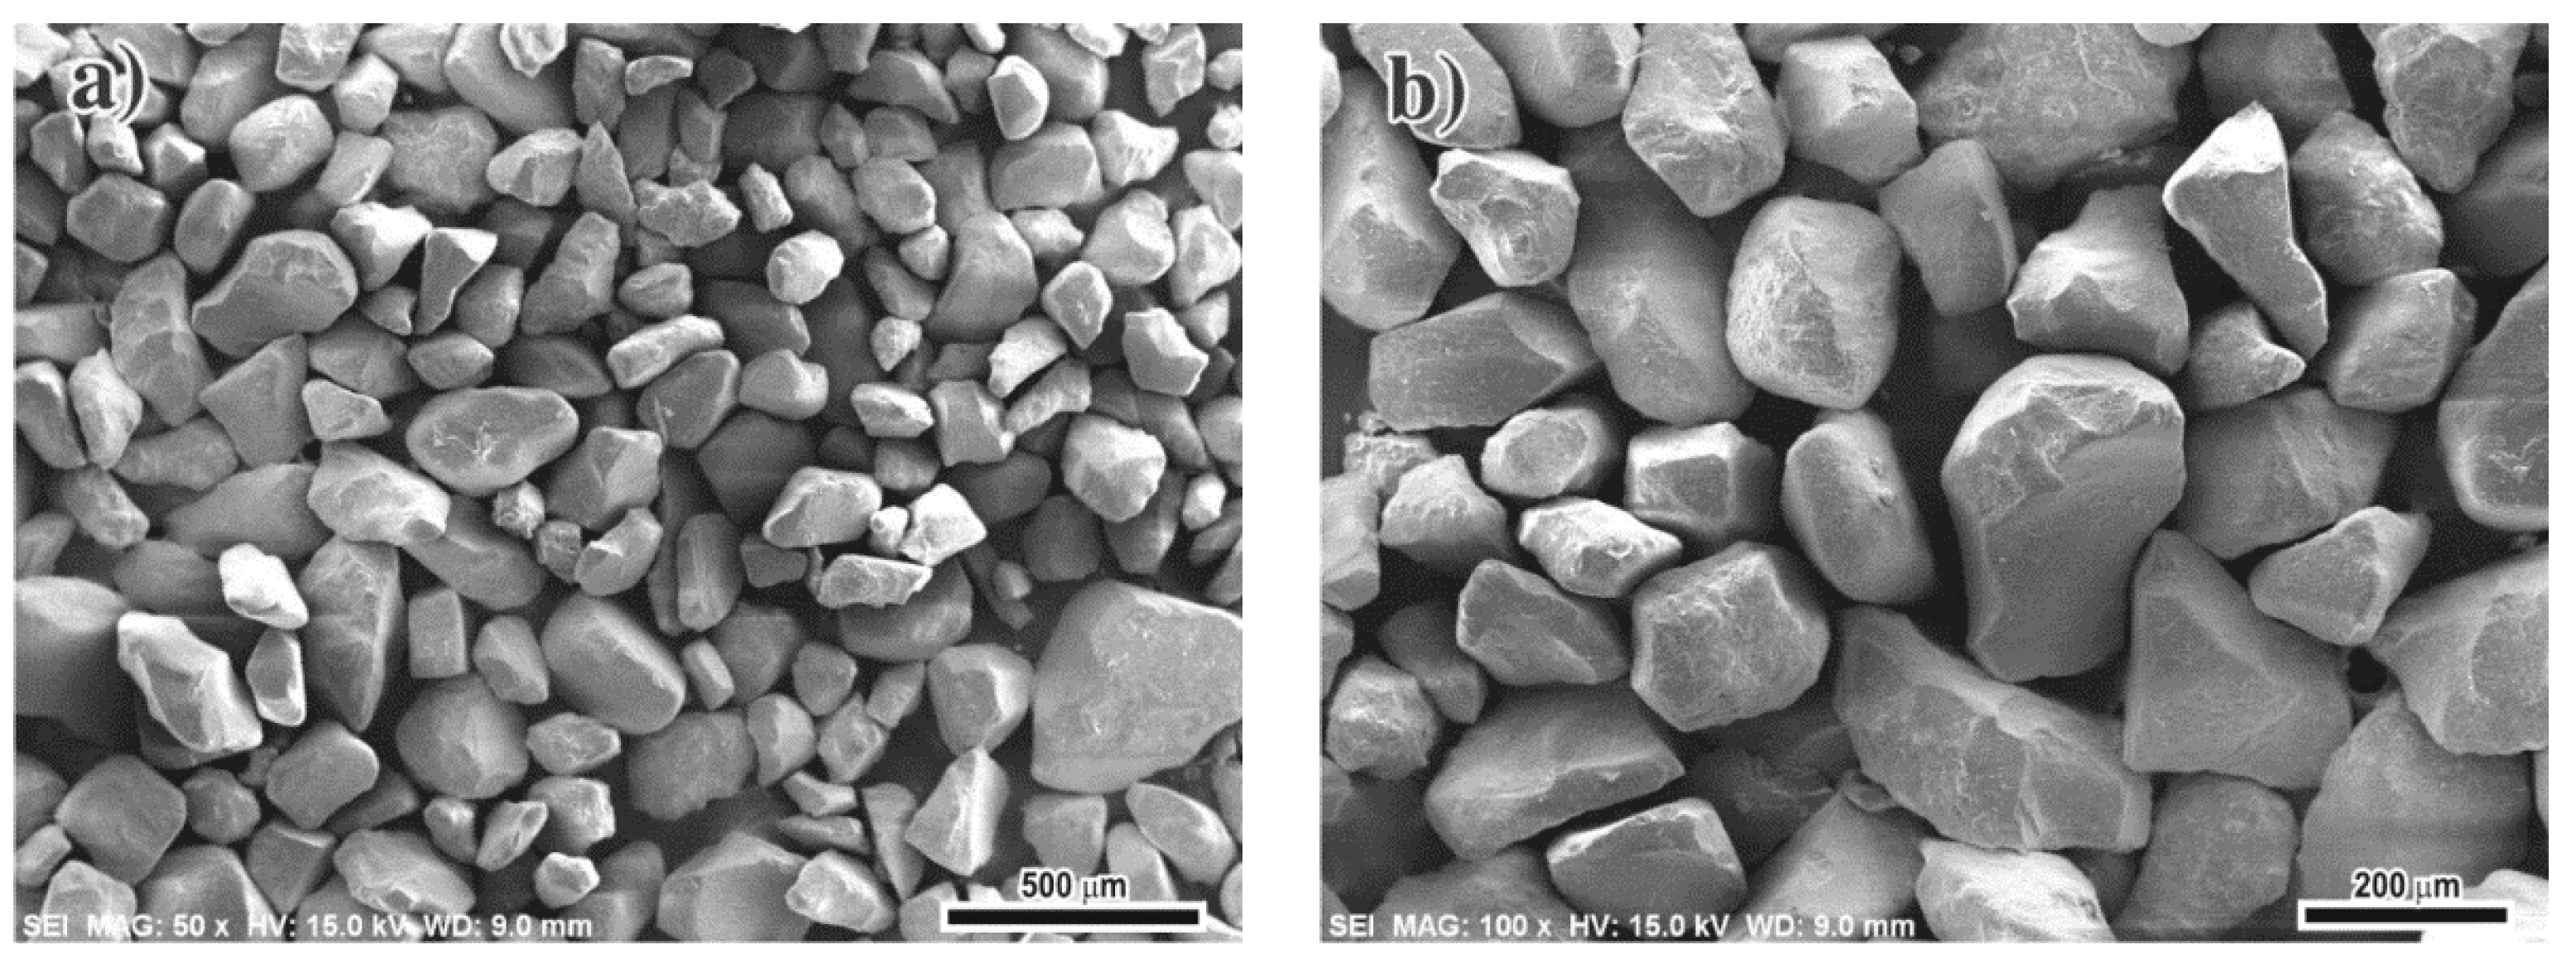
The abrasive wear tests were undertaken for the different irons according to the ASTM G65 standard in both as-cast and heat-treated conditions under three loads (58, 75 and 93 N). were done by placing the rubbing surface of the wheel against a 25 × 25 mm2 surface of the iron sample and pouring the abrasive particles between the surfaces at a flow of 3.5 cm3 s−1. Figure 1 shows a schematic draw of the wear test; and Figure 2 shows two SEM micrographs of the abrasive sand used for the tests to evidence size and shape; the mean size of the abrasive particles was 185 μm. The rubbing surfaces were sliding during 15 min at a speed of 500 rpm. The iron samples were polished to a roughness of 0.25 μm before the test. Three tests were undertaken for each condition and the mean value was plotted. The volume loss for each sample was measured by an optical profiler (NANOVEA PS50 3D Non-Contact Profiler, Irvine, CA, USA). Worn surfaces and worn surface cross-sections were characterized by Scanning Electron Microscopy (SEM).
3. Results and Discussion
Table 1 shows the chemical composition for the three white cast irons. During making Iron 2 and Iron 3, the niobium additions (as ferro-niobium) were done at the last stage of the melting process before pouring the liquid into the sand molds. Since the ferro-niobium additions were done in a 5 kg based liquid alloy, for higher additions of Fe–Nb less amount of the other elements were expected. This can be seen from Table 1, most element content decreases as the niobium content increased. Niobium contents were 0.014% for Iron 1, 1.795% for Iron 2 and 3.983% for Iron 3; variations in the rest of the elements are considered small for the behavior of the alloys and the effect will focus on the niobium content to describe the alloys behavior.
3.1. As-Cast Microstructure
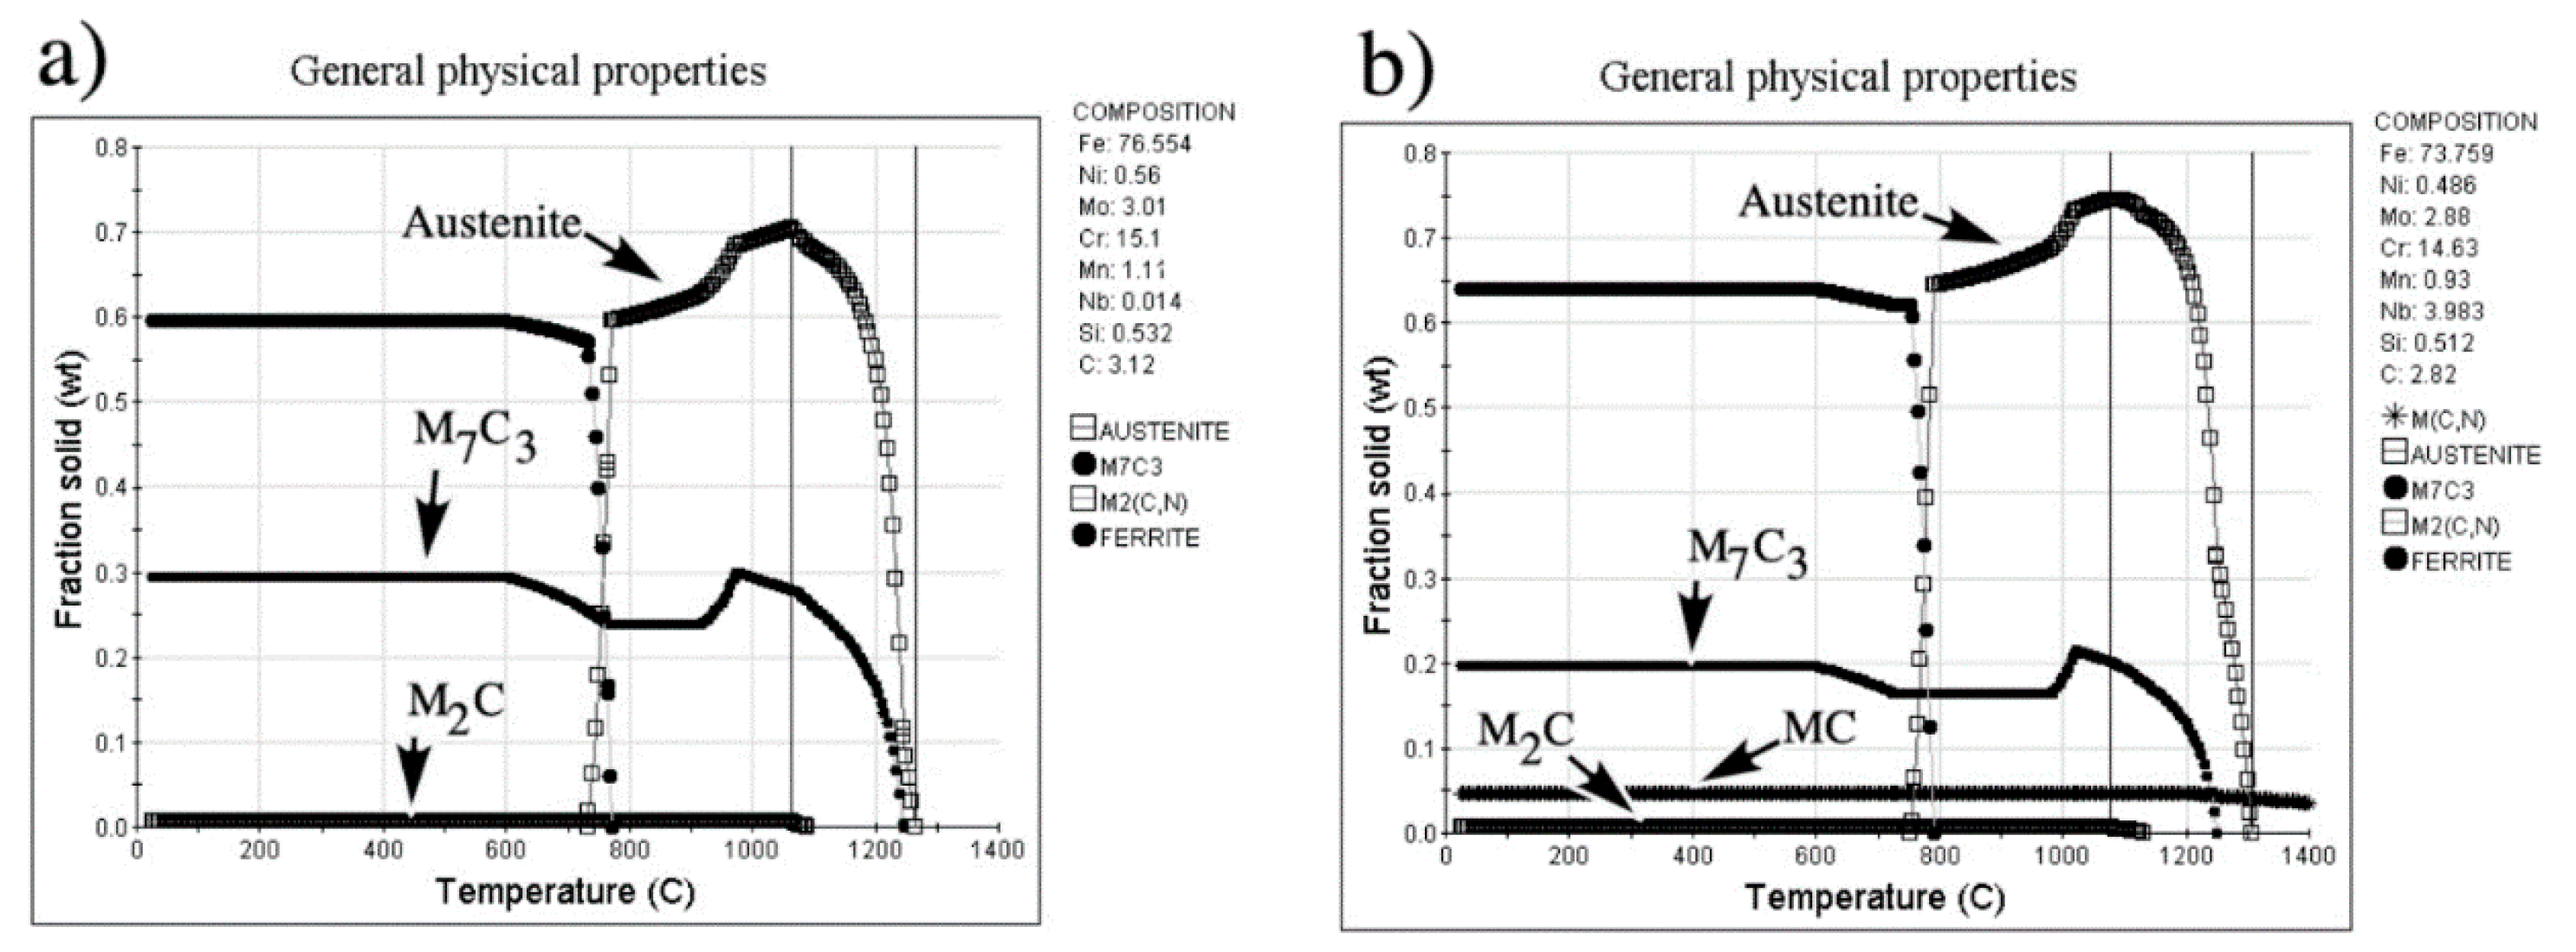
Figure 3 shows the solidification sequence as predicted by JMatPro for two of the experimental irons; (a) Iron 1 (No Nb), and (b) Iron 3 (3.98% Nb). The solidification path is as follows: for Iron 1 solidification starts with the formation of austenite dendrites followed by the eutectic austenite/M7C3 and at the end of the solidification process, the formation of small amounts of carbide type M2C (Molybdenum carbide). In the case of the Iron 3, the first phase to solidify is MC (niobium carbide) then the sequence is the same than that for the Iron I, formation of austenite dendrites, the eutectic austenite/M7C3 and finally small amounts of M2C. Therefore, the predicted microstructure for the base iron (Iron 1) is composed by a network of carbides M7C3 in a matrix of austenite with some M2C carbides, and for the case of the irons with niobium additions, the microstructure is the same as that for the Iron 1 but the difference is the presence of the NbC phase within the austenitic matrix.
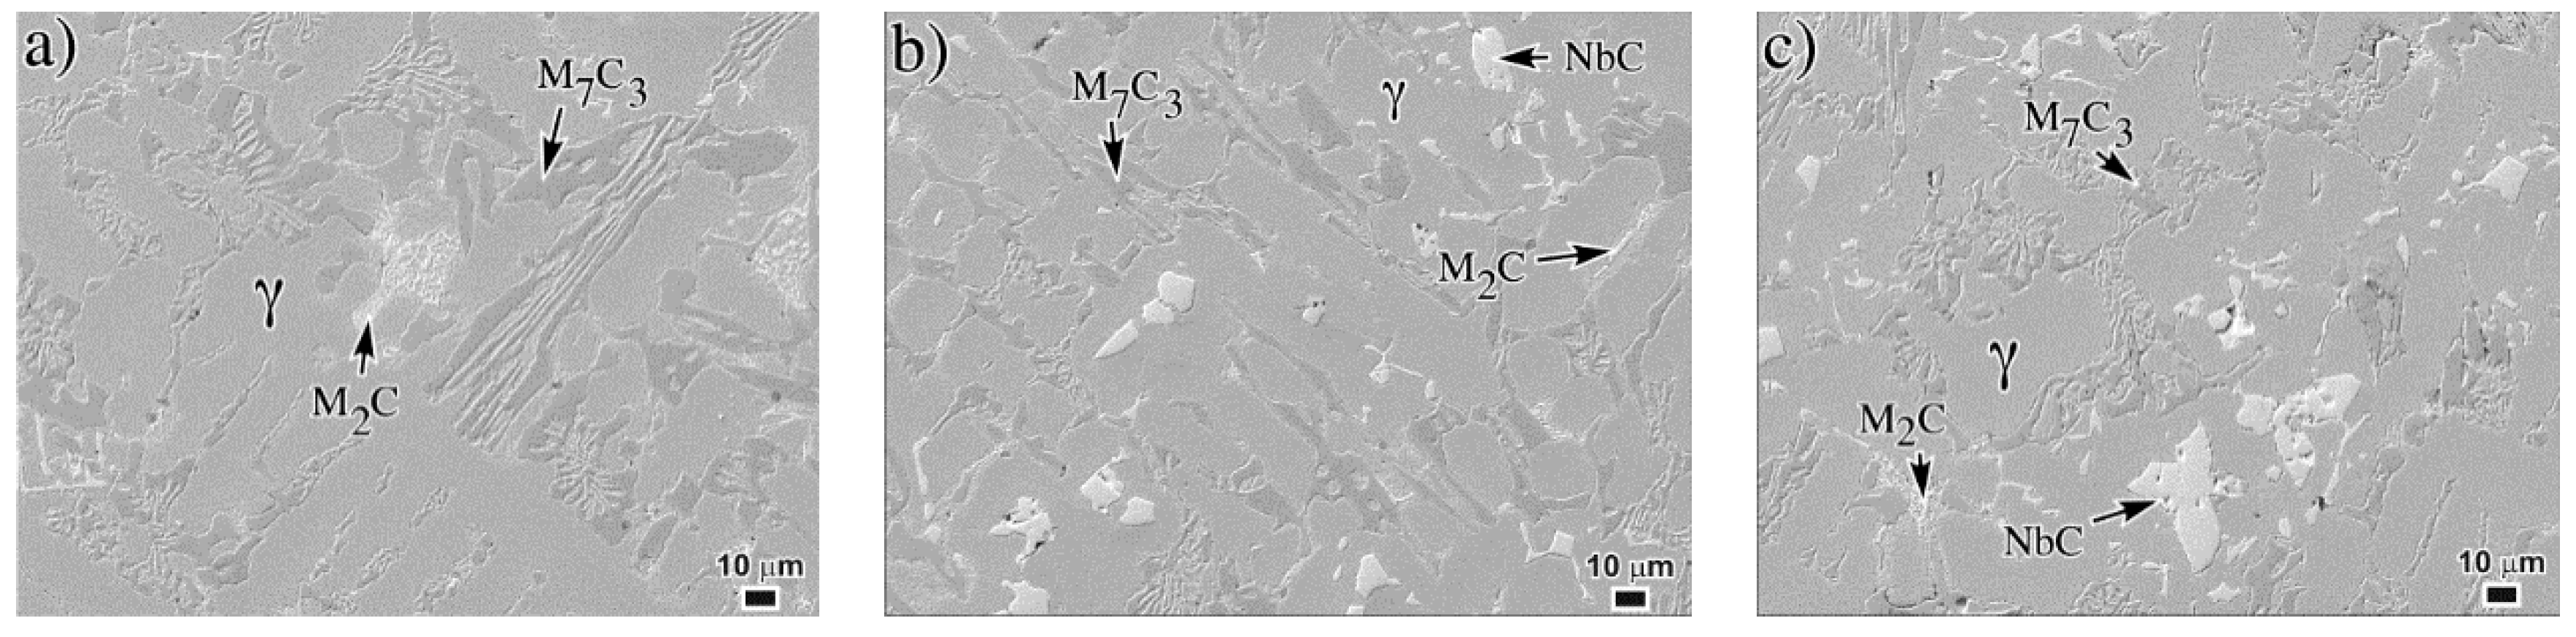
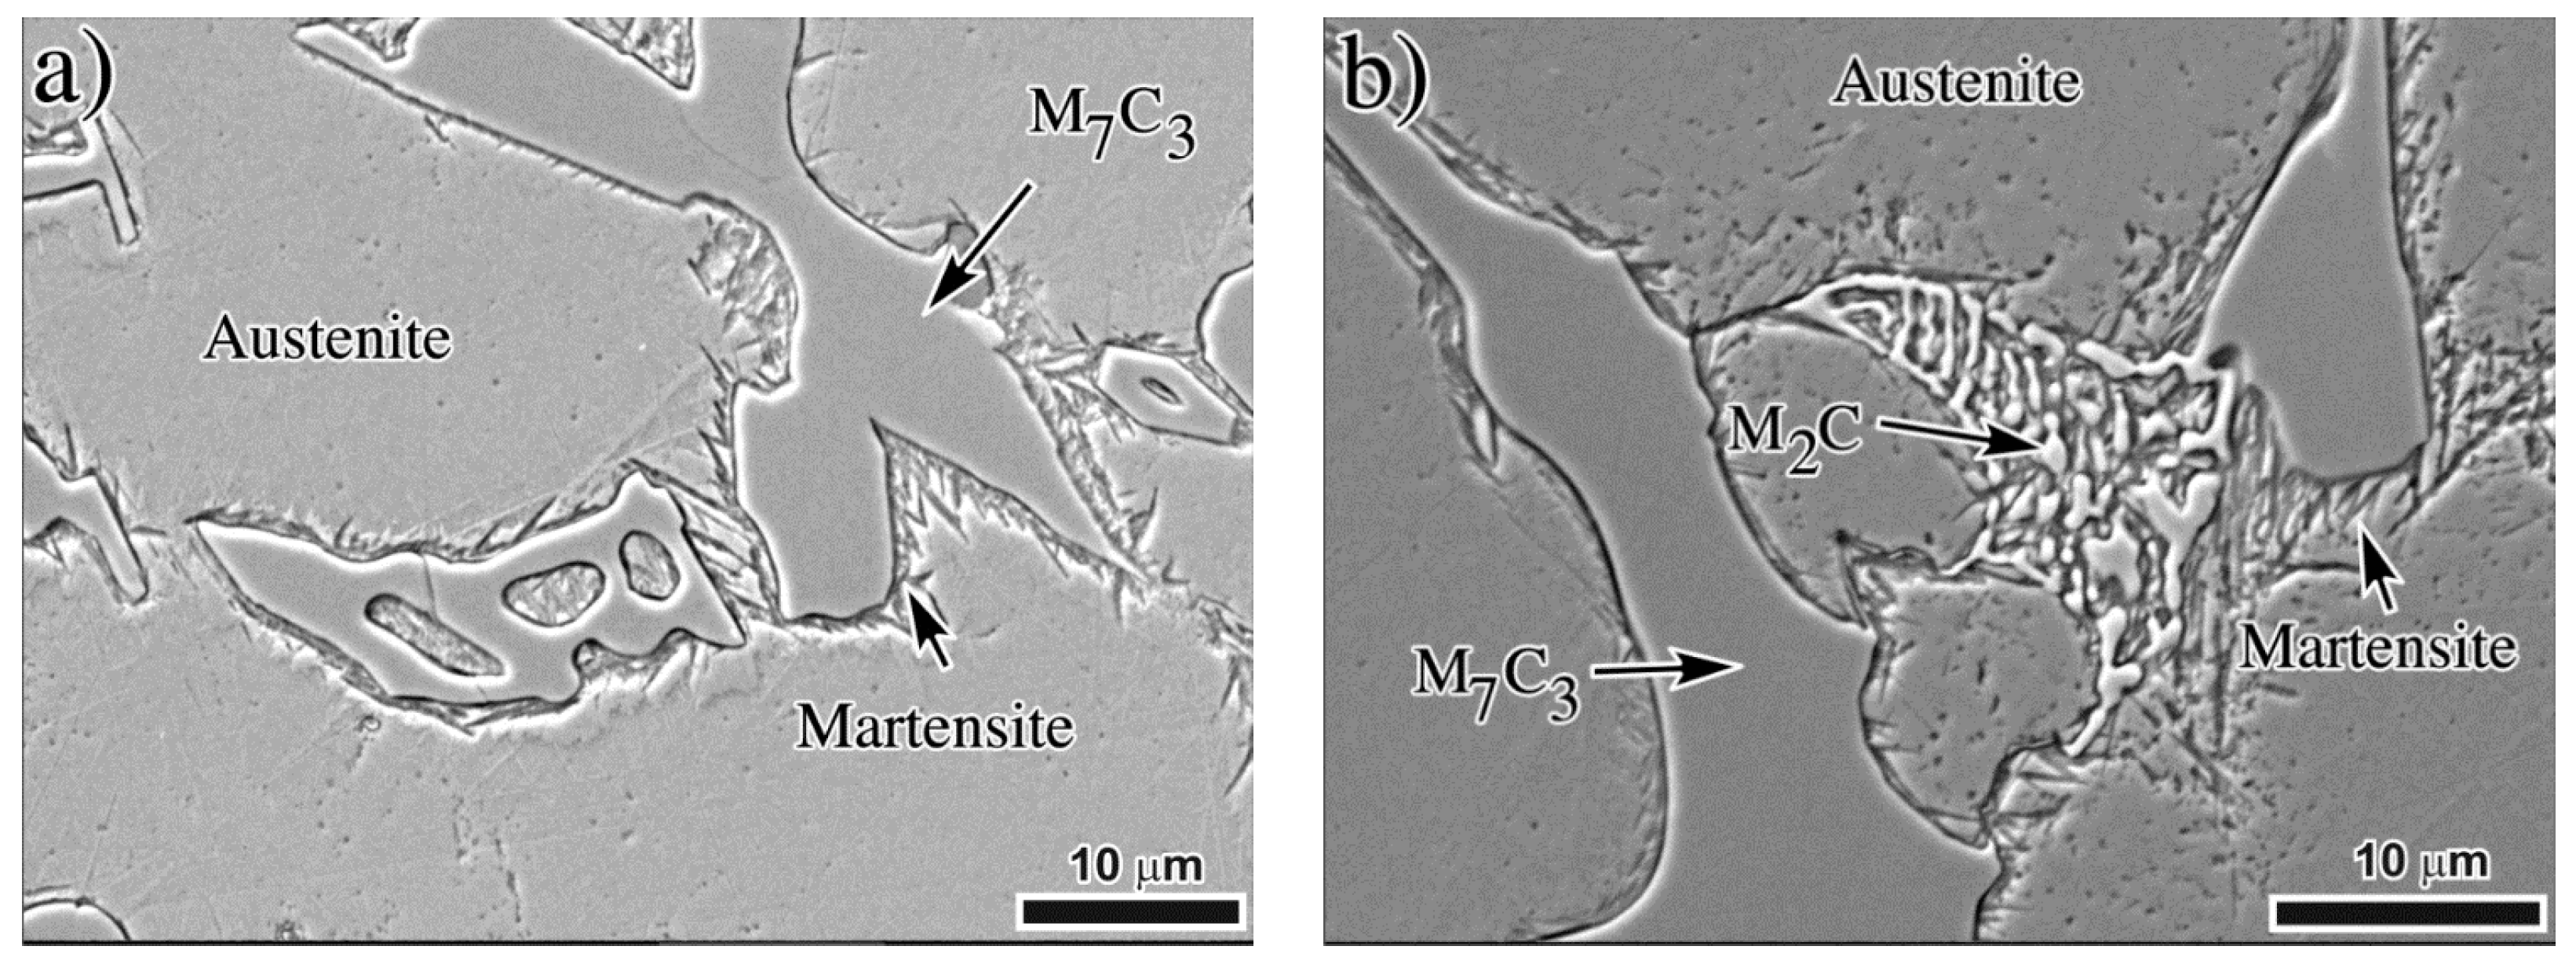
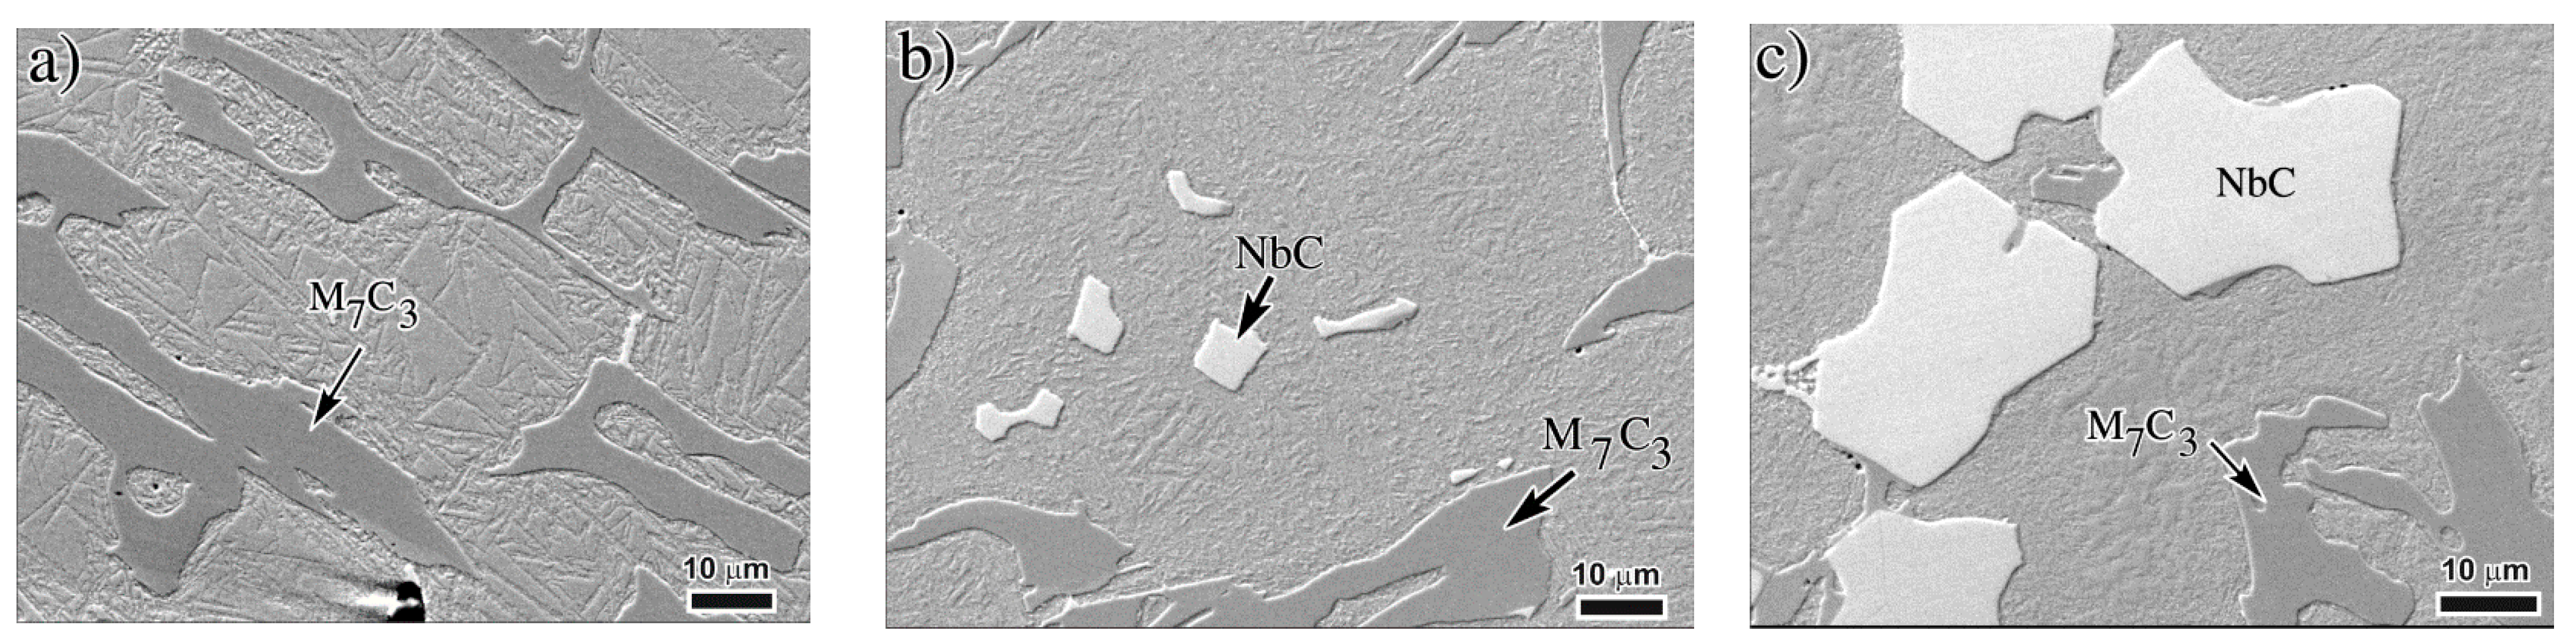
Figure 4 shows the as-cast microstructure for the three experimental irons. Note the presence of NbC in the matrix for the irons with 1.79% and 3.98% Nb, and that the amount and size of these carbides increase with the niobium content. These SEM micrographs show the real microstructure and Table 2 gives the measured amount of each phase and they are compared with the prediction of JMatPro. Note that the predicted and measured amounts of each phase are close, but a small difference was noticed since the real material does not solidify under equilibrium conditions as predicted by the software. The observed microstructure has been widely reported by several authors [12,17,18,19,20,21,22,23] for niobium alloyed white irons. For these measurements, the matrix was considered to be fully austenitic; however, it is well known that some martensitic transformation follows the cooling down process after solidification. Such a transformation takes place at the eutectic austenite and/or at the interface pro-eutectic austenite/eutectic carbide. Figure 5 shows evidence of the presence of martensite and M2C carbide in the 3.98% Nb iron; similar martensitic transformations were also observed for the other as-cast irons. It has been widely reported [1,3,9] that during cooling down to room temperature the austenite close to the eutectic carbide gets impoverished in carbon and it is prone to transform to martensite [1]. The presence of molybdenum rich carbide M2C has been reported in white irons containing Mo, since this element partitions partially to the matrix, partially to the M7C3 carbide and also forms M2C [26,27,28,29].
3.2. As-Heat Treated Microstructure
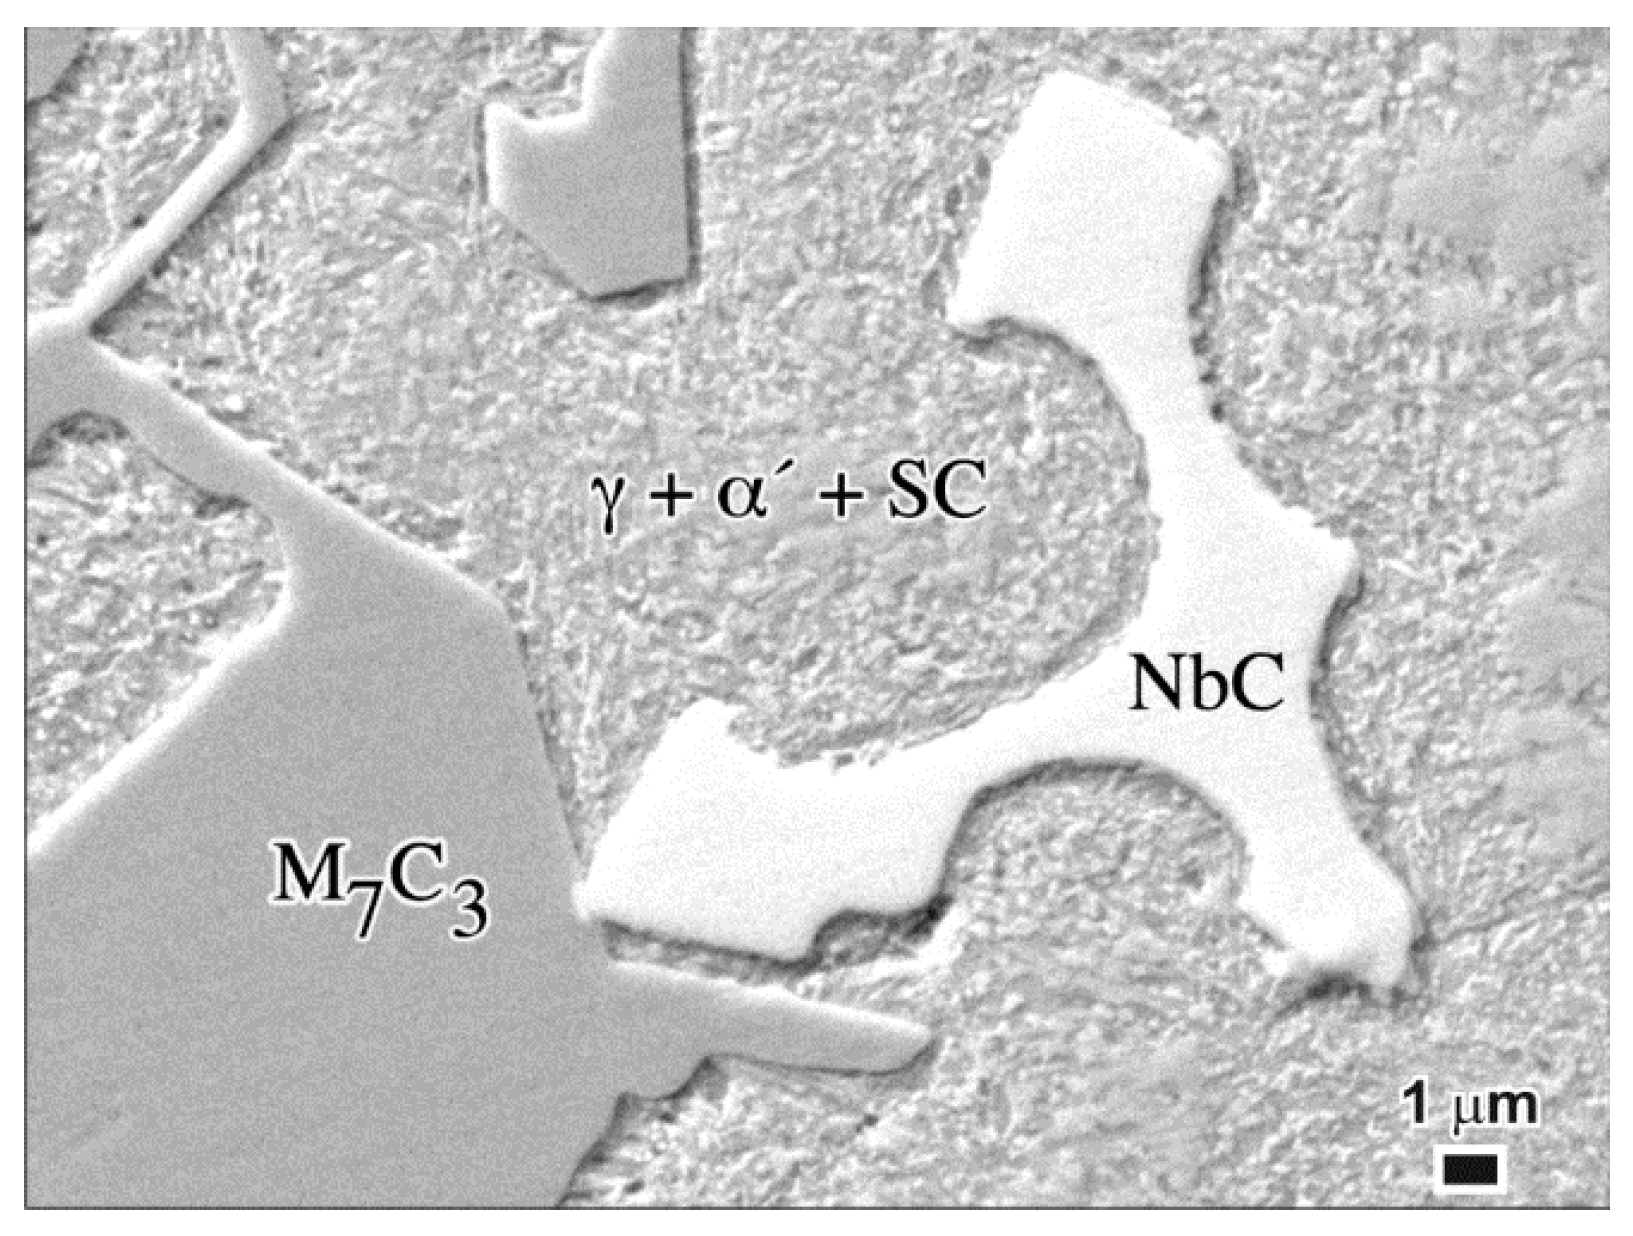
The commonly applied heat treatment to destabilize the austenitic matrix in these irons, involves holding at a temperatures usually between 900 and 1000 °C for 1–6 h depending on the size of the casting. During soaking at these temperatures, secondary carbides precipitate in matrix reducing its alloy content, particularly, the carbon content. The reduced alloy content of the austenitic matrix increases the MS temperature, so that, on cooling to room temperature, the matrix is likely to transform to martensite. Air-cooling from the destabilization temperature is usually sufficient to produce a predominantly martensitic structure while avoiding quench cracking. For the present case, the irons were heat treated at 900 °C for 30 min. The resulted matrix structure was composed of a mixture of retained austenite, martensite and secondary carbides. These microstructures can be seen from SEM pictures from Figure 6 and detail of the nano-sized secondary carbides (SC) can be observed in Figure 7. The amounts of martensite and retained austenite were calculated according to the procedure described by Kim [30] by using X-ray diffraction data and the results are shown from Table 3 where the as-cast phases content are also included, and Figure 8 shows hardness values for both as-cast and heat treated conditions.
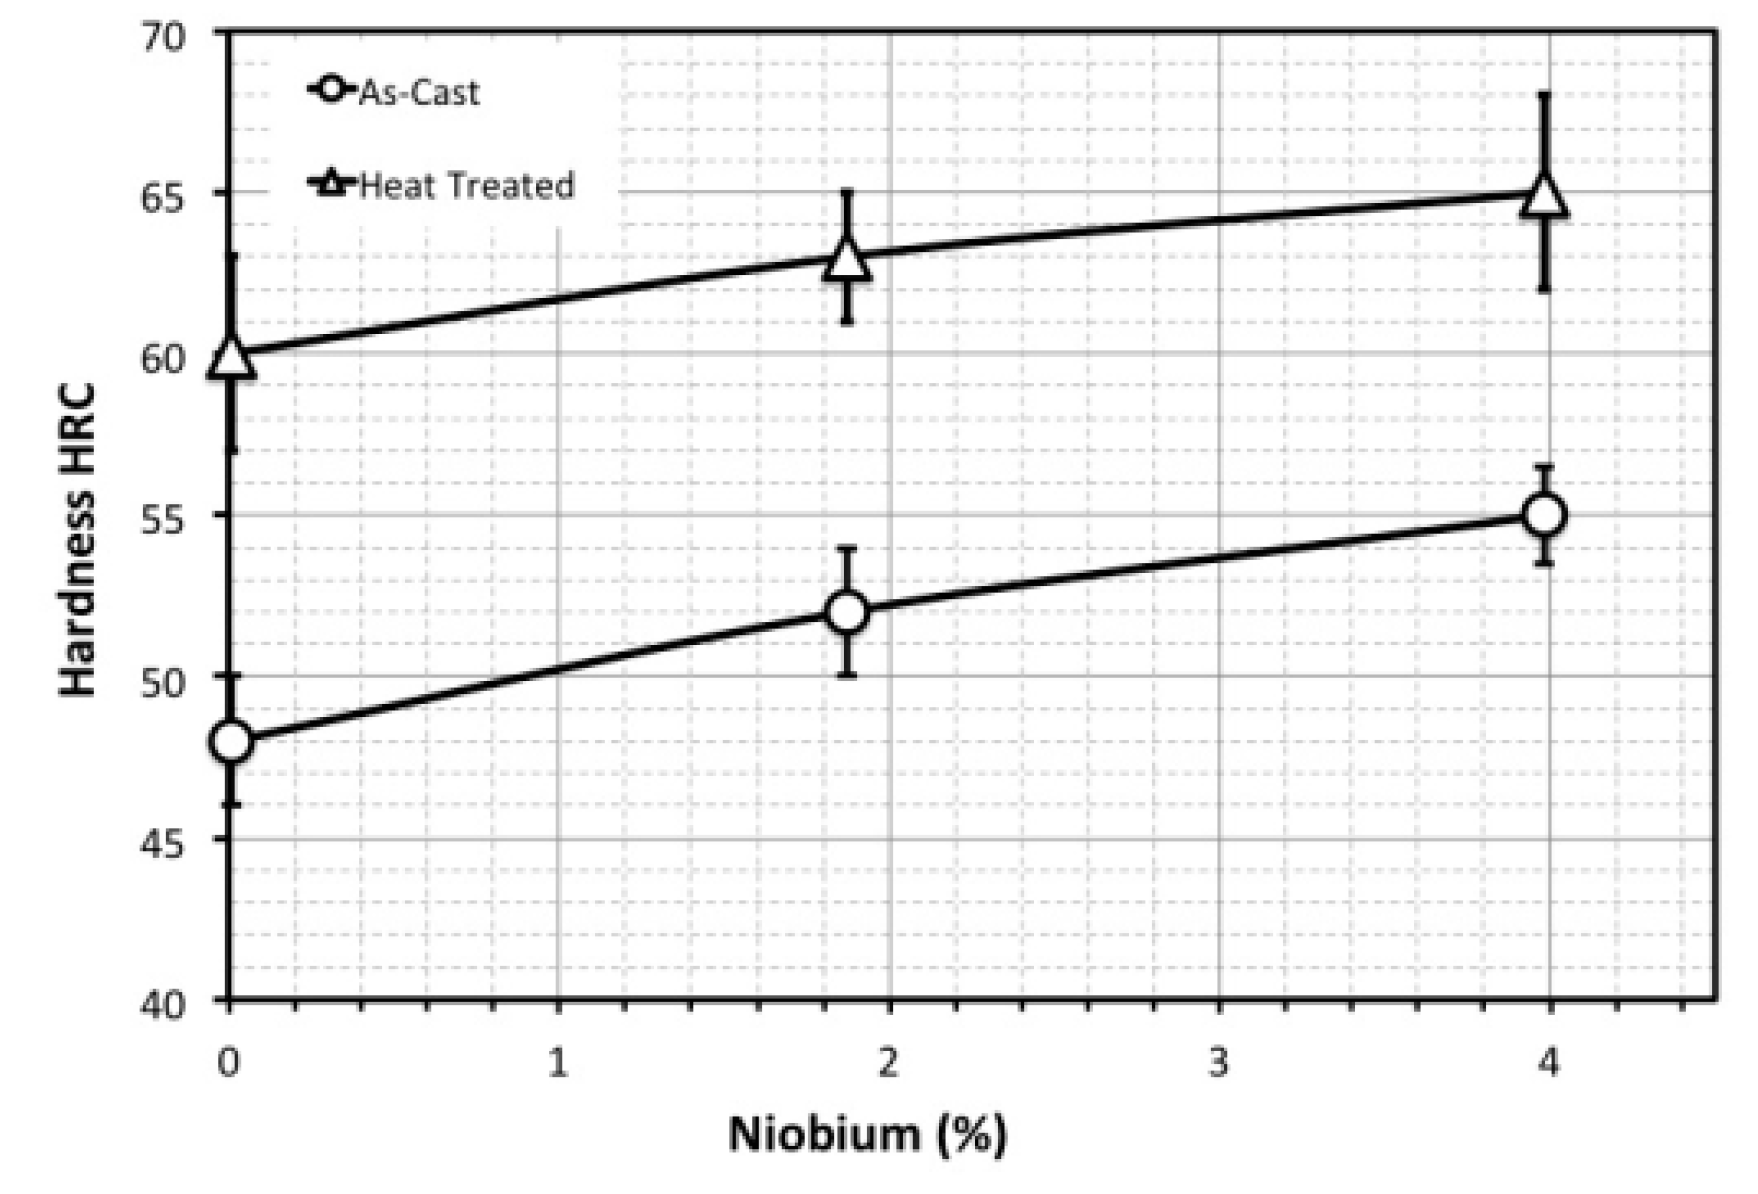
As can be seen, hardness increases as the niobium content increased in the alloys (from 48 to 55 HRC). Furthermore, hardness increased for the heat treated irons and the same tendency was observed when the niobium content increased. The presence of hard NbC contributed to increase hardness of the irons and the precipitation of secondary carbides along with the partial transformation of austenite to martensite in matrix also contributed to increase hardness during the heat treatment (from 60 to 65 HRC). Table 4 shows the microhardness values for the matrix (as-cast and heat treated) and also for the carbides M7C3 and NbC. As can be see, the high hardness of the NbC (about 1230 HV) makes a strong contribution to the overall hardness of the iron. Hradness for the M7C3 remains unchanged for the different Nb additions (around 1110 HV) but the matrix indeed reduces its hardness hen niobium increased. Such a decrease in hardness is attributed to the smaller amount of carbon in austenite as niobium oncreases; as explained above, niobium consumes high amounts of carbon to form the NbC which promotes a depletion of carbon in matrix.
3.3. Wear Behavior
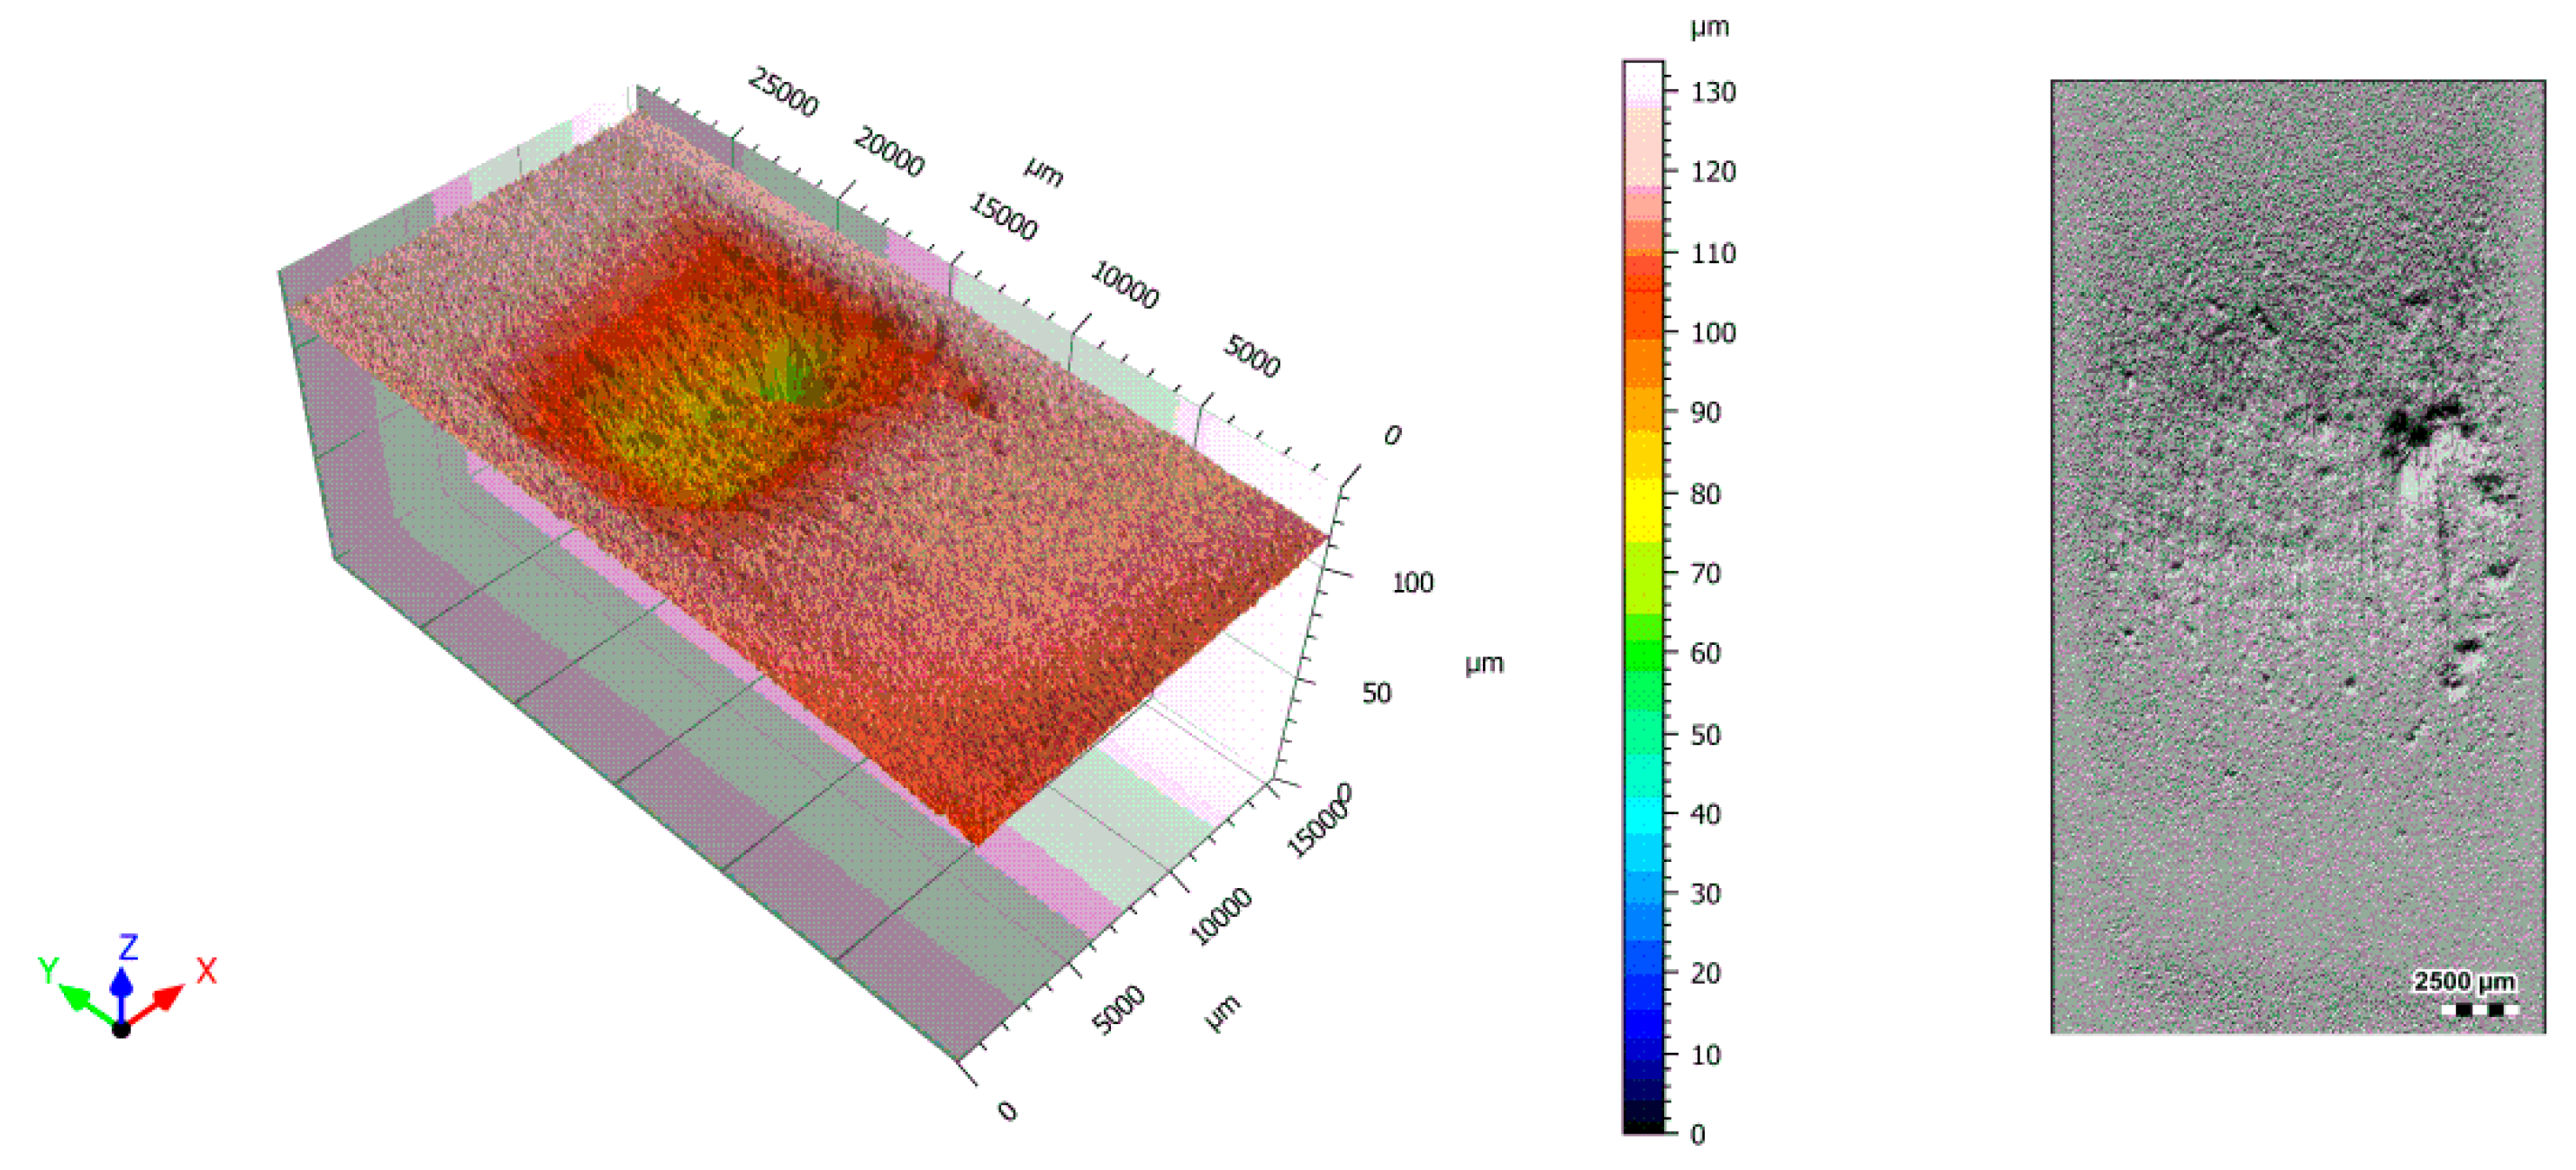
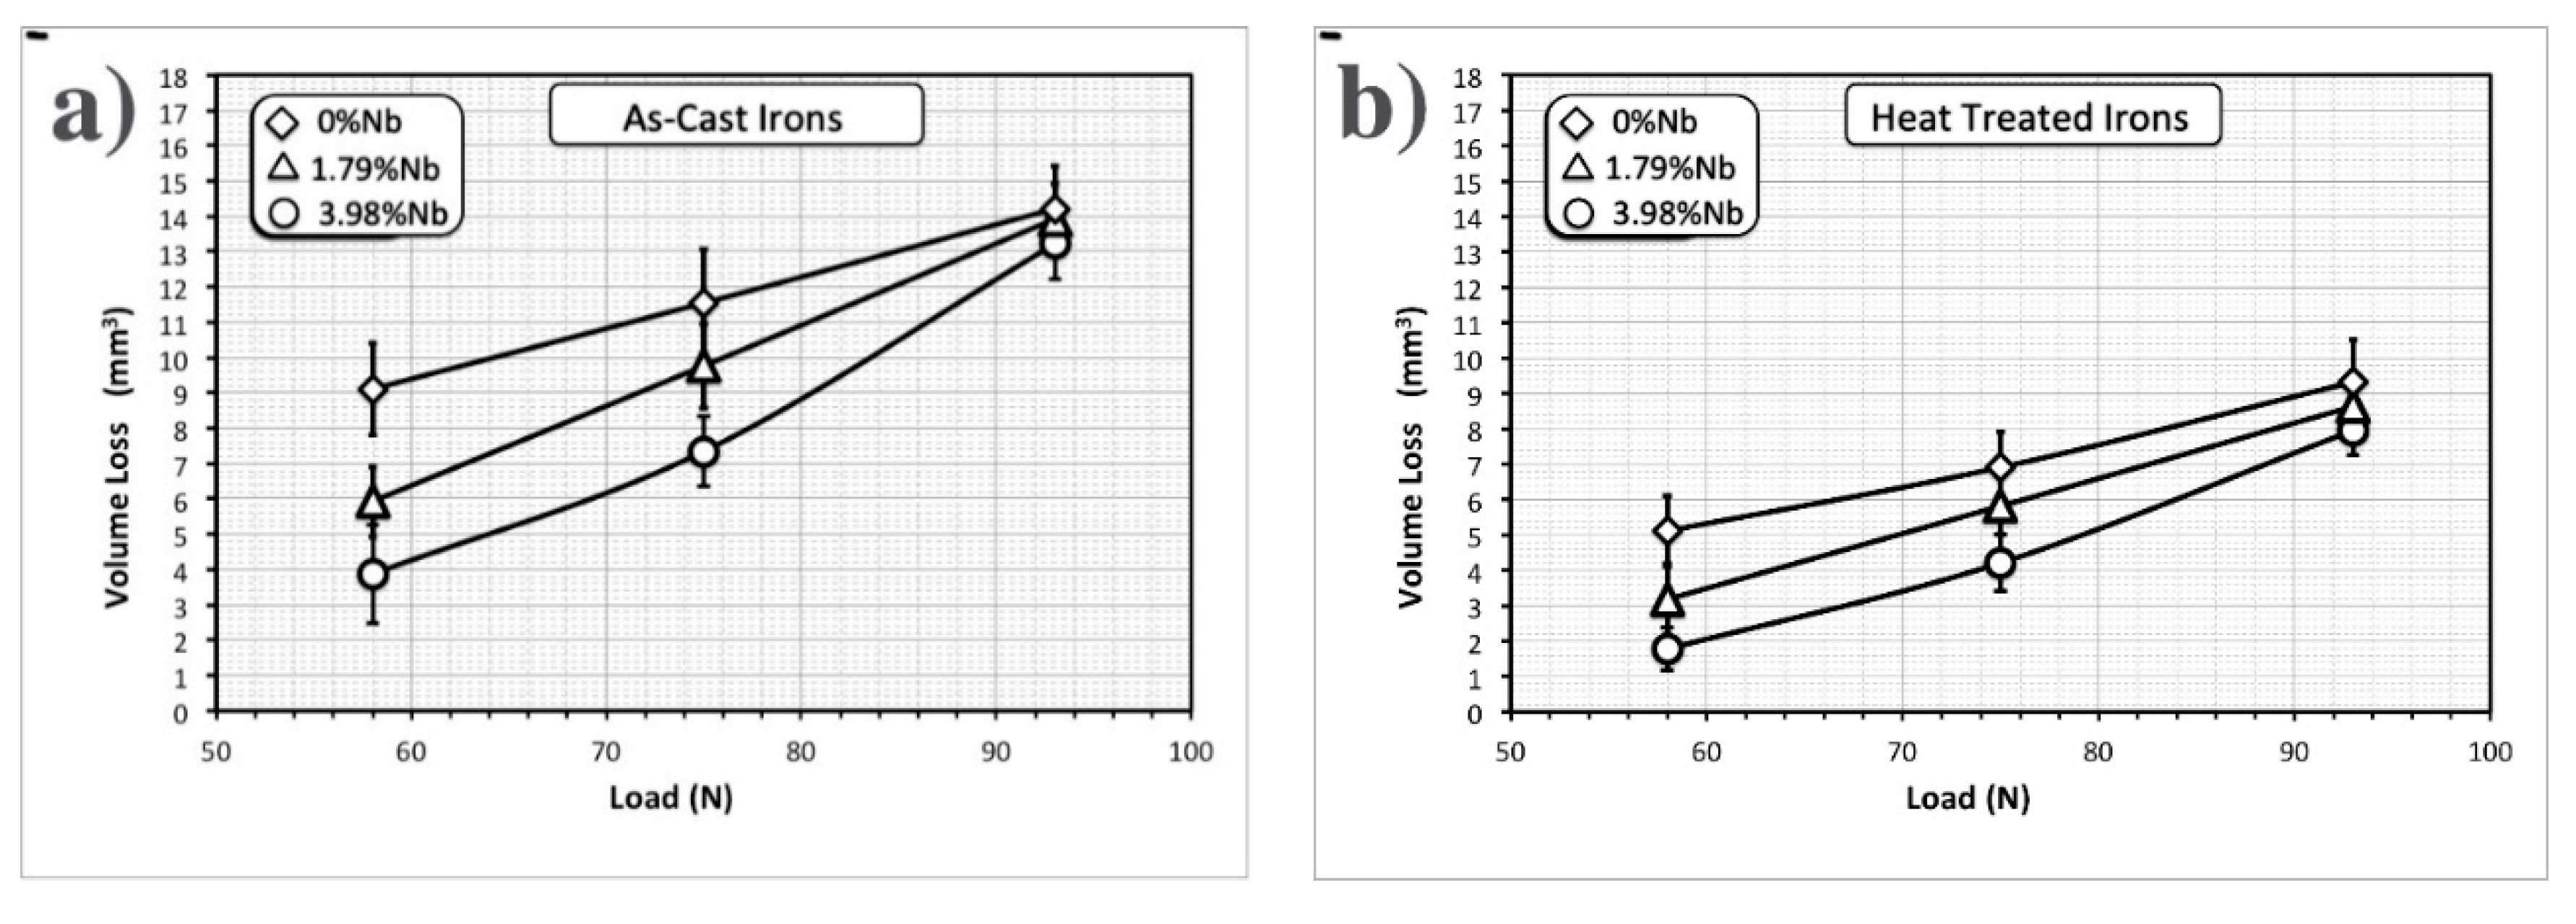
Figure 9 shows an example of the topography of the worn surface as generated by the non-contact profiler for the heat treated iron with 3.98% Nb. The volume loss for this particular test was 1.821 mm3 according to the software used to analyze the worn surface. Each surface after the wear test for each material was analyzed under the profiler, and Figure 10 shows the obtained results of the volume loss for both as-cast and heat treated irons; each point on the plots is the mean value of three tests. As expected, wear increased as the applied load increased for both as-cast and heat treated conditions. In addition, wear decreased as the niobium content increased, which could also be expected since the presence of this element increased the hardness of the overall alloy. However, this behavior was not clear for the tests under the highest applied load (93 N), where the wear behavior seemed to be similar for the different irons in the as-cast conditions; the same behavior was also observed for the heat treated irons. It is suggested that this behavior can be attributed to massive carbide cracking at the very surface and also below the worn surface when the tests were undertaken at the highest load, as explained below.
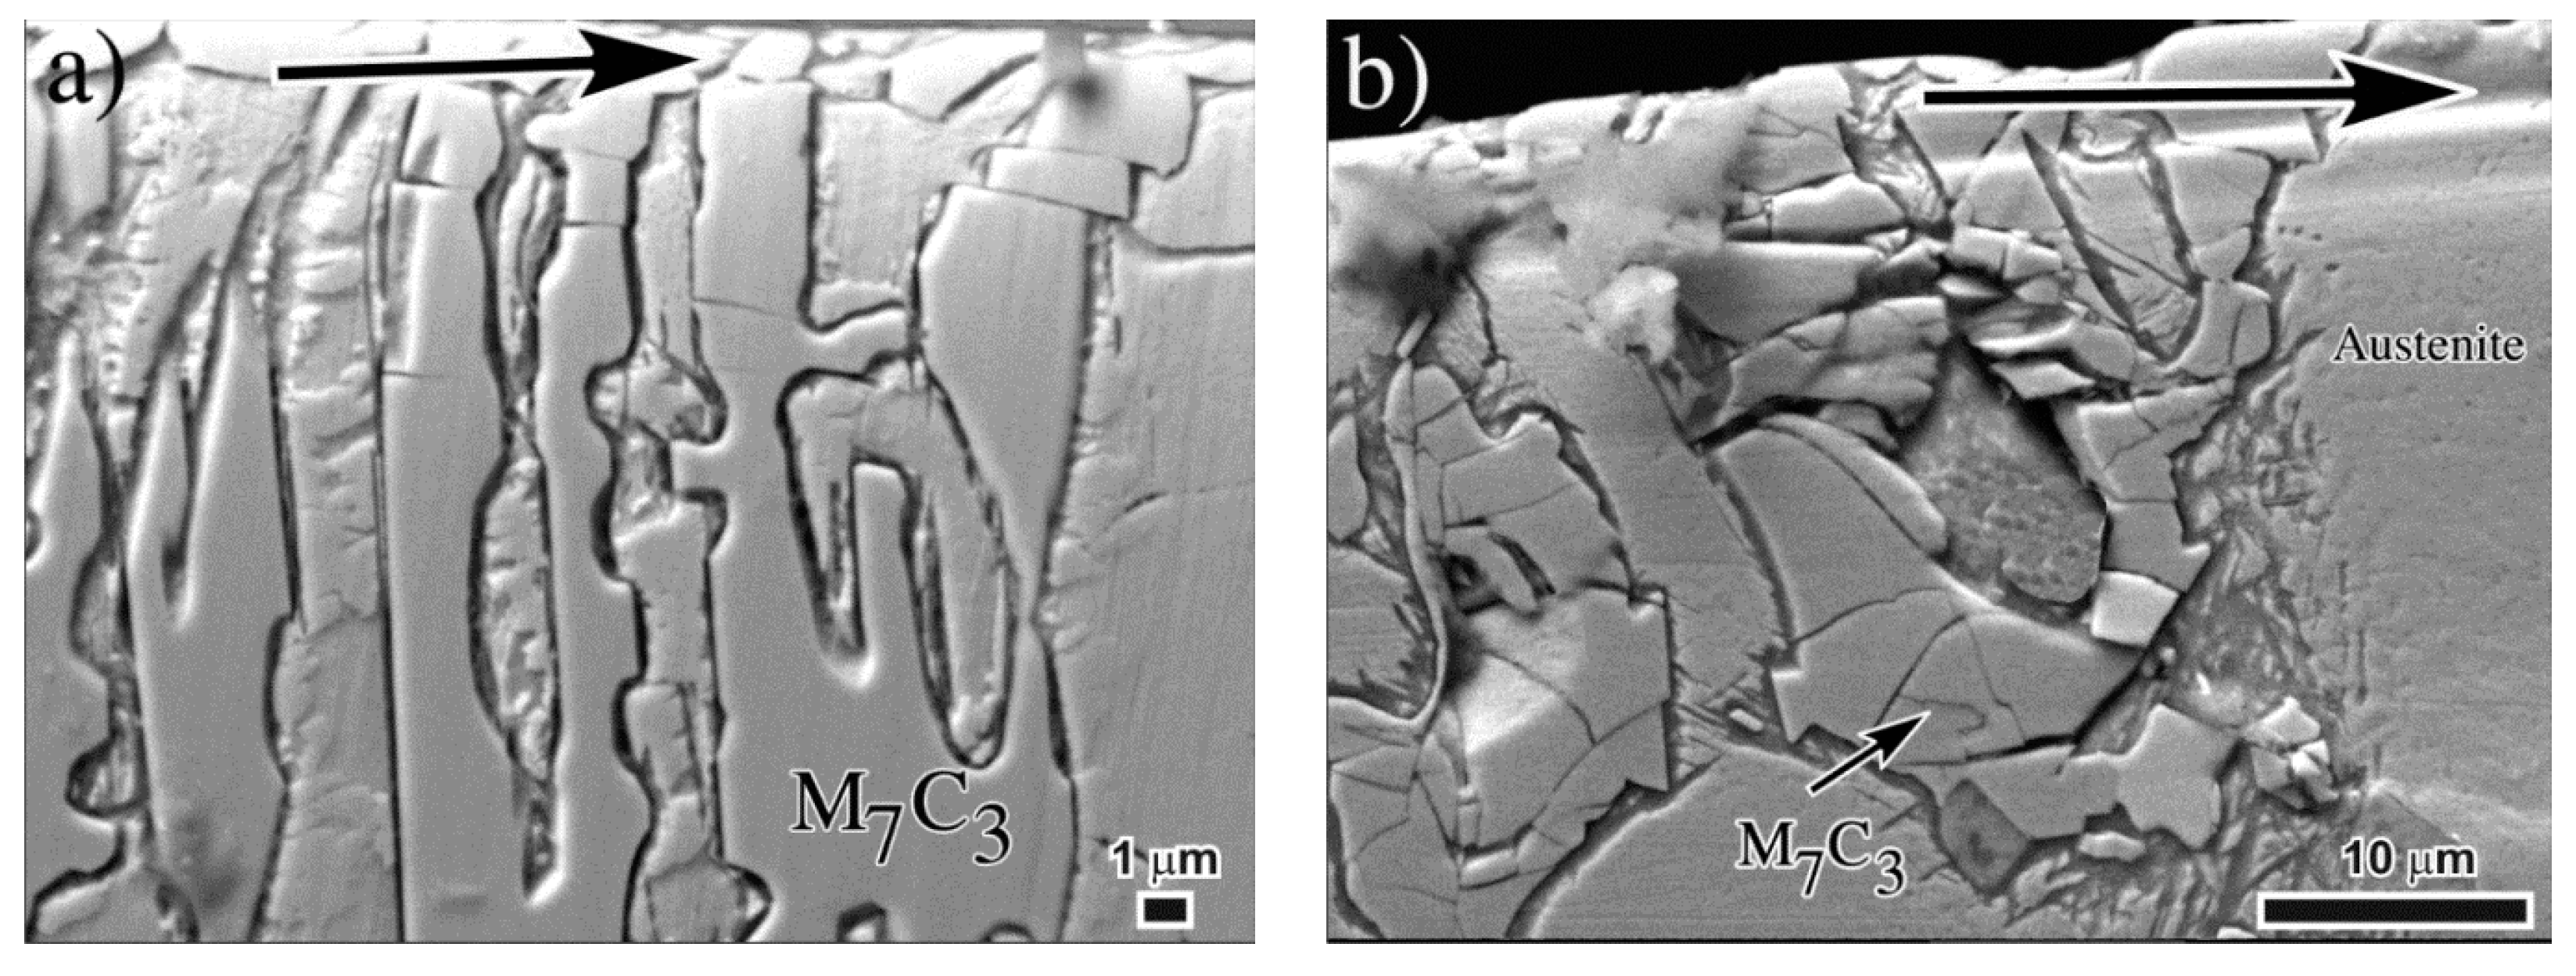
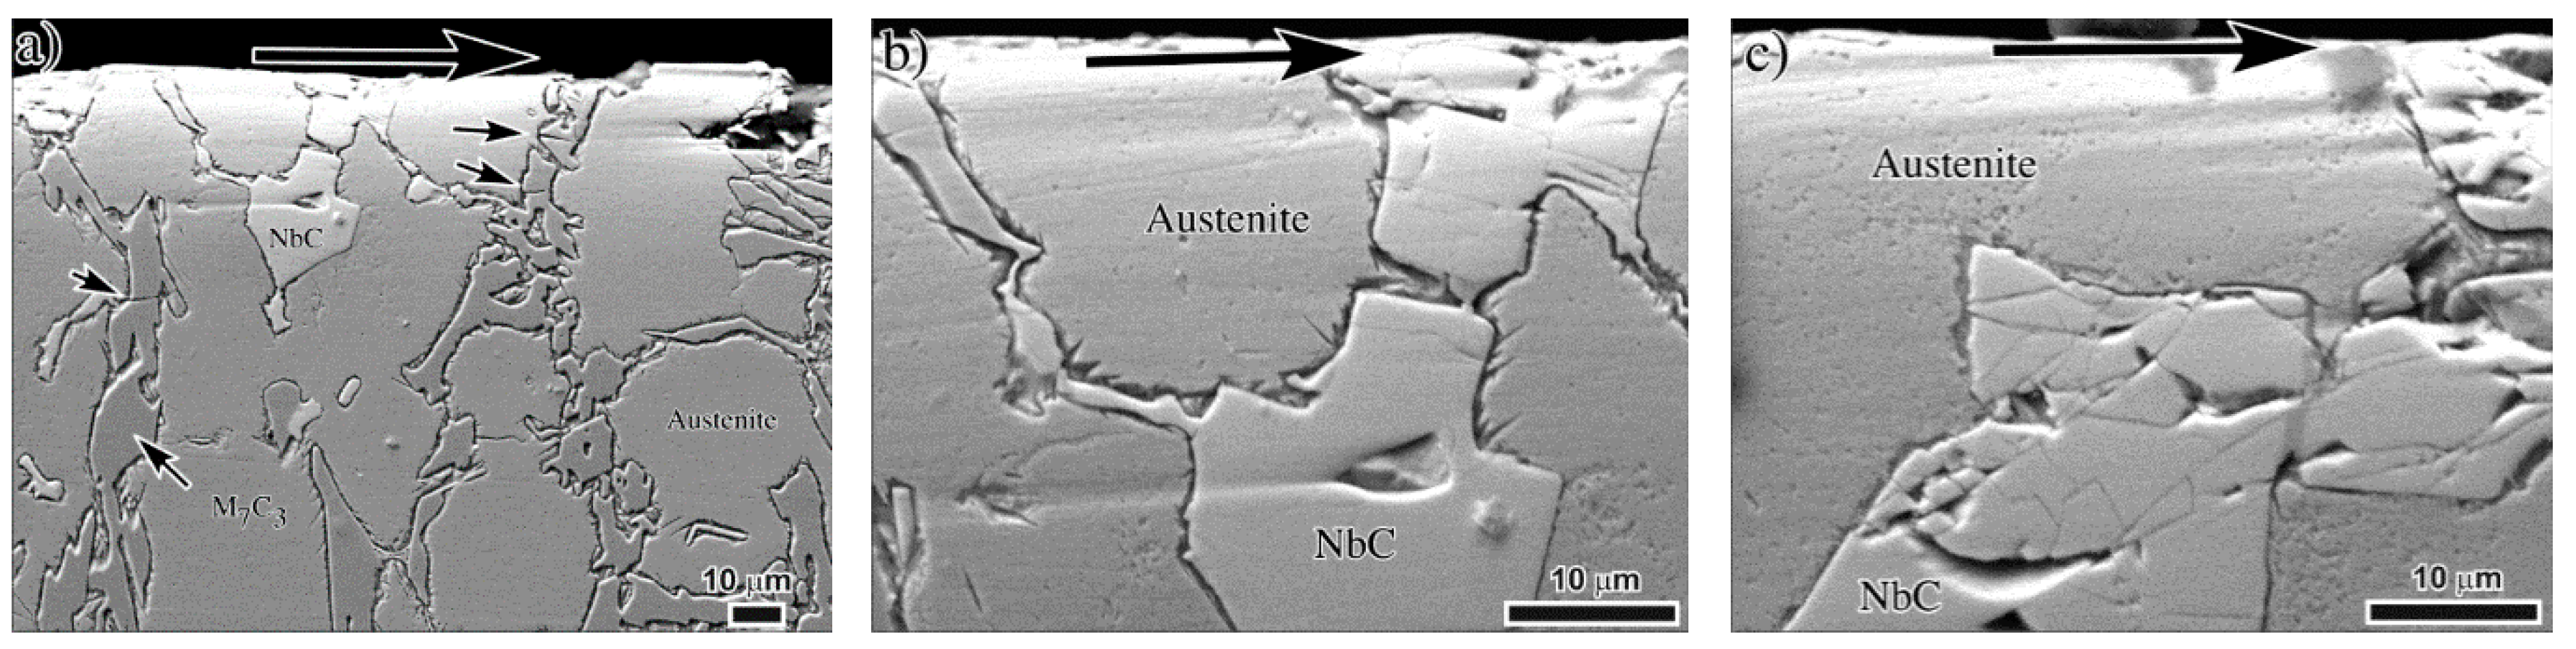
For the as-cast iron without niobium additions (Figure 10a), the volume lost after the wear test at 58 N is 9.011 mm3 and it increased to 14.21 mm3 when the applied load increased to 93 N. For this iron, carbide cracking was observed below the worn surface for all the applied loads. Obviously, the intensity of carbide cracking was more severe for the load of 93N (see Figure 11). For the case of the 3.98%Nb iron, a little of carbide cracking was also observed below the worn surface at 58 N load but only for the M7C3 carbide and not for the NbC. On the contrary, at loads of 93 N, severe cracking was observed for both M7C3 and NbC carbides (see Figure 12).
Carbides cracking at/or below the worn surface has been highlighted by several authors [11,31,32,33] to be an important cause of surface destabilization during the wear tests. Due to their hardness, carbides are the main responsible for the acceptable wear resistance of these irons; however, if the wear conditions are severe during the test, these carbides may be crushed or fragmented and under these conditions the surface is prone to loss high amounts of material. For the as-cast irons at this high load, the soft austenitic matrix does not offer the adequate support to the carbide phase. High levels of plastic deformation at the surface transfer high stresses to the brittle carbides producing cracking, particularly for large carbides [32]. Figure 13 shows detail of the carbide trituration due to severe plastic deformation of both M7C3 and NbC carbides at the surface of the as-cast 3.98% Nb iron.
For the case of the heat treated irons, the volume loss is obviously less than that for the as-cast irons, since the former austenitic matrix has been transformed to a mixture of martensite plus retained austenite plus secondary carbides. Such transformation has caused an increase in hardness of the irons and also an increase in wear resistance as can be seen from Figure 10. Similarly to the as-cast alloys, the volume loss after the wear tests increased with the applied load and decreased with the niobium content. Again, for the highest applied load of 93 N, there was not much difference on the wear behavior for the three irons. For the heat-treated iron without niobium additions (Figure 10b), the volume loss after the wear test at 58 N was 5.015 mm3 and it increased to 9.521 mm3 when the applied load increased to 93 N. For these irons, carbide cracking was also observed below the worn surface for all the applied loads, but the intensity of carbide cracking was much less than that observed for the as-cast alloys. For the 3.98%Nb iron, NbC carbide cracking was observed for the samples tested at 75 and 93 N, and not for the iron tested at 58 N. For this later case, just M7C3 carbide cracking was detected. Figure 14 and Figure 15 show SEM micrographs of cross sections for the heat-treated iron without niobium (Figure 14) and for the iron with 3.98% Nb also in the heat-treated conditions (Figure 15). Note the intensity of M7C3 and NbC carbide cracking at the different applied loads.
Figure 16 shows two SEM micrographs of the worn surface after a deep etching to remove part of the matrix and to evidence the carbide cracking at the very surface in the 3.98% Nb heat-treated iron tested at 93 N.
From these observations, it is evident again that carbide cracking at/or below the worn surface determines the wear behavior of the irons. Previous works on silicon-alloyed irons [34] and titanium-alloyed irons [33] have reported a linear relationship between wear rate and deep of deformation under pure sliding wear tests. Such a deep of deformation is also related to the depth at which carbide cracking occurs below the worn surface. Therefore, as highlighted by Fulcher et al. [32], the role of the matrix should be to protect the carbides against bending due to the absorbed stresses during the wear tests. For the heat treated irons, the matrix composed by martensite plus retained austenite plus secondary carbides provides better support against carbide cracking than that offered by the austenitic matrix in the as-cast irons.
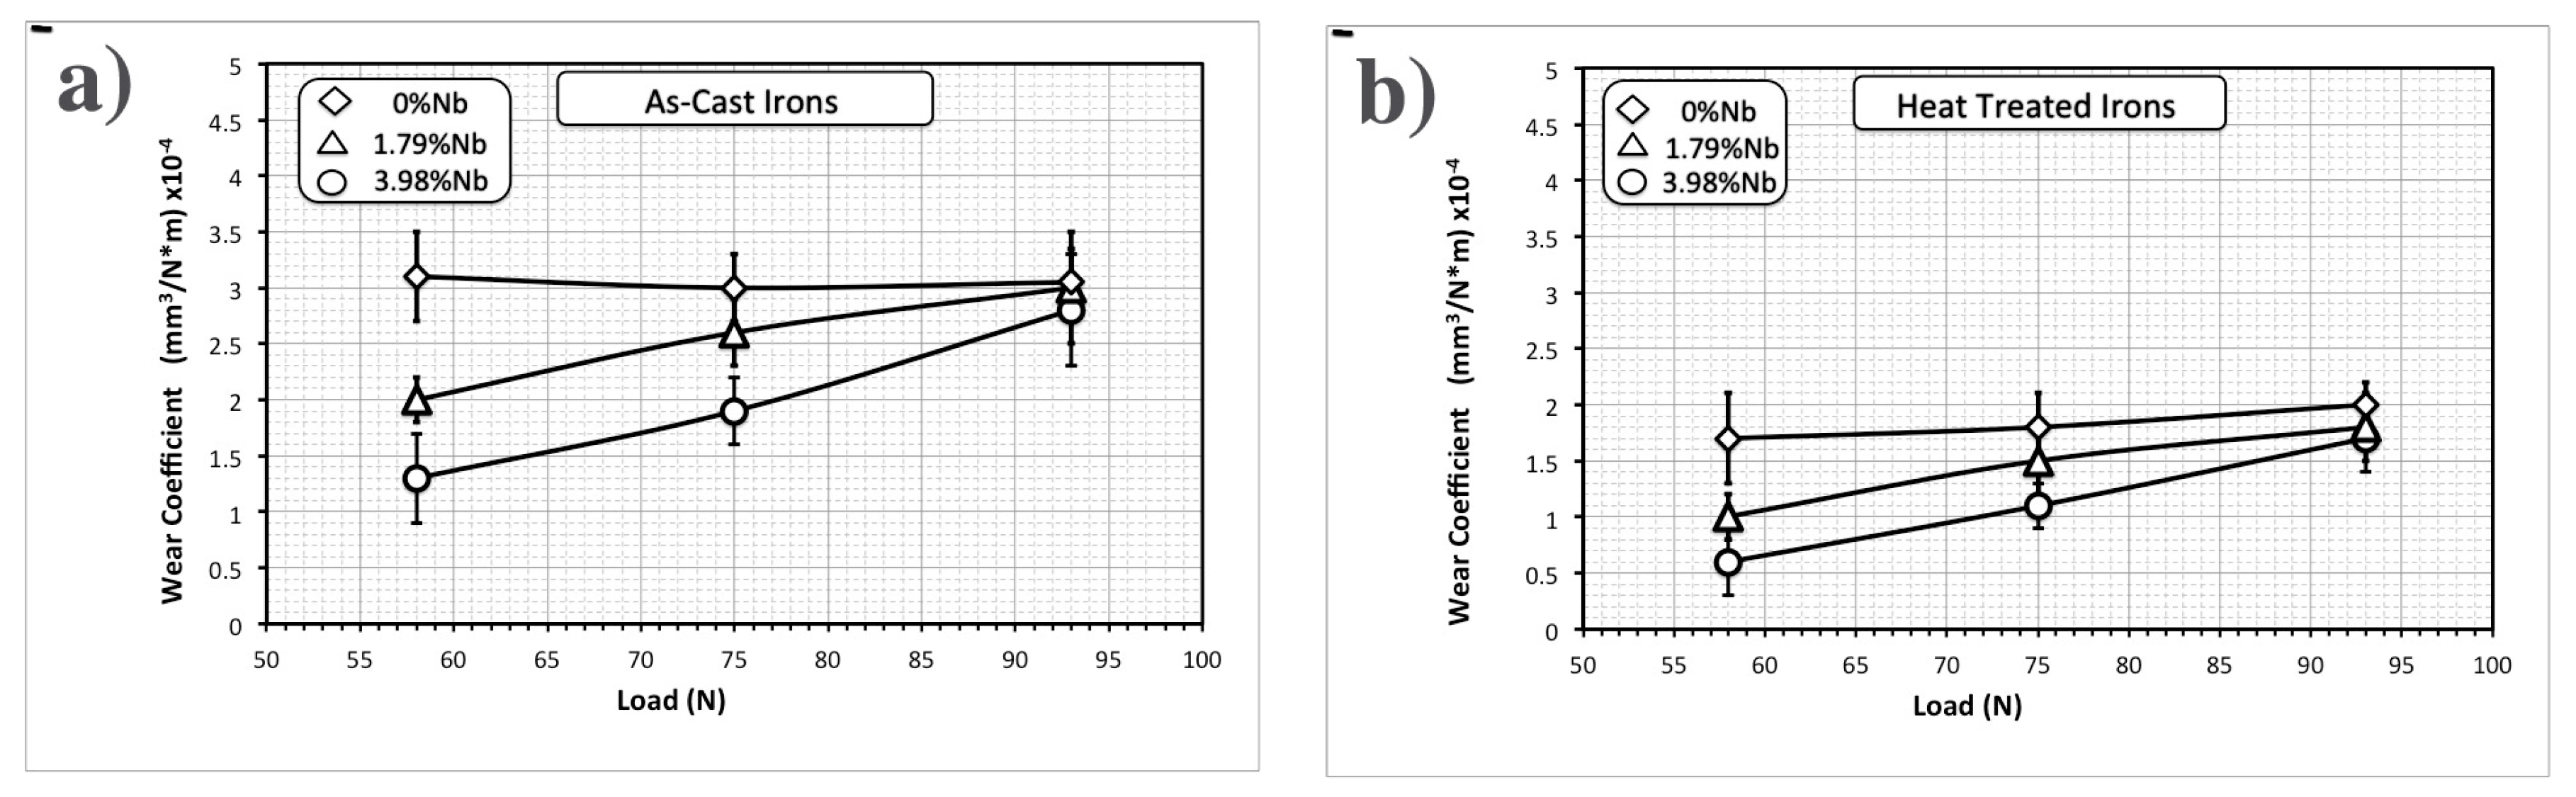
Figure 17 shows plots of the wear intensity or specific wear rate for the experimental irons in both as-cast (Figure 17a) and heat-treated (Figure 17b) conditions. As can be seen, the wear rate is a constant for any load for the iron without niobium. At any load, the wear rate is the same since carbide cracking was observed for all the tests on these irons. However, for the irons with niobium additions, the wear rate increased with load and decreased with the niobium content. This behavior also evidence that for high loads the presence of hard NbC carbides does not offer too much wear resistance due to carbide cracking at these high loads.
4. Conclusions
For the as-cast conditions, niobium additions increased the hard NbC phase since since it is a strong carbide-forming element. This caused a decrease in the eutectic M7C3 volume fraction from 30% for the iron without niobium to 24% for the iron with 3.98% Nb. However, NbC increased to 6%. The overall carbide volume fraction in the irons was about 30% but the presence of NbC in the Nb-added irons increased hardness from 48 to 55 HRC.
After a destabilization heat treatment at 900 °C, secondary carbides precipitation occurred within the matrix. The matrix then partially transformed to martensite during the subsequent cooling down. The presence of martensite and secondary carbides in the matrix increased the overall hardness of the irons from 60 to 65 HRC as the Nb content increased.
The abrasive wear resistance increased with Nb for both as-cast and heat-treated alloys due to the increase in hardness. However, not much difference was noticed for the high load of 93 N, which is attributed to the severe carbide cracking at and below the worn surface. Wear resistance also increased for the heat-treated alloys due to the matrix strengthening by martensite and secondary carbides. Wear intensity was constant at any load for the iron without niobium, while it increased with the Nb content for both as-cast and heat-treated conditions.
Author Contributions
A.B.-J. and F.G. wrote the paper and conceived the experiments. U.V. performed the experiments. I.M. analyzed the data software.
Funding
Grant: 258873, National Council of Science and Technology of Mexico (CONACyT).
Aknowledgments
This paper results from the financial support of the CONACyT from Mexico under the grant No: 258873 on the announcement of Basic Science 2015. The authors are very grateful to the Universidad Michoacana of Mexico for the complimentary support. One of the authors, Uzzi Vera, also acknowledges CONACyT for the scholarship during his undergrade studies.
Conflicts of Interest
The authors declare no conflict of interest.
References
- Tabrett, C.P.; Sare, I.R.; Gomashchi, M.R. Microstructure-property relationships in high-chromium white iron alloys. Int. Mater. Rev. 1996, 41, 59–82. [Google Scholar] [CrossRef]
- Albertin, E.; Sinatora, A. Effect of carbide fraction and matrix microstructure on the wear of cast iron balls tested in a laboratory ball mill. Wear 2001, 250, 492–501. [Google Scholar] [CrossRef]
- Kositsyana, I.I.; Sagaradze, V.V.; Makarov, A.V.; Kozlova, A.N.; Ustyuzhaninova, A.I. Effect of structure on the properties of white chromium cast irons. Mater. Sci. Heat Treat. 1996, 38, 149–152. [Google Scholar] [CrossRef]
- Filippov, M.A.; Lhagvadorzh, P.; Plotnikov, G.N. Structural factors of elevation of wear-resistance of white chromium cast iron. Mater. Sci. Heat Treat. 2000, 42, 423–426. [Google Scholar] [CrossRef]
- Wang, J.; Li, C.; Liu, H.; Yang, H.; Shen, B.; Gao, S.; Huang, S. The precipitation and transformation of secondary carbides in a high chromium cast iron. Mater. Charact. 2006, 56, 73–78. [Google Scholar] [CrossRef]
- Kootsokoos, A.; Gates, J.D. The role of secondary carbide precipitation on the fracture toughness of a reduced carbon white iron. Mater. Sci. Eng. A 2008, 480, 313–318. [Google Scholar] [CrossRef]
- Powell, G.L.; Bee, J.V. Secondary carbide precipitation in a 18 wt%Cr-1 wt% Mo white iron. J. Mater. Sci. 1996, 31, 707–711. [Google Scholar] [CrossRef]
- Wang, J.; Sun, Z.; Zuo, R.; Li, C.; Shen, B.; Gao, S.; Huang, S. Effects of secondary carbide precipitation and transformation on abrasion resistance of the 16Cr-1Mo-1Cu white iron. J. Mater. Eng. Perform. 2006, 15, 316–319. [Google Scholar] [CrossRef]
- Bedolla-Jacuinde, A.; Arias, L.; Hernández, B. Kinetics of secondary carbides precipitation in a high-chromium white iron. J. Mater. Eng. Perform. 2003, 12, 371–382. [Google Scholar] [CrossRef]
- Bedolla-Jacuinde, A.; Guerra, F.V.; Mejía, I.; Zuno-Silva, J.; Maldonado, C. Boron effect of precipitation of secondary carbides during destabilization of a high-chromium white iron. Int. J. Cast Met. Res. 2016, 29, 55–61. [Google Scholar] [CrossRef]
- Bedolla-Jacuinde, A.; Guerra, F.V.; Mejía, I.; Zuno-Silva, J.; Rainforth, M.W. Abrasive wear of V-Nb-Ti alloyed high-chormium white irons. Wear 2015, 332, 1006–1011. [Google Scholar] [CrossRef]
- Bedolla-Jacuinde, A. Microstructure of vanadium-, niobium-, and titanium-alloyed high-chromium white irons. Int. J. Cast Met. Res. 2001, 13, 343–361. [Google Scholar] [CrossRef]
- Bedolla-Jacuinde, A.; Correa, R.; Quezada, J.G.; Maldonado, C. Effect of titanium on the as-cast microstructure of a 16% chromium white iron. Mater. Sci. Eng. A 2005, 297, 297–308. [Google Scholar] [CrossRef]
- Fras, E.; Kawalec, M.; López, H.F. Solidification microstructures and mechanical properties of high-vanadium Fe-C-V and Fe-C-V Si alloys. Mater. Sci. Eng. A 2009, 254, 193–203. [Google Scholar] [CrossRef]
- Filipovic, M.; Kamberovic, Z.; Korak, M. Solidification of high chromium white cast iron alloyed with vanadium. Mater. Trans. 2011, 52, 386–390. [Google Scholar] [CrossRef] [Green Version]
- Efremenko, V.G.; Shimizu, K.; Cheiliakh, A.P.; Kozarevskaya, T.V.; Kusumoto, K.; Yamamoto, K. Effect of vanadium and chromium on the microstructural features of V-Cr-Mn-Ni spheroidal carbide cast irons. Int. J. Miner. Metall. Mater. 2014, 21, 1096–1108. [Google Scholar] [CrossRef]
- Zhi, X.; Xiang, J.; Fu, H.; Xiao, B. Effect of niobium on the as-cast microstructure of hypereutectic high chromium cast iron. Mater. Lett. 2008, 62, 857–860. [Google Scholar] [CrossRef]
- Penagos, J.J.; Pereira, J.J.; Machado, P.C.; Albertin, E.; Sinatora, A. Synergetic effect of niobium and molybdenum on abrasion resistance of high chromium cast irons. Wear 2017, 376, 983–992. [Google Scholar] [CrossRef]
- Filipovic, M.; Kemberovic, Z.; Korac, M.; Gavrilovski, M. Microstructure and mechanical properties of Fe-Cr-C-Nb white cast irons. Mater. Des. 2013, 47, 41–48. [Google Scholar] [CrossRef]
- Filipovic, M.; Kamberovic, M.; Korac, M.; Jordovic, B. Effect of niobium and vanadium additions on the as-cast microstructure and properties of hypoeutectic Fe-Cr-C alloy. ISIJ Int. 2013, 53, 2160–2166. [Google Scholar] [CrossRef] [Green Version]
- Chen, H.X.; Chang, Z.C.; Lu, J.C.; Lin, H.T. Effect of niobium on wear resistance of 15%Cr white cast iron. Wear 1993, 166, 197–201. [Google Scholar]
- Bouhamla, K.; Hadji, A.; Maouche, H.; Merradi, H. Effect of niobium on wear resistance of heat treated high chromium cast iron. Revue de Métallurgie 2011, 108, 83–88. [Google Scholar] [CrossRef]
- Fiset, M.; Peev, K.; Radulovic, M. The influence of niobium on fracture toughness and abrasion resistance in high chromium white cast irons. J. Mater. Sci. Lett. 1993, 12, 615–617. [Google Scholar] [CrossRef]
- Kusumoto, K.; Shimizu, K.; Yaer, X.; Zhang, Y.; Ota, Y.; Ito, J. Abrasive wear characteristics of Fe-2C-5Cr-5Mo-5W-5Nb multi-component white cast iron. Wear 2017, 376, 22–29. [Google Scholar] [CrossRef]
- Dogan, O.; Hawk, A.; Tilkzac, H. Wear of cast chromium steels with TiC reinforcement. Wear 2001, 250, 462–469. [Google Scholar] [CrossRef]
- Loper, C.R.; Baik, H.K. Influence of molybdenum and titanium on the microstructures of Fe-C-Cr-Nb white cast irons. AFS Trans. 1989, 97, 1001–1008. [Google Scholar]
- Maratray, F. Choice of appropriate compositions for chromium-molybdenum white irons. AFS Trans. 1971, 79, 121–124. [Google Scholar]
- DeMello, J.D.B.; Duran-Charre, M.; Hamar-Thibualt, S. Solidification and solid state transformations during cooling of chromium-molybdenum white cast irons. Metall. Trans. A 1983, 14, 1793–1801. [Google Scholar] [CrossRef]
- Ikeda, M.; Umeda, T.; Tong, C.P.; Suzuki, T.; Niwa, N.; Kato, O. Effect of molybdenum addition on solidification structure, mechanical properties and wear resistivity of high chromium cast iron. ISIJ Int. 1992, 32, 1157–1162. [Google Scholar] [CrossRef] [Green Version]
- Kim, C. X-ray method of measuring retained austenite in heat treated white cast irons. J. Heat Treat. 1979, 1, 43–51. [Google Scholar] [CrossRef]
- Radulovic, M.; Fiset, M.; Peev, K.; Tomovic, M. The influence of vanadium on fracture and abrasion resistance in high chromium white cast irons. J. Mater. Sci. 1994, 29, 5085–5094. [Google Scholar] [CrossRef]
- Fulcher, J.K.; Kosel, T.H.; Fiore, N.F. The effect of carbide volume fraction on the low stress abrasion resistance of high Cr-Mo white cast irons. Wear 1983, 84, 313–325. [Google Scholar] [CrossRef]
- Bedolla-Jacuinde, A.; Correa, R.; Mejía, I.; Quezada, J.; Rainforth, W.M. The effect of titanium on the wear behavior of a 16%Cr white cast iron under pure sliding. Wear 2007, 263, 808–820. [Google Scholar] [CrossRef]
- Bedolla-Jacuinde, A.; Rainforth, W.M. The wear behavior of high-chromium white cast irons as a function of silicon and Mischmetal content. Wear 2001, 250, 449–461. [Google Scholar] [CrossRef]
Figure 1.
Schematic draw of the abrasive wear test undertaken for this study.

Figure 2.
Scanning Electron Microscopy (SEM) micrographs showing the shape and size of the abrasive sand particles used for the wear tests. (a) 500 μm, (b) 200 μm. Note the presence of sharp particles of a mean size of 185 μm.
Figure 2.
Scanning Electron Microscopy (SEM) micrographs showing the shape and size of the abrasive sand particles used for the wear tests. (a) 500 μm, (b) 200 μm. Note the presence of sharp particles of a mean size of 185 μm.

Figure 3.
Phases predicted by JMatPro for the irons. (a) no-niobium additions (b) the iron with 3.98% Nb.
Figure 3.
Phases predicted by JMatPro for the irons. (a) no-niobium additions (b) the iron with 3.98% Nb.

Figure 4.
SEM micrographs showing the as-cast microstructure for the three experimental irons; (a) 0% Nb, (b) 1.79% Nb, and (c) 3.98% Nb.
Figure 4.
SEM micrographs showing the as-cast microstructure for the three experimental irons; (a) 0% Nb, (b) 1.79% Nb, and (c) 3.98% Nb.

Figure 5.
SEM micrographs showing evidence of the presence of martensite (a), and M2C (b) in the microstructure of the 3.98% Nb as-cast iron.
Figure 5.
SEM micrographs showing evidence of the presence of martensite (a), and M2C (b) in the microstructure of the 3.98% Nb as-cast iron.

Figure 6.
SEM micrographs showing the as-heat treated microstructure; (a) 0% Nb, (b) 1.79% Nb and (c) 3.98% Nb.
Figure 6.
SEM micrographs showing the as-heat treated microstructure; (a) 0% Nb, (b) 1.79% Nb and (c) 3.98% Nb.

Figure 7.
SEM micrograph showing detail of the as-heat treated microstructure of the 4% Nb iron, showing the matrix to be a mixture of retained austenite (γ’), martensite (α’) and secondary carbides (SC).
Figure 7.
SEM micrograph showing detail of the as-heat treated microstructure of the 4% Nb iron, showing the matrix to be a mixture of retained austenite (γ’), martensite (α’) and secondary carbides (SC).

Figure 8.
Hardness for the experimental irons as a function of the niobium content for the three irons.
Figure 8.
Hardness for the experimental irons as a function of the niobium content for the three irons.

Figure 9.
Topography of the worn surface of the 3.98% Nb, heat treated iron, generated by an optical profiler.
Figure 9.
Topography of the worn surface of the 3.98% Nb, heat treated iron, generated by an optical profiler.

Figure 10.
Volume loss load after the wear tests as a function of the applied load for both (a) as-cast and (b) heat treated irons. Note the increase in volume loss as the load increases, and the lower volume loss for the heat treated irons.
Figure 10.
Volume loss load after the wear tests as a function of the applied load for both (a) as-cast and (b) heat treated irons. Note the increase in volume loss as the load increases, and the lower volume loss for the heat treated irons.

Figure 11.
SEM micrographs showing the cross section below the worn surface for the as-cast 0% Nb iron after the wear tests. The arrow on the upper part indicates the sliding direction during abrasion. Note the intensity of carbide cracking for each applied load; (a) 58 N, and (b) 93 N.
Figure 11.
SEM micrographs showing the cross section below the worn surface for the as-cast 0% Nb iron after the wear tests. The arrow on the upper part indicates the sliding direction during abrasion. Note the intensity of carbide cracking for each applied load; (a) 58 N, and (b) 93 N.

Figure 12.
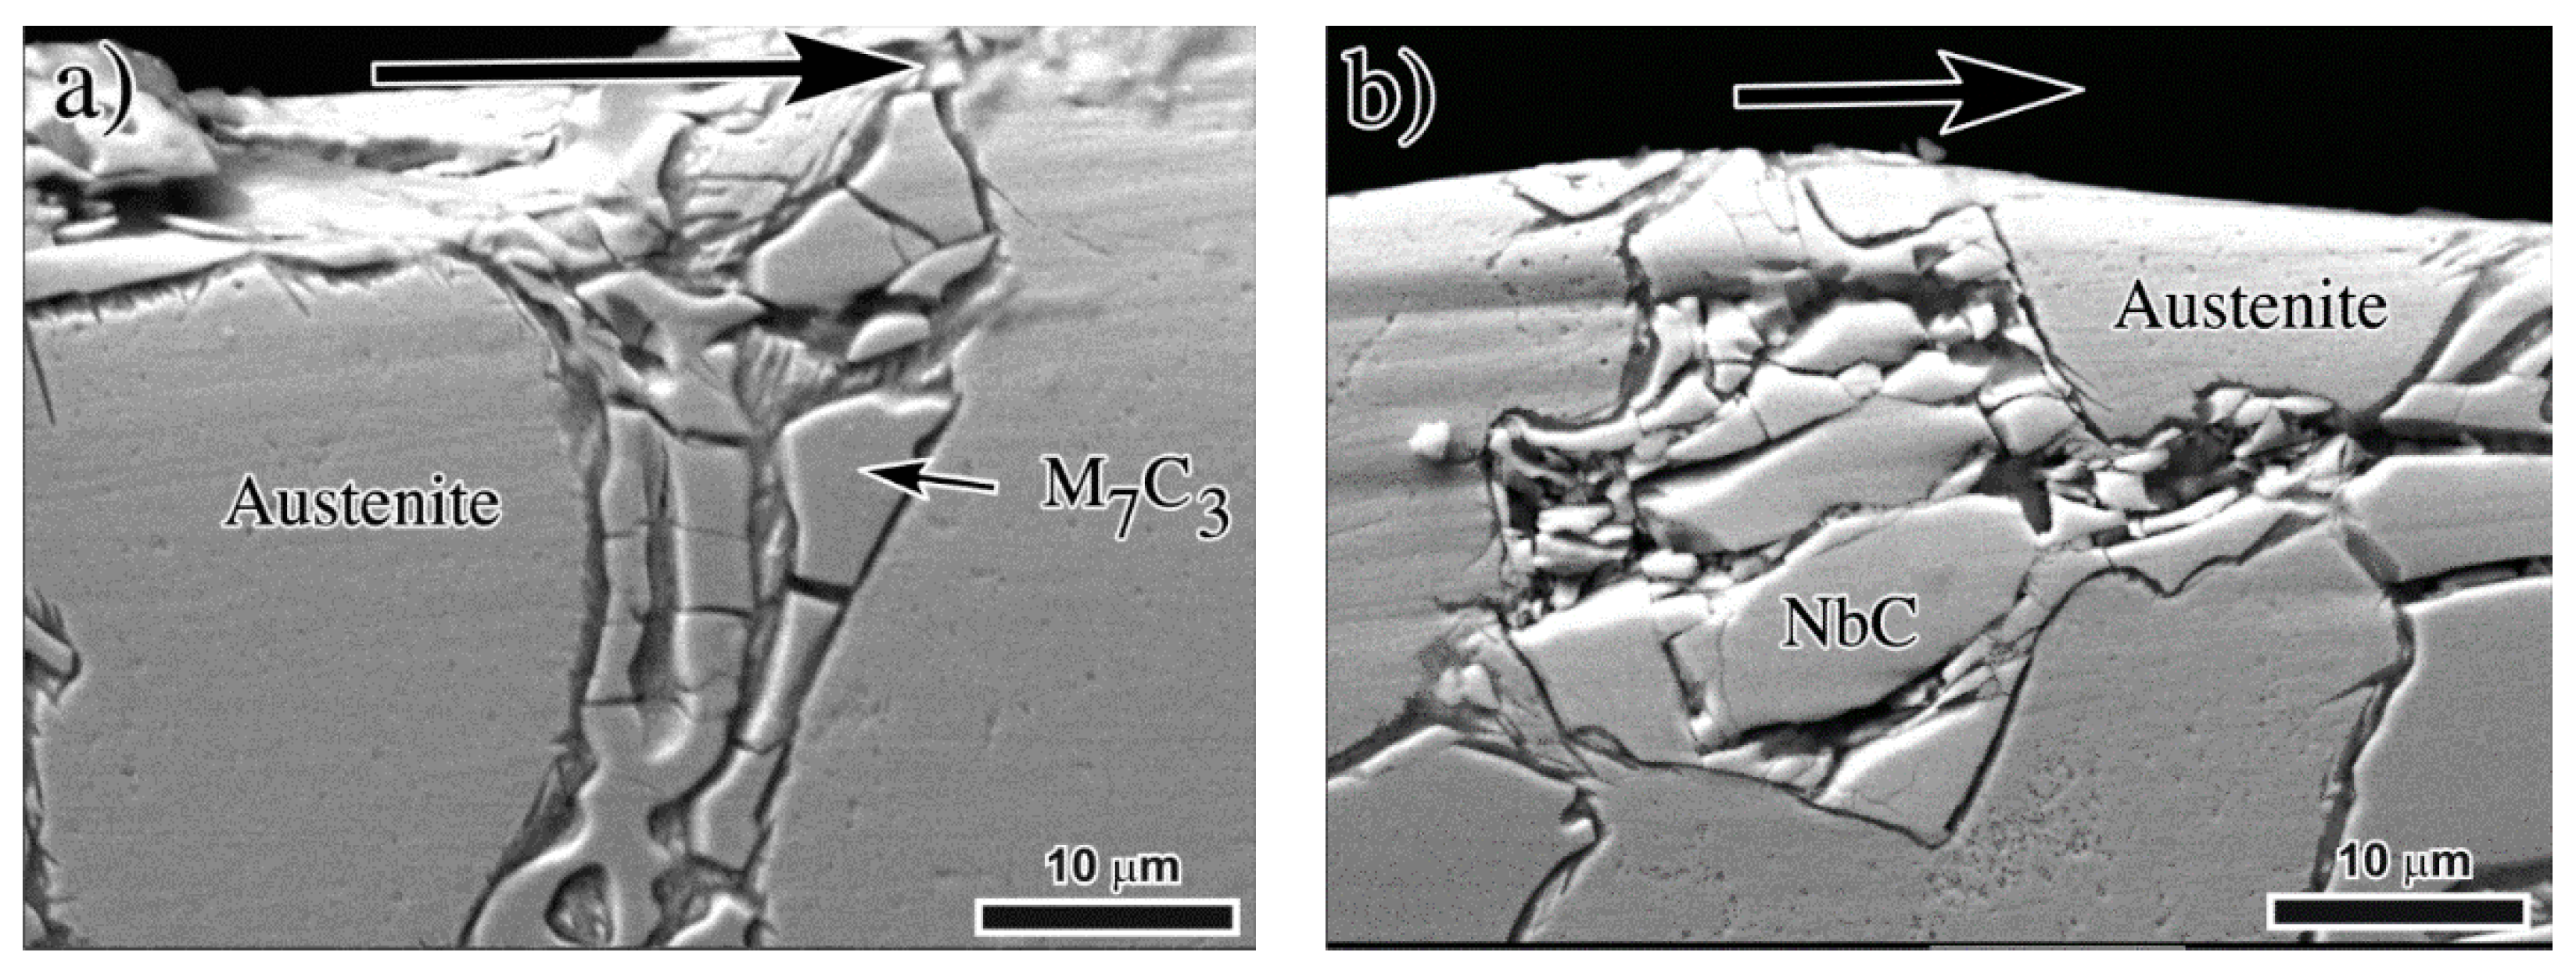
SEM micrographs showing the cross section below the worn surface for the as-cast 3.98% Nb after the wear tests. The arrow on the upper part indicates the sliding direction during abrasion. (a) General microstructure showing some cracks at the back of some M7C3 carbides (arrowed) for a test load of 58 N. (b) Detail of the NbC carbide from Figure a to note there is no cracking on this hard carbide, and (c) severe cracking of the NbC for the test load of 93 N.
Figure 12.
SEM micrographs showing the cross section below the worn surface for the as-cast 3.98% Nb after the wear tests. The arrow on the upper part indicates the sliding direction during abrasion. (a) General microstructure showing some cracks at the back of some M7C3 carbides (arrowed) for a test load of 58 N. (b) Detail of the NbC carbide from Figure a to note there is no cracking on this hard carbide, and (c) severe cracking of the NbC for the test load of 93 N.

Figure 13.
SEM micrographs showing severe carbide cracking below the worn surface for the as-cast 3.98%Nb iron after the wear test at 93 N; (a) M7C3 carbide, and (b) NbC carbide. The arrow indicates the sliding direction.
Figure 13.
SEM micrographs showing severe carbide cracking below the worn surface for the as-cast 3.98%Nb iron after the wear test at 93 N; (a) M7C3 carbide, and (b) NbC carbide. The arrow indicates the sliding direction.

Figure 14.
SEM micrographs of cross section of the heat-treated iron without niobium tested at (a) 58 N, (b) 75 N and (c) 93 N. The arrows indicate the sliding direction.
Figure 14.
SEM micrographs of cross section of the heat-treated iron without niobium tested at (a) 58 N, (b) 75 N and (c) 93 N. The arrows indicate the sliding direction.

Figure 15.
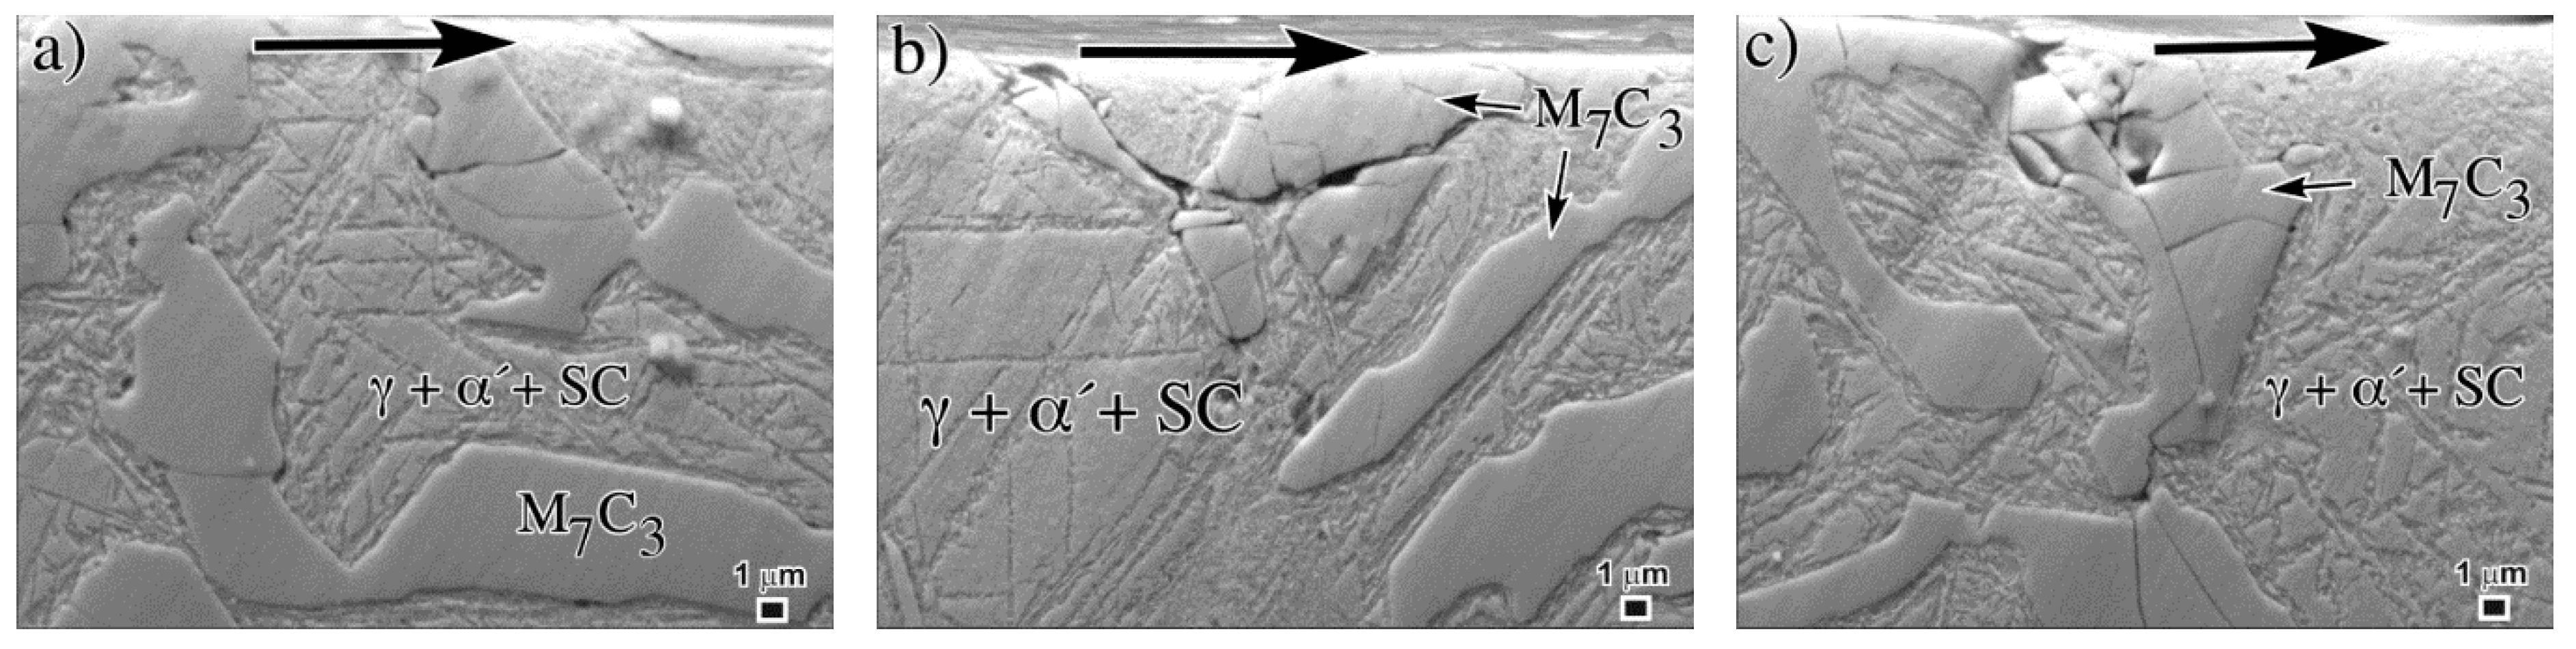
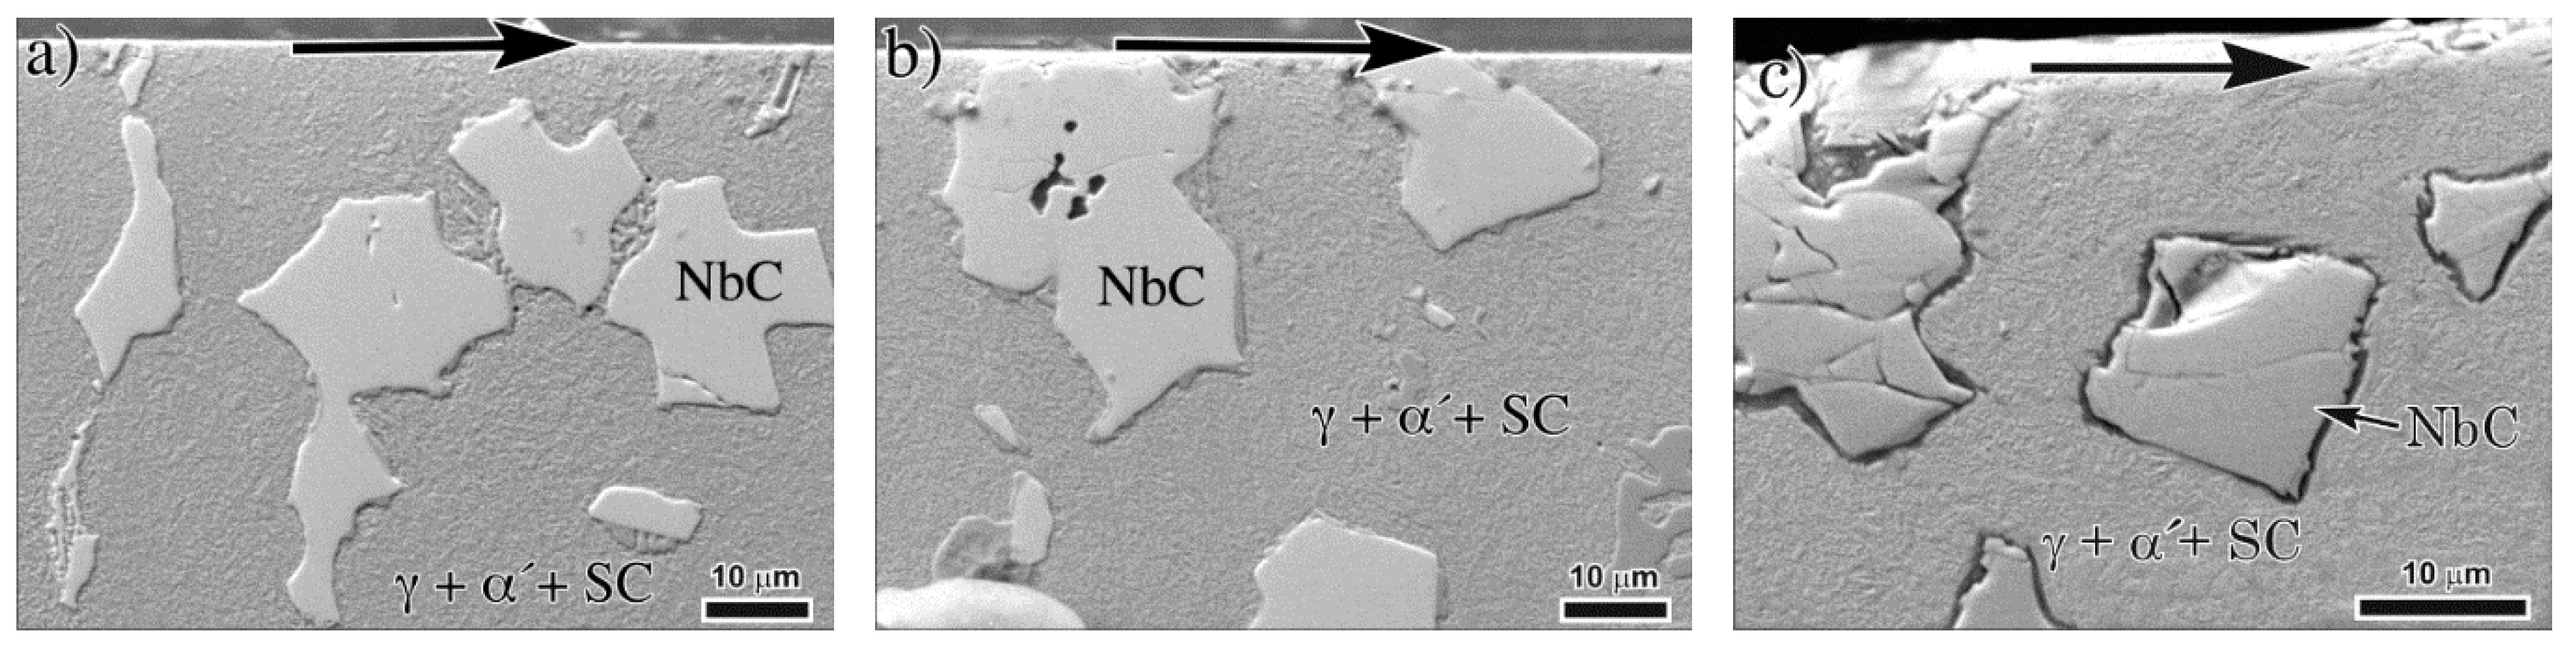
SEM micrographs of cross section of the heat-treated iron with 3.98% niobium tested at (a) 58 N, (b) 75 N and (c) 93 N. The arrows indicate the sliding direction.
Figure 15.
SEM micrographs of cross section of the heat-treated iron with 3.98% niobium tested at (a) 58 N, (b) 75 N and (c) 93 N. The arrows indicate the sliding direction.

Figure 16.
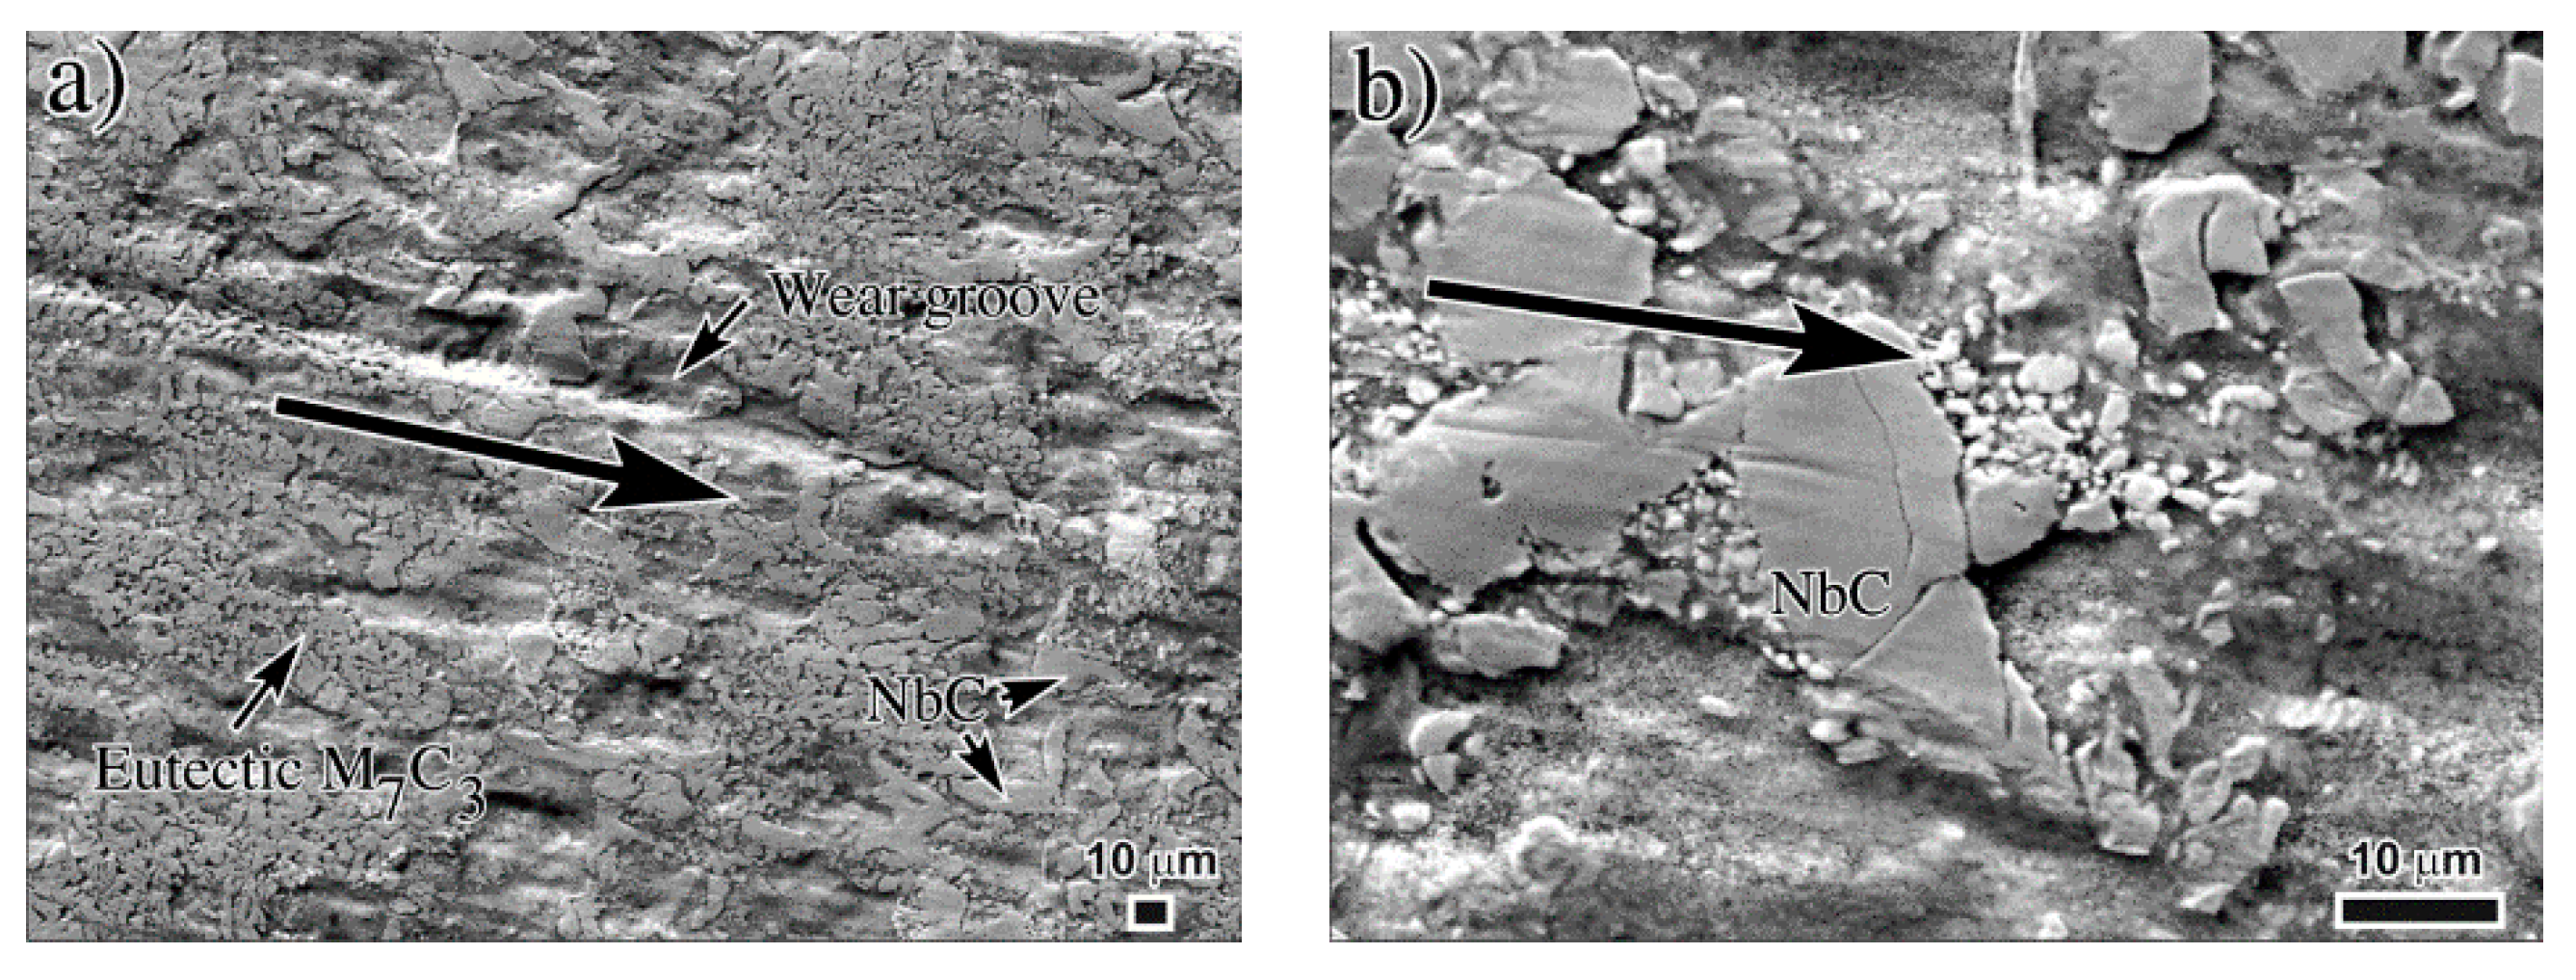
SEM micrographs of the worn surface showing carbide cracking; (a) general view, and (b) detail of cracks on a NbC carbide. Heat treated iron with 3.98% Nb tested at 93 N. The large arrows indicate the sliding direction.
Figure 16.
SEM micrographs of the worn surface showing carbide cracking; (a) general view, and (b) detail of cracks on a NbC carbide. Heat treated iron with 3.98% Nb tested at 93 N. The large arrows indicate the sliding direction.

Figure 17.
Wear coefficient against load for the (a) as-cast and (b) heat-treated irons. Note the lower wear coefficient for the heat treated irons and that the niobium content makes no difference for the highest loads used in this work.
Figure 17.
Wear coefficient against load for the (a) as-cast and (b) heat-treated irons. Note the lower wear coefficient for the heat treated irons and that the niobium content makes no difference for the highest loads used in this work.


Table 1.
Chemical composition for the three niobium-added irons.
| Alloy | %C | %Cr | %Mo | %Ni | %Si | %Mn | %Nb | %Fe |
|---|---|---|---|---|---|---|---|---|
| Iron 1 | 3.12 | 15.10 | 3.02 | 0.56 | 0.532 | 1.11 | 0.014 | Balance |
| Iron 2 | 3.03 | 14.89 | 2.91 | 0.53 | 0.492 | 1.00 | 1.795 | Balance |
| Iron 3 | 2.82 | 14.63 | 2.88 | 0.89 | 0.512 | 0.93 | 3.983 | Balance |
Table 2.
Phases measured and predicted by JMatPro® for the three experimental irons.
| Alloy | Austenite | M7C3 | NbC | M2C | |||||
|---|---|---|---|---|---|---|---|---|---|
| Measured | Predicted | Measured | Predicted | Measured | Predicted | Measured | Predicted | ||
| Iron 1 | (0.01%Nb) | 64% | 70% | 30% | 29% | - | - | 2% | 1% |
| Iron 2 | (1.79%Nb) | 65% | 72% | 26% | 24% | 3% | 2% | 1% | 1% |
| Iron 3 | (3.98%Nb) | 65% | 74% | 24% | 20% | 6% | 5% | 1% | 1% |
Table 3.
Phase content for both as-cast and heat treated conditions for the three irons.
| Alloy | Condition | Austenite | Martensite | M7C3 | NbC | M2C |
|---|---|---|---|---|---|---|
| (%) | (%) | (%) | (%) | (%) | ||
| Iron 1 (0.01%Nb) | As-Cast Heat Treated | 64 | 4 | 30 | - | 2 |
| 18 | 50 | 30 | - | 2 | ||
| Iron 2 (1.79%Nb) | As-Cast Heat Treated | 65 | 5 | 26 | 3 | 1 |
| 21 | 49 | 26 | 3 | 1 | ||
| Iron 3 (3.98%Nb) | As-Cast Heat Treated | 65 | 4 | 24 | 6 | 1 |
| 23 | 46 | 24 | 6 | 1 |
Table 4.
Microhardness HV15 of the phases present in the as-cast and heat treated conditions for the three irons.
Table 4.
Microhardness HV15 of the phases present in the as-cast and heat treated conditions for the three irons.
| Alloy | Condition | Matrix | M7C3 | NbC |
|---|---|---|---|---|
| Iron 1 (0.01%Nb) | As-Cast Heat Treated | 291 ± 11 | 1105 ± 55 | - |
| 509 ± 19 | - | - | ||
| Iron 2 (1.79%Nb) | As-Cast Heat Treated | 271 ± 07 | 1115 ± 31 | 2318 ± 31 |
| 489 ± 14 | - | - | ||
| Iron 3 (3.98%Nb) | As-Cast Heat Treated | 258 ± 11 | 1118 ± 41 | 2333 ± 36 |
| 470 ± 05 | - | - |
© 2019 by the authors. Licensee MDPI, Basel, Switzerland. This article is an open access article distributed under the terms and conditions of the Creative Commons Attribution (CC BY) license (http://creativecommons.org/licenses/by/4.0/).
Share and Cite
MDPI and ACS Style
Bedolla-Jacuinde, A.; Guerra, F.; Mejia, I.; Vera, U. Niobium Additions to a 15%Cr–3%C White Iron and Its Effects on the Microstructure and on Abrasive Wear Behavior. Metals 2019, 9, 1321. https://doi.org/10.3390/met9121321
AMA Style
Bedolla-Jacuinde A, Guerra F, Mejia I, Vera U. Niobium Additions to a 15%Cr–3%C White Iron and Its Effects on the Microstructure and on Abrasive Wear Behavior. Metals. 2019; 9(12):1321. https://doi.org/10.3390/met9121321
Chicago/Turabian StyleBedolla-Jacuinde, Arnoldo, Francisco Guerra, Ignacio Mejia, and Uzzi Vera. 2019. "Niobium Additions to a 15%Cr–3%C White Iron and Its Effects on the Microstructure and on Abrasive Wear Behavior" Metals 9, no. 12: 1321. https://doi.org/10.3390/met9121321
Note that from the first issue of 2016, this journal uses article numbers instead of page numbers. See further details here.