Article

Characterization of Coal Micro-Pore Structure and Simulation on the Seepage Rules of Low-Pressure Water Based on CT Scanning Data

1
State Key Laboratory of Mining Disaster Prevention and Control Co-founded by Shandong Province and the Ministry of Science and Technology, Shandong University of Science and Technology, Qingdao 266590, China
2
College of Mining and Safety Engineering, Shandong University of Science and Technology, Qingdao 266590, China
3
Key Laboratory of Coal Mine Gas and Fire Prevention and Control of Ministry of Education, China University of Mining and Technology, Xuzhou 221116, China
*
Author to whom correspondence should be addressed.
Minerals 2016, 6(3), 78; https://doi.org/10.3390/min6030078
Submission received: 27 April 2016 / Revised: 9 June 2016 / Accepted: 20 July 2016 / Published: 26 July 2016

Abstract

:
This paper used the X-ray three-dimensional (3D) microscope and acquired, through CT scanning, the 3D data of the long-frame coal sample from the Daliuta Coal Mine. Then, the 3D datacube reconstructed from the coal’s CT scanning data was visualized with the use of Avizo, an advanced visualization software (FEI, Hillsboro, OR, USA). By means of a gray-scale segmentation technique, the model of the coal’s micro-pore structure was extracted from the object region, and the precise characterization was then conducted. Finally, the numerical simulation on the water seepage characteristics in the coal micro-pores model under the pressure of 3 MPa was performed on the CFX platform. Results show that the seepage of low-pressure water exhibited preference to the channels with large pore radii, short paths, and short distance from the outlet. The seepage pressure of low-pressure water decreased gradually along the seepage direction, while the seepage velocity of low-pressure water decreased gradually along the direction from the pore center to the wall. Regarding the single-channel seepage behaviors, the seepage velocity and mass flow rate of water seepage in the X direction were the largest, followed by the values of the seepage in the Y direction, and the seepage velocity and mass flow rate of water seepage in the Z direction were the smallest. Compared with the results in single-channel seepage, the dual-channel seepage in the direction of (X + Y) and the multi-channel seepage in the direction of (X + Y + Z) exhibited significant increases in the overall seepage velocity. The present study extends the application of 3D CT scanning data and provides a new idea and approach for exploring the seepage rules in coal micro-pore structures.

Graphical Abstract

1. Introduction

Water injection into coal seams is one of the most significant methods to prevent and deal with rock bursts, coal and gas outbursts, and coal dust. However, coal is a complex porous medium which, besides coal matrix, contains many other components, such as pores, fractures, and minerals. The physical properties and micro-pore structure characteristics of coal components directly affect its macroscopic physical and chemical properties, such as adsorptivity and permeability. A thorough knowledge of these micro-properties provides the basis for the research on the seepage characteristics of water and gas in coal pores [1]. Accordingly, it is particularly important to quantitatively characterize the micro-pore structure with good precision. Computed tomography (CT) has become a dominant technique which is used to investigate the micro-pore structure of coal because of several advantages it offers, such as non-destructive, accurate and quantitative detection, as well as three-dimensional (3D) digitization.
Over the past several years, many researchers conducted a great deal of research on the micro-structure of coal. Van et al. [2] gained in-depth insight into the distribution of minerals, macerals, pores and fractures in coals by using the X-CT technique. Simons et al. [3] made quantitative characterization of coals using the CT reconstruction method, in which the precision of characterization was approximately 53 μm. By means of the CT technique, Mazumder et al. [4] investigated the cleats, pore diameters, and spacing in coal seams, and Golab et al. [5] analyzed the occurrence characteristics of the minerals in coals. With the CT imaging method, Karacan et al. [6] examined the adsorption and migration behaviors of gases in the micro-structure of coal and made corresponding assessments. Mathews et al. [7] used a high-resolution CT technique to observe the thermal drying process of subbituminous coals. By means of the micro-CT technique, Meng et al. [8] conducted a quantitative study on the morphological characteristics of the pore structure of coking coals. Yao et al. [9] adopted a quantitative method to characterize the development degrees and spatial distribution characteristics of pores and cracks in coals of various ranks. Song et al. [10] performed 3D scanning imaging on coal samples of different structures and precisely characterized their seepage pore properties. However, due to the limitation in the accuracy of CT equipment, the precise characterization of coal micro-pore structure still exhibits certain errors and needs to be further improved.
Based on the knowledge of coal micro-pore structure, many scholars further explored the seepage laws in coal pores with certain progress. Coles et al. [11] conducted an in-depth study on the characteristics of adsorption and migration of the gases in coal pores and cracks. Stauffer and Aharony [12] focused on the seepage mechanism in a single porous medium and concluded that the permeability of this porous medium decreases as the number of isolated pore groups increases. Using the Lattice Boltzmann Method (LBM), Teng [13] and Jin et al. [14] performed simulations on the seepage rules of gas in the coals. Liu et al. [15] established the coupling numerical model of seepage and stress in the media with pores and fractures based on the discrete element method of continuous media. Perera et al. [16] reviewed the effects of coal physical properties and permeability on carbon dioxide sequestration in a coal seam. Despite all of these achievements, there is still a need for comprehensive and thorough understanding of the seepage laws of low-pressure water in coals at the micro-level. Therefore, it is quite necessary to perform scanning and reconstruction on coals using high-precision micro-CT equipment, then construct the coal’s micro-pore structure model and, finally, investigate the seepage rules of pressurized water in coal’s micro-pore structure at the micro-level through simulations.
In this paper, coals were firstly scanned using the high-precision X-ray 3D microscope (Nano Voxel-2000, Sanying Precision Instruments Co., Ltd., Tianjin, China) and the 3D reconstruction of coal was visualized by Avizo software so as to precisely characterize the model of the micro-pore structure of coal. Finally, the simulation on the single-channel, dual-channel, and multi-channel seepage behaviors of low-pressure water was conducted based on the geometric model of coal’s micro-pores. The present study offers a new way towards a deeper understanding of coal’s real micro-pore structure and the seepage rules of pressurized water in coals.

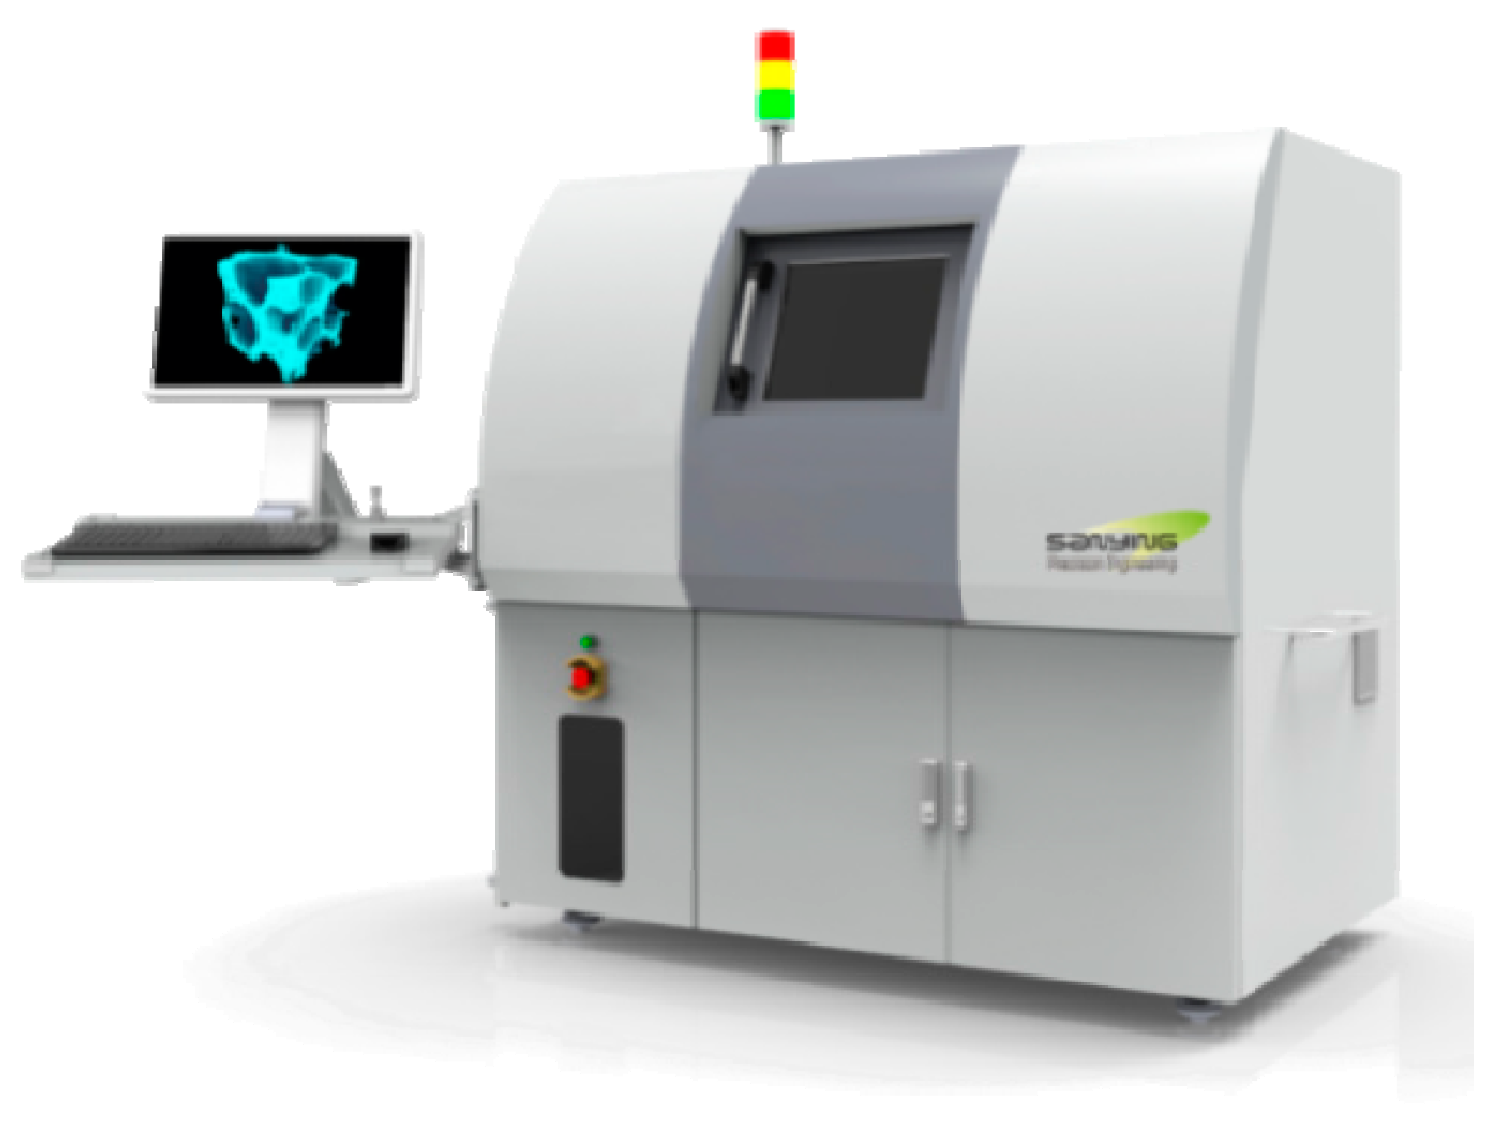
2. Principle of CT Scanning

According to photoelectric effect, when X-ray or γ-ray passes through an object, the incident photons can be absorbed by the object and thereby the incident intensity decreases, i.e., the intensity of X-ray or γ-ray is attenuated. Taking a uniformly-distributed material with a linear attenuation coefficient of μ as an example, when it is irradiated by X-rays with an incident intensity of I0, the attenuation of X-rays by the object obeys the Beer-Lambert law and the following expression can be obtained:
I = I 0 e μ x
where I denotes the intensity of ray attenuated by the object and ∆x denotes the distance the ray travels in the object.
For a mixture or a compound material consisting of more than a single element, the following expression can be obtained:
μ = i a i μ i
where μi and ai denote the linear attenuation coefficient and mass percentage of the i-th component, respectively. The following expression can be obtained:
I = I 0 e μ 1 Δ x e μ 2 Δ x e μ 3 Δ x e μ n Δ x = I 0 e i = 1 n μ i Δ x
Equation (3) can further be converted into:
ln ( I I 0 ) = ln ( I 0 I ) = i = 1 n μ i Δ x = L μ i d x
Based on Equation (4), one can find that the linear integral of the material attenuation coefficient along the ray transmission path equals to the logarithm of the ratio of input intensity to output intensity. In CT technology, the image is reconstructed through the calculation of the attenuation coefficient based on the projection data related to the ratio in Equation (4).

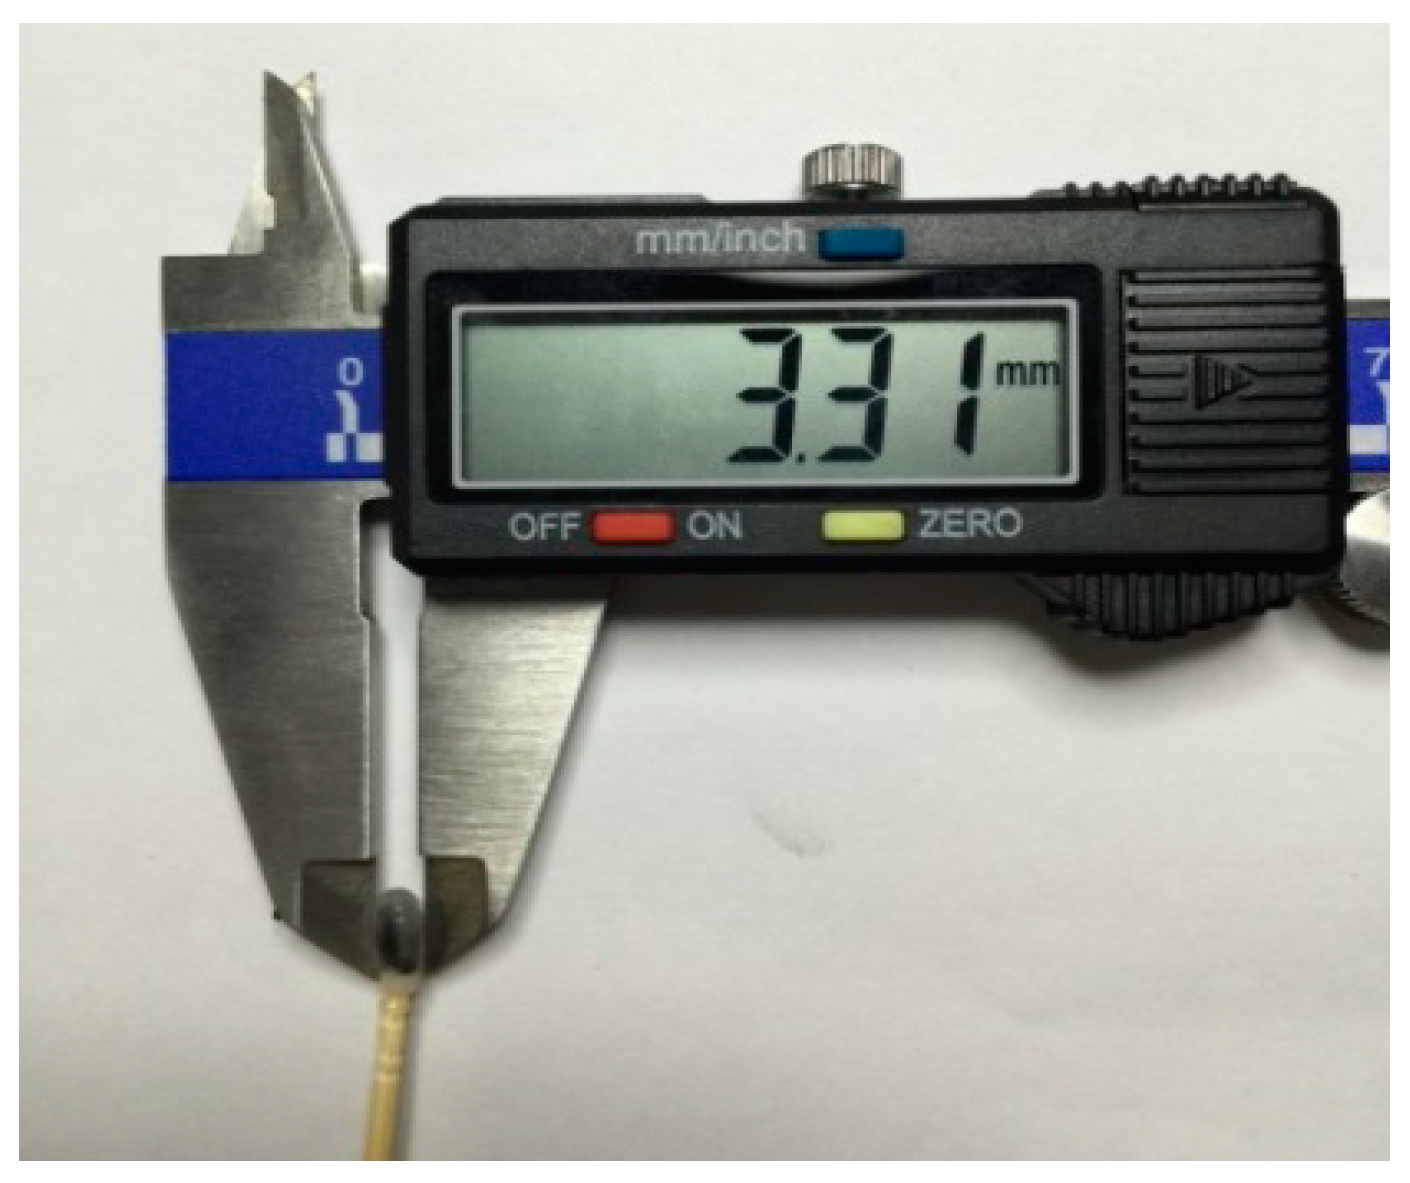
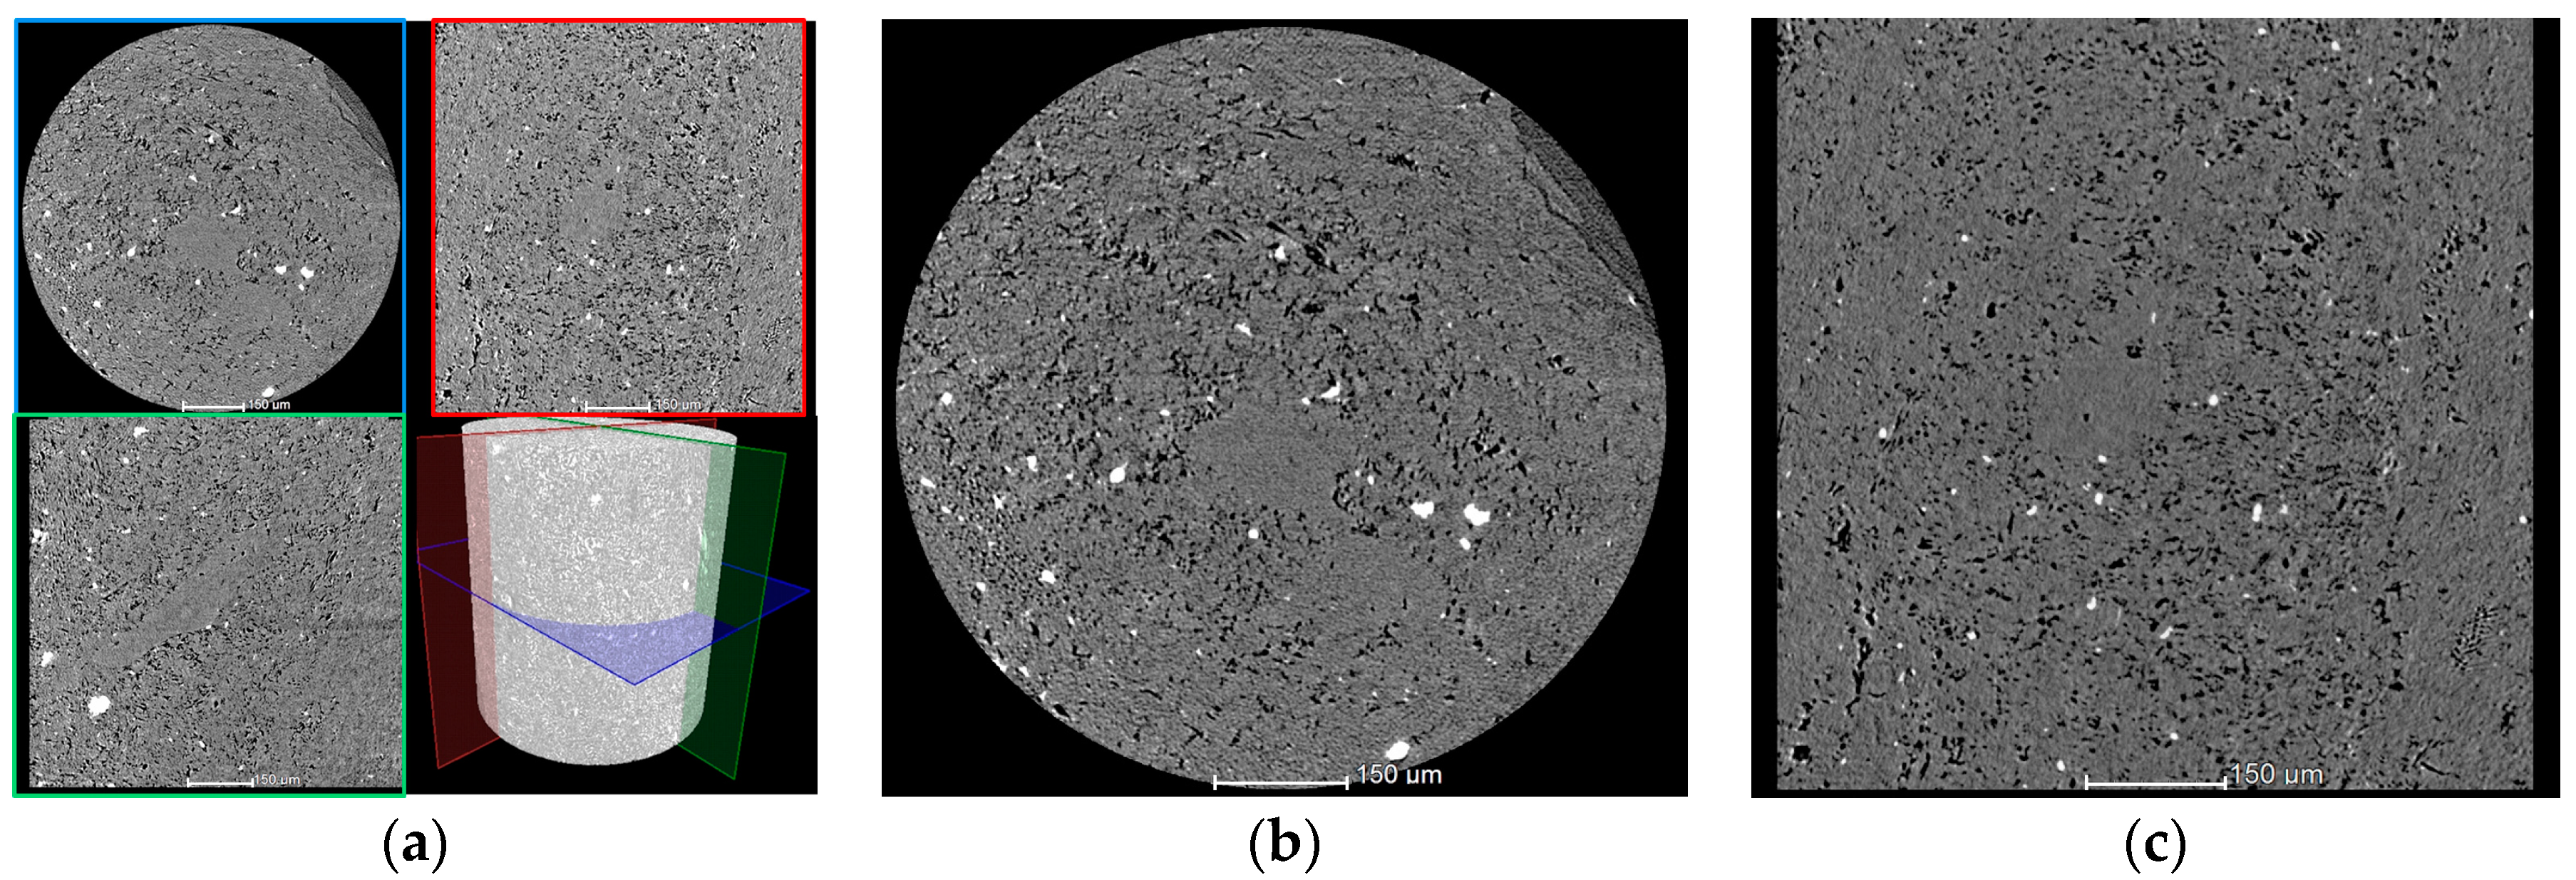
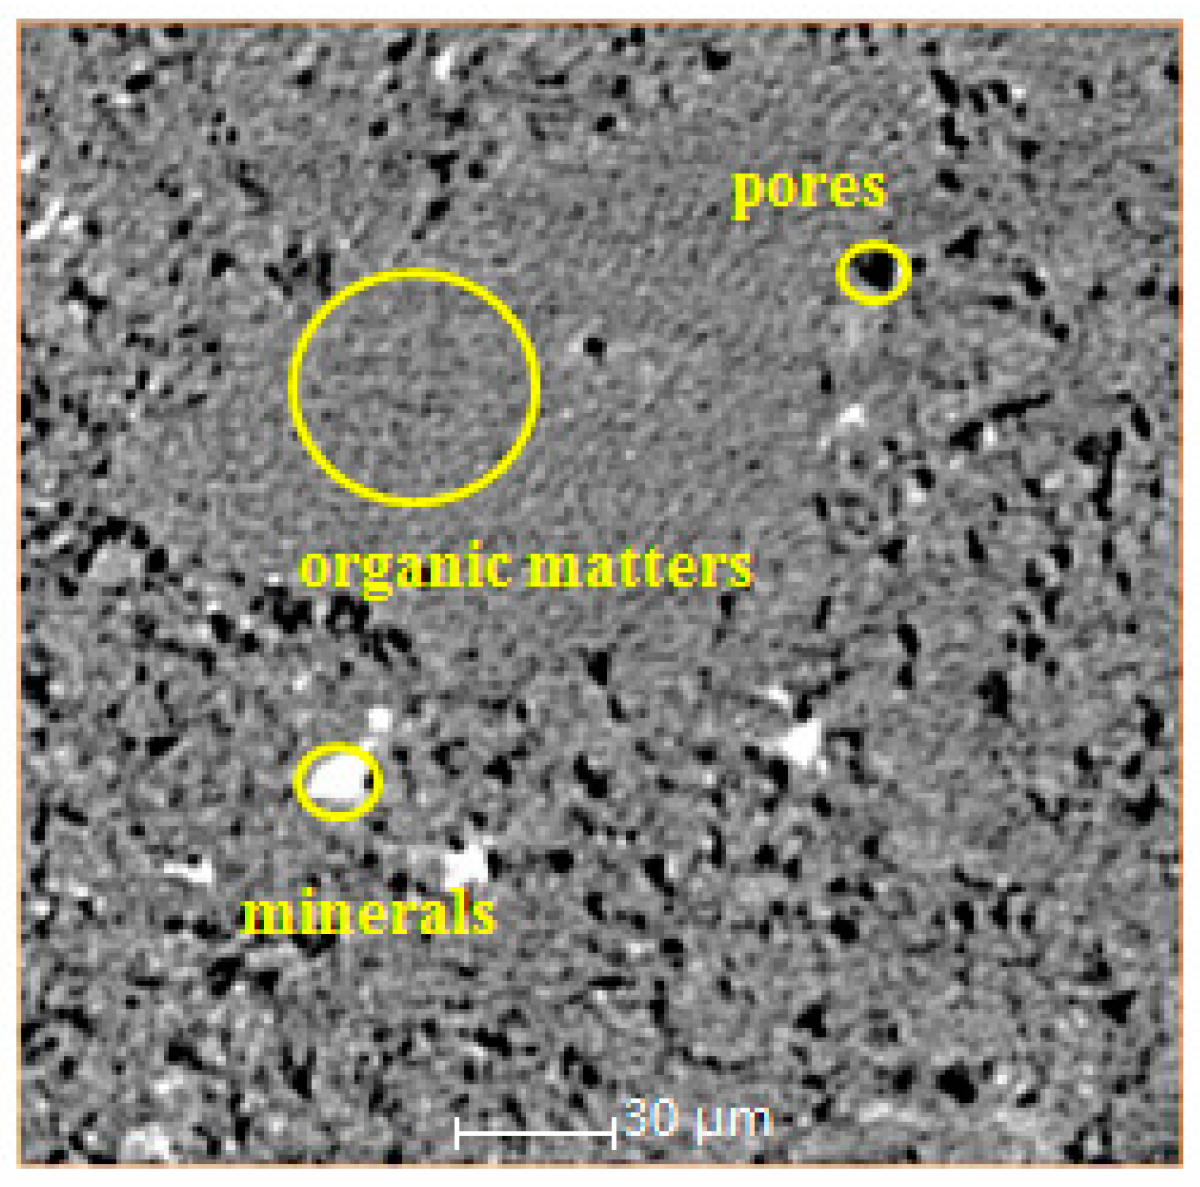
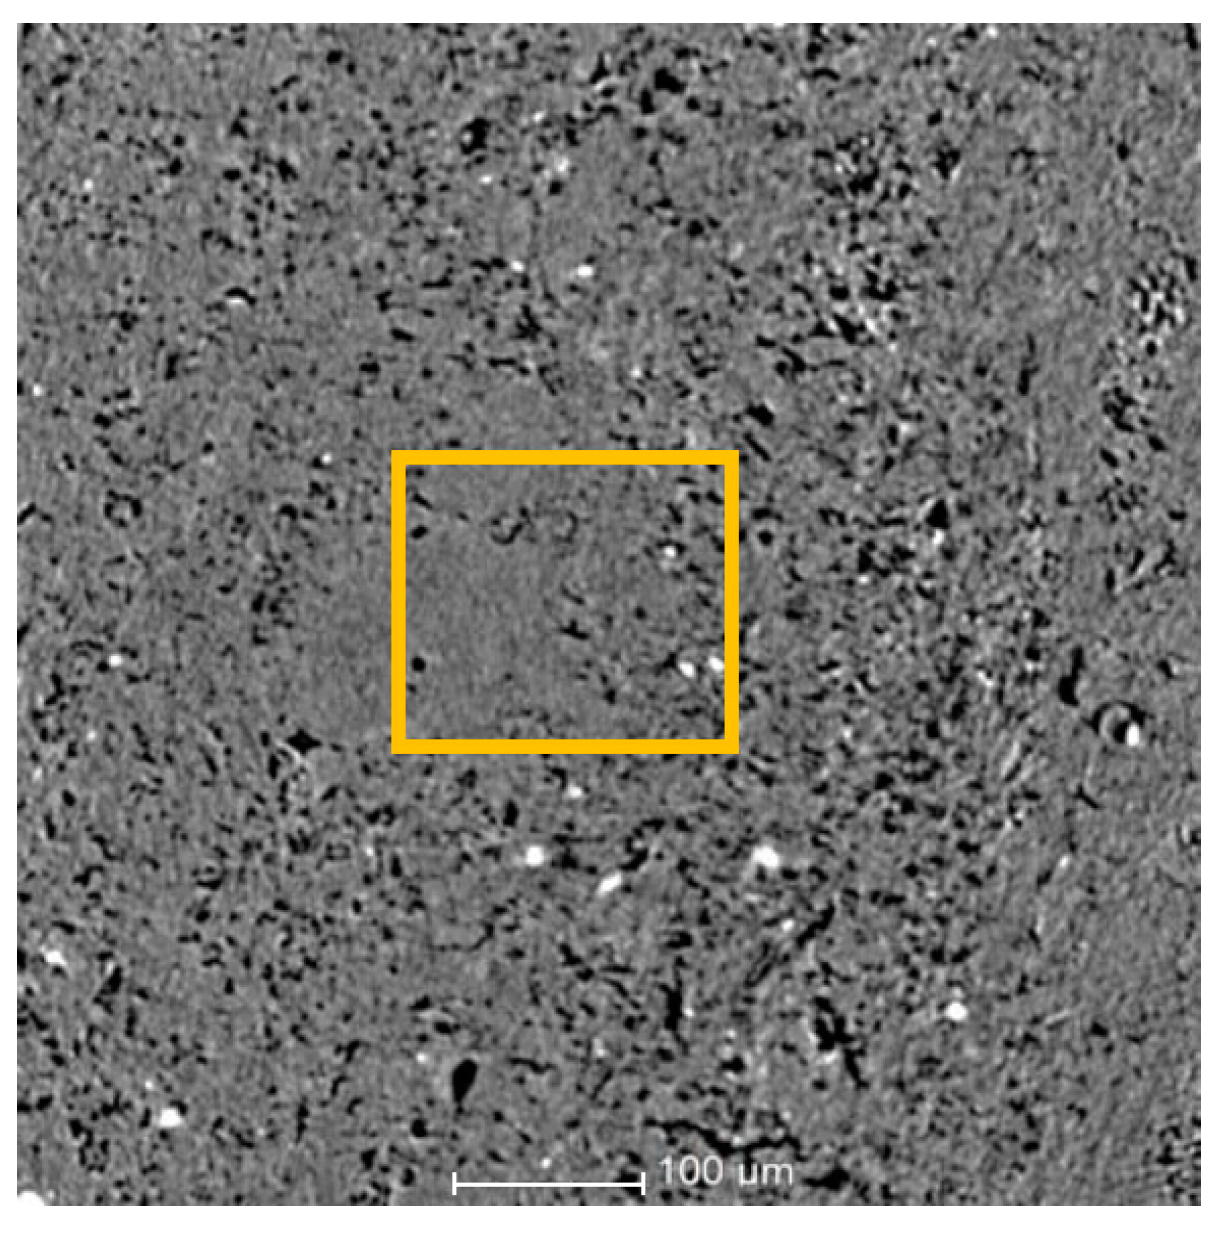
3. Coal Sample Processing and CT Scanning

During CT scanning, the layer with a certain thickness is scanned by the X-ray beam, and the transmitted X-ray signal is received by the detector and then transformed into visible light signal; then, the light signal is converted to electrical signal via photovoltaic conversion, which is then converted to a digital signal via the analog-to-digital (A/D) converter and input to the computer for processing. CT can detect the internal structure of a material in a non-destructive way and generate high density resolution images of the cross-section. In a word, CT exhibits obvious advantages in investigating the micro-pore structure of coal [17,18,19].
In this paper, the X-ray 3D microscope (Nano Voxel-2000, Sanying Precision Instruments Co., Ltd.) was used for CT scanning, with a resolution up to 0.5 μm. The imaging quality and overall performance of this X-ray 3D microscope have already reached the top level of similar products in the world [20,21]. The equipment can be used for 3D characterization of the internal pore structure of coal and rock at the micro-scale. By using a combination of several types of software for finite-element and discrete-element analysis, such as Avizo, Ansys, COMSOL, EDEM, and Barracuda, the 3D connectivity of the internal pores and throats in the core can be calculated and the statistical results of porosity, pore size, throat size, and various seepage characteristic parameters can be acquired. Figure 1 displays the photograph of the X-ray 3D microscope.
In the present study, a long flame coal sample from the Daliuta Coal Mine, Shenmu County, Shaanxi, was selected, and an ore core with the diameter and length of 2 and 5 mm, respectively, was drilled for further analysis. To avoid the influence of coal shape change induced by water evaporation on the experimental results, the ore core was sealed with wax. After being sealed, the ore core of the coal sample was 3.31 mm in diameter, as shown in Figure 2. Then, the ore core was stuck to the end of a toothpick, placed on the sample stage of the X-ray 3D microscope (which can be rotated by 360°), and fixed by the screw. The main control computer interface was then initiated for adjusting the position of the sample stage to the central position in four dimensions (x, y, z, and r). Then the X-ray source was turned on, and 3D data of the coal sample was acquired viasuper-wide-field scanning. Table 1 lists the specific parameter settings in CT scanning. A 20× lens detector was used, the number of scanning frames was set as 900, i.e., the sample stage was scanned once when it was rotated by 0.4°, and the duration of exposure equaled to the duration of one full rotation of the sample stage. In Table 1, SOD denotes the distance between the X-ray source and the detector, and ODD denotes the distance between the stage sample and the detector.

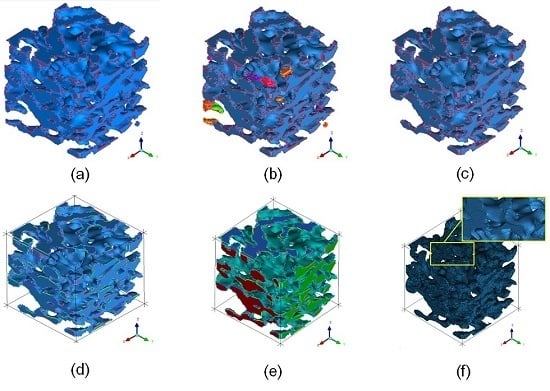
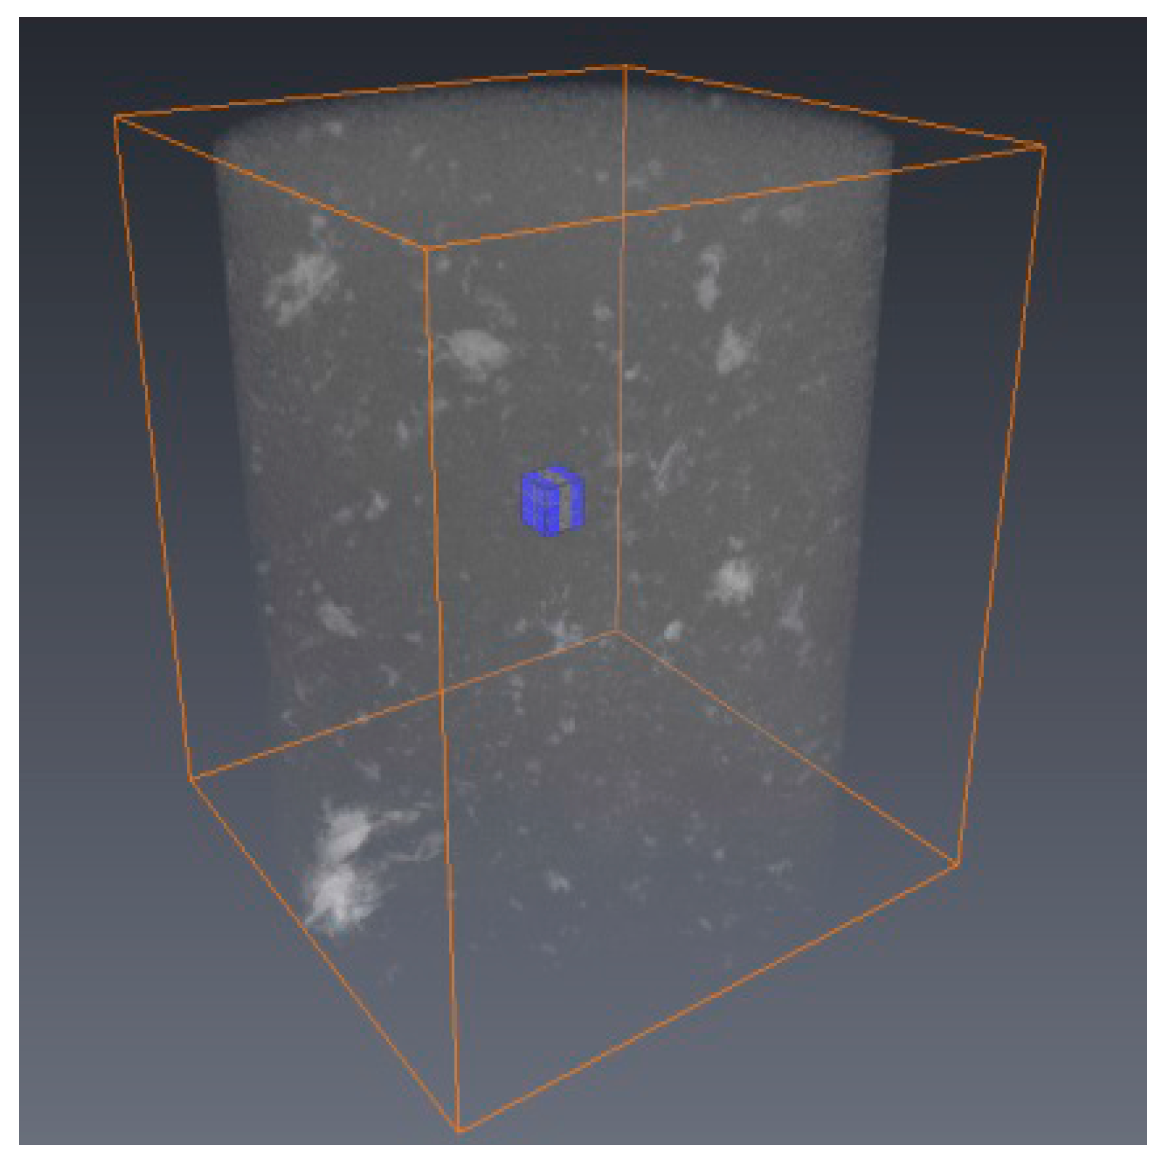
4. Visualization of the 3D Reconstruction of Coal Sample

It should be noted that the Nano Voxel-2000X-raysystem is equipped with a set of special 3D reconstruction software and algorithms that can directly convert the 2D scanned images to a 3D data cube.
Avizo™ software is a set of all-in-one visual tools and can visually display, process, and interpret engineering and scientific data. Avizo provides powerful data processing ability, and it has an easy-to-use and user-friendly graphical interface. These features allow it to deal with complex 3D data. Avizo also has strong abilities in image information processing, geometry calculation, and reconstruction of high-resolution 3D images. Owing to its particular high-efficiency algorithm, Avizo can accurately reconstruct 3D image based on the data of slices collected by CT equipment, MRT equipment, 3D ultrasonic equipment, and confocal microscope.
In the present study, the used Nano Voxel-2000 system has the resolution of 1 μm × 1 μm × 1 μm. The 3D data acquired by scanning were imported to Avizo software for the visualization of 3D reconstruction, and the digital coal body with the characteristics of real pore structure was then acquired. The voxel size of the digital coal body was 1024 × 1024 × 1024 while the actual size of it was 1.024 mm × 1.024 mm × 1.024 mm. Two profile images on the XY and ZY planes, respectively, were selected for observation. Figure 3a shows four images of the reconstructed 3D model from different angles of view. Figure 3b displays the profile image of the 512th layer on the XY plane and Figure 3c displays the profile image of the 420th layer on the ZY plane.
The profile image on the XY plane was selected for further analysis. One can clearly observe the distribution of organic matter, minerals, and pores, as shown in Figure 4. For more precise characterization of the micro-pore structure of coal, an original profile image on the XY plane was arbitrarily selected, and the part on the yellow border was enlarged, as shown in Figure 5. The pores were marked in black in the originally measured data. To facilitate the identification and analysis of the single pore, the pore image was processed using an image segmentation technique. Figure 6 shows the pore image after such processing, where the pores were marked in white so as to more directly analyze the overall distribution and relative sizes of the pores on each cross-section. The single pore was calibrated and measured with the measurement tool of the software.

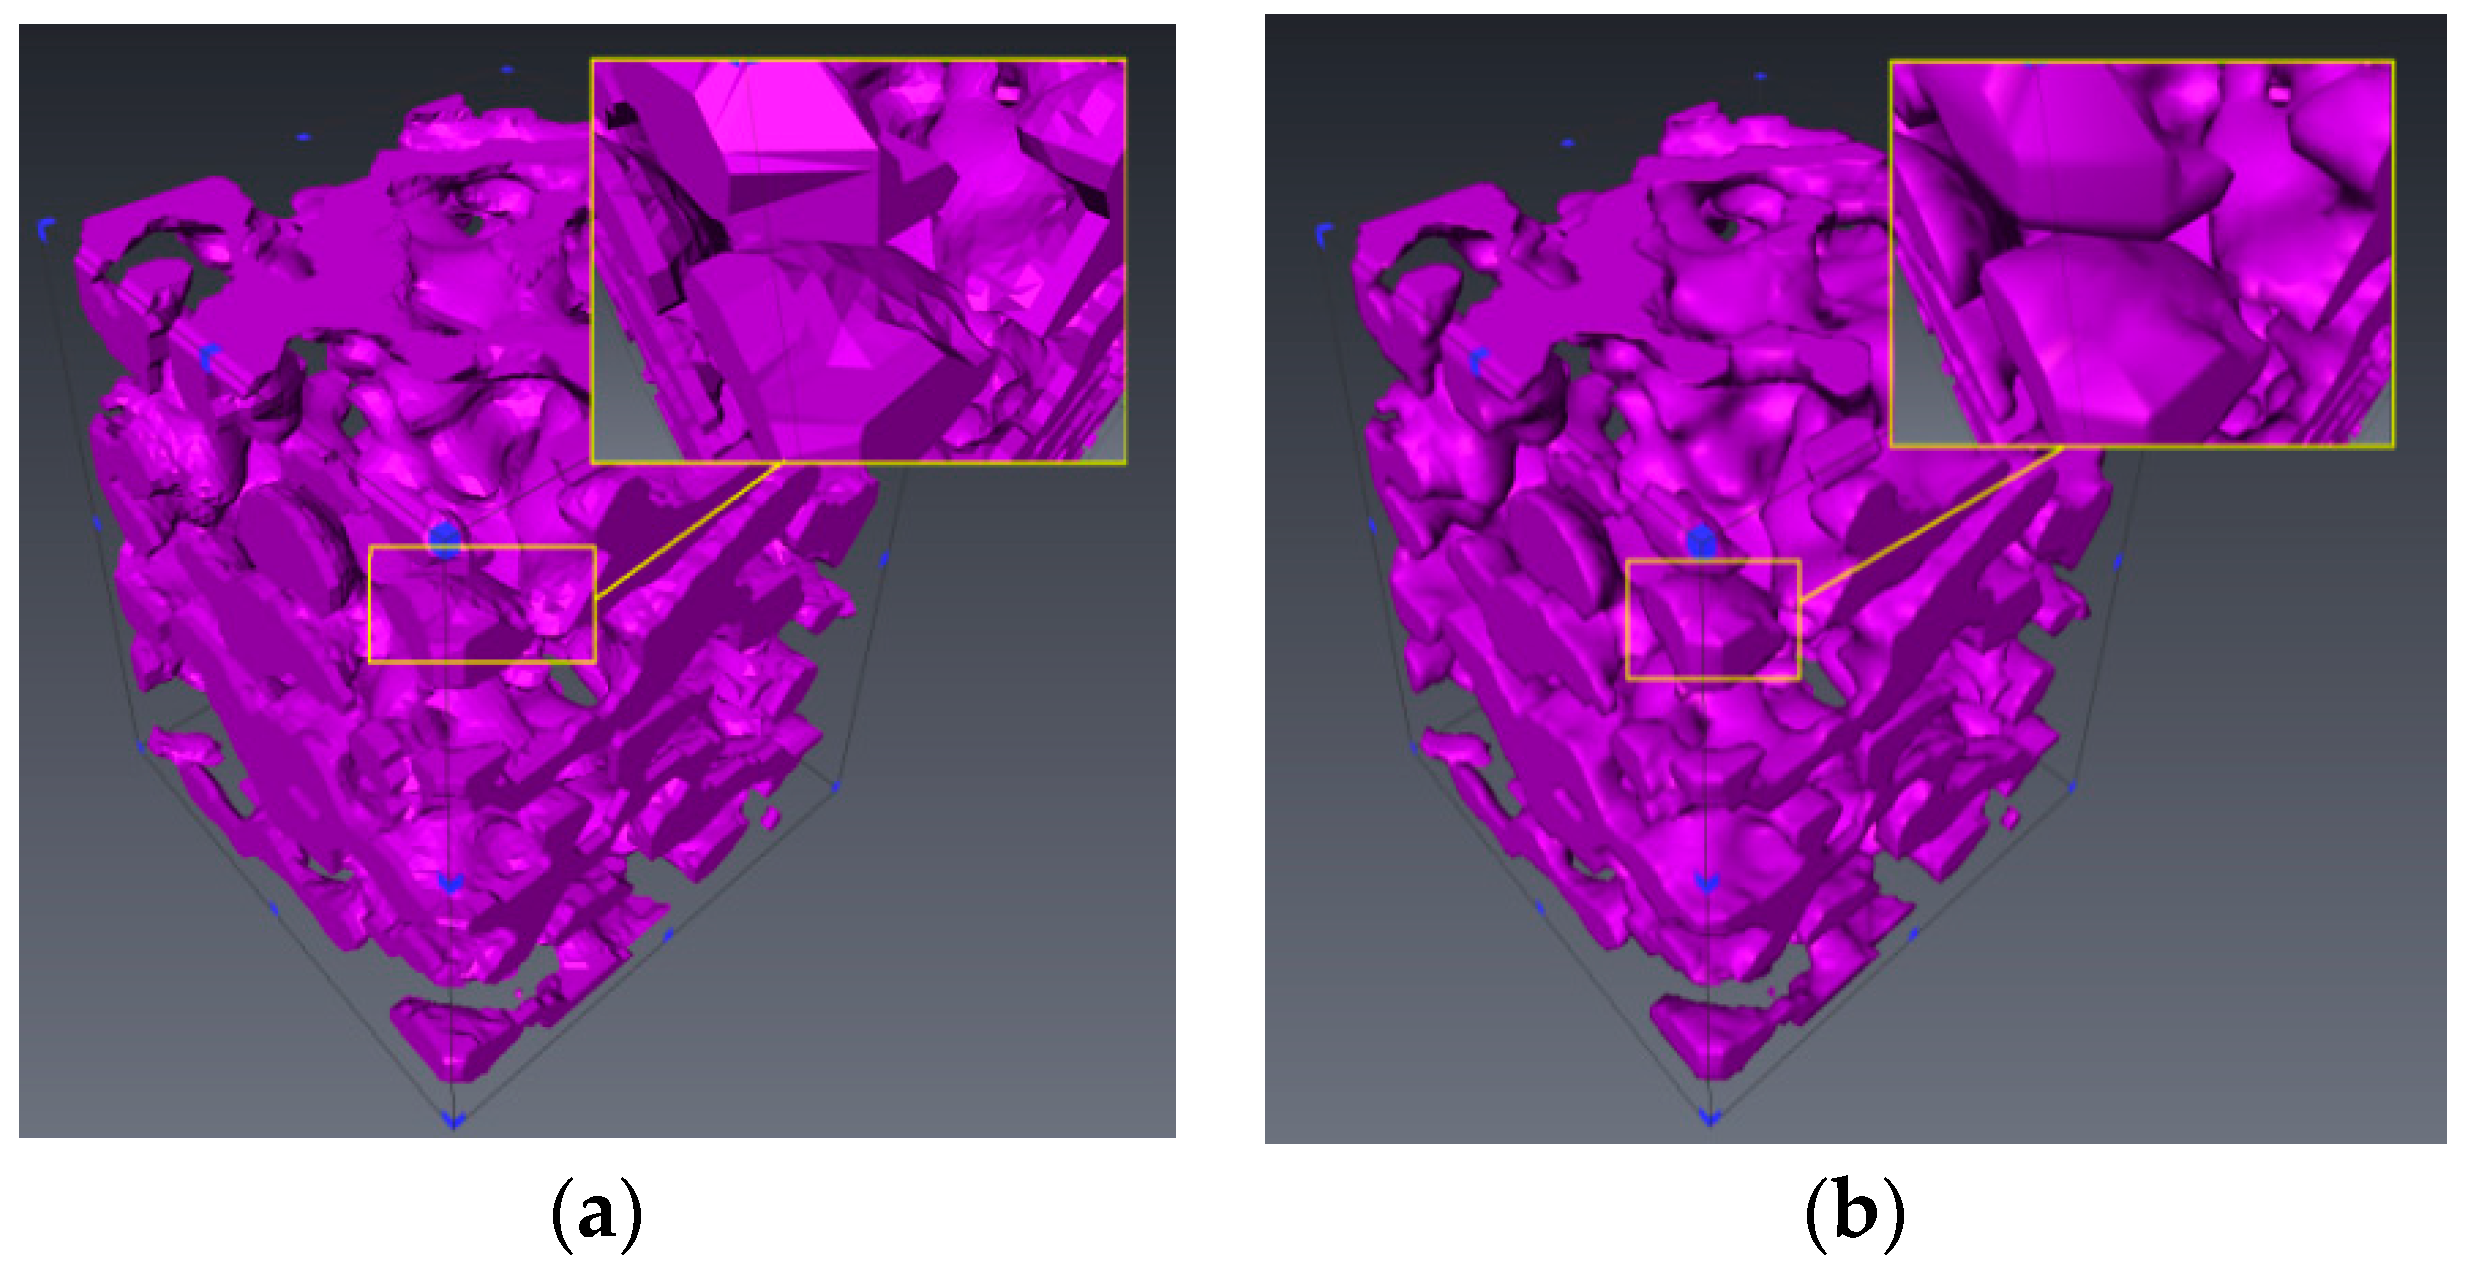
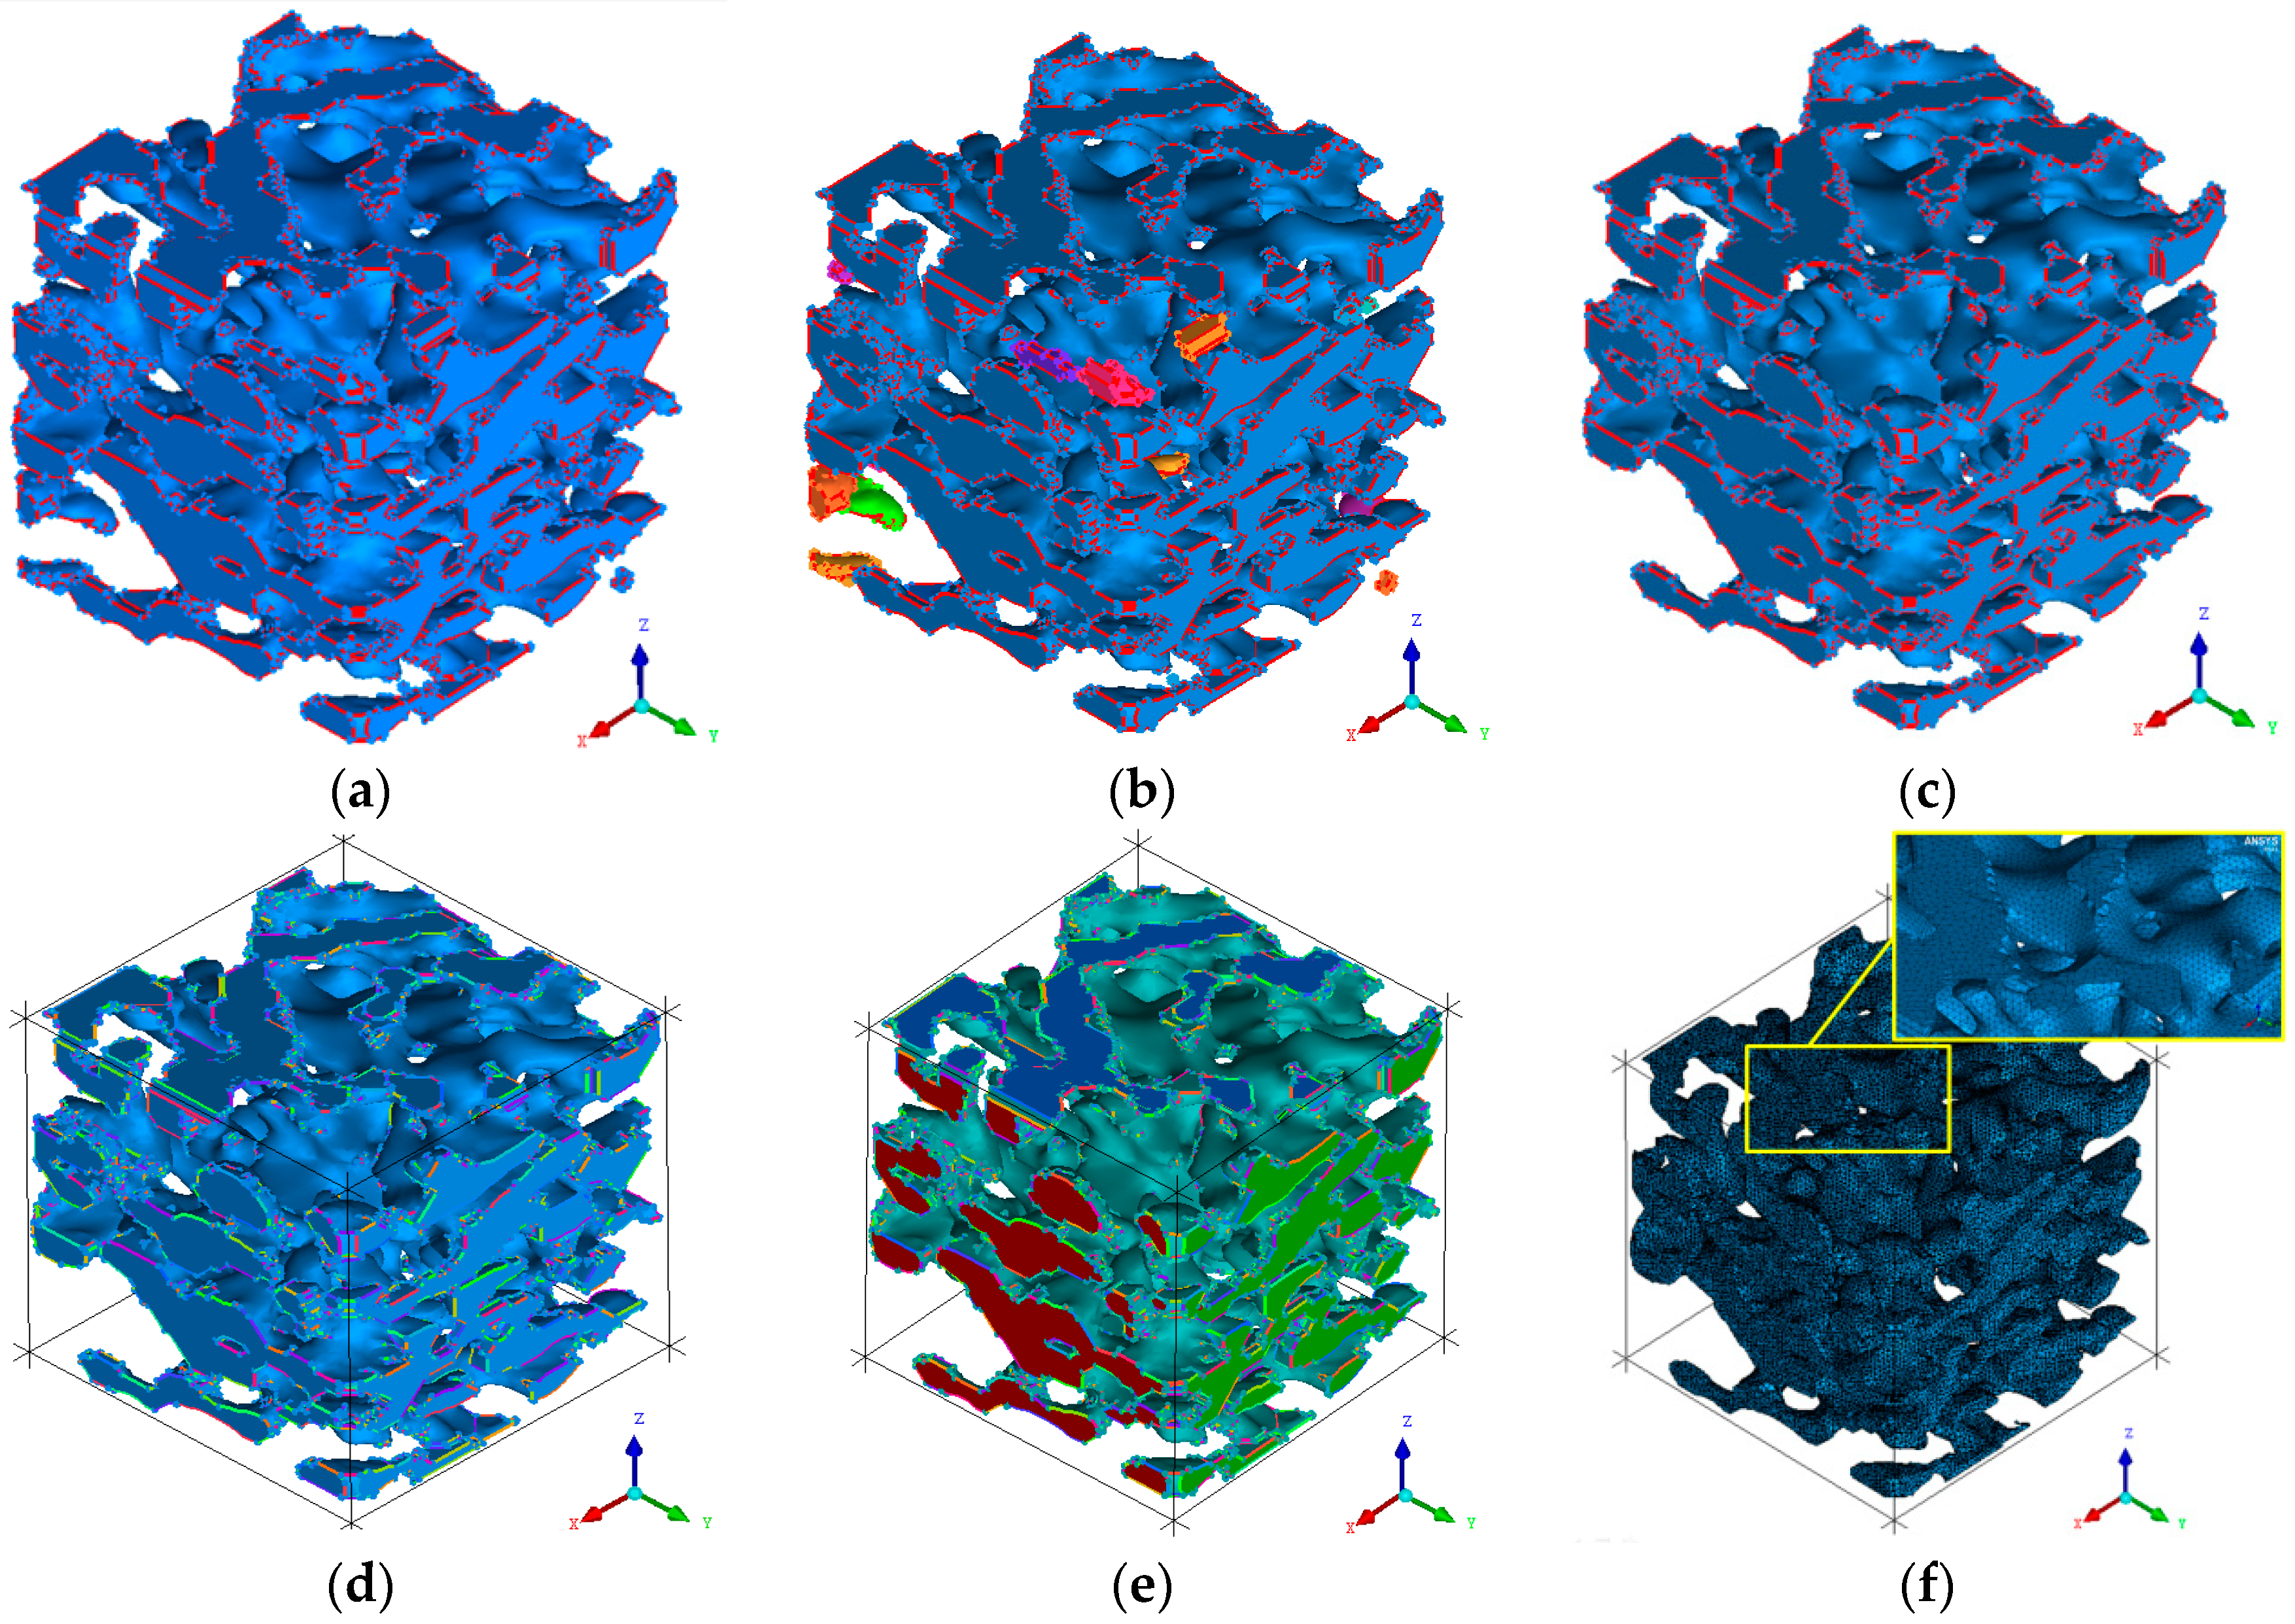
5. Construction and Optimization of the Model of Micro-Pore Structure of Coal

High-precision characteristics of the pore resolution lay the basis and provides the guarantee for the construction of the micro-pore structure model based on the actual pore structure. Meanwhile, to reduce the calculation load induced by oversized data in mesh generation and analysis, a data cube with the size of 60 pixel × 60 pixel × 60 pixel was selected in the reconstructed digital coal body, as shown in Figure 7. The actual size of the selected coal body is 60 μm × 60 μm × 60 μm. With the use of the gray-scale segmentation technique, the digital coal body was segmented and the model of the micro-pore structure of coal was acquired, as shown in Figure 8a. Using the option of vertical normal surface optimization in the software, the model of micro-pore structure of coal was optimized and, thus, the pore model with smoother surface was constructed. What still needs to be explained is, here, the optimization is only in terms of visual effects. Figure 9b displays the model of micro-pore structure of coal after the optimization.
Both pore and throat were defined based on the ball-and-stick network model. The maximum ball algorithm was used in this study for the construction of the ball-and-stick model. The specific procedure is described below. For any voxel point in the pore space, the inscribed sphere in this space with the maximum volume whose center is located at this voxel point, is firstly found; accordingly, the pore space is full of these spheres. It should be noted that these spheres overlap with each other and are mutually included. The included small spheres are then deleted, and the remaining spheres are divided into two types—primary spheres and secondary spheres—to describe the pore space. Finally, all of the primary spheres with local maximum volumes can be regarded as the pores while the spheres connecting the adjacent pores are used for characterizing the throats. This algorithm can accurately reflect the structural features of coal’s micro-pore space and, thus, quantitatively characterize the pore’s micro-structural parameters [22].
Figure 9 clearly shows the 3D distribution of the micro-pore structure of coal, from which we can observe that the channels of pores were extended in a complicated manner and the pores with different sizes exhibit local differences along different directions; additionally, most of the pores were formed horizontally and only a minority of pores were formed vertically. In order to gain in-depth knowledge of the microscopic size of the micro-pore model, the ball-and-stick model was developed using the digital core analysis software Sypicore provided by Nano Voxel-2000, and then the statistics on the coal’s micro-structural parameters was conducted using the ’MEASURE’ function of Avizo. The results indicate that the number of pores in this micro-pore model was 219, the maximum pore radius was 4.36 μm, the maximum pore volume was 3336 μm3, the mean pore radius was 1.17 μm, the mean pore volume was 124.23 μm3, and the bulk porosity was 15.47 % (including all of the pores, throats, and fractures). Table 2 lists the qualitative analysis results of the throat size.
The acquired pore-structure model was imported into ICEM CFD software (ANSYS Inc., Canonsburg, PA, USA) for further optimization. The model was meshed through high-quality mesh generation and set with boundary conditions. Accordingly, the single-channel and multi-channel seepage characteristics of low-pressure water in the model of the micro-pore structure of coal can be simulated. Specifically, the optimization process included three steps: the repair of the micro-pore structure model (i.e., to delete the redundant points, lines and surfaces, within the allowable tolerance of 0.05), the segmentation of islands (here, the islands refer to the pore geometries that were not connected to the maximum pore connected cluster and existed independently in the micro-pore model, while the maximum pore connected cluster refers to the portion with the greatest connected volume in the coal micro-pore model) and the deletion of islands, as shown in Figure 9a–c, respectively. The segmentation of islands was achieved using the setting of ‘break by connectivity’ on the micro-pore model. Figure 9 displays the whole process of the optimization of coal micro-pore model and mesh generation on the ICEM platform.
Due to the irregularity of coal pore structure, the global automatic mesh generation was firstly adopted; then the quality of meshes was checked and the low-quality meshes were deleted (i.e., the meshes with the quality lower than 0.4). After being repaired, the meshes were checked, and the irrelevant mesh points were deleted, through which the grid quality was further enhanced.

6. Simulation on the Seepage Characteristics of Low-Pressure Water in Coal Micro-Pore Structure Model

In this section, using CFX software, the numerical simulation on the characteristics of single-channel and multi-channel seepage was performed for low-pressure water in a coal micro-pore structure model. The simulation was based on the transient Navier-Stokes Equation, in which a k-epsilon standard turbulence model was adopted and the fluid was set as water at room temperature, in terms of material property. In addition, the inlet pressure was set as 3.1 MPa and the outlet pressure was set as 0.1 MPa. For a coal micro-pore structure model, the characteristics of single-channel, dual-channel, and multi-channel seepage were simulated both separately in three directions (X, Y, and Z) and comprehensively in the combined directions.

6.1. Numerical Simulations on Single-Channel Seepage Characteristics Along the X, Y, and Z Directions

Figure 10 and Figure 11 display the distributions of pressure and seepage velocity subject tolow-pressure water along a single-channel in X, Y, and Z directions.
One can observe that, although the pressure drops in three directions (X, Y, and Z) are identical (∆P = 3 MPa), the 3D distributions of the single-channel seepage pressure fields in three directions are different to a certain extent. This is because of the local differences in the shape, size, and connectivity, as well as the permeability of the pore channels. To be specific, one can observe that, along the water seepage direction, the pressure decreased gradually and the maximum pressure was present at the narrow pore near the inlet; at the narrow pore where water flowed, the pressure varied the fastest and decreased as a whole (generally, the pressure firstly decreased and then increased), which is mainly due to the fact that the pore channel bent sharply and its diameter decreased rapidly.
Figure 11 displays the overall velocity distributions of the single-channel water seepage in X, Y, and Z directions. Then, different sections at different positions along the axis directions (i.e., x = 0, 12, 24, 36, 48 and 60 μm; y = 0, 12, 24, 36, 48 and 60 μm; z = 0, 12, 24, 36, 48 and 60 μm, respectively, in which x, y, and z denote the distances from the inlet section) were selected, and the water seepage velocity distributions of different sections were acquired and shown in Figure 12, Figure 13 and Figure 14.
As shown in Figure 11, Figure 12, Figure 13 and Figure 14, under the same pressure drops along the three directions (X, Y, and Z), the single-channel seepage velocity distribution along three directions were different due to the differences in the distribution of seepage water pressure, as well as the connectivity and permeability of pore channels. The primary conclusions are as follows:
(1)
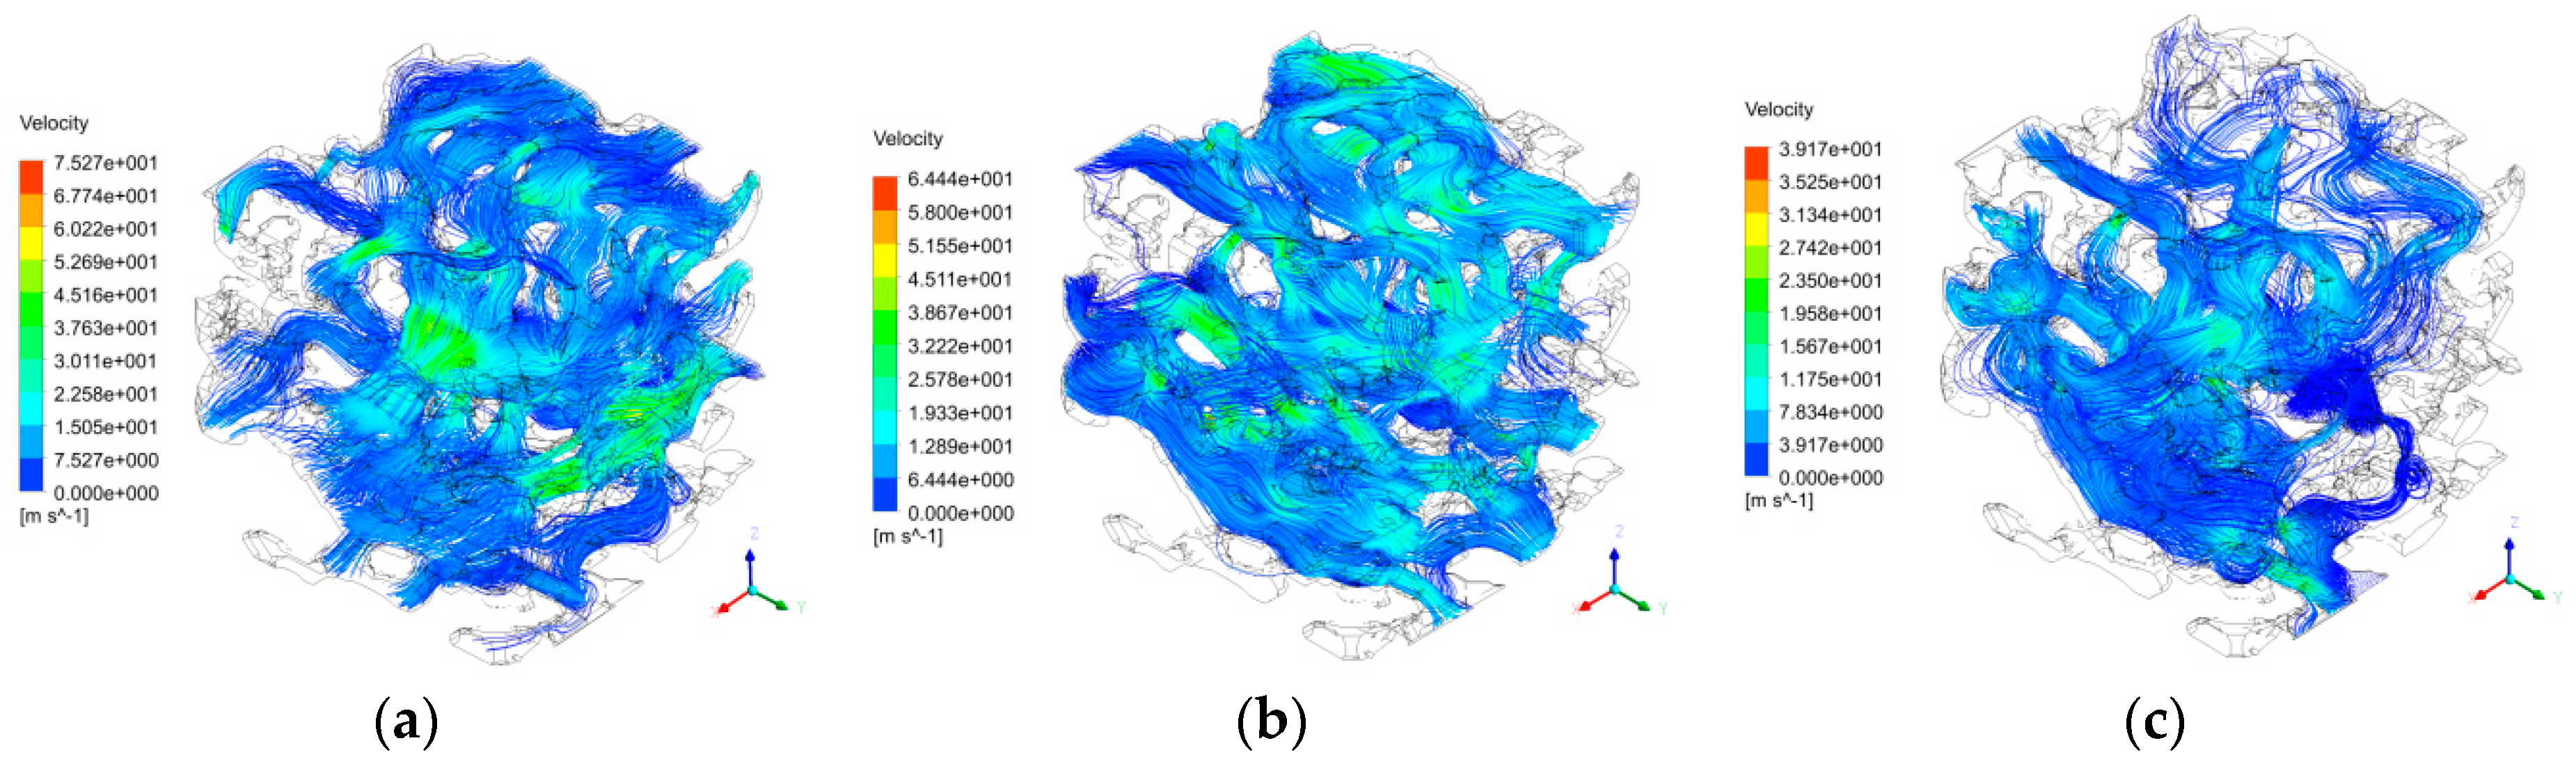
In the maximum pore-connected cluster, although all the pores were connected with each other, the seepage of low-pressure water was observed in only a few pores. The seepage of low-pressure water firstly selected the paths with large pore radii, short paths, and shorter distances from the outlet.
(2)
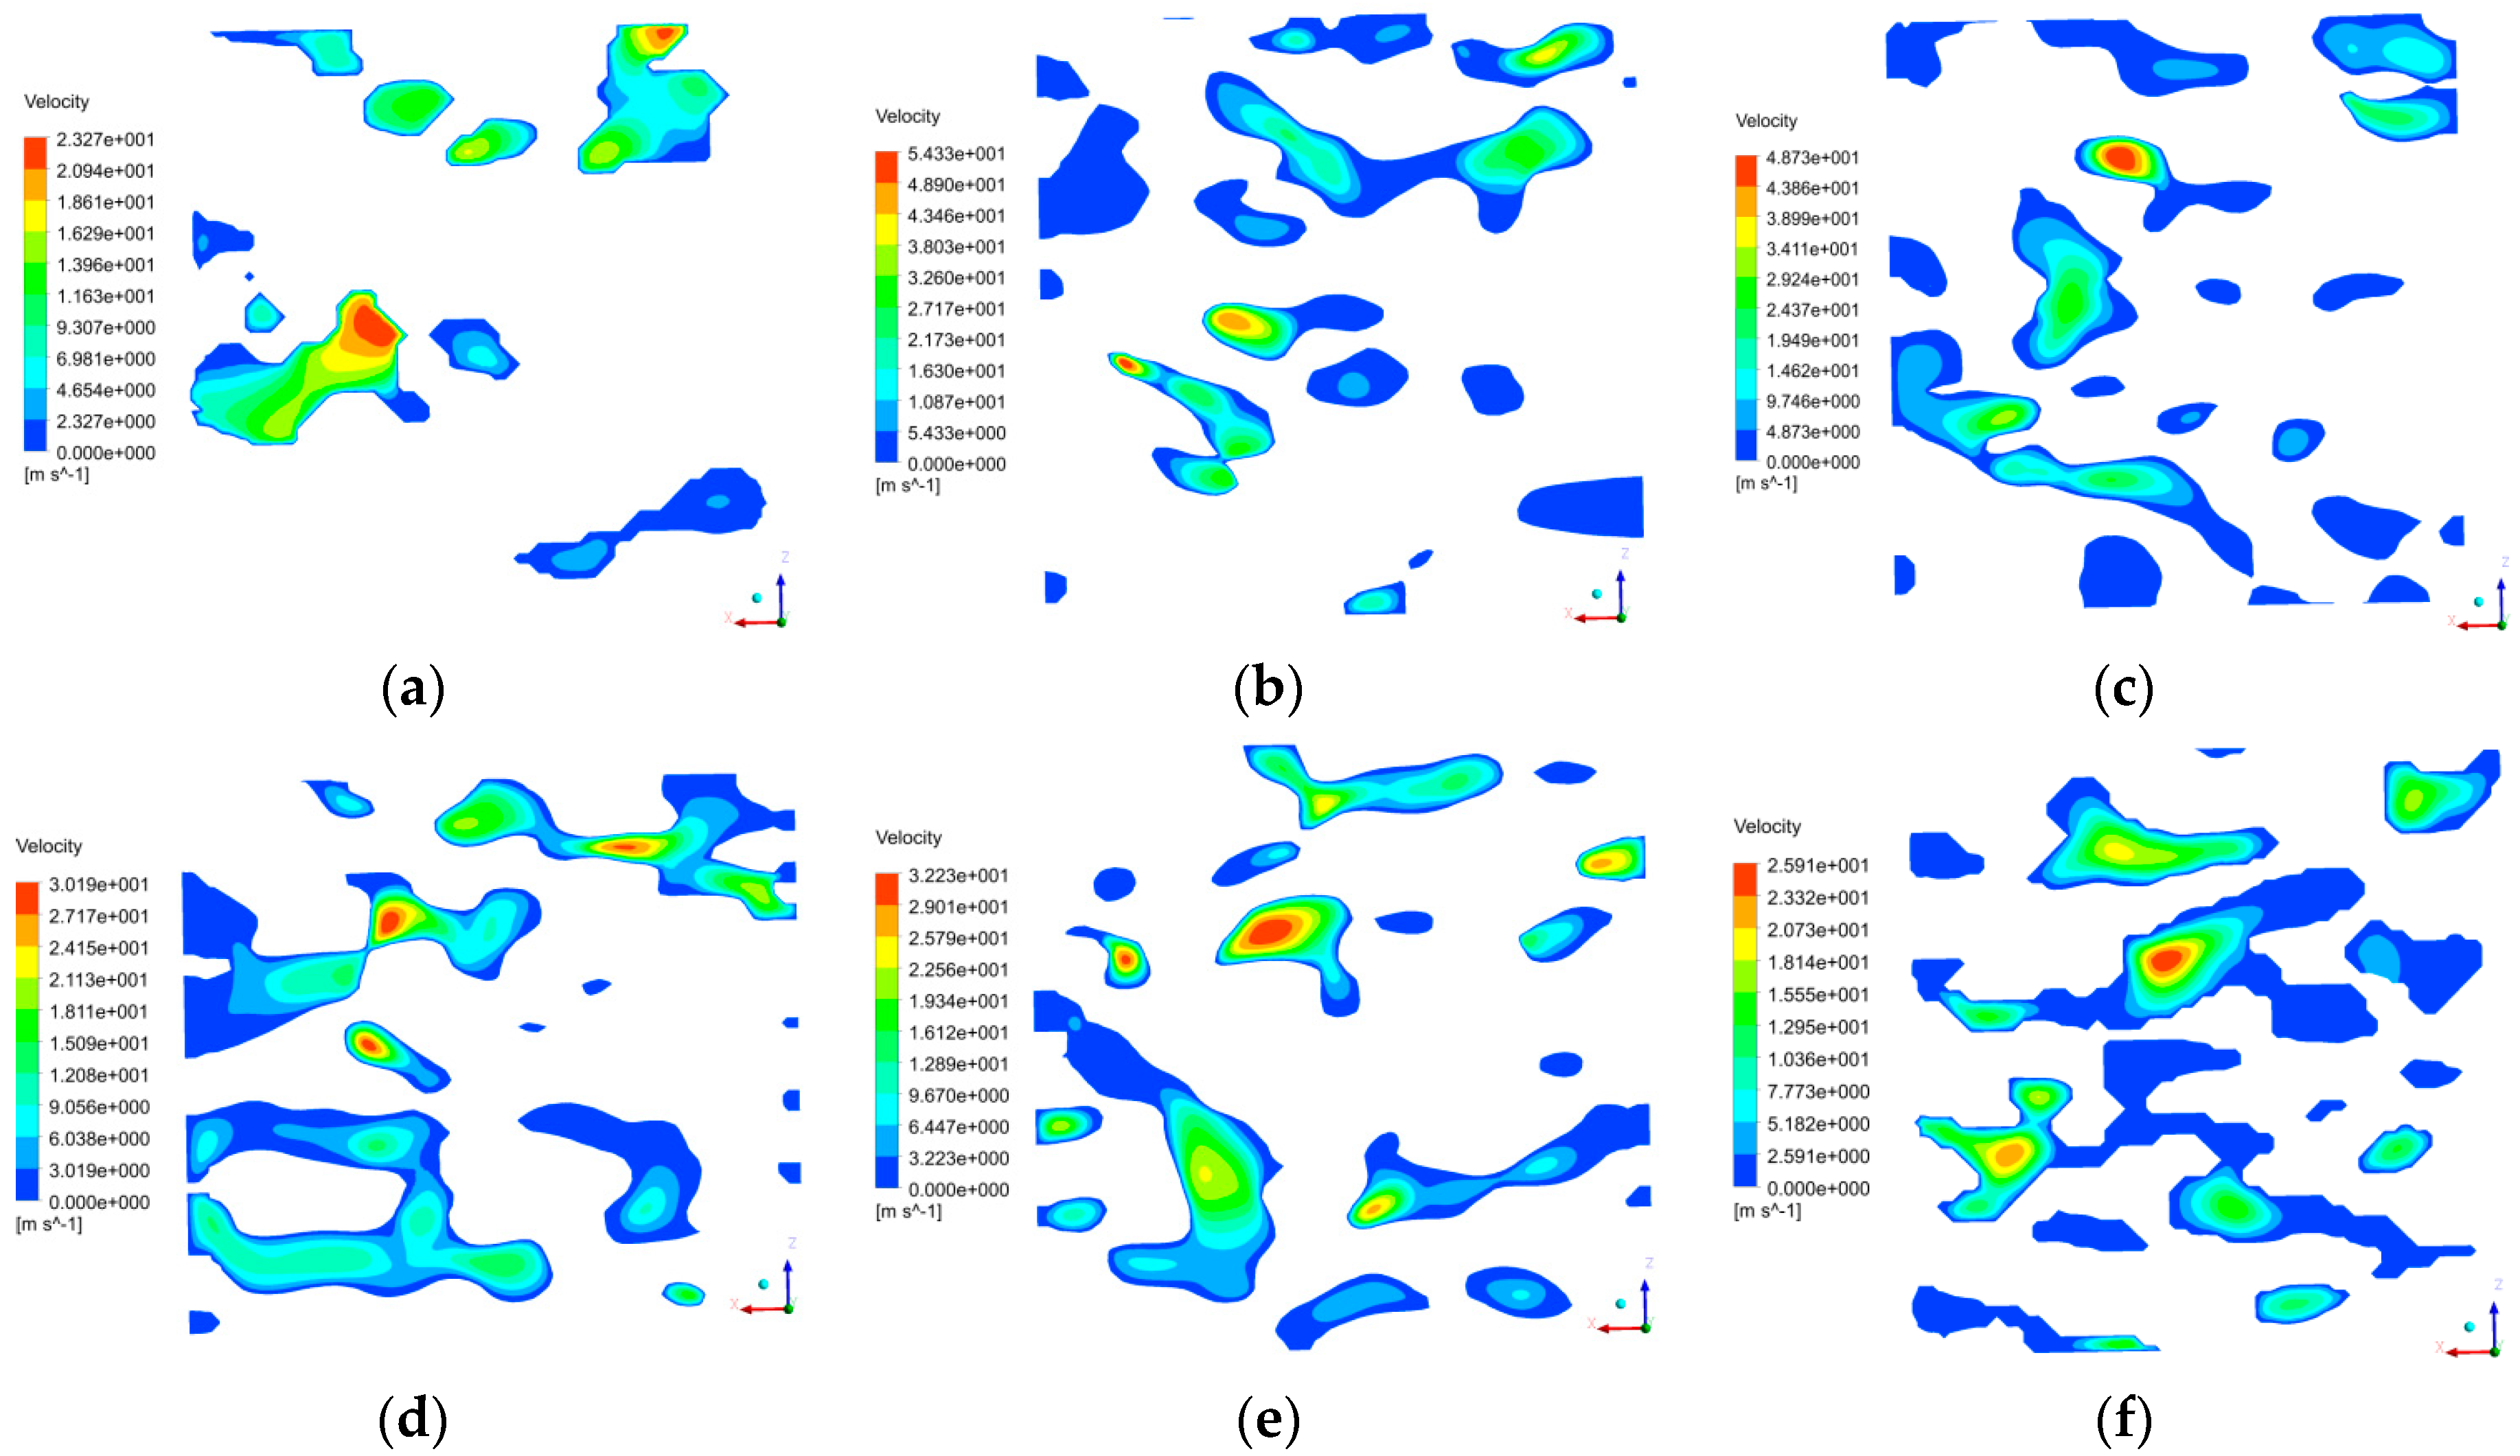
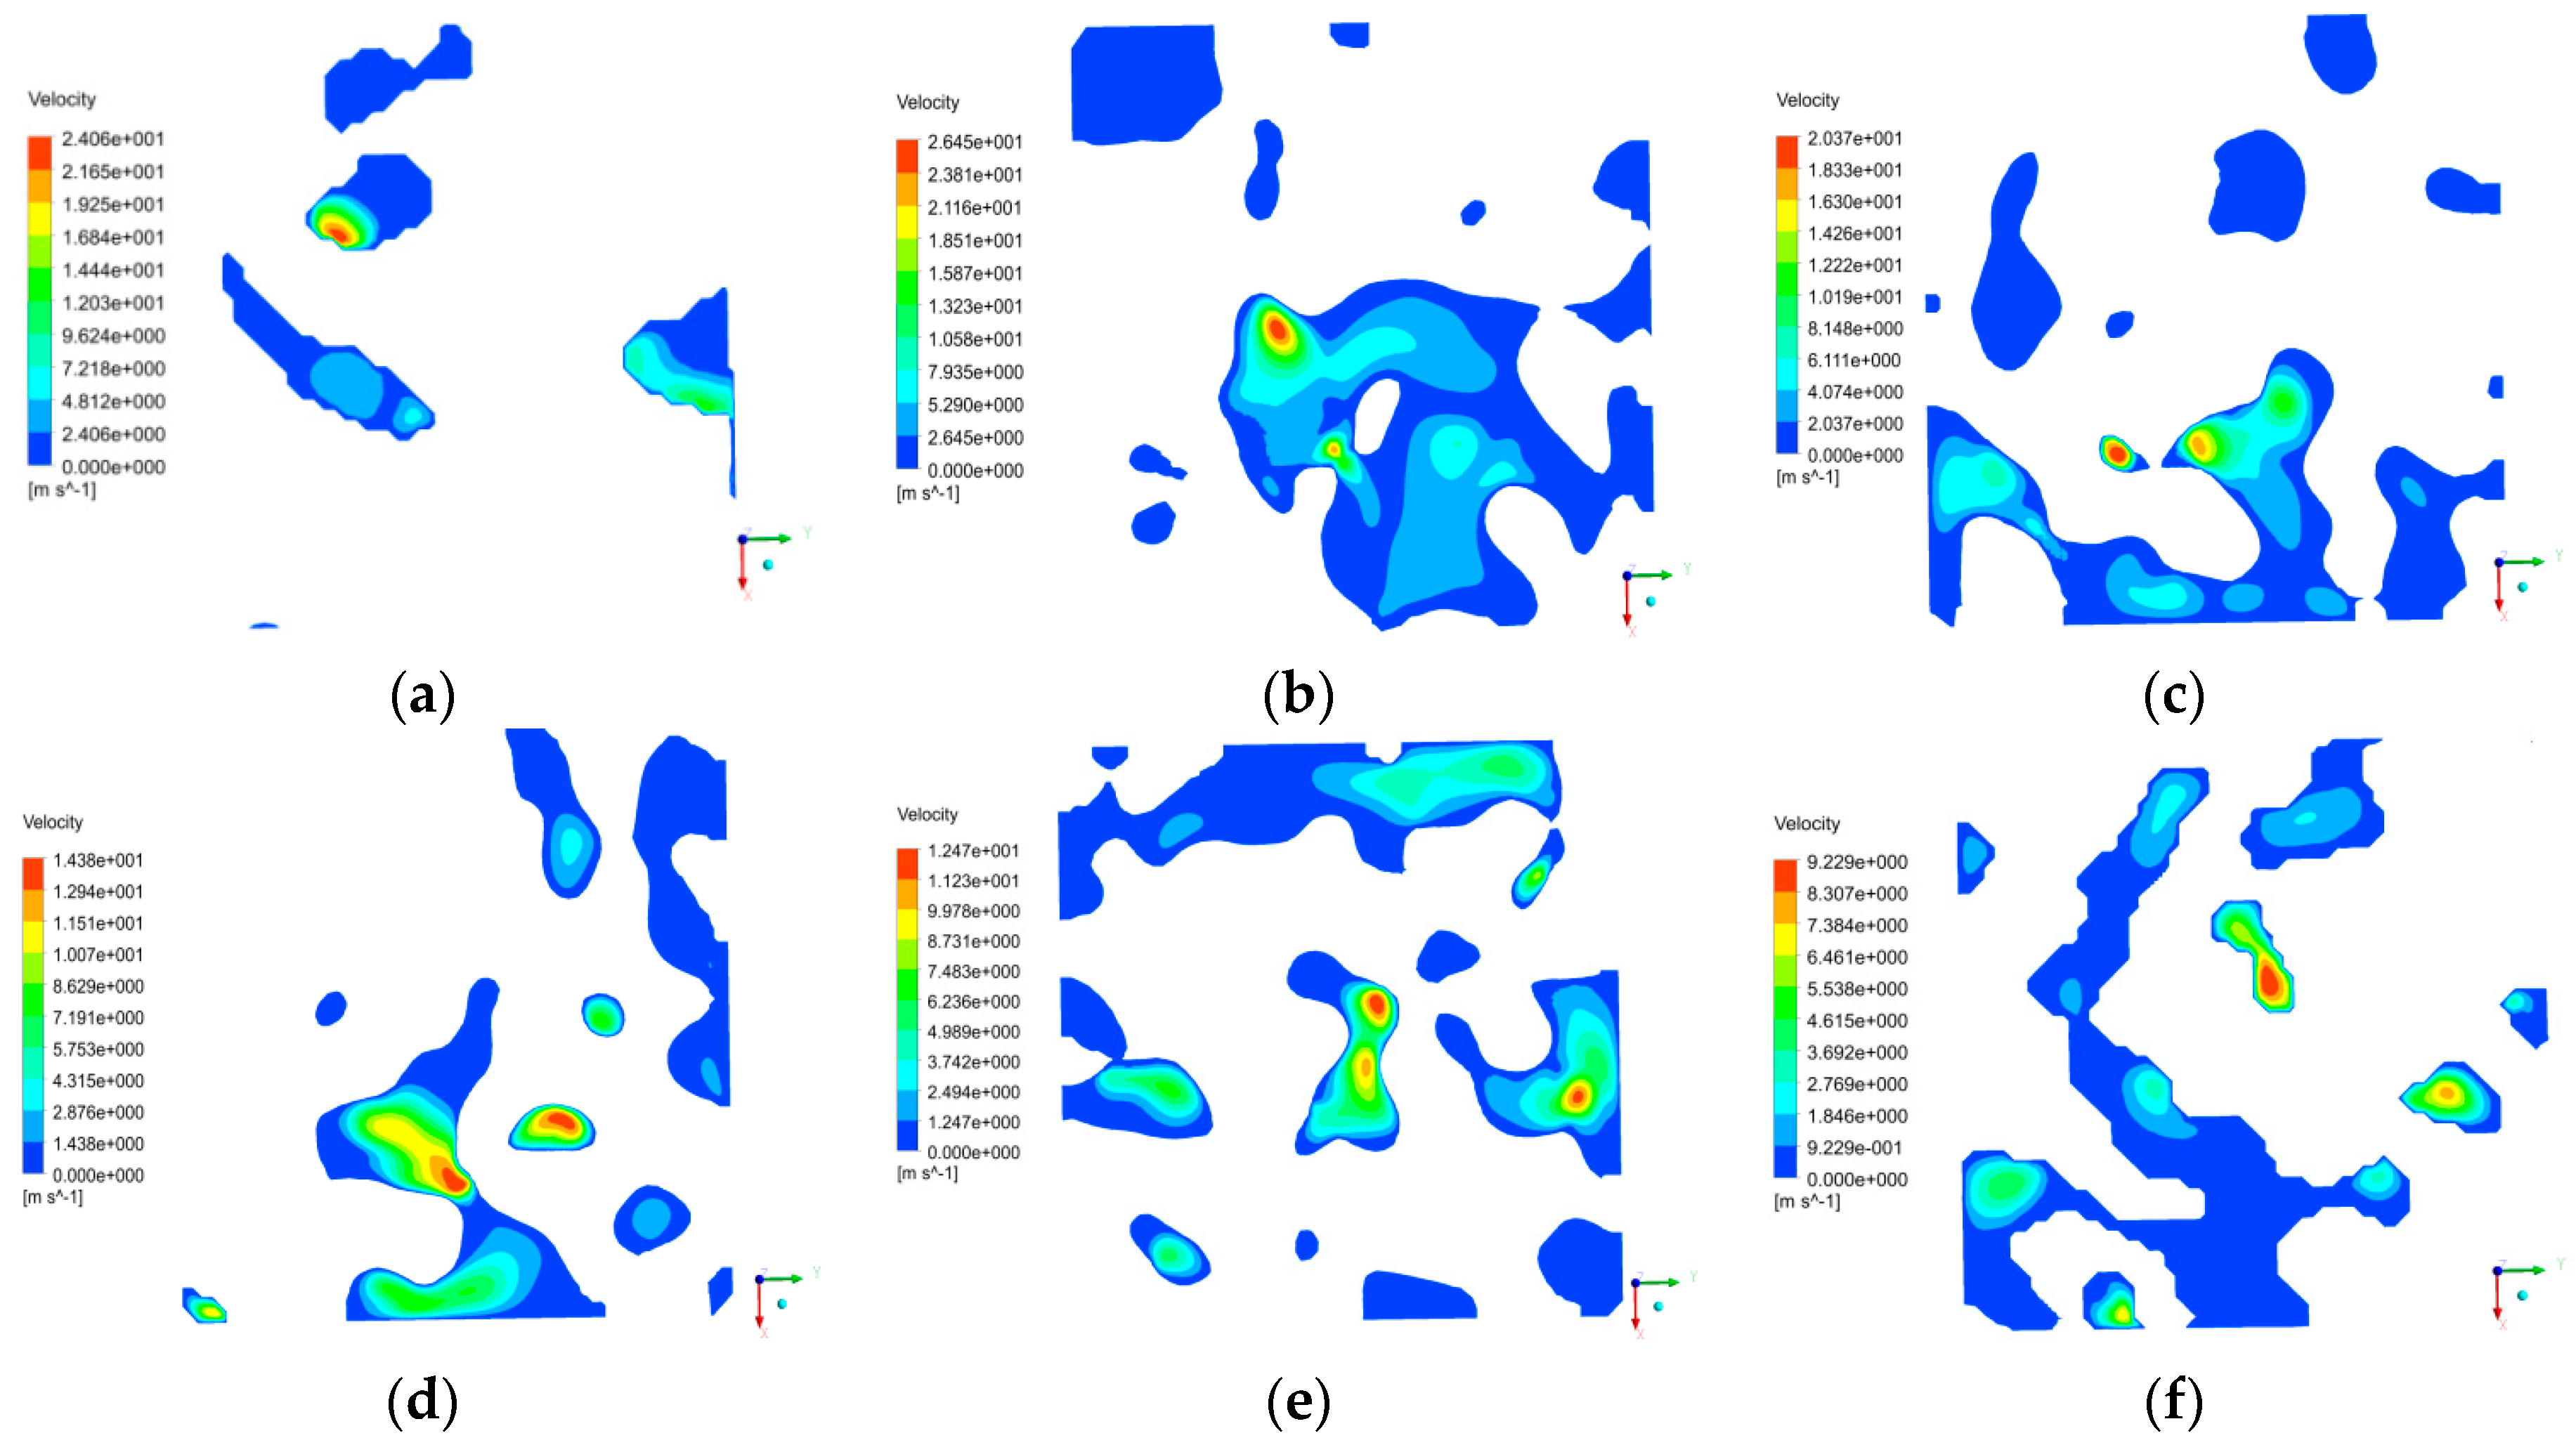
In terms of the seepage in a single pore channel, the seepage velocity of low-pressure water decreased in the direction from the pore center to pore wall until it became zero. In terms of the whole micro-pore structure, the maximum seepage velocity appeared in the center region where water seepage was fully developed. The maximum velocities of the single-channel water seepage in the X and Y directions were up to 75.3 and 64.4 m/s, respectively; in the Z direction, in spite of the gravity effect, the maximum seepage velocity still reached 39.2 m/s. Overall, at the micro-scale, the seepage velocity of low-pressure water in a single-channel was relatively large, with the minimum value near the pore wall where the low-pressure water passed through.
(3)
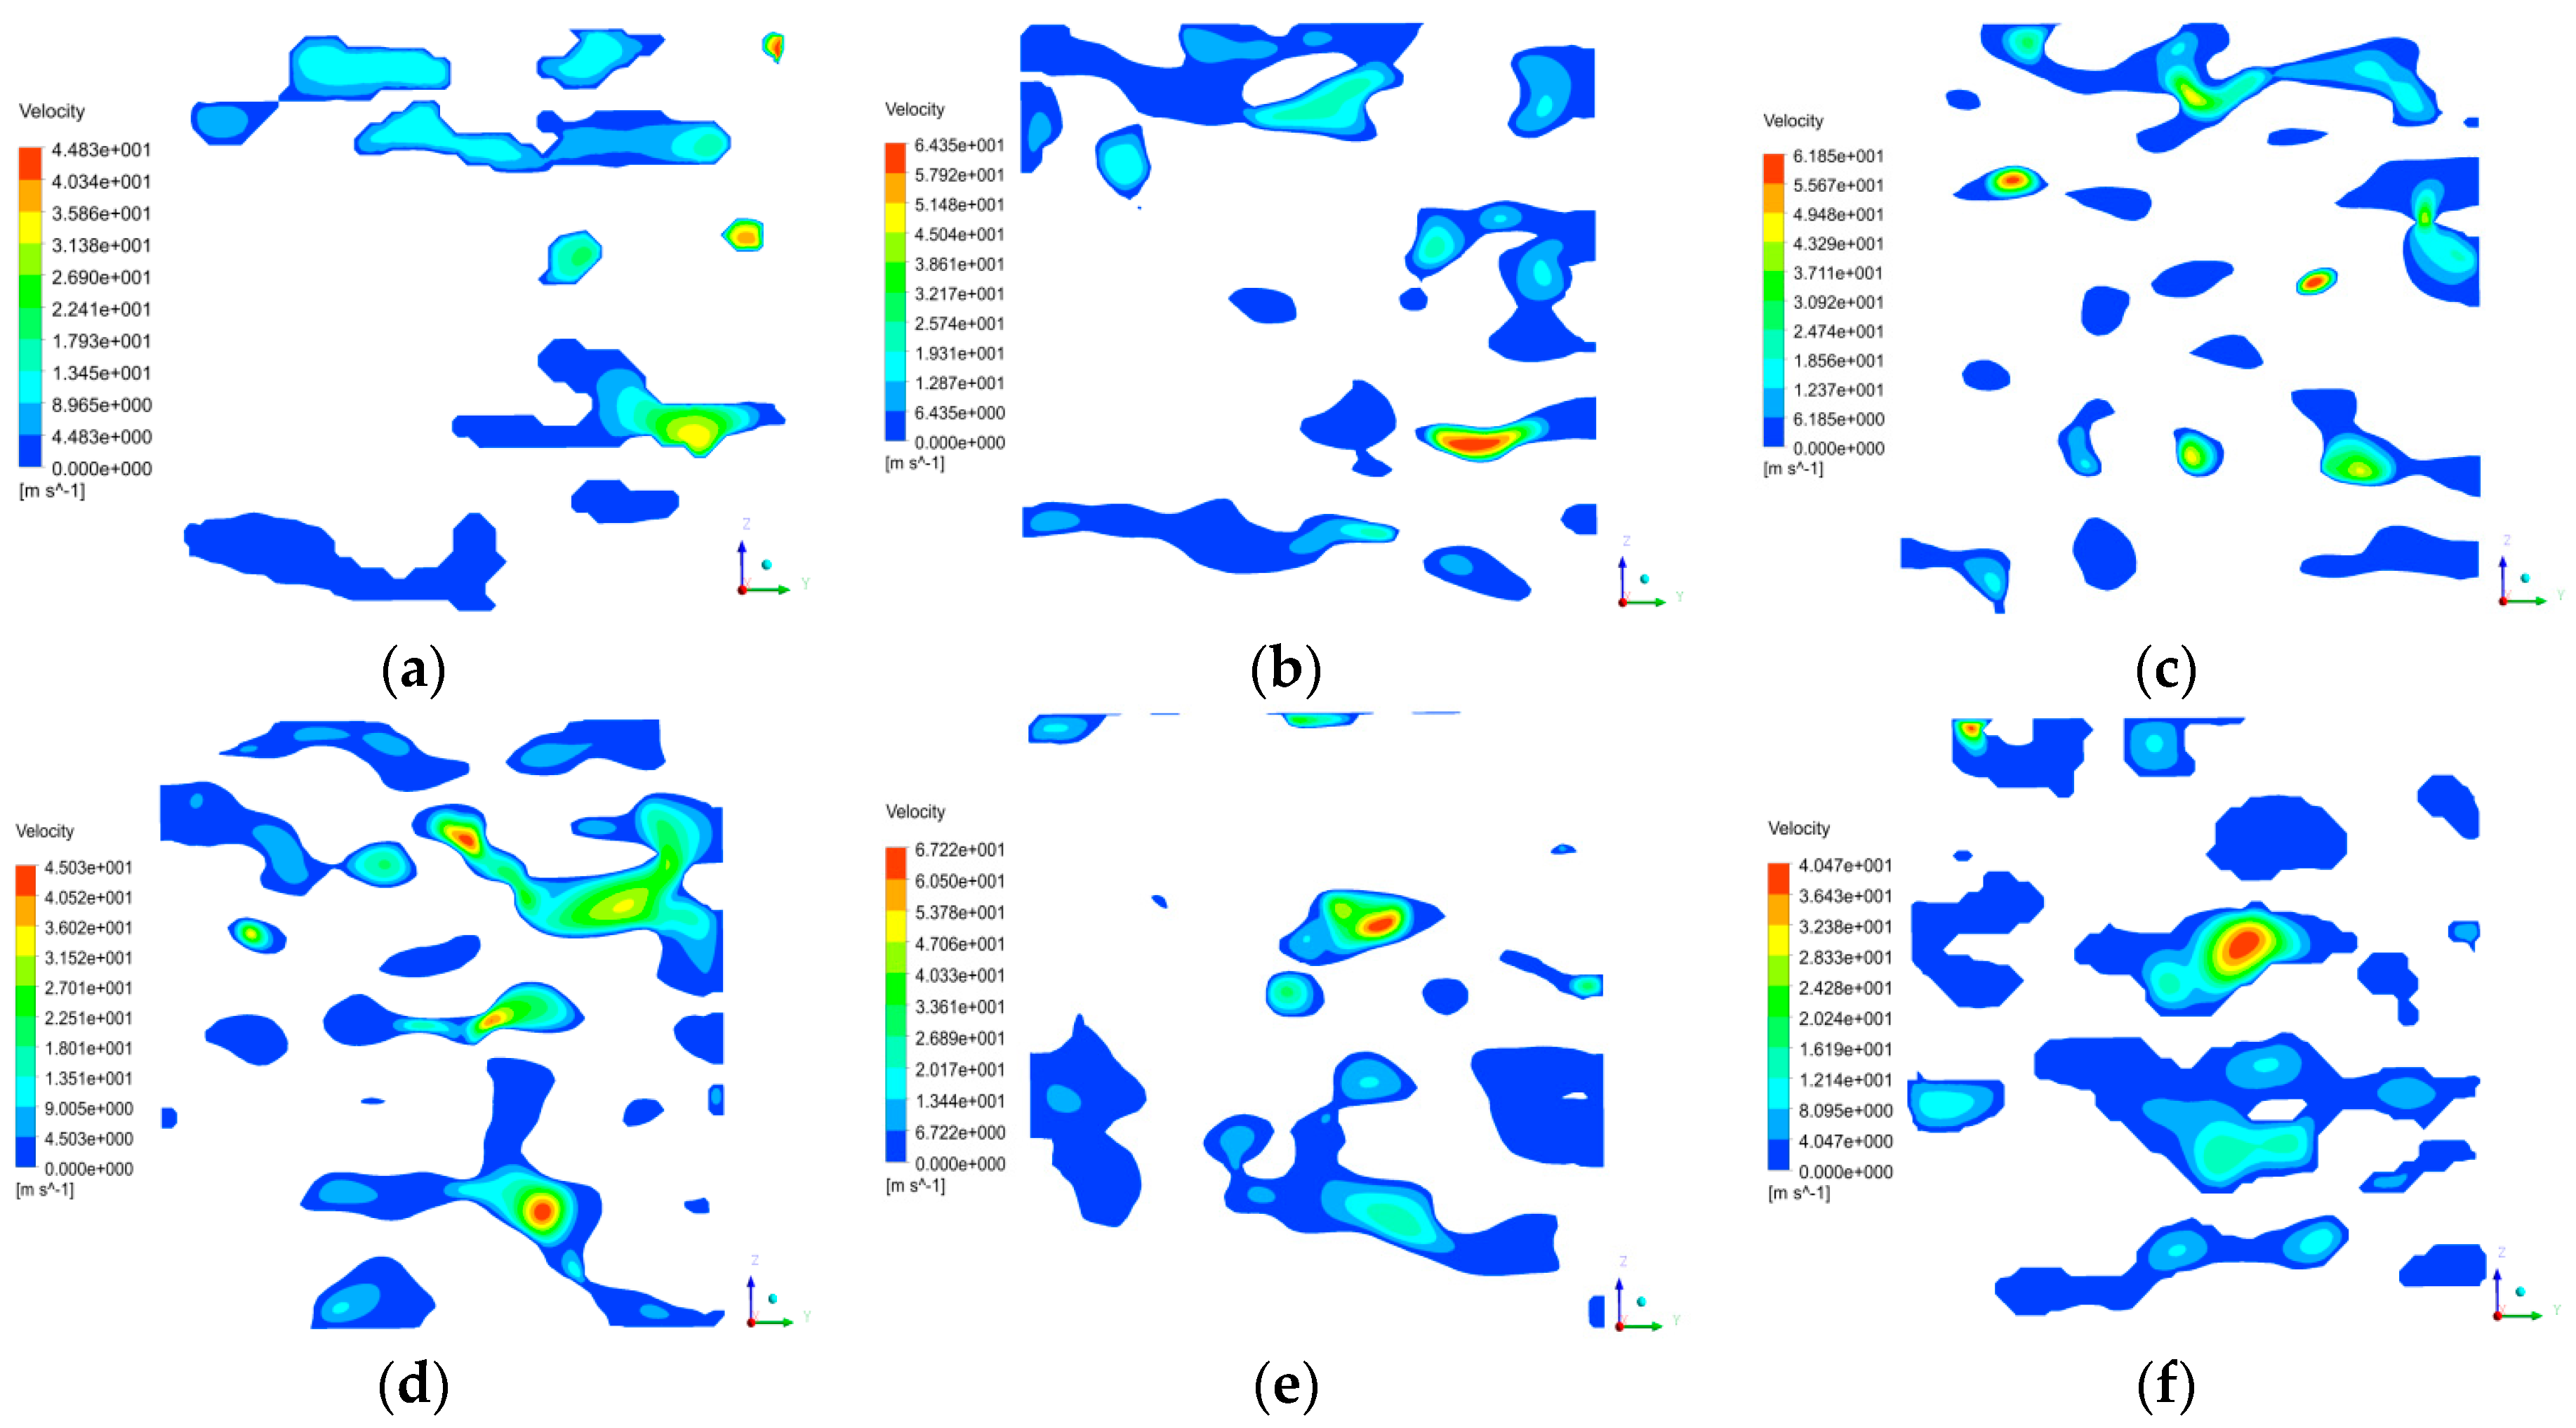
At different sections, the maximum seepage velocity appeared at the center of the small pore channel of the section where the water flowed. Moreover, the water seepage velocity increased as the pore radius and bending degree decreased.

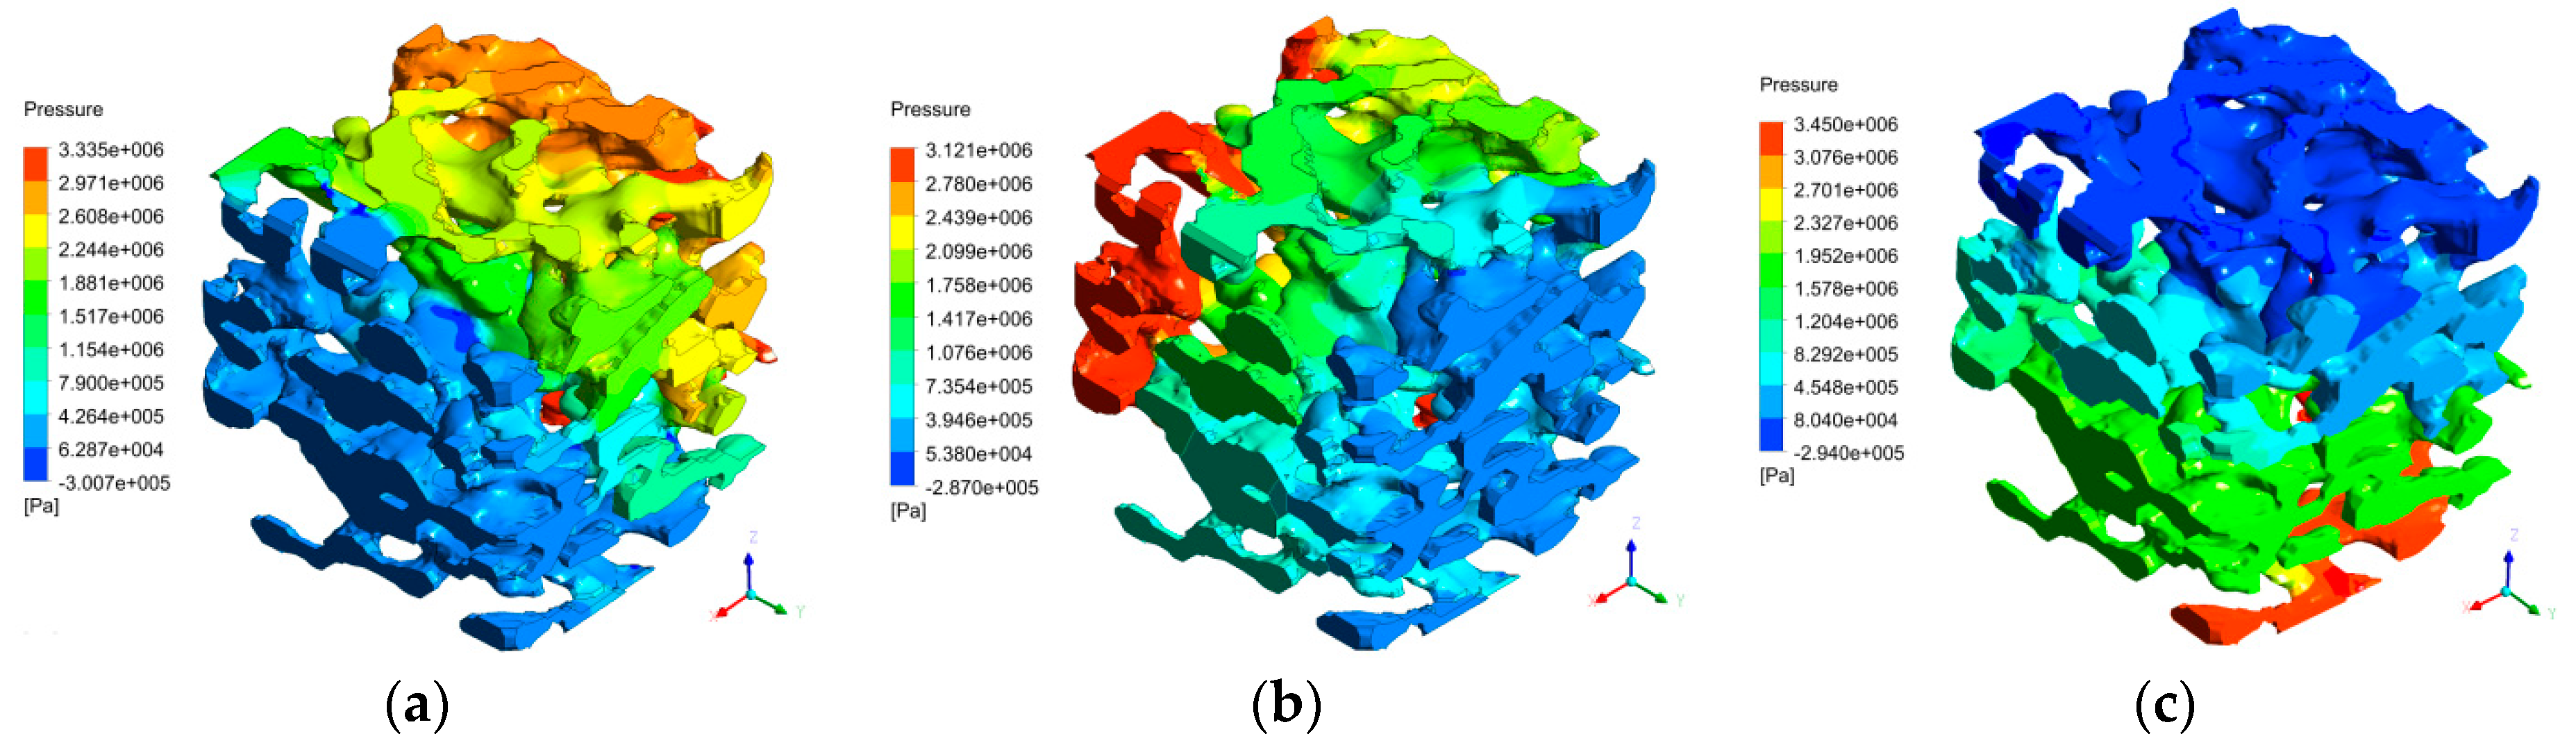
6.2. Pressure, Seepage Velocity, and Mass Flow Rate of Single-Channel Seepage at Different Sections

In order to gain an in-depth insight into the rules of single-channel water seepage in X, Y, and Z directions, several sections at different positions along the axes (i.e., x = 0, 6, 12, 18, 24, 30, 36, 42, 48, 54 and 60 μm; y = 0, 6, 12, 18, 24, 30, 36, 42, 48, 54 and 60 μm; and z = 0, 6, 12, 18, 24, 30, 36, 42, 48, 54 and 60 μm, respectively, in which x, y and z denote the distances from the inlet section) were selected for further analyses. Figure 15, Figure 16 and Figure 17 show the mean seepage pressure, mean seepage velocity, and mean mass flow rate at different sections.
As shown in Figure 15, the mean seepage pressure at different sections along different directions (X, Y, and Z) exhibited similar trend and range of variation, i.e., the average seepage pressure at each section decreased gradually as the distance from the seepage inlet section increased.
As shown in Figure 16, during the single-channel water seepage processes along the X, Y, and Z directions, the mean seepage velocity at each section gradually decreased as a whole, with the increase of the distance from the seepage inlet. However, at three different sections (i.e., 12–18 μm, 42–48 μm, and 48–54 μm, respectively), the mean seepage velocities exhibited obvious fluctuations. To be specific, in the X direction, the mean seepage velocity increased significantly at the 12–18 μm section, increased slightly at the 42–48 μm section, and decreased sharply at the 48–54 μm section; in the Y direction, the mean seepage velocity decreased notably at the 12–18 μm section, increased greatly at the 42–48 μm section, and decreased sharply in the 48–54 μm section; and in the Z direction, the mean seepage velocity decreased significantly in the 12–18 μm and 42–48 μm sections, and increased greatly in the 48–54 μm section. Through comparison and analysis, it can be concluded that the variation trend of seepage velocity in the Z direction was basically contrary to those in the other two directions. Additionally, the mean seepage velocity in the X direction was the largest, followed by that in the Y direction, and the mean seepage velocity in the Z direction was the smallest, which can also reflect the local difference in permeability.
As shown in Figure 17, the mean mass flow rate during the single-channel seepage processes in the X, Y, and Z directions reached the maxima at the inlet, then decreased gradually, and finally stabilized. The variation trend of mean mass flow rate was similar to that of mean seepage velocity. The mean mass flow rate decreased as a whole; moreover, the mean mass flow rate in the X direction was the largest, followed by the Y direction, and the mean mass flow rate in the Z direction was the smallest. In the Z direction, the mean seepage velocity and mean mass flow rate were influenced by gravity to a great extent.

6.3. Numerical Simulation on Seepage Characteristics of Dual-Channel and Multi-Channel Seepage

Firstly, we should explain the meanings of dual-channel and multi-channel seepages. The former refers to the water injection along the positive directions of X and Y simultaneously and the latter refers to the water injection along the positive directions of X, Y, and Z simultaneously. In this study, the direction of dual-channel is denoted as (X + Y) while the direction of multi-channel is denoted as (X + Y + Z), respectively.
Numerical simulation was performed to further investigate the dual-channel and multi-channel seepage characteristics of low-pressure water in the coal at micro-scale. X and Y directions (i.e., the positive direction of (X + Y)) were both selected for dual-channel simulation while the X, Y, and Z directions (i.e., the positive direction of (X + Y + Z)) were all selected for multi-channel simulation. Figure 18 and Figure 19 display the flow conditions and velocity distribution of dual-channel and multi-channel seepage.
As shown in Figure 18, compared with the results in single-channel water seepage in the direction of X or Y, the seepage velocity of low-pressure water in dual-channel water seepage in the direction of (X + Y) increased significantly, with the maximum seepage velocity up to 89.6 m/s. Due to the effect of water pressure in Y direction, 92.36% of water flow that entered the coal sample in the X direction would flow through the pressure outlet in Y direction. Similarly, due to the effect of water pressure in the X direction, 90.17% of water flow that entered the coal sample in the Y direction would flow through the pressure outlet in the X direction.
As shown in Figure 19, compared with the simulation results of single-channel water seepage in X, Y, or Z directions, the seepage velocity of low-pressure water in multi-channels in the direction of (X + Y + Z) increased significantly, with the maximum seepage velocity up to 140.2 m/s. Due to the effect of water pressure in the Y and Z directions, 97.29% of water flow that entered the coal sample in the X direction would flow through the pressure outlet in the Y and Z directions. Similarly, due to the effect of water pressure in the X and Z directions, 95.24% of water flow that entered the coal sample in the Y direction would flow through the pressure outlet in the X and Z directions. Due to the effects of gravity and water pressure in the X and Y directions, most of the water flow that entered the coal sample in Z direction would exit from the pressure outlets in the X and Y directions after it flows just a certain distance in the Z direction.
Compared with the results in dual-channel water seepage along the direction of (X + Y), the seepage paths and velocities in multi-channel water seepage along the direction of (X + Y + Z) exhibited significant differences. Due to the effect of water pressure in Z direction, the paths of multi-channel seepage in X and Y directions were significantly shortened compared with the dual-channel seepage path in the direction of (X + Y), but the overall seepage velocities along their respective directions were multiplied compared with the dual-channel seepage velocity in the direction of (X + Y). For example, the maximum seepage velocity in the X and Y directions increased from 89.6 m/s in dual-channel seepage by 1.56 times up to 140.2 m/s in multi-channel seepage.

7. Conclusions

The present study focused on the long-frame coal sample collected from the Daliuta Coal Mine, which was scanned by a high-precision X-ray 3D microscope to obtain 3D data. With the use of Avizo, an advanced 3D visualization software, the digital coal body model with actual pore structure characteristics was constructed. Then, the preprocessing and postprocessing functions in ICEM CFD software allowed the model generated by Avizo to be conveniently processed in CFX, a multi-field coupling finite element software. Accordingly, the numerical simulation on single-channel and multi-channel seepage of low-pressure water in coal micro-pore structures was conducted. The following conclusions were drawn.
(1)
The micro-pore structure model of the digital coal body in the present study had the actual size of 60 μm × 60 μm × 60 μm and contained a total of 219 pores in it. The micro-pore model of the coal had a maximum pore radius of 4.36 μm, a maximum pore volume of 3336 μm3, a mean pore radius of 1.17 μm, a mean pore volume of 124.23 μm3, a bulk porosity of 15.47%, a throat number of 311, a maximum throat radius of 2.77 μm, a mean throat radius of 0.62 μm, a maximum throat length of 13.89 μm, a mean throat length of 2.32 μm, a maximum pore-to-throat ratio of 20.50, a mean pore-to-throat ratio of 2.08, a maximum throat volume of 518 μm3, and a mean throat volume of 14.67 μm3.
(2)
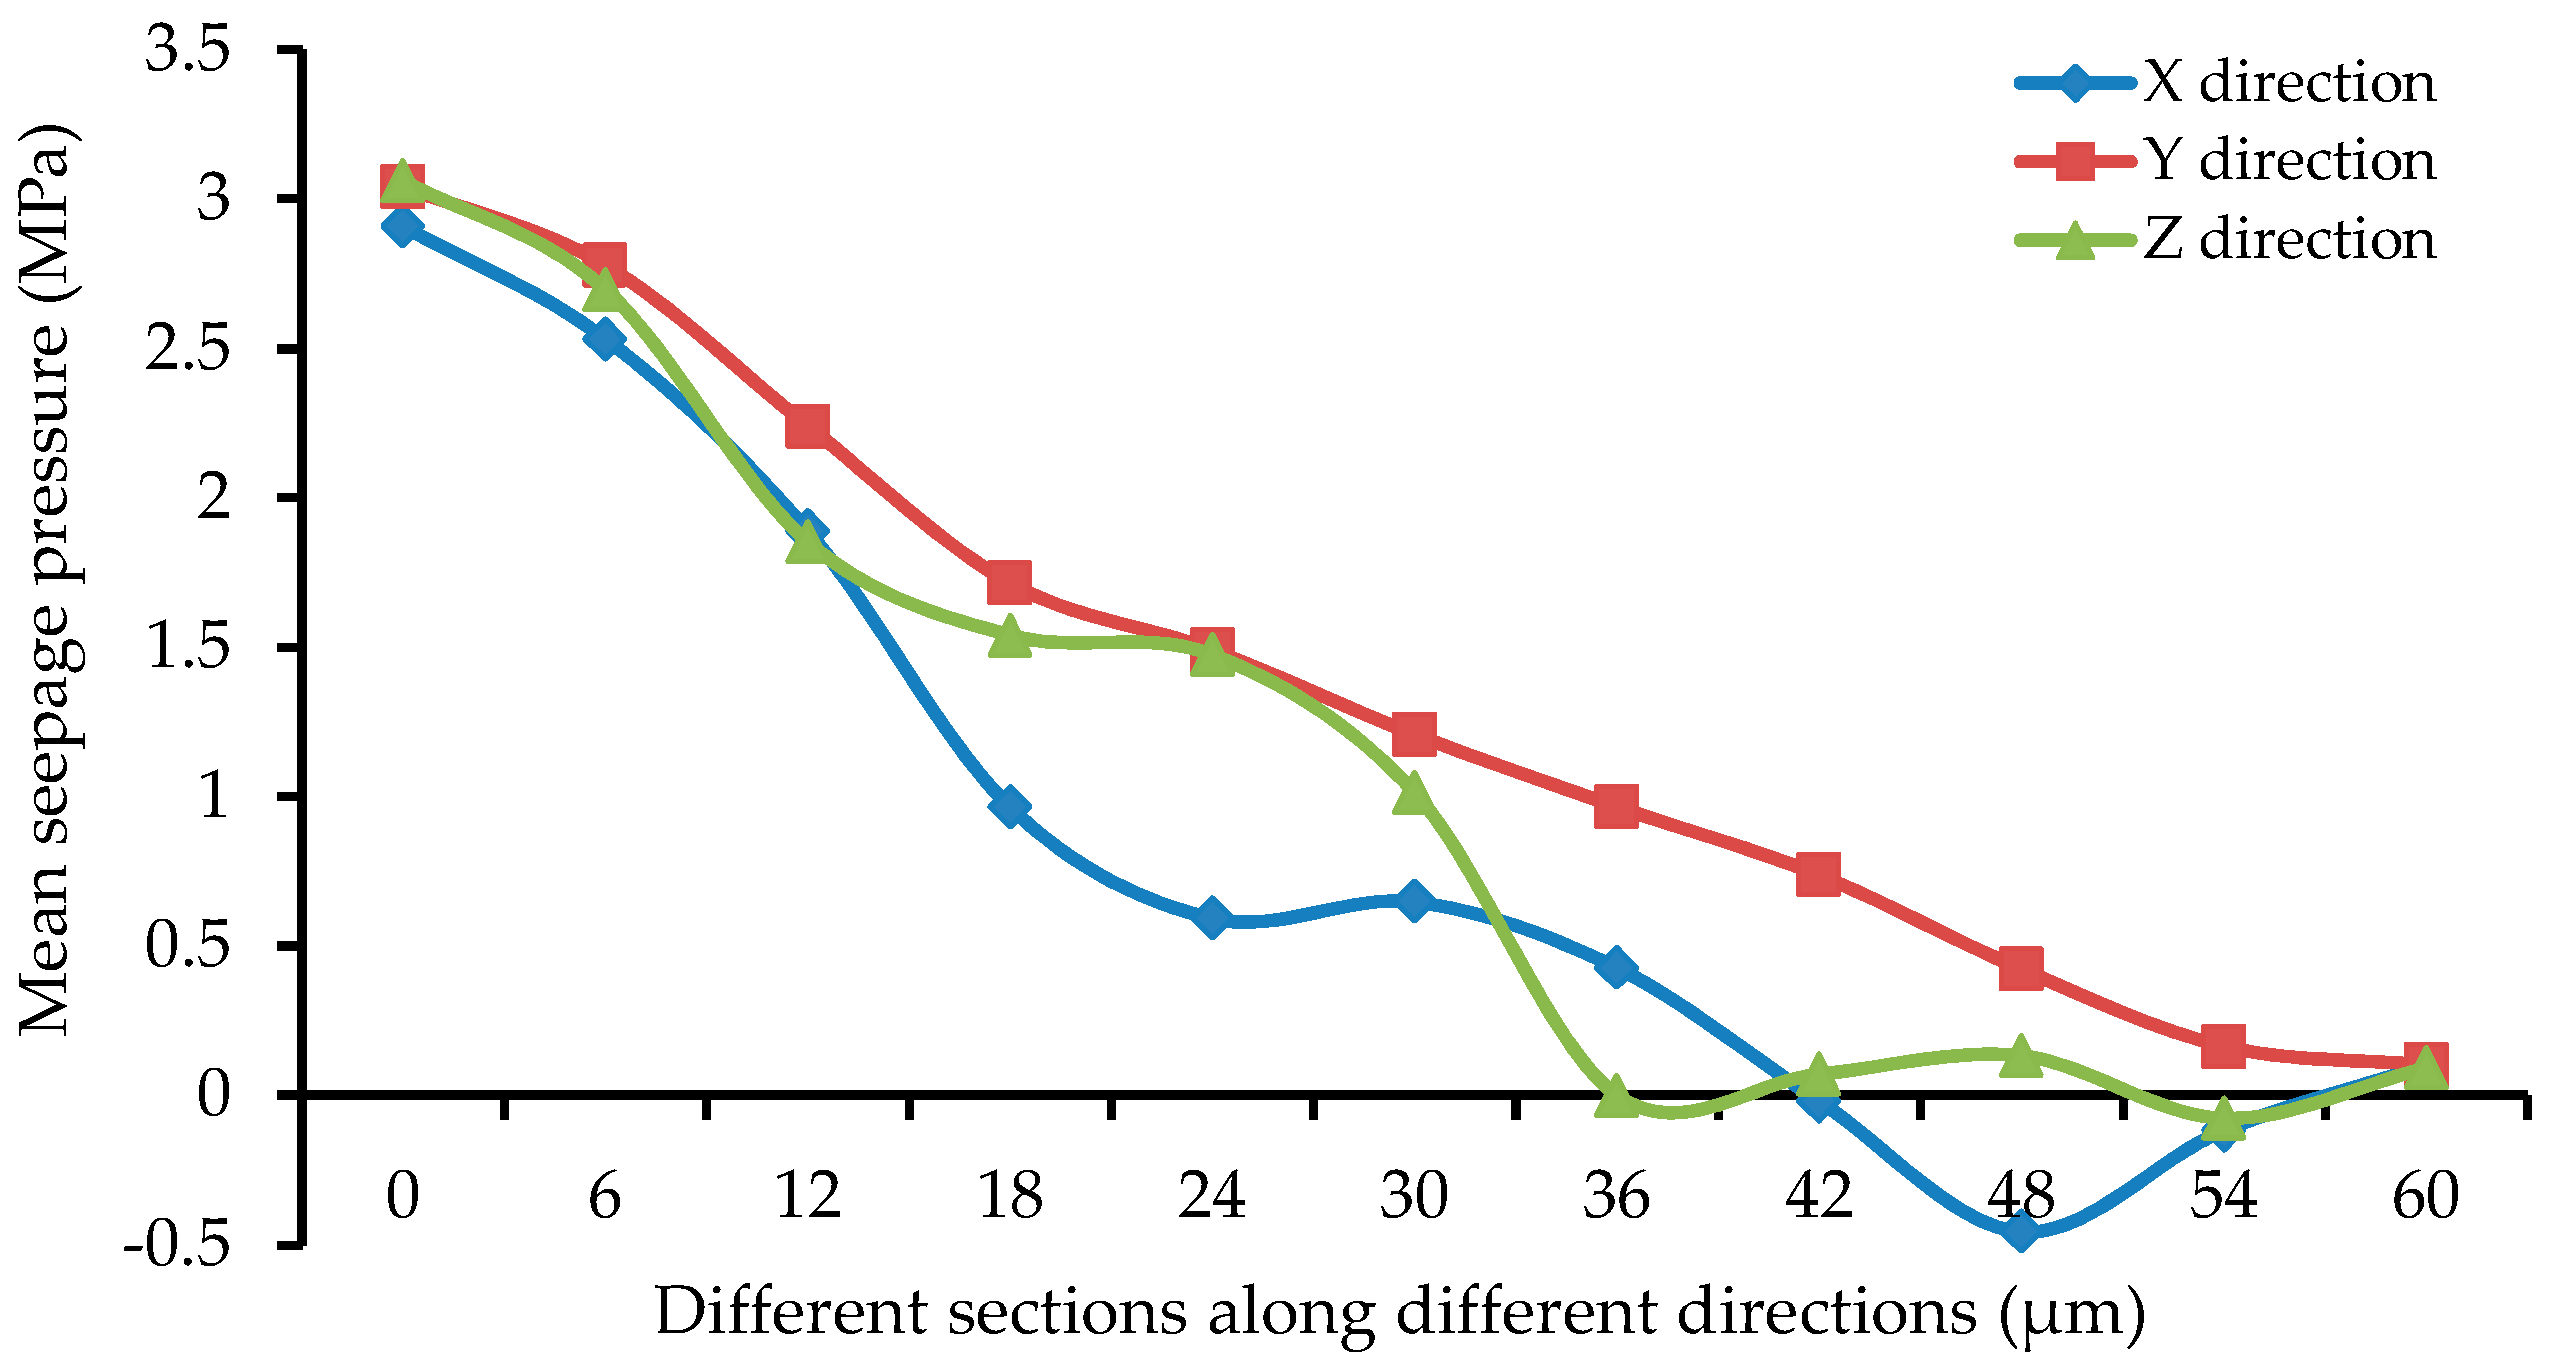
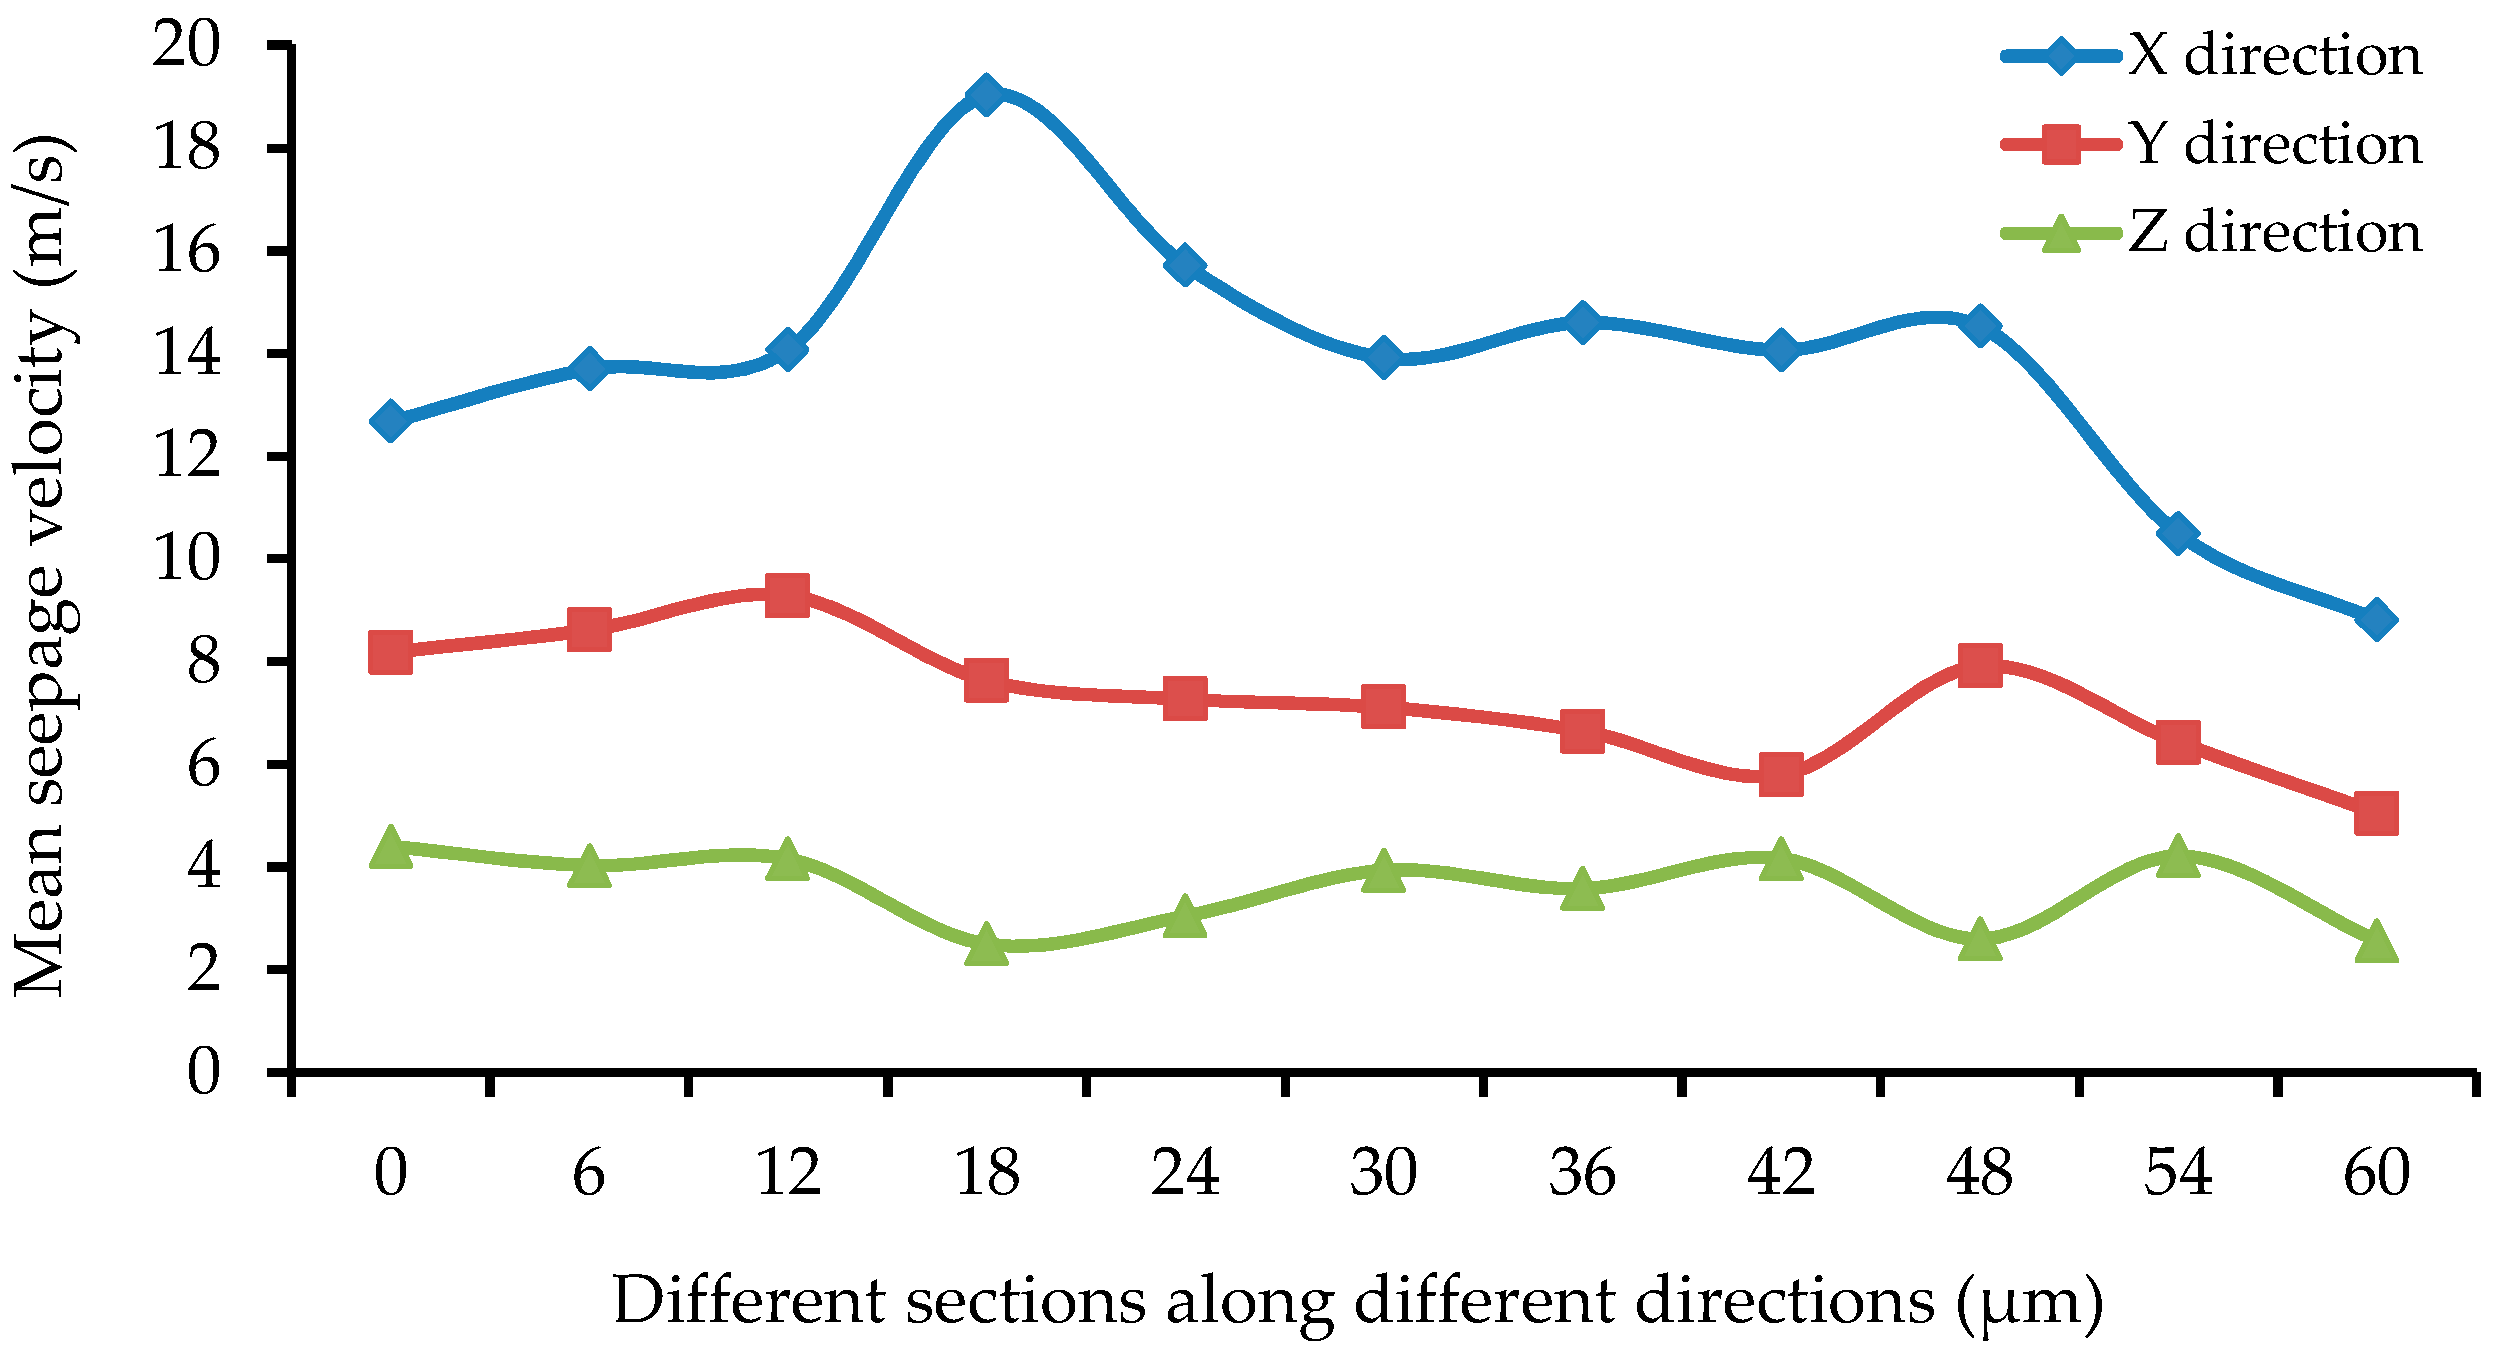
During the seepage process of low-pressure water, the water flow did not pass through each path uniformly, but preferentially passed through the paths with large pore radii, short paths, and short distances from the outlet. In terms of a single pore channel, the seepage velocity of low-pressure water decreased gradually along the direction from the pore center to pore wall; in terms of the overall micro-pore structure, the maximum seepage velocity appeared at the center of small pore channel in the coal center region where the water flow was fully developed. For single-channel seepage in different directions, the seepage pressure decreased gradually along the direction of water seepage; moreover, the mean seepage velocity and mass flow rate of the seepage in the X direction were the largest, followed by those in the Y direction, and the mean seepage velocity and mass flow rate of the seepage in the Z direction were the smallest. At the micro-scale, the seepage velocities of low-pressure water in the dual-channel seepage in the direction of (X + Y) and the multi-channel seepage in the direction of (X + Y + Z) were greatly enhanced compared with the velocity in single-channel seepage. Due to the effects of the seepage water pressure and different numbers of channels in different directions, the dual-channel and multi-channel seepage characteristics of low-pressure water exhibited great changes and complex variation rules compared with the characteristics of single-channel seepage.
(3)
Using the software of Avizo, the related pore and throat data of the coal micro-pore structure model were extracted, and the coal micro-pore structure model could be converted into a geometric model in CAD format. The geometric model was then imported to many types of finite element and discrete element software, such as CFX, COMSOL, and EDEM for numerical simulations. Meanwhile, using 3D printing technology, we can use the coal powders to prepare the samples that can reflect the coal’s actual micro-pore structure for experimental investigation. The present study provides a new idea and a novel way to investigate the seepage rules in the micro-pore structure of coal. It also casts light on exploring the stress and strain analysis, as well as discrete element analysis of the micro-structure of coal.

Acknowledgments

This work was financially supported by State Key Program of National Natural Science of China (Grant No. U1261205); National Natural Science Foundation of China (Grant No. 51474139); SDUST Research Fund (Grant No. 2014JQJH106); China Postdoctoral Science Foundation Funded Special Project (Grant No. 2016T90642); China Postdoctoral Science Foundation Funded Project (Grant No. 2015M570602); Open Fund of the Key Laboratory of Coal Mine Gas and Fire Prevention and Control of Ministry of Education (Grant No. 2015KJZX02); Science and Technology Project of Huangdao District, Qingdao (Grant No. 2014-1-30); Qingdao Postdoctoral Applied Research Project (Grant No. 2015194); Open Fund of the Key Laboratory of Safety and High-Efficiency Coal Mining of Ministry of Education (Grant No. JYBSYS2014105); The Key Technology Projects of Chinese State Administration of Work Safety for Preventing Major Safety Production Accidents (Grant No. Shandong-0083-2015AQ).

Author Contributions

Gang Zhou and Qi Zhang conceived and designed the experiments; Ruonan Bai and Guanhua Ni performed the experiments; Gang Zhou and Qi Zhang analyzed the data; Gang Zhou contributed reagents/materials/analysis tools.

Conflicts of Interest

The authors declare no conflict of interest.

Abbreviations

The following abbreviations are used in this manuscript:
CTComputerized Tomography
FEIField Electron and Ion Co.
CFXANSYS CFX Software
X-CTX-Ray Computed Tomography
SODthe Distance between the X-Ray Source and the Detector
ODDthe Distance between the Stage Sample and the Detector
MRTMagnetic Resonance Tomography
ICEM CFDANSYS ICEM CFD Software
CFDComputational Fluid Dynamics
CADComputer Aided Design
LBMLattice Boltzmann Method
SDUSTShandong University of Science and Technology

Nomenclature

μlinear attenuation coefficient
I0incident intensity
Iintensity of ray attenuated by the object
xdistance(m)
amass percentage
plogarithm of the ratio of input intensity to output intensity

References

  1. Yang, Z.; Yao, W.L.; Ma, L.Z.; Wise, L. Pore structure characteristics of the relative water-resisting layer on the top of the ordovician in longgu coal mine. Int. J. Min. Sci. Technol. 2014, 24, 657–661. [Google Scholar]
  2. Geet, M.V.; Swennen, R.; David, P. Quantitative coal characterisation by means of microfocus X-ray computer tomography, colour image analysis and back-scattered scanning electron microscopy. Int. J. Coal Geol. 2001, 46, 11–25. [Google Scholar] [CrossRef]
  3. Simons, F.J.; Verhelst, F. Quantitative characterization of coal by means of micro focal X-ray computed microtomography (CMT) and color image analysis (CIA). Int. J. Coal Geol. 1997, 34, 69–88. [Google Scholar] [CrossRef]
  4. Mazumder, S.; Wolf, K.H.A.A.; Elewaut, K.; Ephraim, R. Application of X-ray computed tomography for analyzing cleat spacing and cleat aperture in coal samples. Int. J. Coal Geol. 2006, 65, 205–222. [Google Scholar] [CrossRef]
  5. Golab, A.; Ward, C.R.; Permana, A.; Lennox, P.; Botha, P. High-resolution three-dimensional imaging of coal using microfocus X-ray computed tomography, with special reference to modes of mineral occurrence. Int. J. Coal Geol. 2013, 113, 97–108. [Google Scholar] [CrossRef]
  6. Karacan, C.O.; Okandan, E. Adsorption and gas transport in coal microstructure: Investigation and evaluation by quantitative X-ray CT imaging. Fuel 2001, 80, 509–520. [Google Scholar] [CrossRef]
  7. Mathews, J.P.; Pone, J.D.N.; Mitchell, G.D.; Halleck, P. High-resolution X-ray computed tomography observations of the thermal drying of lump-sized subbituminous coal. Fuel Process. Technol. 2011, 92, 58–64. [Google Scholar] [CrossRef]
  8. Meng, Q.R.; Zhao, Y.S.; Hu, Y.Q.; Feng, Z.C.; Yu, Y.M. Experimental study on pore structure and pore shape of coking coal. J. China Coal Soc. 2011, 36, 487–490. [Google Scholar]
  9. Yao, Y.B.; Liu, D.M.; Cai, Y.D.; Li, J.Q. Advanced characterization of pores and fractures in coals by nuclear magnetic resonance and X-ray computed tomography. Sci. China Earth Sci. 2010, 53, 854–862. [Google Scholar] [CrossRef]
  10. Song, X.X.; Tang, Y.G.; Li, W.; Feng, Z.C.; Kang, Z.Q.; Li, Y.J.; Xiang, J.H. Advanced characterization of seepage pores in deformed coals based on micro-CT. J. China Coal Soc. 2013, 38, 435–440. [Google Scholar]
  11. Coles, M.E.; Hazlett, R.D.; Spanne, P.; Jones, K.W. Pore level imaging of fluid transport using synchrotron X-ray microtomography. J. Pet. Sci. Eng. 1998, 19, 55–63. [Google Scholar] [CrossRef]
  12. Stauffer, D.; Aharony, A. Introduction to Percolation Theory; Taylor and Francis Press: London, UK, 1994. [Google Scholar]
  13. Teng, G.R.; Tan, Y.L.; Gao, M. Simulation of gas seepage in fissured coal based on lattice boltzmann method. Chin. J. Rock Mech. Eng. 2007, 36, 3503–3508. [Google Scholar]
  14. Jin, Y.; Zhu, Y.B.; Wu, Y.; Zheng, J.L.; Dong, J.B.; Li, X. Numerical investigation of migration mechanism for coal-bed methane flow through cleats with rough surfaces in coal reservoir. J. China Coal Soc. 2014, 39, 1826–1834. [Google Scholar]
  15. Liu, Y.; Li, S.H.; Liu, X.Y. Coupled fluid flow and stress computation model of dual media based on continuum-medium distinct element method. Chin. J. Rock Mech. Eng. 2011, 30, 951. [Google Scholar]
  16. Perera, M.S.A.; Ranjith, P.G.; Choi, S.K.; Bouazza, A.; Kodikara, J.; Airey, D. A review of coal properties pertinent to carbon dioxide sequestration in coal seams: With special reference to victorian brown coals. Environ. Earth Sci. 2011, 64, 223–235. [Google Scholar] [CrossRef]
  17. Ritman, E.L. Molecular imaging in small animals-roles for micro-CT. J. Cell. Biochem. 2002, 87, 116–124. [Google Scholar] [CrossRef] [PubMed]
  18. Badea, C.T.; Drangova, M.; Holdsworth, D.W.; Johnson, G.A. In vivo small-animal imaging using micro-CT and digital subtraction angiography. Phys. Med. Biol. 2008, 53, 319–350. [Google Scholar] [CrossRef] [PubMed]
  19. Ritman, E.L. Micro-computed tomography—Current status and developments. Annu. Rev. Biomed. Eng. 2004, 6, 185–208. [Google Scholar] [CrossRef] [PubMed]
  20. Li, J.; Zhu, D.S.; Bao, S.L. The technology and application in biomedicine micro-CT. Mod. Instrum. 2009, 15, 19–23. [Google Scholar]
  21. Xu, Y.; Zou, J.; Yao, S.Y. 3D X-ray microscope and its typical applications. CT Theory Appl. 2014, 23, 967–977. [Google Scholar]
  22. Rong, H.R.; Bai, H.B. Concealed fault analysis based on the CT projection matrix. Int. J. Min. Sci. Technol. 2016, 26, 361–367. [Google Scholar]
Figure 1. X-ray 3D microscope (NanoVoxel-2000).
Minerals 06 00078 g001
Figure 2. Diameter measurement of the ore core.
Minerals 06 00078 g002
Figure 3. Profile image of the reconstructed 3D model: (a) Four-View; (b) 512th layer profile on the XY plane; and (c) 420th layer profile on the ZY plane.
Minerals 06 00078 g003
Figure 4. Component distribution.
Minerals 06 00078 g004
Figure 5. Original Pore image.
Minerals 06 00078 g005
Figure 6. Pore image after processing.
Minerals 06 00078 g006
Figure 7. Data cube selected in the reconstructed digital coal body.
Minerals 06 00078 g007
Figure 8. Model of micro-pore structure: (a) Before the optimization; and (b) after the optimization.
Minerals 06 00078 g008
Figure 9. Optimization of coal micro-pore model and mesh generation on the ICEM platform:(a) Repair on the micro-pore structure model; (b) segmentation of islands; (c) deletion of islands;(d) establishment of topological structure; (e) setting of the import and export conditions; and (f) mesh generation.
Minerals 06 00078 g009
Figure 10. Distributions of pressure subject to low-pressure water along a single-channel in X, Y, and Z directions: (a) X direction; (b) Y direction; and (c) Z direction.
Minerals 06 00078 g010
Figure 11. Distributions of seepage velocity subject to low-pressure water along single-channel in X, Y, and Z directions: (a) X direction; (b) Y direction; and (c) Z direction.
Minerals 06 00078 g011
Figure 12. Water seepage velocity distribution of different sections of the single channel in the X direction: (a) x = 0 μm; (b) x = 12 μm; (c) x = 24 μm; (d) x = 36 μm; (e) x = 48 μm; and (f) x = 60 μm.
Minerals 06 00078 g012
Figure 13. Water seepage velocity distribution of different sections of the single channel in the Y direction: (a) x = 0 μm; (b) x = 12 μm; (c) x = 24 μm; (d) x = 36 μm; (e) x = 48 μm; and (f) x = 60 μm.
Minerals 06 00078 g013
Figure 14. Water seepage velocity distribution of different sections of the single channel in the Z direction: (a) x = 0 μm; (b) x = 12 μm; (c) x = 24 μm; (d) x = 36 μm; (e) x = 48 μm; and (f) x= 60 μm.
Minerals 06 00078 g014
Figure 15. Mean pressure at different cross-sections.
Minerals 06 00078 g015
Figure 16. Mean seepage velocity at different cross-sections.
Minerals 06 00078 g016
Figure 17. Mean mass flow at different cross-sections.
Minerals 06 00078 g017
Figure 18. Seepage velocity distribution of dual-channels in the X and Y directions: (a) X direction; and (b) Y direction.
Minerals 06 00078 g018
Figure 19. Seepage velocity distribution of multi-channel in the X, Y, and Z directions: (a) X direction; (b) Y direction; and (c) Z direction.
Minerals 06 00078 g019
Table 1. Setting of scanning parameters of X-ray 3D microscope.
DetectorSOD/ODD (mm/mm)Voltage (kV)Electric Current (μA)Scanning FrameTime (h)Exposure Time (s)Penetration Rate (%)
20×35/1341240900196557
Table 2. Quantitative analysis results of the throat size.
Number of ThroatsMaximum Throat Radius (μm)Mean Throat Radius (μm)Maximum Throat Length (μm)Mean Throat Length (μm)Maximum Pore-Throat RatioMean Pore-Throat RatioMaximum Throat Volume (μm3)Mean Throat Volume (μm3)
3112.770.6213.892.3220.502.0851814.67

