
Marine Phosphorites as Potential Resources for Heavy Rare Earth Elements and Yttrium

 ,
,
Abstract
:
1. Introduction
2. Samples and Methods
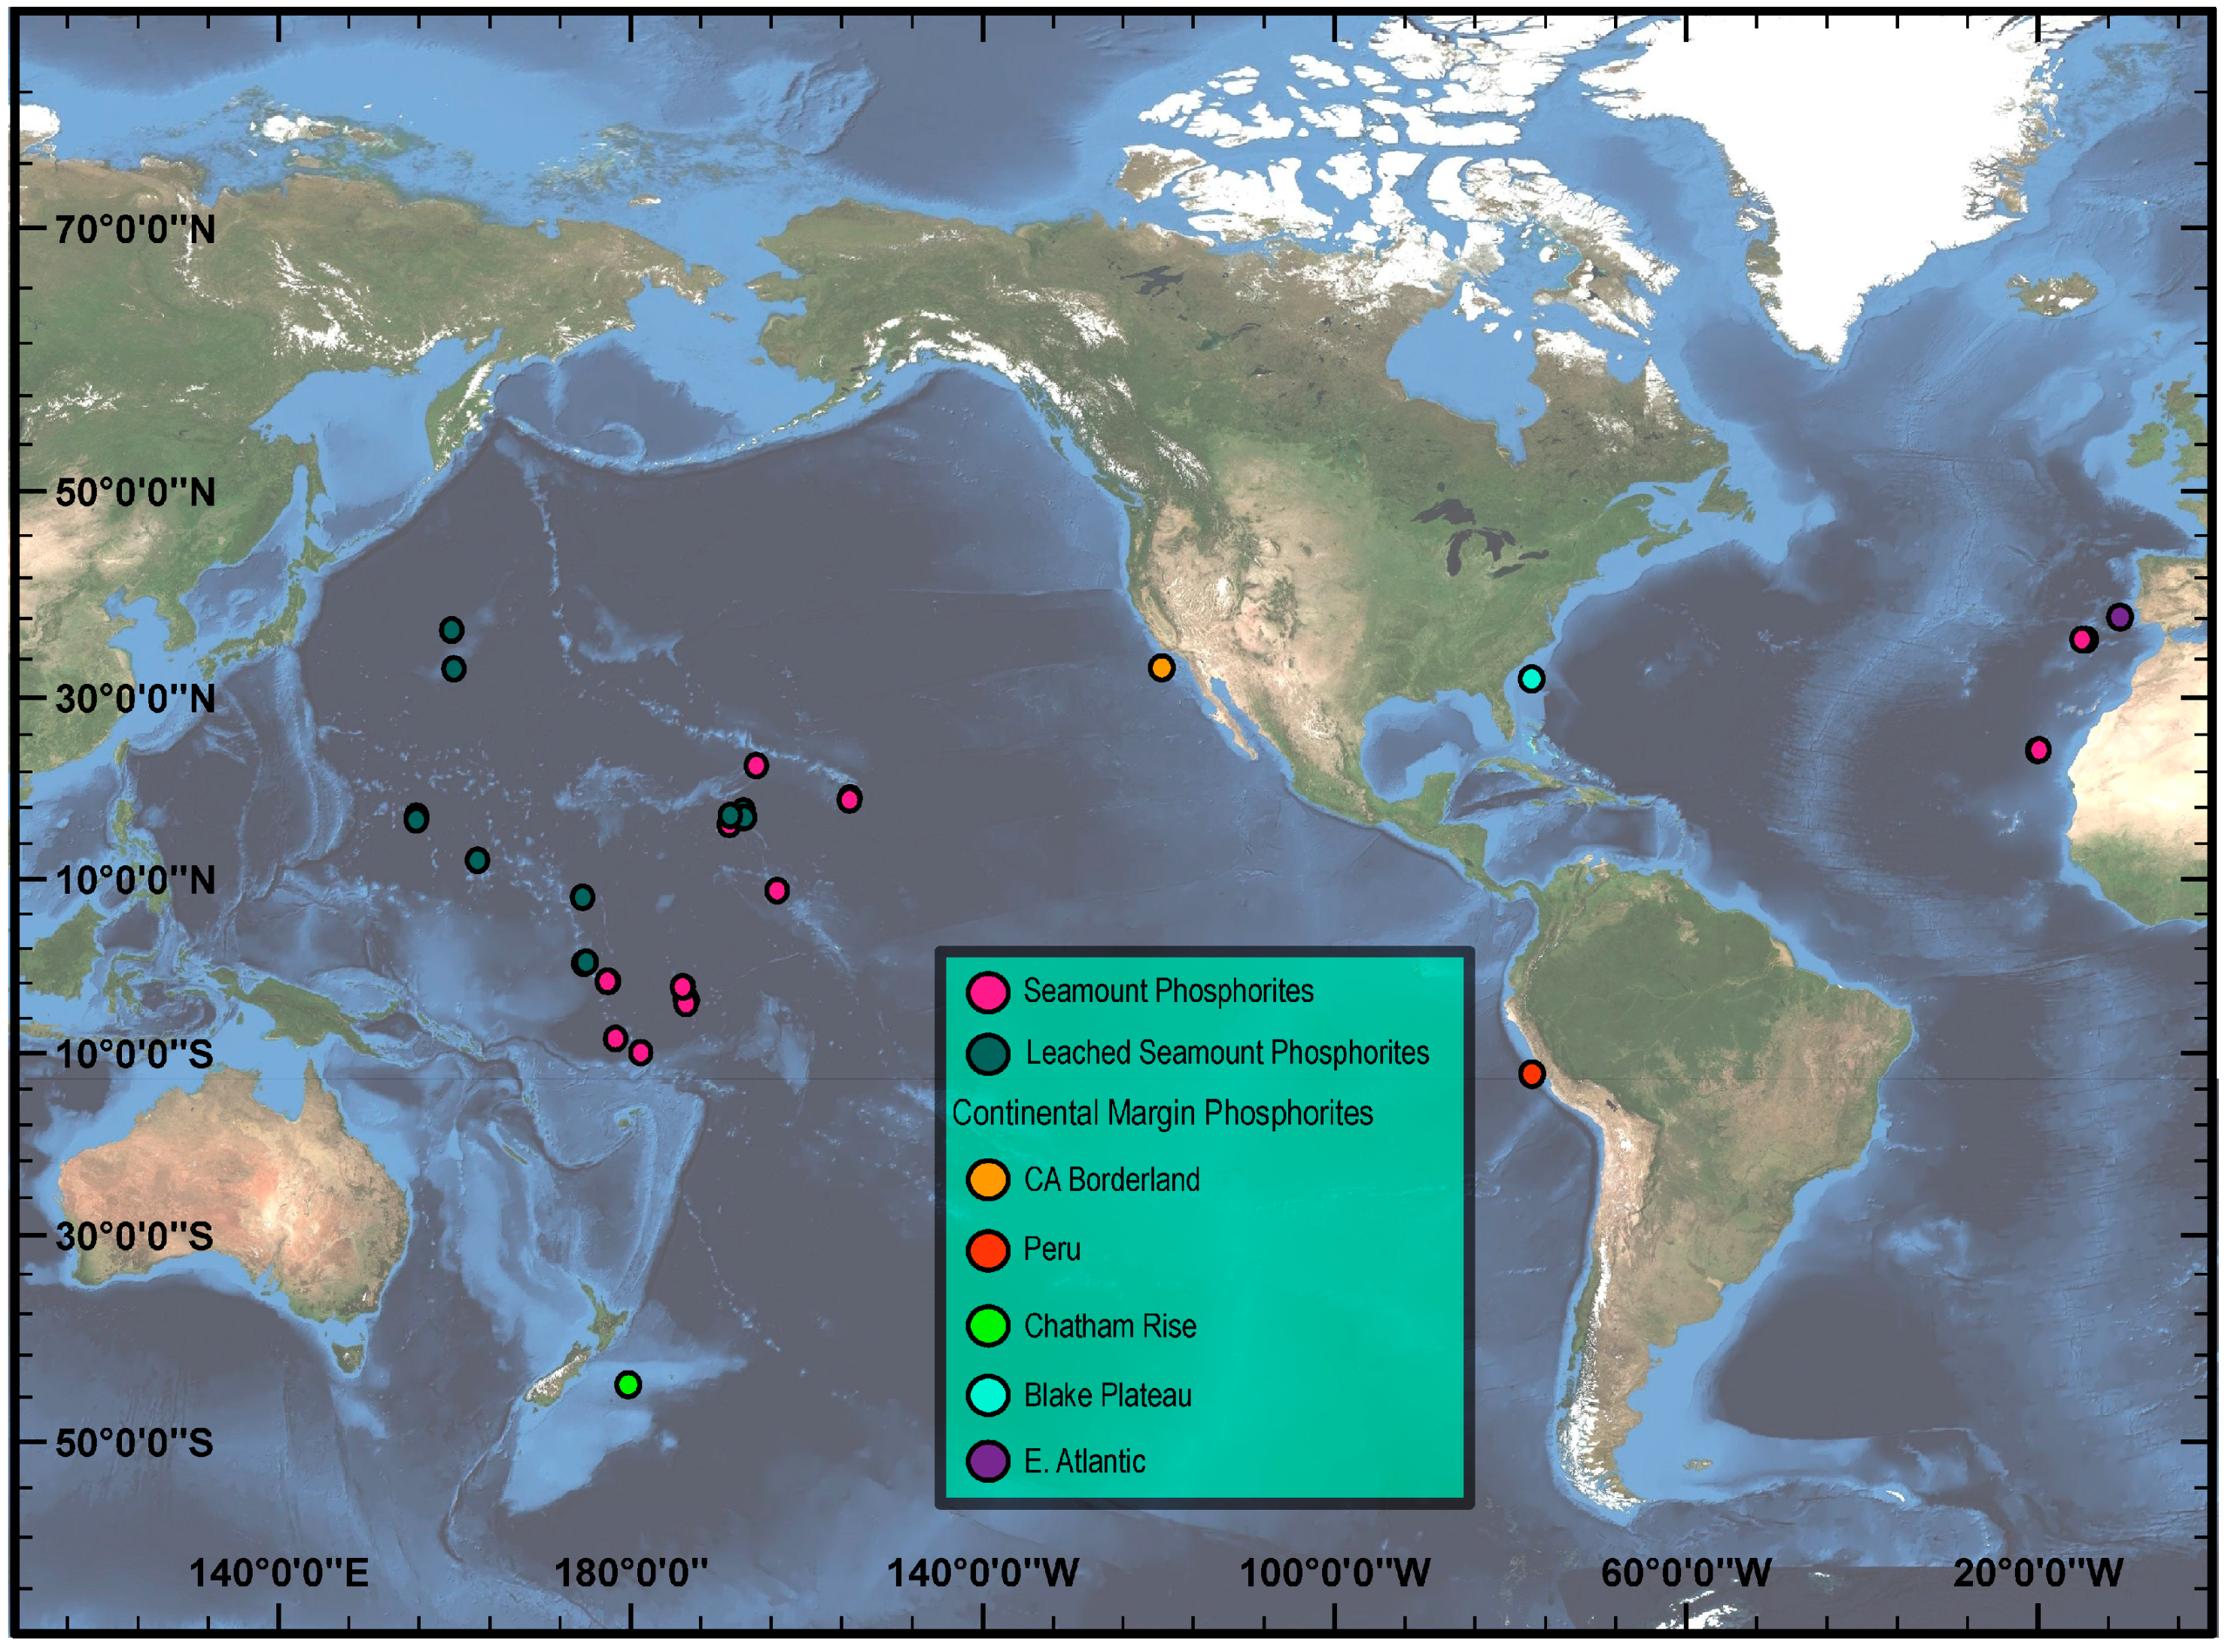
2.1. Sample Collection
2.2. Sample Preparation and Analyses
3. Results
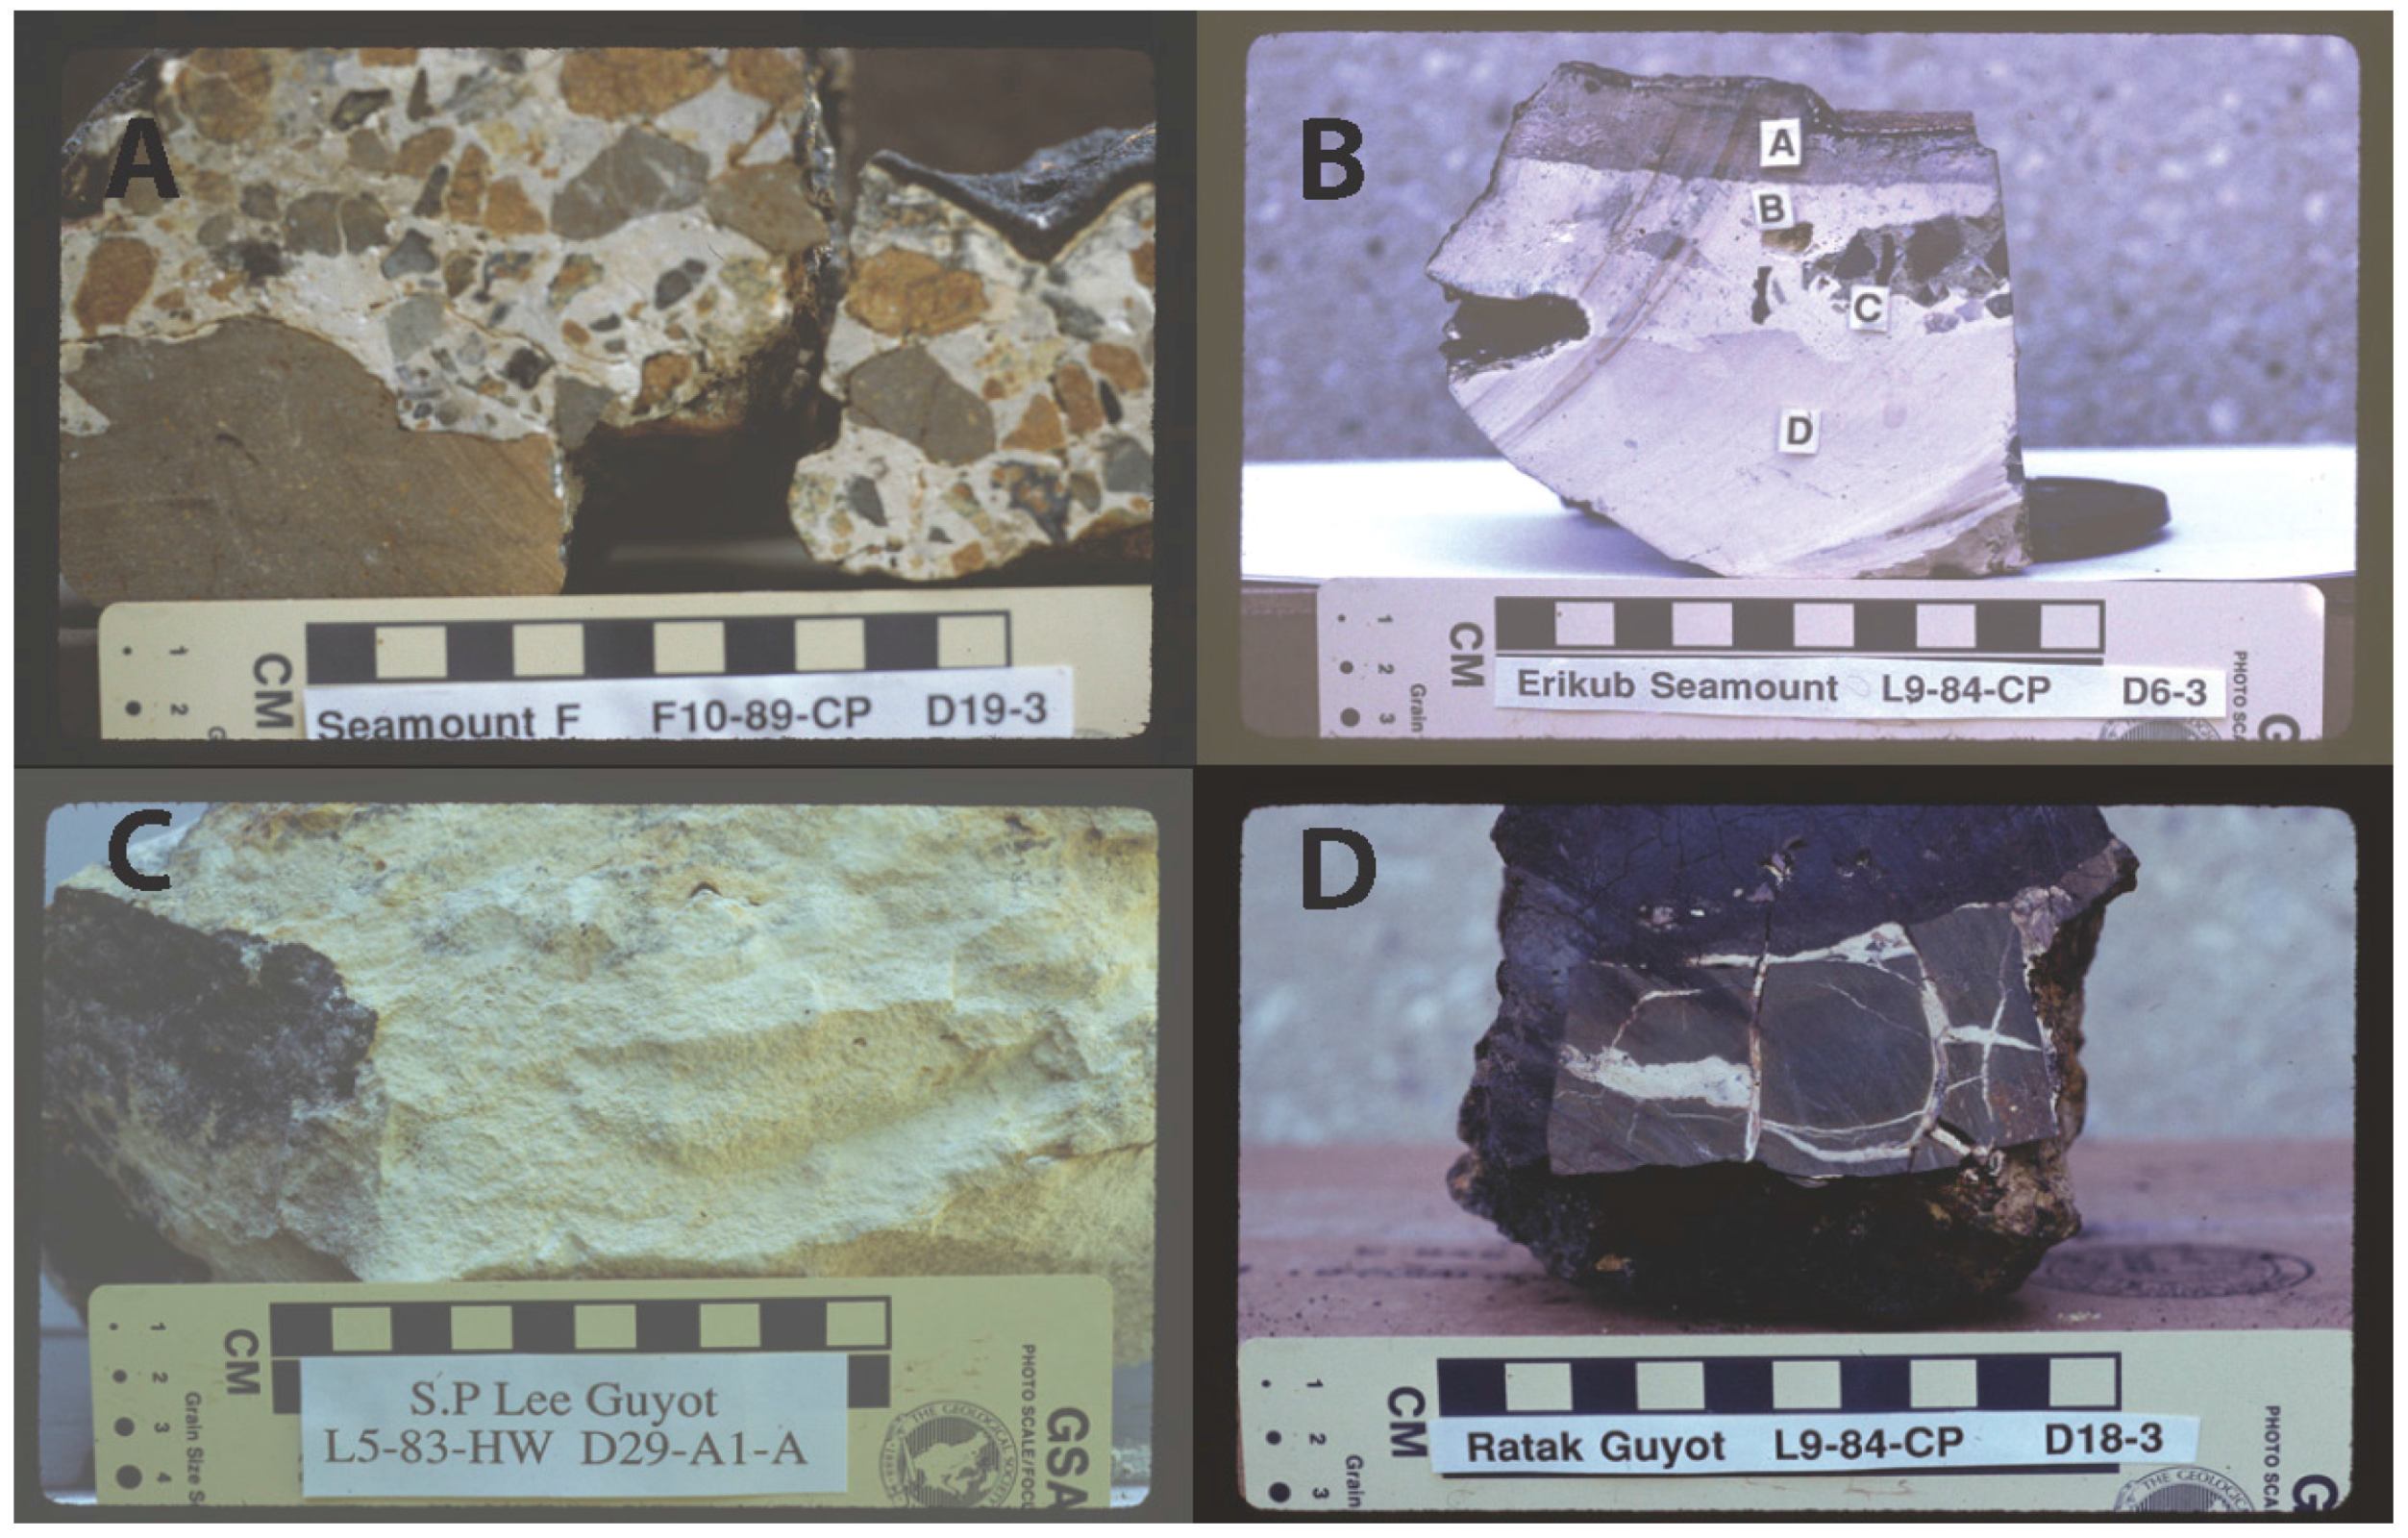
3.1. Mineralogy
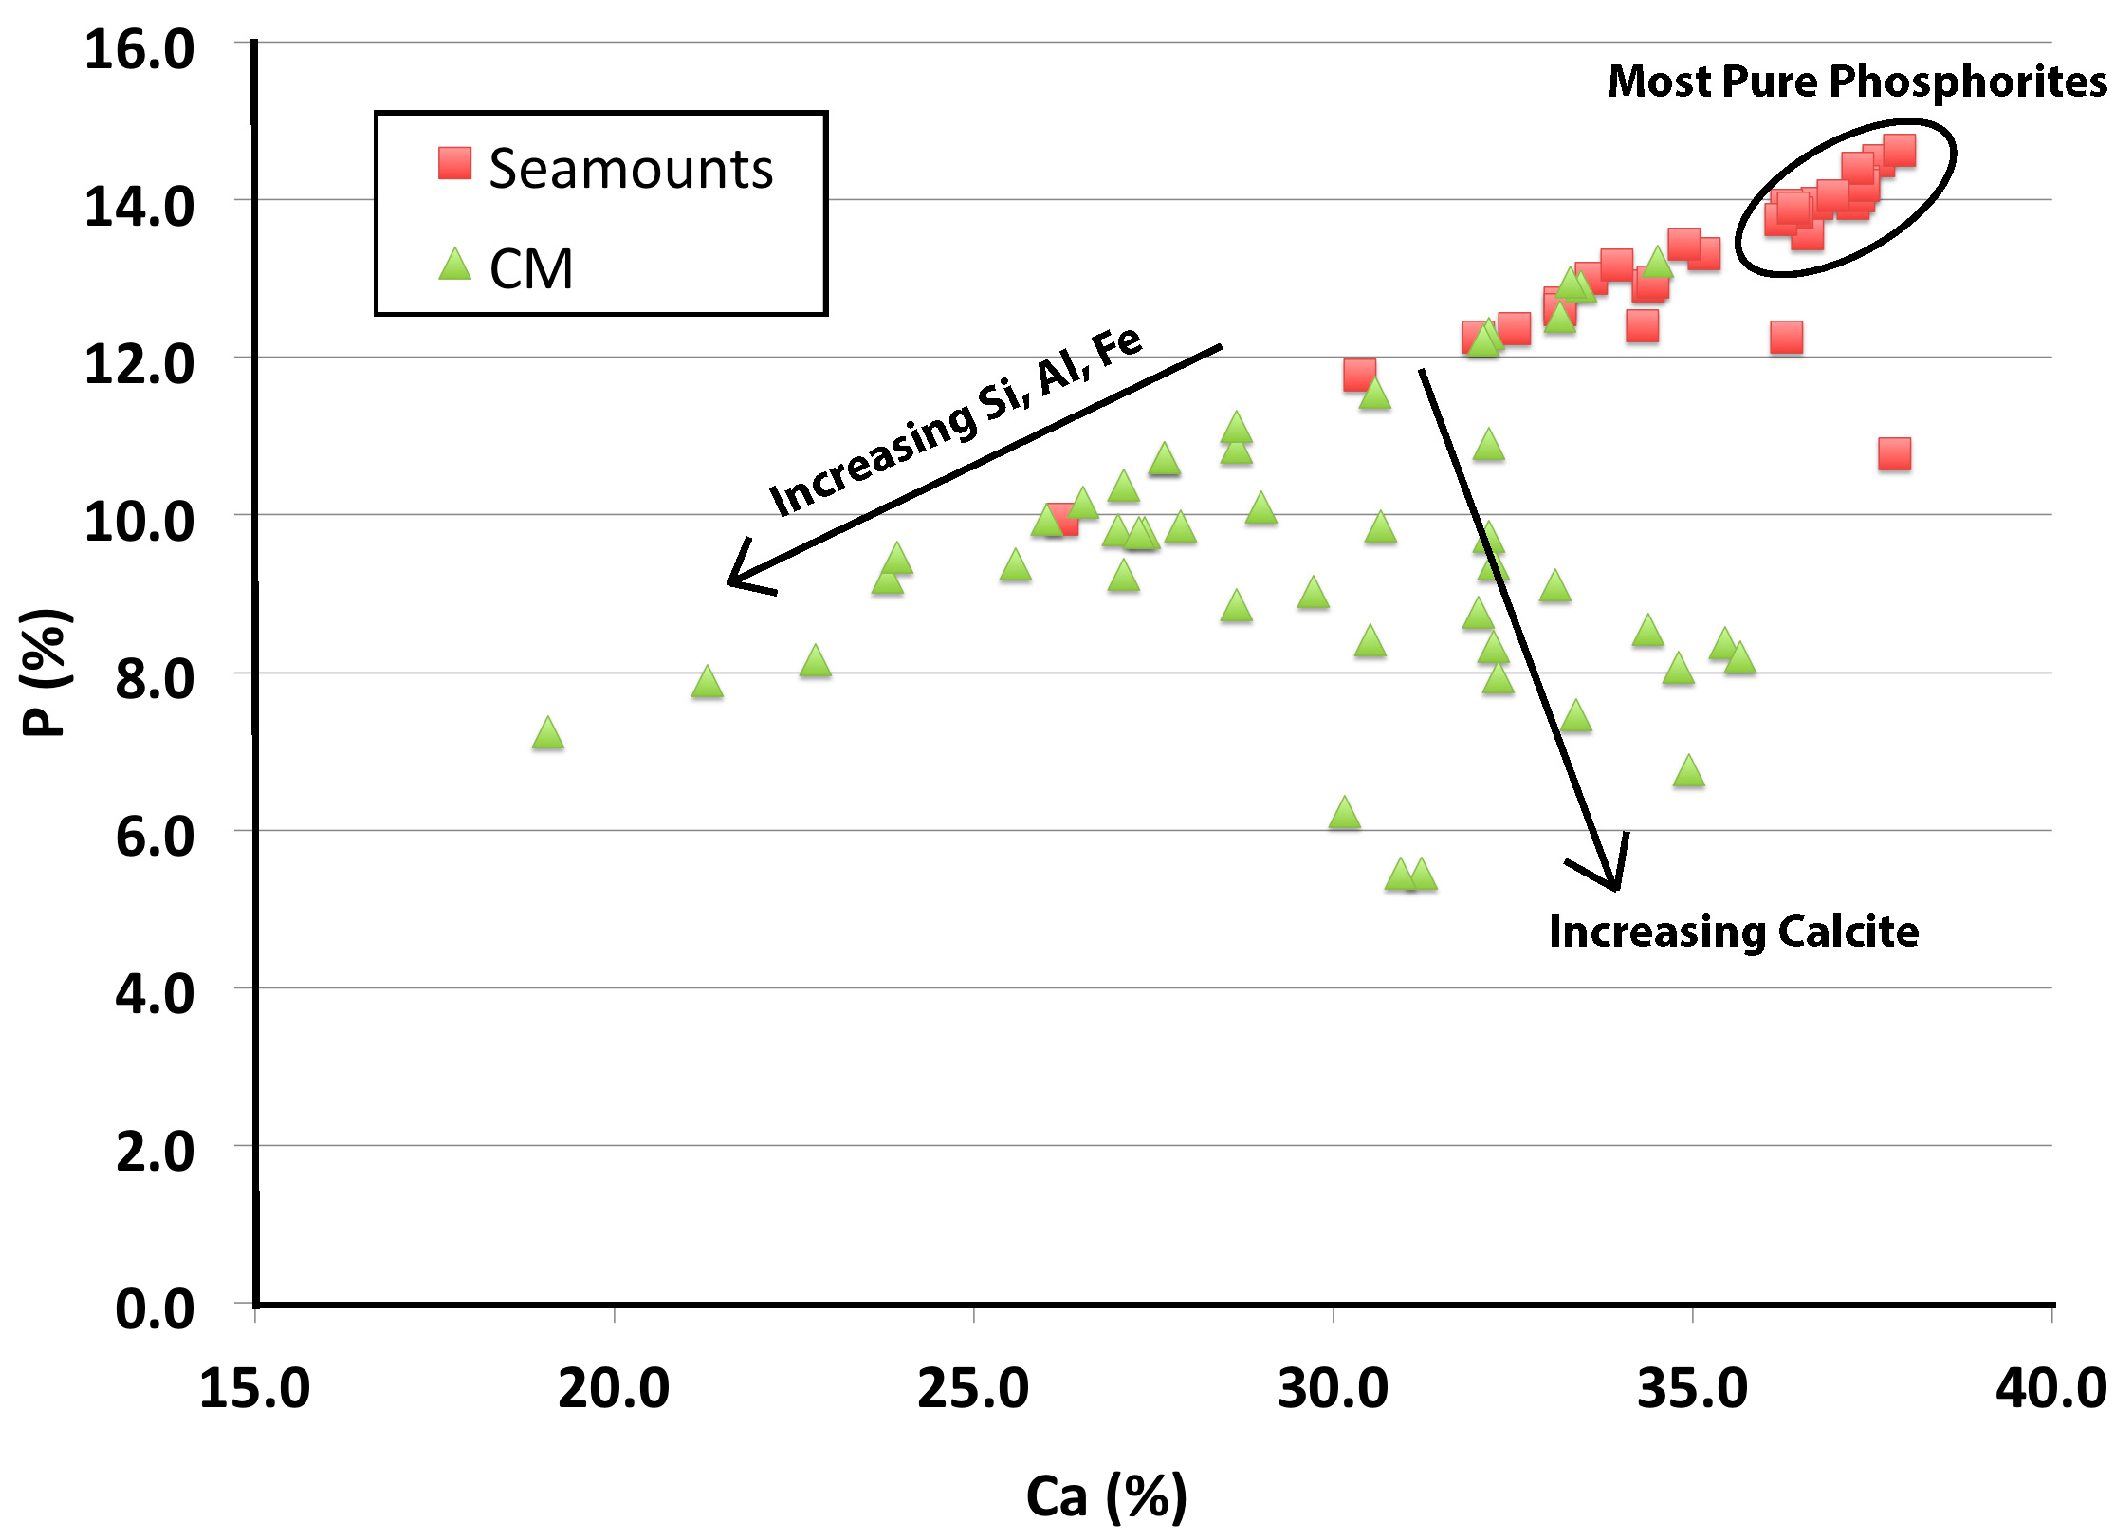
3.2. Geochemistry
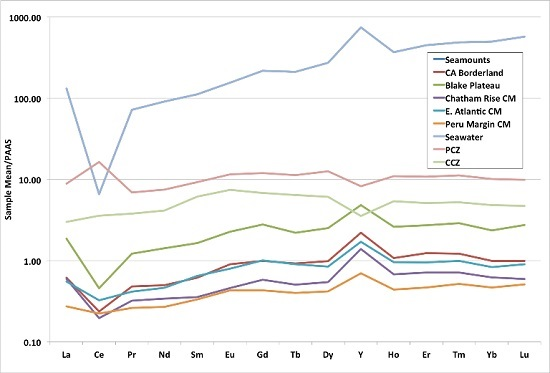
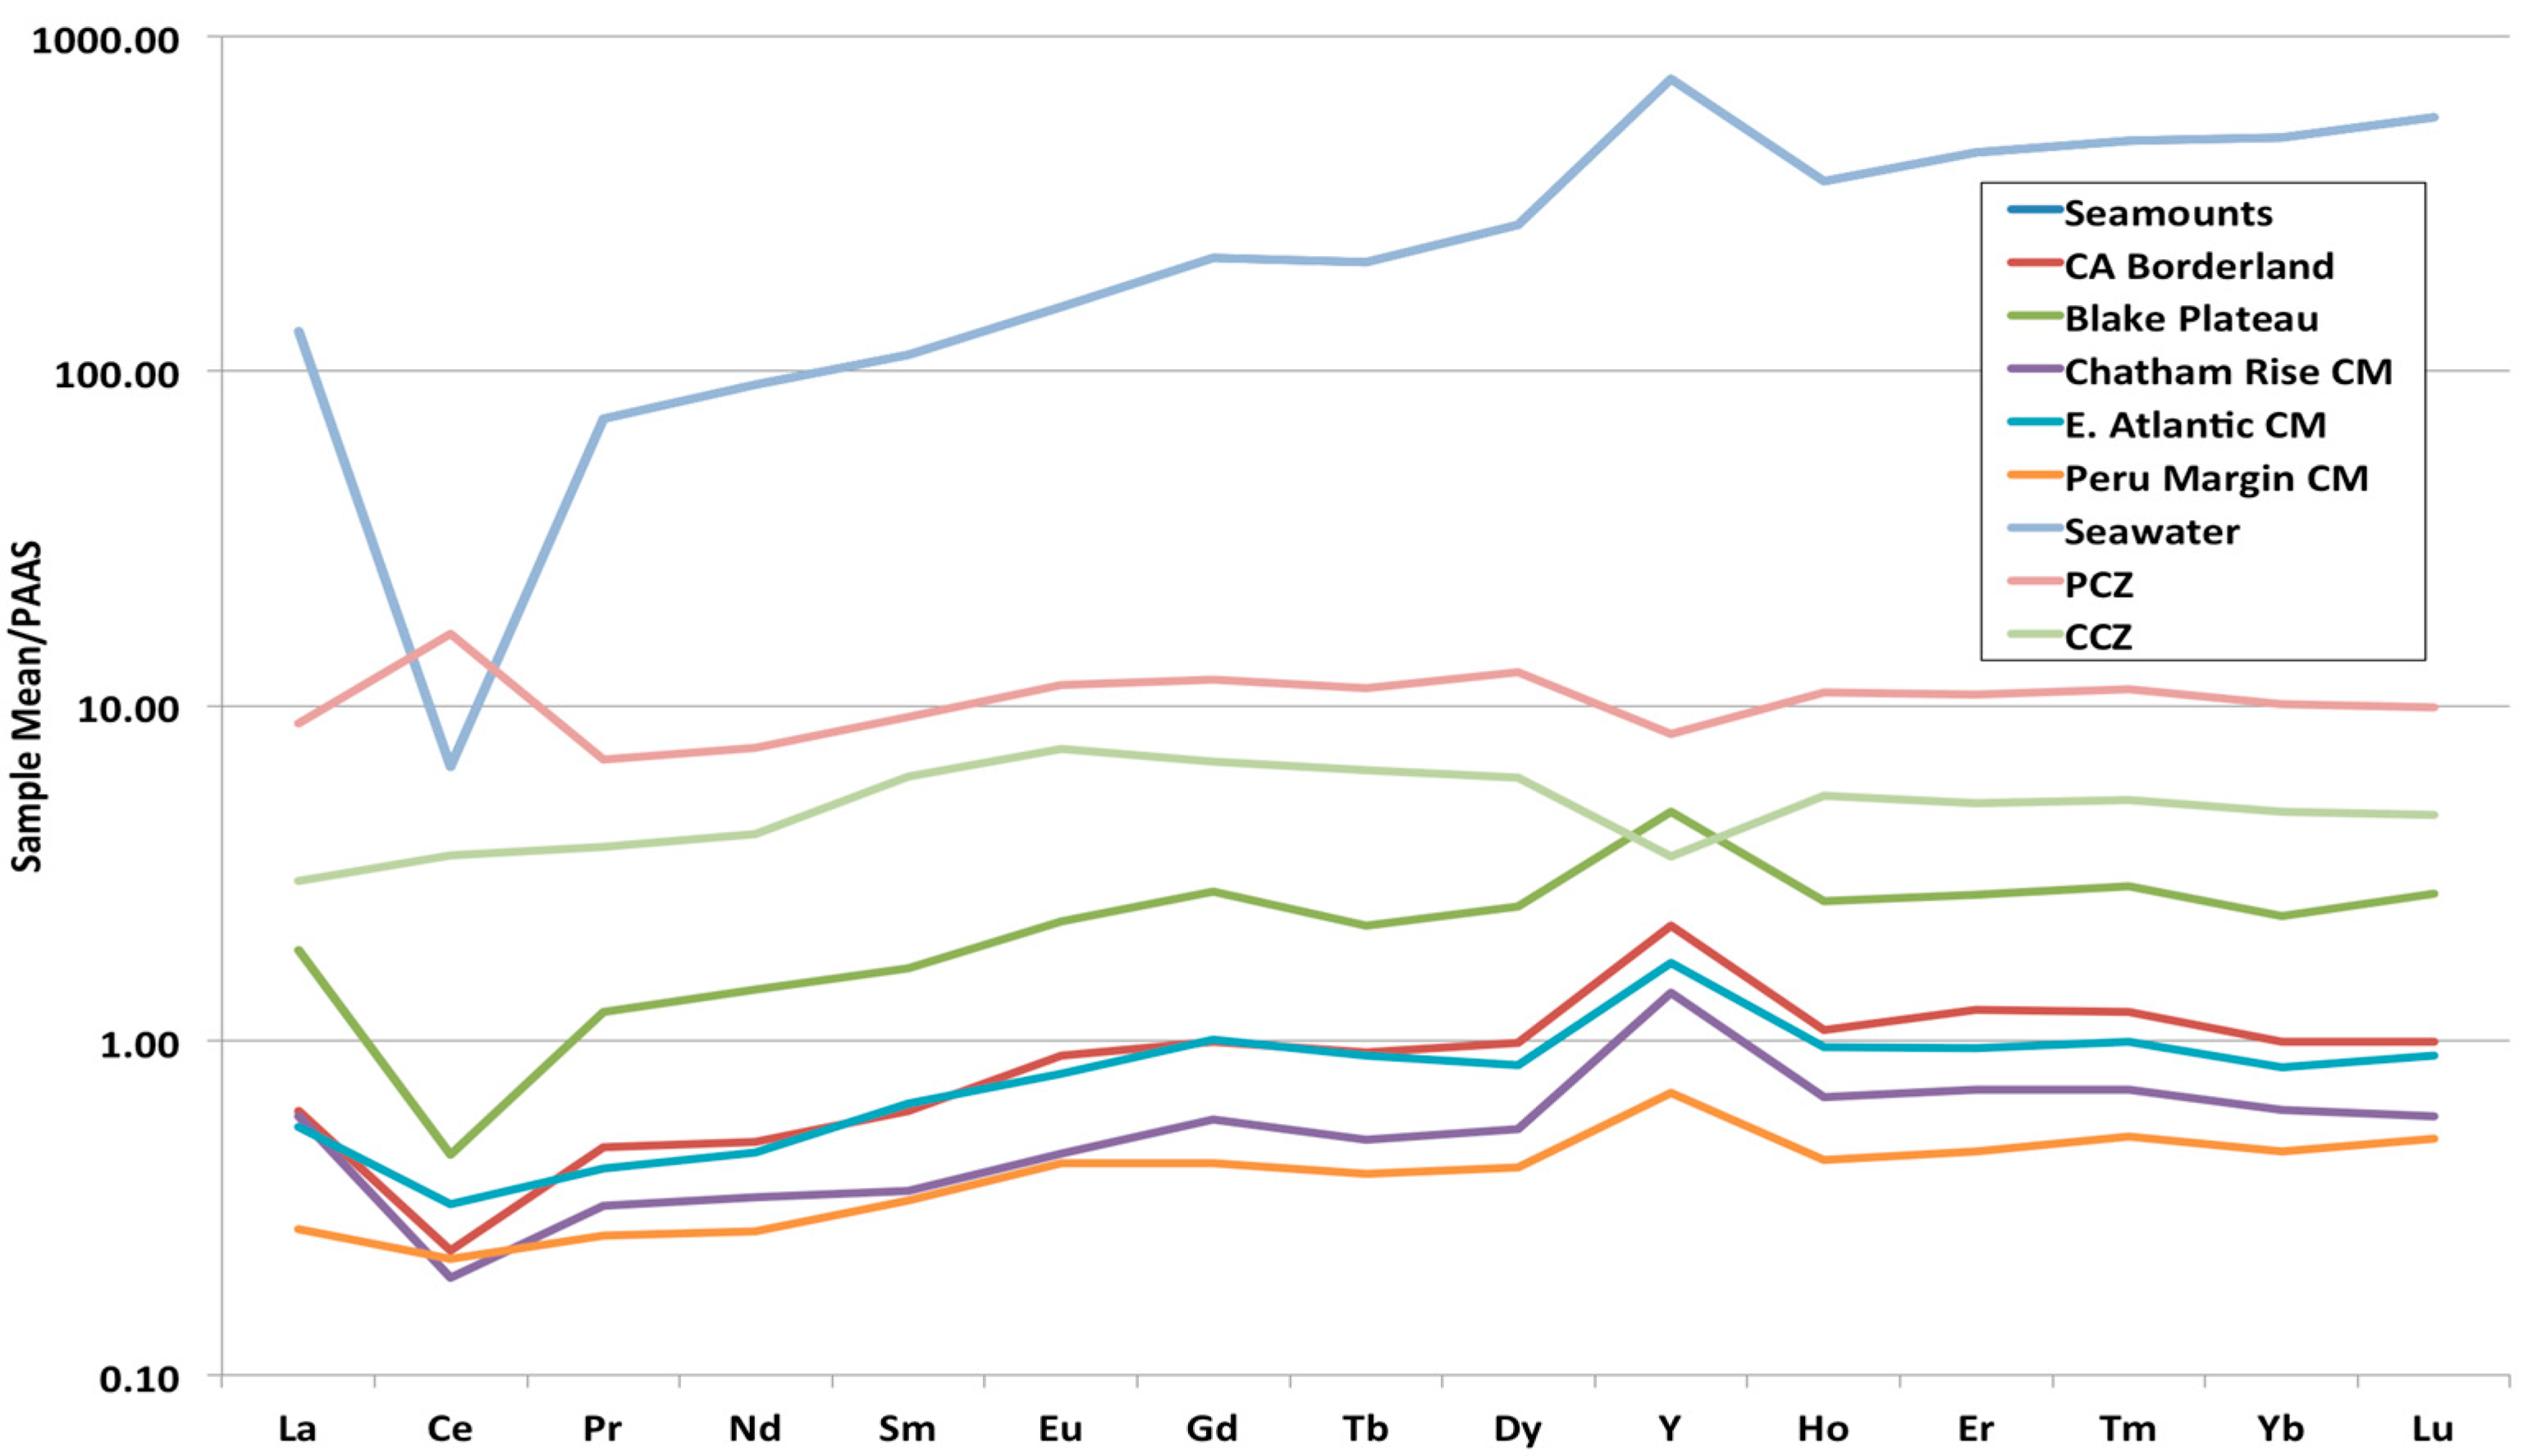
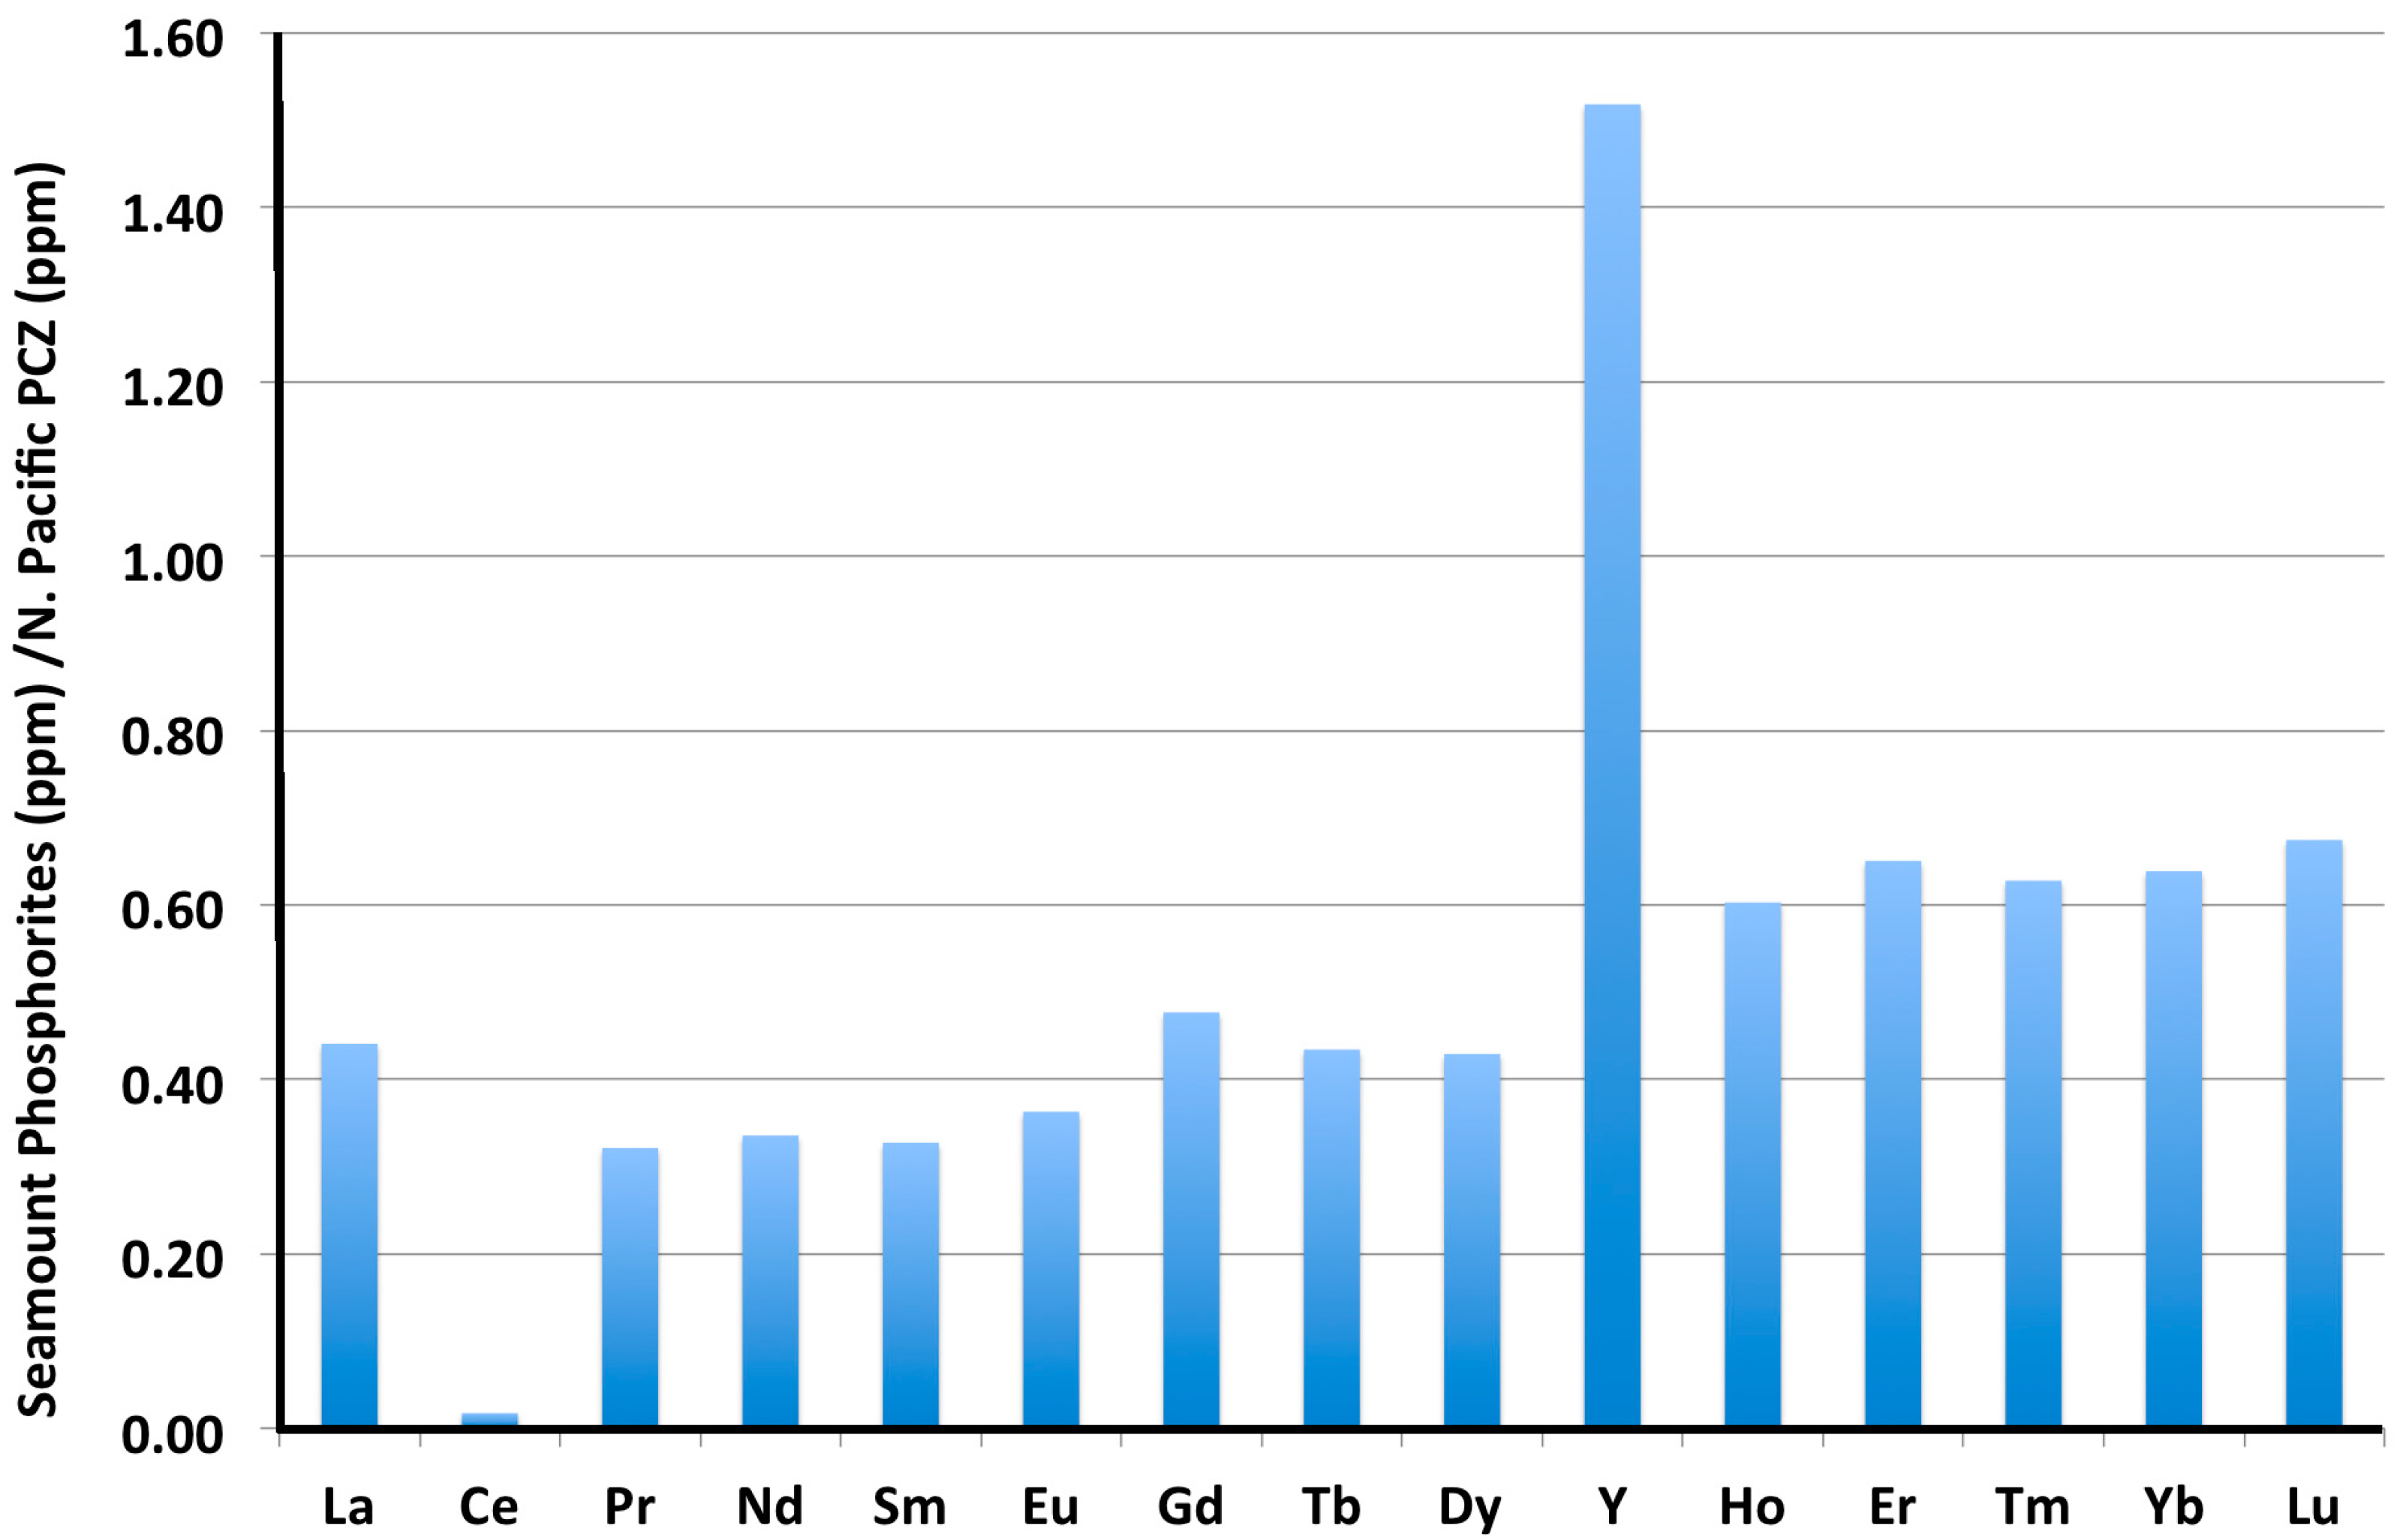
3.3. Rare Earth Elements (REY)
3.4. Correlations
4. Discussion
4.1. Comparison of CM and Seamount Mineralization, and REY Mass Balance
4.2. CFA Structure and Substitutions by REY
4.3. Controls on REY Composition
4.4. Comparisons with Terrestrial Carbonatite REY Deposits and Marine Fe-Mn Deposits
5. Conclusions
- (1)
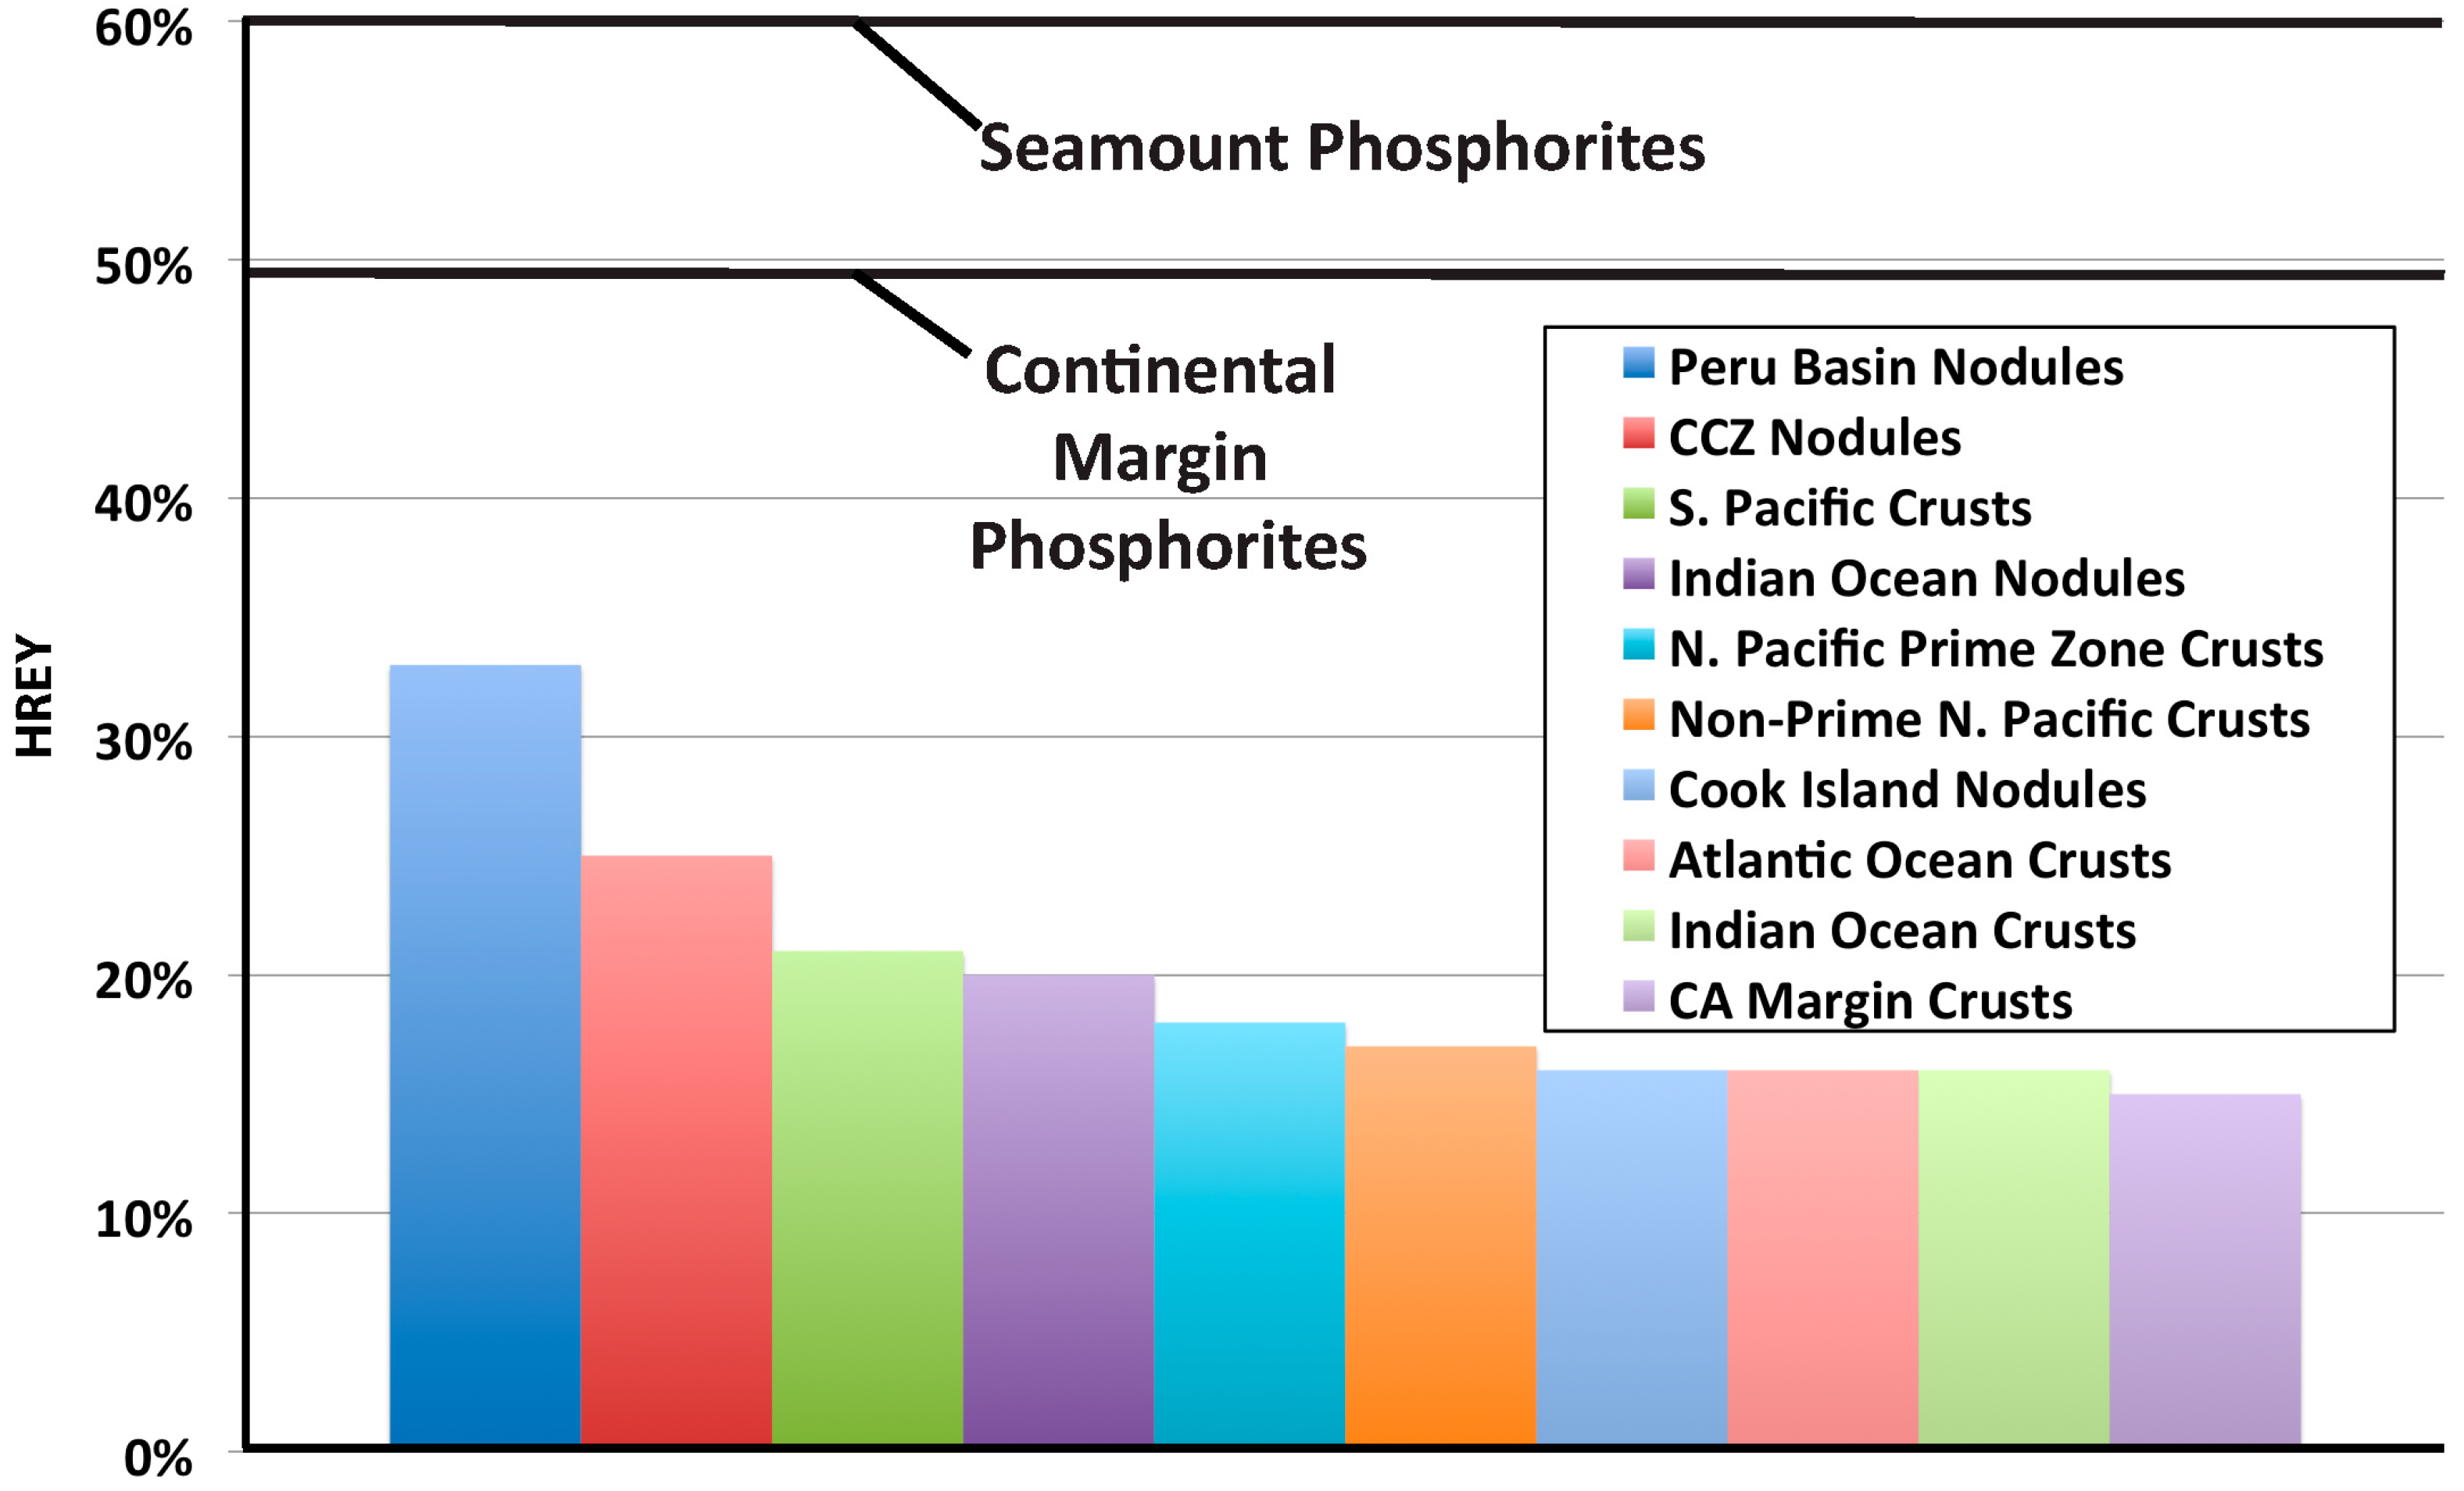
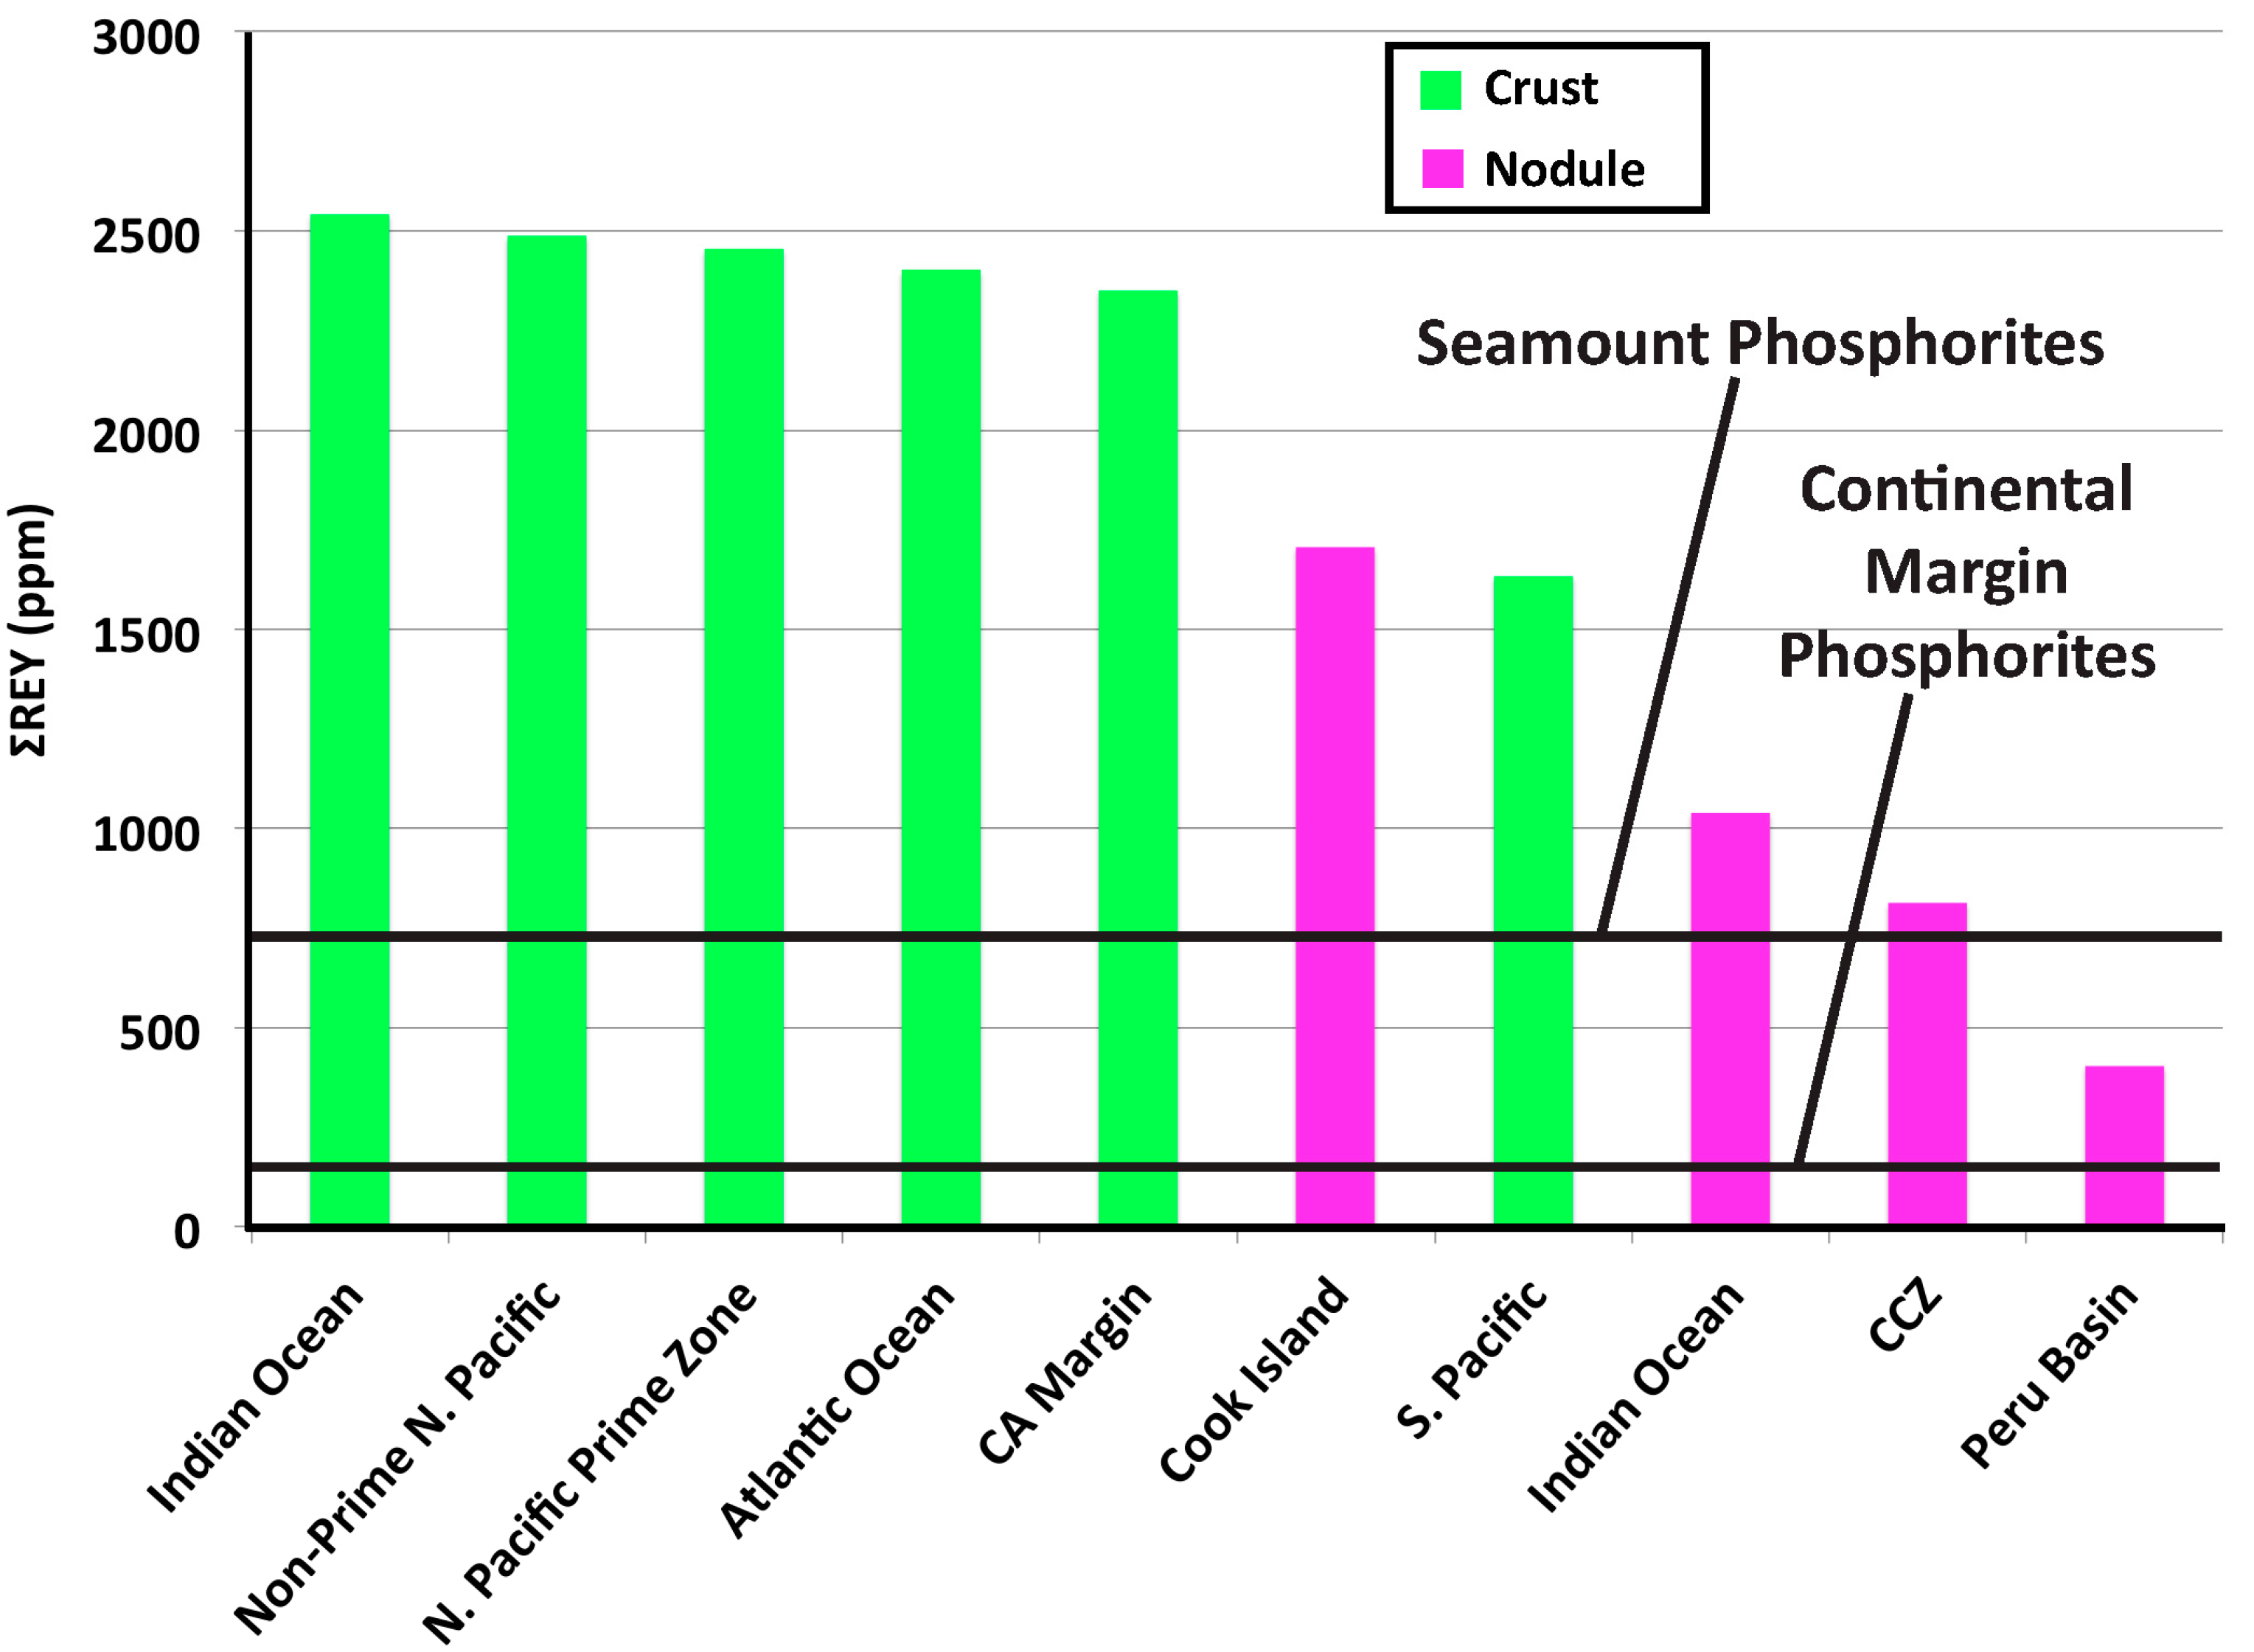
- Continental margin (CM) marine phosphorites have low total REY contents (mean 161 ppm) and high HREY complements (mean 49%), while seamount phosphorites have 4–6-times higher individual REY contents (except for Ce, which is comparable; mean ΣREY 727 ppm), and very high HREY complement (mean 60%).
- (2)
- The predominant causes of higher concentrations and larger HREY complements in seamount phosphorites compared to CM phosphorites is the geological time of formation, changes in seawater REY concentrations over time, water depth of formation, differences in organic carbon content in the depositional environments and its role in the development of diagenetic zones in the sediment, and possibly the concurrent precipitation of Fe-Mn oxides with the seamount phosphorites.
- (3)
- Fe-Mn crusts and nodules are another potential resource for REY. Both Fe-Mn deposit types have significantly lower HREY complements than the phosphorites and crusts have three to ten times higher REY concentrations. These differences can be explained by the mechanisms of incorporation of the REY into the mineral deposits: Predominantly sorption by the Fe-Mn oxides with surface oxidation of the Ce, and predominantly by substitution for Ca in the CFA structure, and to lesser extents by inheritance from the host rock and by sorption.
- (4)
- Seamount phosphorites occur in the same places as Fe-Mn crusts on seamounts and the phosphorites are typically covered with Fe-Mn crusts, making exploration for phosphorites challenging. Consequently, it would require the development of new technology or detailed sampling to identify phosphorite substrate rock beneath the Fe-Mn crusts. Detailed sampling and geophysical measurements of a single guyot might provide geological or morphological criteria that would be useful for future exploration.
- (5)
- An ideal mine site might be one where the substrate rock is phosphorite, in which case it would be desirable to collect both phosphorite and Fe-Mn crusts at the same time. This approach would provide two potential multi-component ore deposits in one mining operation, one with P and REY co-products and one with focus metals (Co, Ni, and Mn) and byproducts (e.g., Mo, REY, and Te).
- (6)
- Potential ore deposits with high HREY complements, like the marine phosphorites analyzed in this paper, could help supply the HREY needed for high-tech and green-tech applications without creating an oversupply of the LREY. Consequently, a search for such deposits with the largest HREY/LREY ratios would help alleviate the supply/oversupply problem.
- (7)
- Land-based phosphorite deposits offer a similar potential REY resource as a byproduct or co-product of the focus phosphate mining (e.g., [6,7]). Recovery of these land-based REY would require the addition of costly infrastructure and changes in extractive processing to the existing mining operations. Production of REY as a co-product of phosphorite mining would be advantageous if considered in the early stages of planning a new mining operation, such as those currently proposed for CM offshore sites.
Supplementary Materials
Acknowledgments
Author Contributions
Conflicts of Interest
References
- Altschuler, Z.S. The geochemistry of trace elements in marine phosphorites Part I. Characteristic abundances and enrichment. In Marine Phosphorites—Geochemistry, Occurrence, Genesis; Bentor, Y.K., Ed.; Society of Economic Paleontologists and Mineralogists: Tulsa, OK, USA, 1980; pp. 19–30. [Google Scholar]
- McArthur, J.M.; Walsh, J.N. Rare-earth geochemistry of phosphorites. Chem. Geol. 1984, 47, 191–220. [Google Scholar] [CrossRef]
- Watkins, R.T.; Nathan, Y.; Bremner, J.M. Rare earth elements in phosphorite and associated sediment from the Namibian and South African continental shelves. Mar. Geol. 1995, 129, 111–128. [Google Scholar] [CrossRef]
- Hein, J.R.; Yeh, H.-W.; Gunn, S.H.; Sliter, W.V.; Benninger, L.M.; Wang, C.-H. Two major Cenozoic episodes of phosphogenesis recorded in equatorial Pacific seamount deposits. Paleoceanography 1993, 8, 293–311. [Google Scholar] [CrossRef]
- Glenn, C.R.; Föllmi, K.B.; Riggs, S.R.; Baturin, G.N.; Grimm, K.A.; Trappe, J.; Abed, A.M.; Galli-Olivier, C.; Garrison, R.E.; Ilyin, A.V.; et al. Phosphorus and phosphorites: Sedimentology and environments of formation. Eclogae Geol. Helv. 1994, 87, 747–788. [Google Scholar]
- Christmann, P. A forward look into rare earth supply and demand: A role for sedimentary phosphate deposits? Procedia Eng. 2014, 83, 19–26. [Google Scholar] [CrossRef]
- Emsbo, P.; McLaughlin, P.I.; Breit, G.N.; du Bray, E.A.; Koenig, A.E. Rare earth elements in sedimentary phosphate deposits: Solution to the global REE crisis? Gondwana Res. 2015, 27, 776–785. [Google Scholar] [CrossRef]
- Santos, A.J.G.; Mazzilli, B.P.; Fávaro, D.I.T.; Silva, P.S.C. Partitioning of radionuclides and trace elements in phosphogypsum and its source material based on sequential extraction methods. J. Environ. Radioact. 2006, 87, 52–61. [Google Scholar] [CrossRef] [PubMed]
- Weng, Z.; Jowitt, S.M.; Mudd, G.M.; Haque, N. A detailed assessment of global rare earth element resources: Opportunities and challenges. Econ. Geol. 2015, 110, 1925–1952. [Google Scholar] [CrossRef]
- Koschinsky, A.; Stascheit, A.; Bau, M.; Halbach, P. Effects of phosphatization on the geochemical and mineralogical composition of marine ferromanganese crusts. Geochim. Cosmochim. Acta 1997, 61, 4079–4094. [Google Scholar] [CrossRef]
- Glenn, C.R.; Arthur, M.A. Petrology and major element geochemistry of Peru margin phosphorites and associated diagenetic minerals: Authigenesis in modern organic-rich sediments. Mar. Geol. 1988, 80, 231–267. [Google Scholar] [CrossRef]
- Glenn, C.R.; Arthur, M.A.; Resig, J.M.; Burnett, W.C.; Dean, W.E.; Jahnke, R.A. Are Modern and Ancient Phosphorites Really So Different? In Siliceous, Phosphatic and Glauconitic Sediments of the Tertiary and Mesozoic; Iijima, A., Abed, A.M., Garrison, R.E., Eds.; VSP International Science Publishers: Leiden, The Netherlands, 1994; pp. 159–188. [Google Scholar]
- Kudrass, H.; Cullen, D. Submarine phosphorite nodules from the Central Chatham Rise off NZ-composition, distribution and reserves—(Valdivia Cruise 1978). Geol. Jahrb. 1982, D51, 3–41. [Google Scholar]
- Cook, H.E.; Johnson, P.D.; Matti, J.C.; Zemmels, I. Methods of sample preparation and X-ray diffraction data analysis (X-ray mineralogy laboratory, Deep Sea Drilling Project, University of California Riverside). In Initial Reports of the Deep Sea Drilling Project; U.S. Government Printing Office: Washington, DC, USA, 1975; Volume 28, pp. 999–1007. [Google Scholar]
- Hein, J.R.; Schwab, W.C.; Davis, A.S. Cobalt and platinum-rich ferromanganese crusts and associated substrate rocks from the Marshall Islands. Mar. Geol. 1988, 78, 255–283. [Google Scholar] [CrossRef]
- McLennan, S.M. Rare earth elements in sedimentary rocks: Influence of provenance and sedimentary processes. In Geochemistry and Mineralogy of Rare Earth Elements; Lipin, B.R., McKay, G.A., Eds.; Mineralogical Society of America’s Reviews in Mineralogy: Washington, DC, USA, 1989; Volume 21, pp. 169–200. [Google Scholar]
- Anders, E.; Grevesse, N. Abundances of the elements: Meteoritic and solar. Geochim. Cosmochim. Acta 1989, 53, 197–214. [Google Scholar] [CrossRef]
- Bau, M.; Koschinsky, A.; Dulski, P.; Hein, J.R. Comparison of the partitioning behaviours of yttrium, rare earth elements, and titanium between hydrogenetic marine ferromanganese crusts and seawater. Geochim. Cosmochim. Acta 1996, 60, 1709–1725. [Google Scholar] [CrossRef]
- Alibo, D.S.; Nozaki, Y. Rare earth elements in seawater: Particle association, shale-normalization, and Ce oxidation. Geochim. Cosmochim. Acta 1999, 63, 363–372. [Google Scholar] [CrossRef]
- Hughes, J.M.; Cameron, M.; Mariano, A.N. Rare-earth-element ordering and structural variations in natural rare-earth-bearing apatites. Am. Mineral. 1991, 76, 1165–1173. [Google Scholar]
- Hughes, J.M.; Rakovan, J.F. Structurally robust, chemically diverse: Apatite and apatite supergroup minerals. Elements 2015, 11, 165–170. [Google Scholar] [CrossRef]
- Piper, D.Z.; Perkins, R.B.; Rowe, H.D. Rare-earth elements in the Permian Phosphoria Formation: Paleo proxies of ocean geochemistry. Deep Sea Res. II 2007, 54, 1396–1413. [Google Scholar] [CrossRef]
- De Baar, H.J.W.; Bacon, M.P.; Brewer, P.G.; Bruland, K.W. Rare earth elements in the Pacific and Atlantic Oceans. Geochim. Cosmochim. Acta 1985, 49, 1943–1959. [Google Scholar] [CrossRef]
- Zhang, J.; Nozaki, Y. Rare earth element and yttrium in seawater: ICP-MS determination in the East Caroline, Coral Sea, and South Fiji basins of the western South Pacific Ocean. Geochim. Cosmochim. Acta 1996, 60, 4631–4644. [Google Scholar] [CrossRef]
- Lécuyer, C.; Reynard, B.; Grandjean, P. Rare earth element evolution of Phanerozoic seawater recorded in biogenic apatites. Chem. Geol. 2004, 204, 63–102. [Google Scholar] [CrossRef]
- Hein, J.R.; Conrad, T.A.; Dunham, R.E. Seamount characteristics and mine-site model applied to exploration- and mining-lease-block selection for cobalt-rich ferromanganese crusts. Mar. Georesour. Geotechnol. 2009, 27, 160–176. [Google Scholar] [CrossRef]
- Hein, J.R.; Mizell, K.; Koschinsky, A.; Conrad, T.A. Deep-ocean mineral deposits as a source of critical metals for high- and green-technology applications: Comparison with land-based deposits. Ore Geol. Rev. 2013, 51, 1–14. [Google Scholar] [CrossRef]
- Baturin, G.N. Thallium in oceanic phosphorites. Dokl. Earth Sci. 2004, 394, 68–72. [Google Scholar]
- Benninger, L.M.; Hein, J.R. Diagenetic evolution of seamount phosphorite. In Marine Authigenesis: From Global to Microbial; Glenn, C.R., Prévôt-Lucas, L., Lucas, J., Eds.; SEPM Special Publication: Tulsa, OK, USA, 2000; pp. 245–256. [Google Scholar]
- Jarvis, I.; Burnett, W.C.; Nathan, Y.; Almbaydin, F.S.M.; Attia, A.K.M.; Castro, L.N.; Flicoteaux, R.; Hilmy, M.E.; Husain, V.; Quatawnah, A.A.; et al. Phosphorite geochemistry: State-of-the-art and environmental concerns. Eclogae Geol. Helv. 1994, 87, 643–700. [Google Scholar]
- Long, K.R.; van Gosen, B.S.; Foley, N.K.; Cordier, D. The Principal Rare Earth Elements Deposits of the United States—A Summary of Domestic Deposits and a Global Perspective; U.S. Geological Survey Scientific Investigations Report 2010-5220; U.S. Geological Survey: Reston, VA, USA, 2010; p. 96.
- Hein, J.R. Prospects for Rare Earth Elements from Marine Minerals; International Seabed Authority Briefing Paper 02/12; International Seabed Authority: Kingston, Jamaica, 2012; pp. 1–4. [Google Scholar]
- Hein, J.R.; Koschinsky, A. Deep-ocean ferromanganese crusts and nodules. In Treatise on Geochemistry, 2nd ed.; Holland, H.D., Turekian, K.K., Eds.; Elsevier: Oxford, UK, 2014; Volume 13, Chapter 11; pp. 273–291. [Google Scholar]
- Hein, J.R.; Spinardi, F.; Okamoto, N.; Mizell, K.; Thorburn, D.; Tawake, A. Critical metals in manganese nodules from the Cook Islands EEZ, abundances and distributions. Ore Geol. Rev. 2015, 68, 97–116. [Google Scholar] [CrossRef]
- Stegen, K.S. Heavy rare earths, permanent magnets, and renewable energies: An imminent crisis. Energy Policy 2015, 79, 1–8. [Google Scholar] [CrossRef]


| Cruise ID | Sample ID | Major 2 | Moderate | Minor |
|---|---|---|---|---|
| AVON02 | 11-Massive | CFA | calcite | -- |
| AVON02 | 11-Porous | CFA | -- | calcite |
| AVON02 | 55-13 | CFA | -- | K-feldspar, chlorite |
| F10-89-CP | D10-17 | CFA | -- | -- |
| F7-86-HW | CD19-1A | CFA | -- | calcite, quartz, plagioclase |
| F7-86-HW | CD30-8 | CFA | plagioclase | chlorite |
| TN037 | D10-M-1 | CFA | -- | phillipsite, quartz |
| TN037 | D12-2 | CFA | -- | quartz |
| TUNES6 | D32-6 | CFA | plagioclase | chlorite, smectite, sepiolite |
| TUNES6 | D32-9 | CFA | calcite | barite |
| V2-91-CP | D4-12 | CFA | -- | K-feldspar, smectite, amphibole |
| V2-91-CP | D7-8 | CFA | -- | quartz, ilmenite, palygorskite |
| Leached Samples 3 | ||||
| SO66 | 26 DSR 1 | CFA | -- | -- |
| SO66 | 26 DSR 2 | CFA | -- | -- |
| SO66 4 | 28 DSR 6 | CFA | -- | -- |
| SO66 | 29 DSR 5 | CFA | -- | phillipsite |
| SO66 | 50 DSR 3 | CFA | -- | -- |
| SO66 | 61 DSR 1 | CFA | -- | -- |
| SO66 4 | 69 DSO 2 | CFA | phillipsite | -- |
| SO66 | 80 DSK 6 | CFA | -- | -- |
| SO66 | 85 DSK 1 | CFA | -- | -- |
| L5-83-HW 4 | D5-A3-2 | CFA | -- | -- |
| L5-83-HW 4 | D29-A1-b | CFA | -- | -- |
| F7-86-HW 4 | CD14-2D | CFA | -- | -- |
| F2-88-HW 4 | D12-1A | CFA | -- | quartz |
| F2-88-HW 4 | D12-5 | CFA | -- | quartz |
| SO83 | 64 GTV 1 | CFA | -- | -- |
| SO83 | 118 GTV 6 | CFA | -- | -- |
| SO83 | 126 GTV 3 | CFA | -- | -- |
| Cruise ID | Sample ID | Major 2 | Moderate | Minor |
|---|---|---|---|---|
| CA Borderland | ||||
| L-1-74-SC | LCB-14-A | CFA | Px | analcime, quartz |
| L-1-74-SC | LCB-14-B | CFA | Px, plagioclase | analcime |
| L-1-74-SC | LCB-1-4B | CFA | -- | quartz, dolomite |
| L-1-74-SC | LCB-1-4C | CFA | quartz, plagioclase | -- |
| L-1-74-SC | LCB-20-6C | CFA | plagioclase | quartz |
| L-1-74-SC | LCB-20-8B | CFA | -- | Quartz (?) |
| L-2-76-SC | CD281-A | CFA | -- | quartz |
| L-2-76-SC | CD281-B | CFA | -- | Plagioclase (?) |
| L-2-76-SC | CD350-A | CFA | -- | glauconite or illite, quartz (?) |
| L-2-76-SC | CD350-B | CFA | -- | quartz, glauconite or illite |
| Peru Margin | ||||
| JSL | 3350-1a | CFA | quartz, plagioclase | -- |
| JSL | 3350-1b | CFA | quartz, plagioclase | Illite (?), amphibole (?) |
| JSL | 3352-4 | CFA | plagioclase, quartz | -- |
| JSL | 3355-2 | CFA | quartz, plagioclase | -- |
| JSL | 3363-4 | CFA | quartz, plagioclase | -- |
| JSL | 3365-2 | CFA | quartz | -- |
| JSL | 3372-1 | CFA, quartz | plagioclase, pyrite | -- |
| JSL | 3365 | CFA | plagioclase, quartz | -- |
| JSL | 3352-6 | CFA | plagioclase | quartz |
| RC-2306 | 1-2, GS-1 | CFA | plagioclase, Px, quartz | K-feldspar, glauconite |
| Chatham Rise | ||||
| NA | DD9+2-8 | CFA | ASi | glauconite, pyrite (?) |
| NA | DD9+8 | CFA, calcite | -- | plagioclase, glauconite, quartz |
| NA | DD16+2-8 | CFA | calcite | quartz, glauconite, pyrite |
| NA | DD16+8 | CFA | calcite, goethite | quartz, glauconite |
| NA | DD19+2-8 | CFA | calcite, ASi | glauconite, pyrite |
| NA | DD19+8 | CFA | calcite, plagioclase | quartz, glauconite |
| NA | DD21+2-8 | CFA | ASi | calcite, glauconite, pyrite (?) |
| Chatham Rise | ||||
| NA | DD21+8 | CFA | calcite | goethite, pyrite, plagioclase, glauconite (?) |
| NA | DD22+2-8 | CFA | calcite | quartz, glauconite, pyrite (?) |
| NA | DD22+8 | CFA, calcite | plagioclase | -- |
| NA | DD23+2-8 | CFA | calcite, ASi | pyrite, glauconite, quartz (?) |
| NA | DD23+8 | CFA, calcite | -- | glauconite or illite |
| NA | DD24+2-8 | aragonite, calcite | CFA | plagioclase, glauconite, chlorite (?) |
| NA | DD24+8 | CFA, calcite | -- | illite/smectite (mixed layer) (?) |
| Blake Plateau | ||||
| GOS 74 | 2397-A | CFA | quartz, calcite | glauconite |
| GOS 74 | 2397-B | CFA | calcite | quartz, glauconite or illite |
| GOS 74 | 2399-A | CFA | calcite, goethite | glauconite or illite |
| GOS 74 | 2399-B | CFA | calcite | glauconite or illite |
| GOS 74 | 2476-A | CFA, calcite | -- | quartz |
| GOS 74 | 2476-B | CFA, calcite | -- | k-feldspar, birnessite |
| GOS 74 | 2480 | CFA | calcite | glauconite or illite, quartz, birnessite |
| GOS 74 | 2485 | CFA | calcite | glauconite or illite, quartz |
| CHN46-1 | Station 15-2 | CFA | calcite, 10 Å manganate | -- |
| AT266 | D42-4 | CFA | calcite, 10 Å manganate | analcime |
| E. Atlantic 3 | ||||
| SO83 | 23 GTV II A3 | CFA | -- | quartz |
| Element | N | Mean 1 | Median | StDev | Min | Max |
|---|---|---|---|---|---|---|
| Fe (wt %) | 10 | 1.60 | 1.37 | 0.90 | 0.50 | 3.27 |
| Si | 10 | 3.73 | 2.58 | 2.80 | 0.73 | 9.07 |
| Al | 10 | 0.95 | 0.61 | 0.94 | 0.16 | 3.01 |
| Si/Al | 10 | 3.94 | 5.12 | 1.36 | 2.68 | 6.24 |
| Mg | 10 | 0.71 | 0.57 | 0.33 | 0.43 | 1.36 |
| Ca | 10 | 30.6 | 32.1 | 3.83 | 22.8 | 34.5 |
| Na | 10 | 1.27 | 1.18 | 0.27 | 1.02 | 1.85 |
| K | 10 | 0.41 | 0.44 | 0.19 | 0.15 | 0.72 |
| Ti | 10 | 0.19 | 0.03 | 0.33 | 0.01 | 0.89 |
| P | 10 | 11.6 | 12.3 | 1.67 | 8.16 | 13.2 |
| Ca/P | 10 | 2.64 | 2.63 | 0.07 | 2.57 | 2.79 |
| P2O5 | 10 | 26.6 | 28.1 | 3.84 | 18.7 | 30.3 |
| S | 10 | 1.10 | 1.13 | 0.28 | 0.62 | 1.58 |
| SO3 | 10 | 2.74 | 2.81 | 0.69 | 1.55 | 3.93 |
| CO2 | 10 | 6.31 | 6.60 | 0.93 | 4.34 | 7.06 |
| LOI 2 | 10 | 11.1 | 11.0 | 0.69 | 10.2 | 12.2 |
| H2O+ | 10 | 4.71 | 4.75 | 0.23 | 4.40 | 5.05 |
| As (ppm) | 10 | 13 | 13 | 6.1 | 6.0 | 27 |
| Ba | 10 | 684 | 647 | 487 | 145 | 1290 |
| Cl | 10 | 1032 | 905 | 368 | 670 | 1790 |
| Co | 10 | 5.8 | 4.3 | 3.5 | 2.8 | 13 |
| Cr | 10 | 111 | 107 | 45 | 43 | 181 |
| Cu | 10 | 23 | 20 | 5.0 | 18 | 31 |
| F | 10 | 20,909 | 22,750 | 5205 | 8990 | 25,400 |
| Li | 10 | 6.4 | 4.5 | 5.7 | 2.0 | 20 |
| Mn | 10 | 79 | 33 | 91 | 17 | 256 |
| Mo | 10 | 10 | 6.7 | 12 | 4.0 | 44 |
| Ni | 10 | 44 | 43 | 6.0 | 35 | 55 |
| Pb | 10 | 4.2 | 3.6 | 1.7 | 2.2 | 7.6 |
| Sr | 10 | 2072 | 2100 | 257 | 1560 | 2340 |
| U | 10 | 106 | 83 | 67 | 62 | 285 |
| V | 10 | 101 | 115 | 41 | 49 | 165 |
| Zn | 10 | 57 | 49 | 19 | 41 | 94 |
| Zr | 10 | 37 | 16 | 46 | 8.0 | 141 |
| La | 10 | 23.6 | 23.0 | 6.37 | 15.1 | 32.6 |
| Ce | 10 | 18.7 | 14.7 | 11.5 | 7.00 | 42.6 |
| Pr | 10 | 4.23 | 3.77 | 1.78 | 2.05 | 7.39 |
| Nd | 10 | 16.8 | 15.0 | 7.08 | 7.90 | 29.4 |
| Sm | 10 | 3.43 | 3.03 | 1.50 | 1.60 | 6.10 |
| Eu | 10 | 0.97 | 0.82 | 0.48 | 0.43 | 1.85 |
| Gd | 10 | 4.63 | 4.49 | 1.49 | 2.48 | 6.53 |
| Tb | 10 | 0.71 | 0.70 | 0.22 | 0.38 | 1.00 |
| Dy | 10 | 4.61 | 4.66 | 1.29 | 2.63 | 6.34 |
| Y | 10 | 59.7 | 59.7 | 13.4 | 40.2 | 78.4 |
| Ho | 10 | 1.07 | 1.10 | 0.26 | 0.67 | 1.44 |
| Er | 10 | 3.51 | 3.54 | 0.82 | 2.25 | 4.55 |
| Tm | 10 | 0.49 | 0.50 | 0.11 | 0.31 | 0.63 |
| Yb | 10 | 2.79 | 2.85 | 0.56 | 1.90 | 3.60 |
| Lu | 10 | 0.43 | 0.43 | 0.09 | 0.30 | 0.58 |
| ΣREY 3 | 10 | 146 | 144 | 41 | 85 | 205 |
| %HREY 4 | 10 | 54 | 57 | 6 | 42 | 61 |
| Cecn 5 | 10 | 0.63 | 0.62 | 0.14 | 0.38 | 0.85 |
| Cesn 5 | 10 | 0.47 | 0.47 | 0.10 | 0.29 | 0.64 |
| Element | N | Mean 1 | Median | StDev | Min | Max |
|---|---|---|---|---|---|---|
| Fe (wt %) | 10 | 1.72 | 1.55 | 0.60 | 1.17 | 2.97 |
| Si | 10 | 8.47 | 7.41 | 3.08 | 5.05 | 14.6 |
| Al | 10 | 2.00 | 1.68 | 0.66 | 1.34 | 3.31 |
| Si/Al | 10 | 4.23 | 4.10 | 0.50 | 3.51 | 4.87 |
| Mg | 10 | 0.66 | 0.67 | 0.09 | 0.42 | 0.74 |
| Ca | 10 | 25.2 | 26.3 | 3.09 | 19.1 | 28.7 |
| Na | 10 | 1.31 | 1.26 | 0.17 | 1.05 | 1.60 |
| K | 10 | 0.73 | 0.65 | 0.26 | 0.44 | 1.21 |
| Ti | 10 | 0.09 | 0.08 | 0.02 | 0.07 | 0.13 |
| P | 10 | 9.69 | 10.1 | 1.27 | 7.24 | 11.1 |
| Ca/P | 10 | 2.60 | 2.60 | 0.04 | 2.53 | 2.70 |
| P2O5 | 10 | 22.2 | 23.1 | 2.91 | 16.6 | 25.5 |
| S | 10 | 1.40 | 1.37 | 0.54 | 0.73 | 2.63 |
| SO3 | 10 | 3.50 | 3.42 | 1.35 | 1.82 | 6.55 |
| CO2 | 10 | 5.90 | 6.22 | 1.01 | 4.03 | 7.02 |
| LOI 2 | 10 | 10.6 | 10.8 | 1.50 | 8.07 | 13.3 |
| H2O+ | 10 | 4.49 | 4.55 | 0.66 | 3.50 | 5.40 |
| As (ppm) | 10 | 29 | 26 | 20 | 7.0 | 81 |
| Ba | 10 | 136 | 106 | 64 | 84 | 281 |
| Cl | 10 | 1829 | 1762 | 595 | 1007 | 3037 |
| Co | 10 | 3.9 | 4.0 | 1.0 | 2.7 | 5.5 |
| Cr | 10 | 76 | 70 | 23 | 49 | 116 |
| Cu | 10 | 13 | 14 | 2.2 | 8.4 | 15 |
| F | 10 | 22,157 | 20,588 | 3747 | 18173 | 29,394 |
| Li | 10 | 10 | 11 | 2.0 | 7.0 | 14 |
| Mn | 10 | 98 | 91 | 21 | 71 | 141 |
| Mo | 10 | 17 | 12 | 17 | 2.9 | 63 |
| Ni | 10 | 43 | 42 | 18 | 21 | 81 |
| Pb | 10 | 6.4 | 6.0 | 1.8 | 4.2 | 9.8 |
| Sr | 10 | 1756 | 1855 | 238 | 1330 | 1980 |
| U | 10 | 115 | 123 | 35 | 48 | 177 |
| V | 10 | 62 | 64 | 12 | 40 | 80 |
| Zn | 10 | 40 | 40 | 8.3 | 30 | 56 |
| Zr | 10 | 71 | 75 | 22 | 36 | 95 |
| La | 10 | 10.4 | 10.5 | 1.25 | 8.50 | 12.6 |
| Ce | 10 | 17.7 | 16.8 | 2.98 | 14.7 | 23.5 |
| Pr | 10 | 2.30 | 2.22 | 0.32 | 1.96 | 2.93 |
| Nd | 10 | 9.09 | 9.20 | 1.18 | 7.50 | 11.1 |
| Sm | 10 | 1.84 | 1.85 | 0.26 | 1.50 | 2.20 |
| Eu | 10 | 0.47 | 0.46 | 0.09 | 0.33 | 0.62 |
| Gd | 10 | 2.00 | 2.09 | 0.31 | 1.41 | 2.46 |
| Tb | 10 | 0.31 | 0.31 | 0.04 | 0.24 | 0.37 |
| Dy | 10 | 1.96 | 1.98 | 0.35 | 1.27 | 2.39 |
| Y | 10 | 18.8 | 18.4 | 4.39 | 9.60 | 24.2 |
| Ho | 10 | 0.44 | 0.44 | 0.08 | 0.28 | 0.54 |
| Er | 10 | 1.33 | 1.34 | 0.24 | 0.83 | 1.70 |
| Tm | 10 | 0.21 | 0.21 | 0.04 | 0.12 | 0.25 |
| Yb | 10 | 1.32 | 1.33 | 0.22 | 0.80 | 1.60 |
| Lu | 10 | 0.22 | 0.22 | 0.04 | 0.12 | 0.27 |
| ΣREY 3 | 10 | 68 | 70 | 9 | 52 | 80 |
| %HREY 4 | 10 | 40 | 41 | 5 | 29 | 45 |
| Cecn 5 | 10 | 1.13 | 1.12 | 0.04 | 1.07 | 1.19 |
| Cesn 5 | 10 | 0.85 | 0.84 | 0.03 | 0.81 | 0.90 |
| Element | N | Mean 1 | Median | StDev | Min | Max |
|---|---|---|---|---|---|---|
| Fe (wt %) | 15 | 3.24 | 3.08 | 1.23 | 1.26 | 5.00 |
| Si | 15 | 4.28 | 4.62 | 1.91 | 1.33 | 6.55 |
| Al | 15 | 0.58 | 0.60 | 0.31 | 0.17 | 1.39 |
| Si/Al | 15 | 7.41 | 7.65 | 1.95 | 3.93 | 11.4 |
| Mg | 15 | 0.62 | 0.59 | 0.22 | 0.34 | 0.93 |
| Ca | 15 | 31.0 | 30.9 | 3.08 | 27.0 | 35.7 |
| Na | 15 | 0.70 | 0.69 | 0.04 | 0.63 | 0.78 |
| K | 15 | 1.05 | 1.01 | 0.59 | 0.33 | 1.92 |
| Ti | 15 | <0.04 | <0.01 | 0.09 | <0.01 | 0.31 |
| P | 15 | 8.36 | 8.77 | 1.50 | 5.45 | 9.86 |
| Ca/P | 15 | 3.72 | 3.65 | 0.99 | 2.75 | 5.73 |
| P2O5 | 15 | 19.2 | 20.1 | 3.43 | 12.5 | 22.6 |
| S | 15 | 0.64 | 0.64 | 0.12 | 0.47 | 0.90 |
| SO3 | 15 | 1.59 | 1.60 | 0.29 | 1.17 | 2.25 |
| CO2 | 2 | 5.82 | 5.82 | 0.43 | 5.51 | 6.12 |
| LOI 2 | 15 | 16.9 | 16.8 | 5.22 | 9.97 | 24.2 |
| H2O+ | 2 | 4.05 | 4.05 | 0.07 | 4.00 | 4.10 |
| As (ppm) | 15 | 22 | 23 | 7.9 | 11 | 39 |
| Ba | 15 | 94 | 50 | 91 | 34 | 335 |
| Cl | 15 | 850 | 810 | 346 | 340 | 1630 |
| Co | 15 | 6.7 | 7.7 | 2.1 | 3.0 | 9.7 |
| Cr | 15 | 40 | 44 | 20 | 15 | 76 |
| Cu | 15 | 8.0 | 7.0 | 4.5 | 1.0 | 17 |
| F | 15 | 17,860 | 17,400 | 4085 | 11,000 | 24,800 |
| Li | 15 | 7.7 | 8.0 | 3.6 | 3.0 | 13 |
| Mn | 15 | 93 | 78 | 65 | 57 | 324 |
| Mo | 15 | 2.9 | 2.8 | 1.5 | 0.94 | 7.3 |
| Ni | 15 | 30 | 30 | 10 | 15 | 53 |
| Pb | 15 | 12 | 12 | 4.7 | 5.2 | 20 |
| Sr | 15 | 1447 | 1330 | 493 | 1110 | 2660 |
| U | 15 | 155 | 130 | 77 | 64 | 334 |
| V | 15 | 71 | 73 | 16 | 47 | 94 |
| Zn | 15 | 27 | 27 | 5.4 | 17 | 38 |
| Zr | 15 | 24 | 22 | 9.7 | 10 | 52 |
| La | 15 | 22.7 | 20.4 | 13.6 | 7.60 | 48.9 |
| Ce | 15 | 15.6 | 15.8 | 8.05 | 4.10 | 29.8 |
| Pr | 15 | 2.84 | 2.75 | 1.35 | 1.02 | 5.38 |
| Nd | 15 | 11.5 | 11.2 | 5.41 | 4.30 | 21.7 |
| Sm | 15 | 1.97 | 1.90 | 0.86 | 0.80 | 3.60 |
| Eu | 15 | 0.49 | 0.47 | 0.22 | 0.18 | 0.90 |
| Gd | 15 | 2.71 | 2.52 | 1.27 | 1.09 | 5.11 |
| Tb | 15 | 0.39 | 0.36 | 0.18 | 0.16 | 0.73 |
| Dy | 15 | 2.54 | 2.32 | 1.21 | 0.98 | 4.88 |
| Y | 15 | 37.6 | 33.8 | 21.0 | 13.6 | 78.1 |
| Ho | 15 | 0.67 | 0.61 | 0.34 | 0.25 | 1.35 |
| Er | 15 | 2.04 | 1.84 | 1.01 | 0.82 | 4.09 |
| Tm | 15 | 0.29 | 0.26 | 0.14 | 0.12 | 0.57 |
| Yb | 15 | 1.75 | 1.60 | 0.84 | 0.70 | 3.40 |
| Lu | 15 | 0.26 | 0.22 | 0.13 | 0.10 | 0.53 |
| ΣREY 3 | 15 | 103 | 95 | 55 | 36 | 209 |
| %HREY 4 | 15 | 47 | 48 | 3 | 38 | 50 |
| Cecn 5 | 15 | 0.78 | 0.81 | 0.08 | 0.59 | 0.87 |
| Cesn 5 | 15 | 0.59 | 0.61 | 0.06 | 0.45 | 0.66 |
| Element | N | Mean 1 | Median | StDev | Min | Max |
|---|---|---|---|---|---|---|
| Fe (wt %) | 10 | 2.35 | 2.34 | 1.12 | 0.80 | 3.88 |
| Si | 10 | 2.86 | 2.42 | 1.51 | 1.17 | 6.45 |
| Al | 10 | 0.71 | 0.75 | 0.28 | 0.31 | 1.28 |
| Si/Al | 10 | 4.04 | 4.35 | 2.15 | 1.60 | 7.91 |
| Mg | 10 | 0.65 | 0.64 | 0.16 | 0.43 | 0.92 |
| Ca | 10 | 31.8 | 32.2 | 2.07 | 27.1 | 34.9 |
| Na | 10 | 0.71 | 0.70 | 0.12 | 0.53 | 0.91 |
| K | 10 | 0.51 | 0.50 | 0.33 | 0.19 | 1.27 |
| Ti | 10 | 0.05 | 0.04 | 0.03 | 0.02 | 0.11 |
| P | 10 | 8.80 | 8.84 | 1.25 | 6.76 | 10.9 |
| Ca/P | 10 | 3.61 | 3.53 | 0.72 | 2.93 | 5.17 |
| P2O5 | 10 | 20.2 | 20.3 | 2.86 | 15.5 | 25.0 |
| S | 10 | 0.68 | 0.66 | 0.14 | 0.51 | 0.96 |
| SO3 | 10 | 1.70 | 1.64 | 0.35 | 1.27 | 2.40 |
| CO2 | 10 | 13.0 | 12.9 | 4.01 | 6.62 | 20.0 |
| LOI 2 | 10 | 16.7 | 16.4 | 3.84 | 11.3 | 23.8 |
| H2O+ | 10 | 3.70 | 3.90 | 0.70 | 2.45 | 4.50 |
| As (ppm) | 10 | 35 | 34 | 15 | 12 | 59 |
| Ba | 10 | 323 | 217 | 394 | 22 | 1301 |
| Cl | 10 | 506 | 457 | 202 | 199 | 895 |
| Co | 10 | 126 | 56 | 137 | 5.6 | 338 |
| Cr | 10 | 99 | 82 | 92 | 12 | 269 |
| Cu | 10 | 72 | 17 | 95 | 5.4 | 290 |
| F | 10 | 27,216 | 27,516 | 3248 | 21,912 | 32,171 |
| Li | 10 | 14 | 12 | 7.7 | 7.0 | 31 |
| Mn | 10 | 9108 | 4647 | 11,565 | 232 | 30,051 |
| Mo | 10 | 22 | 13 | 22 | 3.5 | 72 |
| Ni | 10 | 467 | 107 | 583 | 26 | 1738 |
| Pb | 10 | 19 | 13 | 14 | 4.9 | 40 |
| Sr | 10 | 1376 | 1354 | 300 | 1001 | 1990 |
| U | 10 | 62 | 36 | 84 | 5.3 | 285 |
| V | 10 | 113 | 122 | 39 | 37 | 174 |
| Zn | 10 | 87 | 93 | 41 | 39 | 160 |
| Zr | 10 | 73 | 79 | 43 | 22 | 151 |
| La | 10 | 71.1 | 57.9 | 42.5 | 23.4 | 133 |
| Ce | 10 | 36.2 | 34.4 | 20.7 | 7.60 | 77.8 |
| Pr | 10 | 10.8 | 8.48 | 6.73 | 3.83 | 22.6 |
| Nd | 10 | 48.0 | 37.1 | 30.6 | 17.0 | 102 |
| Sm | 10 | 9.09 | 7.10 | 5.93 | 3.10 | 20.1 |
| Eu | 10 | 2.45 | 1.93 | 1.57 | 0.88 | 5.23 |
| Gd | 10 | 12.9 | 10.1 | 8.43 | 4.48 | 27.1 |
| Tb | 10 | 1.71 | 1.32 | 1.10 | 0.61 | 3.53 |
| Dy | 10 | 11.8 | 8.92 | 7.60 | 4.17 | 23.1 |
| Y | 10 | 130 | 101 | 83.7 | 38.4 | 257 |
| Ho | 10 | 2.58 | 1.97 | 1.66 | 0.87 | 4.76 |
| Er | 10 | 7.75 | 5.80 | 4.97 | 2.55 | 14.8 |
| Tm | 10 | 1.17 | 0.88 | 0.75 | 0.38 | 2.32 |
| Yb | 10 | 6.65 | 4.90 | 4.36 | 2.20 | 13.9 |
| Lu | 10 | 1.19 | 0.87 | 0.79 | 0.38 | 2.52 |
| ΣREY 3 | 10 | 353 | 286 | 211 | 124 | 663 |
| %HREY 4 | 10 | 50 | 51 | 7 | 33 | 59 |
| Cecn 5 | 10 | 0.55 | 0.50 | 0.29 | 0.27 | 1.24 |
| Cesn 5 | 10 | 0.41 | 0.38 | 0.22 | 0.20 | 0.94 |
| Element | N | Mean 1 | Median | StDev | Min | Max |
|---|---|---|---|---|---|---|
| Fe (wt %) | 12 | 0.66 | 0.42 | 0.75 | 0.06 | 2.89 |
| Si | 12 | 2.33 | 1.86 | 2.11 | 0.03 | 7.15 |
| Al | 12 | 0.78 | 0.64 | 0.65 | 0.02 | 2.12 |
| Si/Al | 12 | 2.99 | 2.87 | 0.52 | 1.55 | 3.37 |
| Mg | 12 | 0.27 | 0.24 | 0.14 | 0.11 | 0.62 |
| Ca | 12 | 34.7 | 35.4 | 3.25 | 26.2 | 37.8 |
| Na | 12 | 0.80 | 0.83 | 0.15 | 0.56 | 1.09 |
| K | 12 | 0.36 | 0.27 | 0.31 | 0.02 | 0.86 |
| Ti | 12 | <0.08 | <0.05 | 0.08 | <0.01 | 0.28 |
| P | 12 | 12.7 | 12.9 | 1.27 | 9.95 | 14.0 |
| Ca/P | 12 | 2.73 | 2.66 | 0.26 | 2.58 | 3.51 |
| P2O5 | 12 | 29.1 | 29.7 | 2.90 | 22.8 | 32.2 |
| S | 12 | 0.68 | 0.71 | 0.09 | 0.54 | 0.80 |
| SO3 | 12 | 1.71 | 1.76 | 0.22 | 1.35 | 2.00 |
| CO2 | 9 | 5.12 | 5.13 | 1.22 | 3.75 | 6.96 |
| LOI 2 | 12 | 9.14 | 8.08 | 2.90 | 6.67 | 17.5 |
| H2O+ | 9 | 2.22 | 2.10 | 0.32 | 1.90 | 2.80 |
| As (ppm) | 12 | 5.2 | 5.0 | 1.7 | 3.0 | 9.0 |
| Ba | 12 | 483 | 81 | 725 | 20 | 1900 |
| Cl | 12 | 1208 | 755 | 958 | 310 | 3410 |
| Co | 12 | 21 | 12 | 22 | 1.7 | 67.8 |
| Cr | 12 | 21 | 14 | 15 | 7.0 | 51.0 |
| Cu | 12 | 77 | 64 | 56 | 15 | 205 |
| F | 12 | 25,767 | 28,250 | 5461 | 12,300 | 30,300 |
| Li | 12 | <6.6 | <6.0 | 5.9 | <1.0 | 20 |
| Mn | 12 | 1210 | 775 | 1343 | 46 | 3873 |
| Mo | 12 | 3.1 | 2.8 | 2.3 | 0.75 | 7.3 |
| Ni | 12 | 116 | 61 | 115 | 21 | 366 |
| Pb | 12 | 7.0 | 6.3 | 5.1 | 1.1 | 15 |
| Sr | 12 | 1223 | 1175 | 338 | 724 | 1920 |
| U | 12 | 6.7 | 6.3 | 1.9 | 4.7 | 11 |
| V | 12 | 33 | 33 | 10 | 22 | 59 |
| Zn | 12 | 51 | 49 | 20 | 26 | 100 |
| Zr | 12 | 91 | 79 | 52 | 9.5 | 211 |
| La | 12 | 102 | 79.7 | 61.8 | 16.6 | 214 |
| Ce | 12 | 15.0 | 13.1 | 7.56 | 3.10 | 30.2 |
| Pr | 12 | 14.4 | 9.21 | 10.3 | 2.85 | 36.8 |
| Nd | 12 | 60.6 | 38.8 | 43.6 | 11.9 | 153 |
| Sm | 12 | 11.5 | 7.05 | 8.82 | 2.40 | 31.1 |
| Eu | 12 | 3.26 | 2.16 | 2.43 | 0.73 | 8.31 |
| Gd | 12 | 18.2 | 13.2 | 12.8 | 3.47 | 42.5 |
| Tb | 12 | 2.44 | 1.87 | 1.65 | 0.46 | 5.67 |
| Dy | 12 | 17.4 | 14.5 | 11.3 | 3.03 | 38.7 |
| Y | 12 | 224 | 205 | 132 | 38.9 | 437 |
| Ho | 12 | 4.19 | 3.75 | 2.54 | 0.71 | 8.69 |
| Er | 12 | 13.4 | 12.3 | 7.88 | 2.29 | 26.9 |
| Tm | 12 | 1.88 | 1.77 | 1.10 | 0.34 | 3.88 |
| Yb | 12 | 12.9 | 12.3 | 7.62 | 2.40 | 27.2 |
| Lu | 12 | 1.98 | 1.92 | 1.19 | 0.35 | 4.19 |
| ΣREY 3 | 12 | 503 | 434 | 292 | 112 | 1022 |
| %HREY 4 | 12 | 60 | 58 | 8 | 47 | 74 |
| Cecn 5 | 12 | 0.25 | 0.17 | 0.34 | 0.06 | 1.29 |
| Cesn 5 | 12 | 0.19 | 0.13 | 0.25 | 0.05 | 0.98 |
| Element | N | Mean 1 | Median | StDev | Min | Max |
|---|---|---|---|---|---|---|
| Fe (wt %) | 18 | 0.46 | 0.39 | 0.39 | 0.01 | 1.38 |
| Si | 18 | 1.67 | 1.26 | 1.44 | 0.32 | 5.28 |
| Al | 18 | 0.58 | 0.43 | 0.54 | 0.05 | 1.88 |
| Si/Al | 18 | 2.88 | 3.13 | 1.10 | 2.19 | 6.01 |
| Mg | 18 | 0.21 | 0.20 | 0.11 | 0.04 | 0.45 |
| Ca | 18 | 35.4 | 36.3 | 2.08 | 30.4 | 37.9 |
| Na | 18 | 0.66 | 0.66 | 0.11 | 0.50 | 0.85 |
| K | 18 | <0.17 | <0.06 | 0.19 | <0.01 | 0.69 |
| Ti | 18 | <0.05 | <0.04 | 0.05 | 0.004 | 0.22 |
| P | 18 | 13.5 | 13.8 | 0.84 | 11.8 | 14.6 |
| Ca/P | 18 | 2.62 | 2.63 | 0.04 | 2.58 | 2.77 |
| P2O5 | 18 | 31.0 | 31.6 | 1.93 | 27.0 | 33.5 |
| S | 18 | 0.71 | 0.72 | 0.15 | 0.49 | 0.94 |
| SO3 | 18 | 1.77 | 1.79 | 0.37 | 1.22 | 2.35 |
| CO2 | 18 | 6.35 | 6.40 | 1.35 | 3.84 | 7.99 |
| LOI 2 | 18 | 8.73 | 8.58 | 1.44 | 5.88 | 11.7 |
| H2O+ | 5 | 2.14 | 2.34 | 0.33 | 1.76 | 2.45 |
| As (ppm) b | 0 | -- | -- | -- | -- | -- |
| Ba | 13 | 4401 | 267 | 521 | 195 | 2140 |
| Cl | 18 | 497 | 400 | 646 | 50 | 2980 |
| Co | 13 | 11 | 10 | 5.3 | 4.0 | 23 |
| Cr | 13 | 18 | 18 | 7.1 | 9.0 | 33 |
| Cu | 15 | 38 | 34 | 20 | 15 | 89 |
| F | 18 | 39,011 | 39,250 | 4078 | 31,800 | 46,000 |
| Li | 13 | 5.5 | 5.0 | 2.7 | 2.0 | 10 |
| Mn | 18 | 709 | 300 | 1550 | 75 | 6816 |
| Mo | 12 | 5.5 | 5.5 | 2.2 | 1.0 | 9.0 |
| Ni | 13 | 23 | 21 | 15 | 9.0 | 71 |
| Pb | 13 | 151 | 146 | 41 | 91 | 218 |
| Sr | 15 | 1563 | 1410 | 453 | 1000 | 2580 |
| U | 16 | 12 | 8.5 | 7.3 | 6.3 | 30 |
| V | 13 | 35 | 35 | 10 | 21 | 50 |
| Zn | 13 | 80 | 63 | 49 | 38 | 205 |
| Zr | 13 | 44 | 38 | 18 | 20 | 77 |
| La | 18 | 180 | 189 | 89.2 | 7.20 | 372 |
| Ce | 18 | 28.5 | 29.4 | 17.9 | 2.00 | 74.0 |
| Pr | 18 | 23.1 | 20.0 | 13.7 | 1.00 | 49.3 |
| Nd | 18 | 102 | 88.9 | 60.2 | 4.40 | 222 |
| Sm | 18 | 20.3 | 17.3 | 12.9 | 0.97 | 46.8 |
| Eu | 18 | 5.33 | 4.77 | 3.21 | 0.22 | 11.8 |
| Gd | 18 | 32.2 | 29.9 | 19.1 | 1.40 | 73.9 |
| Tb | 18 | 4.69 | 4.45 | 2.80 | 0.18 | 10.7 |
| Dy | 18 | 30.8 | 29.6 | 17.8 | 1.40 | 69.7 |
| Y | 13 | 441 | 415 | 233 | 145 | 976 |
| Ho | 18 | 8.16 | 8.38 | 4.64 | 0.41 | 19.2 |
| Er | 18 | 24.6 | 25.3 | 13.8 | 1.20 | 57.3 |
| Tm | 18 | 3.51 | 3.50 | 1.99 | 0.20 | 8.30 |
| Yb | 18 | 21.7 | 20.8 | 12.4 | 1.30 | 52.2 |
| Lu | 13 | 3.74 | 3.41 | 2.00 | 1.03 | 8.01 |
| ΣREY 3 | 13 | 935 | 824 | 490 | 250 | 1992 |
| %HREY 4 | 13 | 62 | 62 | 5 | 56 | 70 |
| Cecn 5 | 18 | 0.20 | 0.19 | 0.08 | 0.05 | 0.35 |
| Cesn 5 | 18 | 0.15 | 0.14 | 0.06 | 0.04 | 0.27 |
© 2016 by the authors; licensee MDPI, Basel, Switzerland. This article is an open access article distributed under the terms and conditions of the Creative Commons Attribution (CC-BY) license (http://creativecommons.org/licenses/by/4.0/).
Share and Cite
Hein, J.R.; Koschinsky, A.; Mikesell, M.; Mizell, K.; Glenn, C.R.; Wood, R. Marine Phosphorites as Potential Resources for Heavy Rare Earth Elements and Yttrium. Minerals 2016, 6, 88. https://doi.org/10.3390/min6030088
Hein JR, Koschinsky A, Mikesell M, Mizell K, Glenn CR, Wood R. Marine Phosphorites as Potential Resources for Heavy Rare Earth Elements and Yttrium. Minerals. 2016; 6(3):88. https://doi.org/10.3390/min6030088
Chicago/Turabian StyleHein, James R., Andrea Koschinsky, Mariah Mikesell, Kira Mizell, Craig R. Glenn, and Ray Wood. 2016. "Marine Phosphorites as Potential Resources for Heavy Rare Earth Elements and Yttrium" Minerals 6, no. 3: 88. https://doi.org/10.3390/min6030088