Article

Novel Insights into the Hydroxylation Behaviors of α-Quartz (101) Surface and its Effects on the Adsorption of Sodium Oleate

1
Key Laboratory of Hunan Province for Clean and Efficient Utilization of Strategic Calcium-containing Mineral Resources, School of Minerals Processing and Bioengineering, Central South University, Changsha 410083, China
2
Key Laboratory of Hunan Province for Comprehensive Utilization of Complex Copper-Lead Zinc Associated Metal Resources, Hunan Research Institute for Nonferrous Metals, Changsha 410100, China
3
Institute of Theoretical and Computational Chemistry, School of Chemistry and Chemical Engineering, Nanjing University, Nanjing 210023, China
*
Authors to whom correspondence should be addressed.
Minerals 2019, 9(7), 450; https://doi.org/10.3390/min9070450
Submission received: 9 May 2019 / Revised: 11 July 2019 / Accepted: 18 July 2019 / Published: 19 July 2019

Abstract

:
A scientific and rigorous study on the adsorption behavior and molecular mechanism of collector sodium oleate (NaOL) on a Ca2+-activated hydroxylated α-quartz surface was performed through experiments and density functional theory (DFT) simulations. The rarely reported hydroxylation behaviors of water molecules on the α-quartz (101) surface were first innovatively and systematically studied by DFT calculations. Both experimental and computational results consistently demonstrated that the adsorbed calcium species onto the hydroxylated structure can significantly enhance the adsorption of oleate ions, resulting in a higher quartz recovery. The calculated adsorption energies confirmed that the adsorbed hydrated Ca2+ in the form of Ca(H2O)3(OH)+ can greatly promote the adsorption of OL on hydroxylated quartz (101). In addition, Mulliken population analysis together with electron density difference analysis intuitively illustrated the process of electron transfer and the Ca-bridge phenomenon between the hydroxylated surface and OL ions. This work may offer new insights into the interaction mechanisms existing among oxidized minerals, aqueous medium, and flotation reagents.

1. Introduction

Quartz is one of the main gangue minerals in iron ores [1], and it is also the common gangue mineral for most metal oxidized ores, non-metal oxidized ores, sulfide ores, silicate minerals, phosphate minerals [2,3]. There are many varieties of quartz in nature, such as α-quartz, β-quartz, coesite, and stishovite, among which α-quartz is the most widely distributed, and is the main rock-forming minerals of magmatic, sedimentary, and metamorphic rocks [4]. In addition, as an important industrial raw material, quartz has been widely used in electronic devices, optical instruments, glass raw materials, abrasive materials, refractories, and other aspects [5,6,7,8]. Therefore, the separation of quartz from other minerals makes great sense for mineral processing and relevant industries.
Flotation, one of the most efficient mineral processing methods which selectively concentrates target minerals based on their physicochemical properties and differences resulting from the intrinsic properties of ores and modification of flotation reagents, has been widely employed in the separation of iron ores [9,10,11]. It is generally acknowledged that cationic/anionic reverse flotation is one of the most efficient technologies for the removal of quartz and enrichment of iron-containing minerals from iron ores [12]. The collectors of quartz reverse flotation could be classified into cationic collectors and anion collectors, among which cationic collectors are sensitive to slime and cause large foam viscosity while anion collectors have good selectivity and adaptability to ores [13]. Therefore, anion collectors (e.g., sodium oleate) are usually used in practical production to reduce SiO2 content to obtain high-grade iron concentrate [14]. However, low recovery of quartz is gained only when sodium oleate is used. In most cases, before the addition of sodium oleate, metal ion activators should be previously added to the pulp and adsorbed onto the quartz’s surface as active sites. Actually, the activation mechanisms of metal ions on mineral surfaces have been research hotspots in the field of flotation [15,16]. Divalent ions, such as Cu2+, Pb2+, Ca2+, etc., are widely used to activate specific mineral surfaces [15,17,18,19]. Calcium ion possesses more widespread applications for separating quartz from other valuable minerals compared with most other metallic ions [17,20]. The activation of calcium ion on quartz has been previously studied by other scholars through various characterization methods and theory calculations, but no consistent conclusion has been reached. For instance, Shi et al. [21] considered that Ca(OH)2 precipitation was the main activation component of quartz; Guo et al. [2] concluded that the activation of calcium ions on quartz was due to the preferential chemical adsorption of Ca2+ on oxygen sites of quartz surface; and Gong et al. [22] believed that the adsorption of sodium oleate on the quartz surface was mainly attributed to the activation of Ca(OH)+.
In recent years, with the rapid developments of theoretical and computational chemistry, more effective methods can be adopted to visually investigate the interaction mechanisms between reagents and minerals at a microscopic level. Density functional theory (DFT) calculation is a kind of simulation method whose application in mineral processing is relatively mature [12,23] and it has great potential to provide novel and microcosmic insights into the flotation process [24,25] which cannot be obtained in conventional experimental studies. For example, Zhu et al. [12] intensively studied the interaction mechanism between collector α-Bromolauric acid and Ca2+-activated quartz (101) surface, and concluded that the essence of activation and flotation of quartz was that Ca(OH)+ ions served as a bridge between the collector and the mineral surface. Rath et al. [26] found that magnetite could form the most stable surface complexes with oleate through comparing the interaction of oleate with hematite, magnetite, and goethite based on DFT calculation. Zhao et al. [27] investigated the adsorption behaviors of Ca(OH)+ on pyrite, marcasite, and pyrrhotite surfaces, and discussed in depth the corresponding bonding mechanism and electron transfer using DFT simulation. Long et al. [28] confirmed by researching the effects of the three typical thiol collectors on galena and sphalerite in the presence of water on the basis of the first principles, that there existed distinct differences in the electron distribution, the atoms’ activity on the mineral’s surface, and the interactions between the collectors and the minerals. It is worth mentioning that metal ions in aqueous systems will experience complex behaviors to generate hydrated metal ions cluster [18,29,30,31], which has profound impacts on the interactions between collectors and the mineral surface. Wang et al. [32] conducted an in-depth simulations study on the activation mechanism of calcium ions on quartz and found that the major activation component of calcium ions adsorbed on the surface of quartz was (Ca(H2O)4)2+ which transformed into (Ca(H2O)3(OH))+ after the adsorption process. Hu et al. [15], by studying the activation mechanism of calcium ion on a sericite surface, concluded that adsorption onto a sericite (001) surface of hydrated calcium ions in the form of (Ca(H2O)3(OH))+ was the most favorable. According to the latest and thorough studies mentioned above regarding the activation mechanism of calcium ions, it is believed that the Ca(H2O)3(OH)+ cluster acts as the main active components in alkaline solution. Moreover, water molecules play an indispensable role in the flotation process [28,33] and quartz possesses strong hydrophilicity [34,35]. De Leeuw’s first principles calculations show that the existence of hydration behavior has a very important influence on mineral surface structures and reactivities, and a solvent effect must be considered in the DFT simulations of the mineral flotation process in order to accurately predict the affinity between flotation reagents and mineral surface [36]. Pradip et al. [37] believe that flotation reagents and mineral surfaces need to match each other in spatial structure and properties to display productive effects. Therefore, only when the hydroxylation behaviors of water molecules on quartz surfaces are firstly fully considered in DFT calculations can the adsorption and flotation mechanisms of flotation reagents onto quartz surfaces be reasonably and accurately investigated.
Unfortunately, although many in-depth studies on the activation or flotation of quartz have been carried out through experiments and theoretical simulations, there are two serious shortcomings as follows [12,14,22,32]: There is a lack of rigorous and systematic studies on the hydroxylation behaviors of quartz in aqueous solution, as well as a lack of further investigations on the microscopic mechanisms between flotation agents and pre-hydroxylated quartz. Therefore, the main objective of this study was to firstly systematically study the rarely reported strong hydroxylation behaviors of water molecules on quartz surfaces and further to rigorously research the adsorption and flotation mechanisms of flotation reagents onto hydroxylated quartz structures. The adopted experimental characterization methods included X-ray diffraction (XRD) spectrums, micro-flotation tests, zeta potential tests and Fourier transform infrared (FTIR) spectrums. In addition, the interaction mechanism at micro aspects were further investigated by first principles DFT calculations. This work may provide novel insights into the interaction mechanisms existing among aqueous medium, α-quartz surfaces, calcium ions, and anionic collectors.

2. Experimental and Computational Details

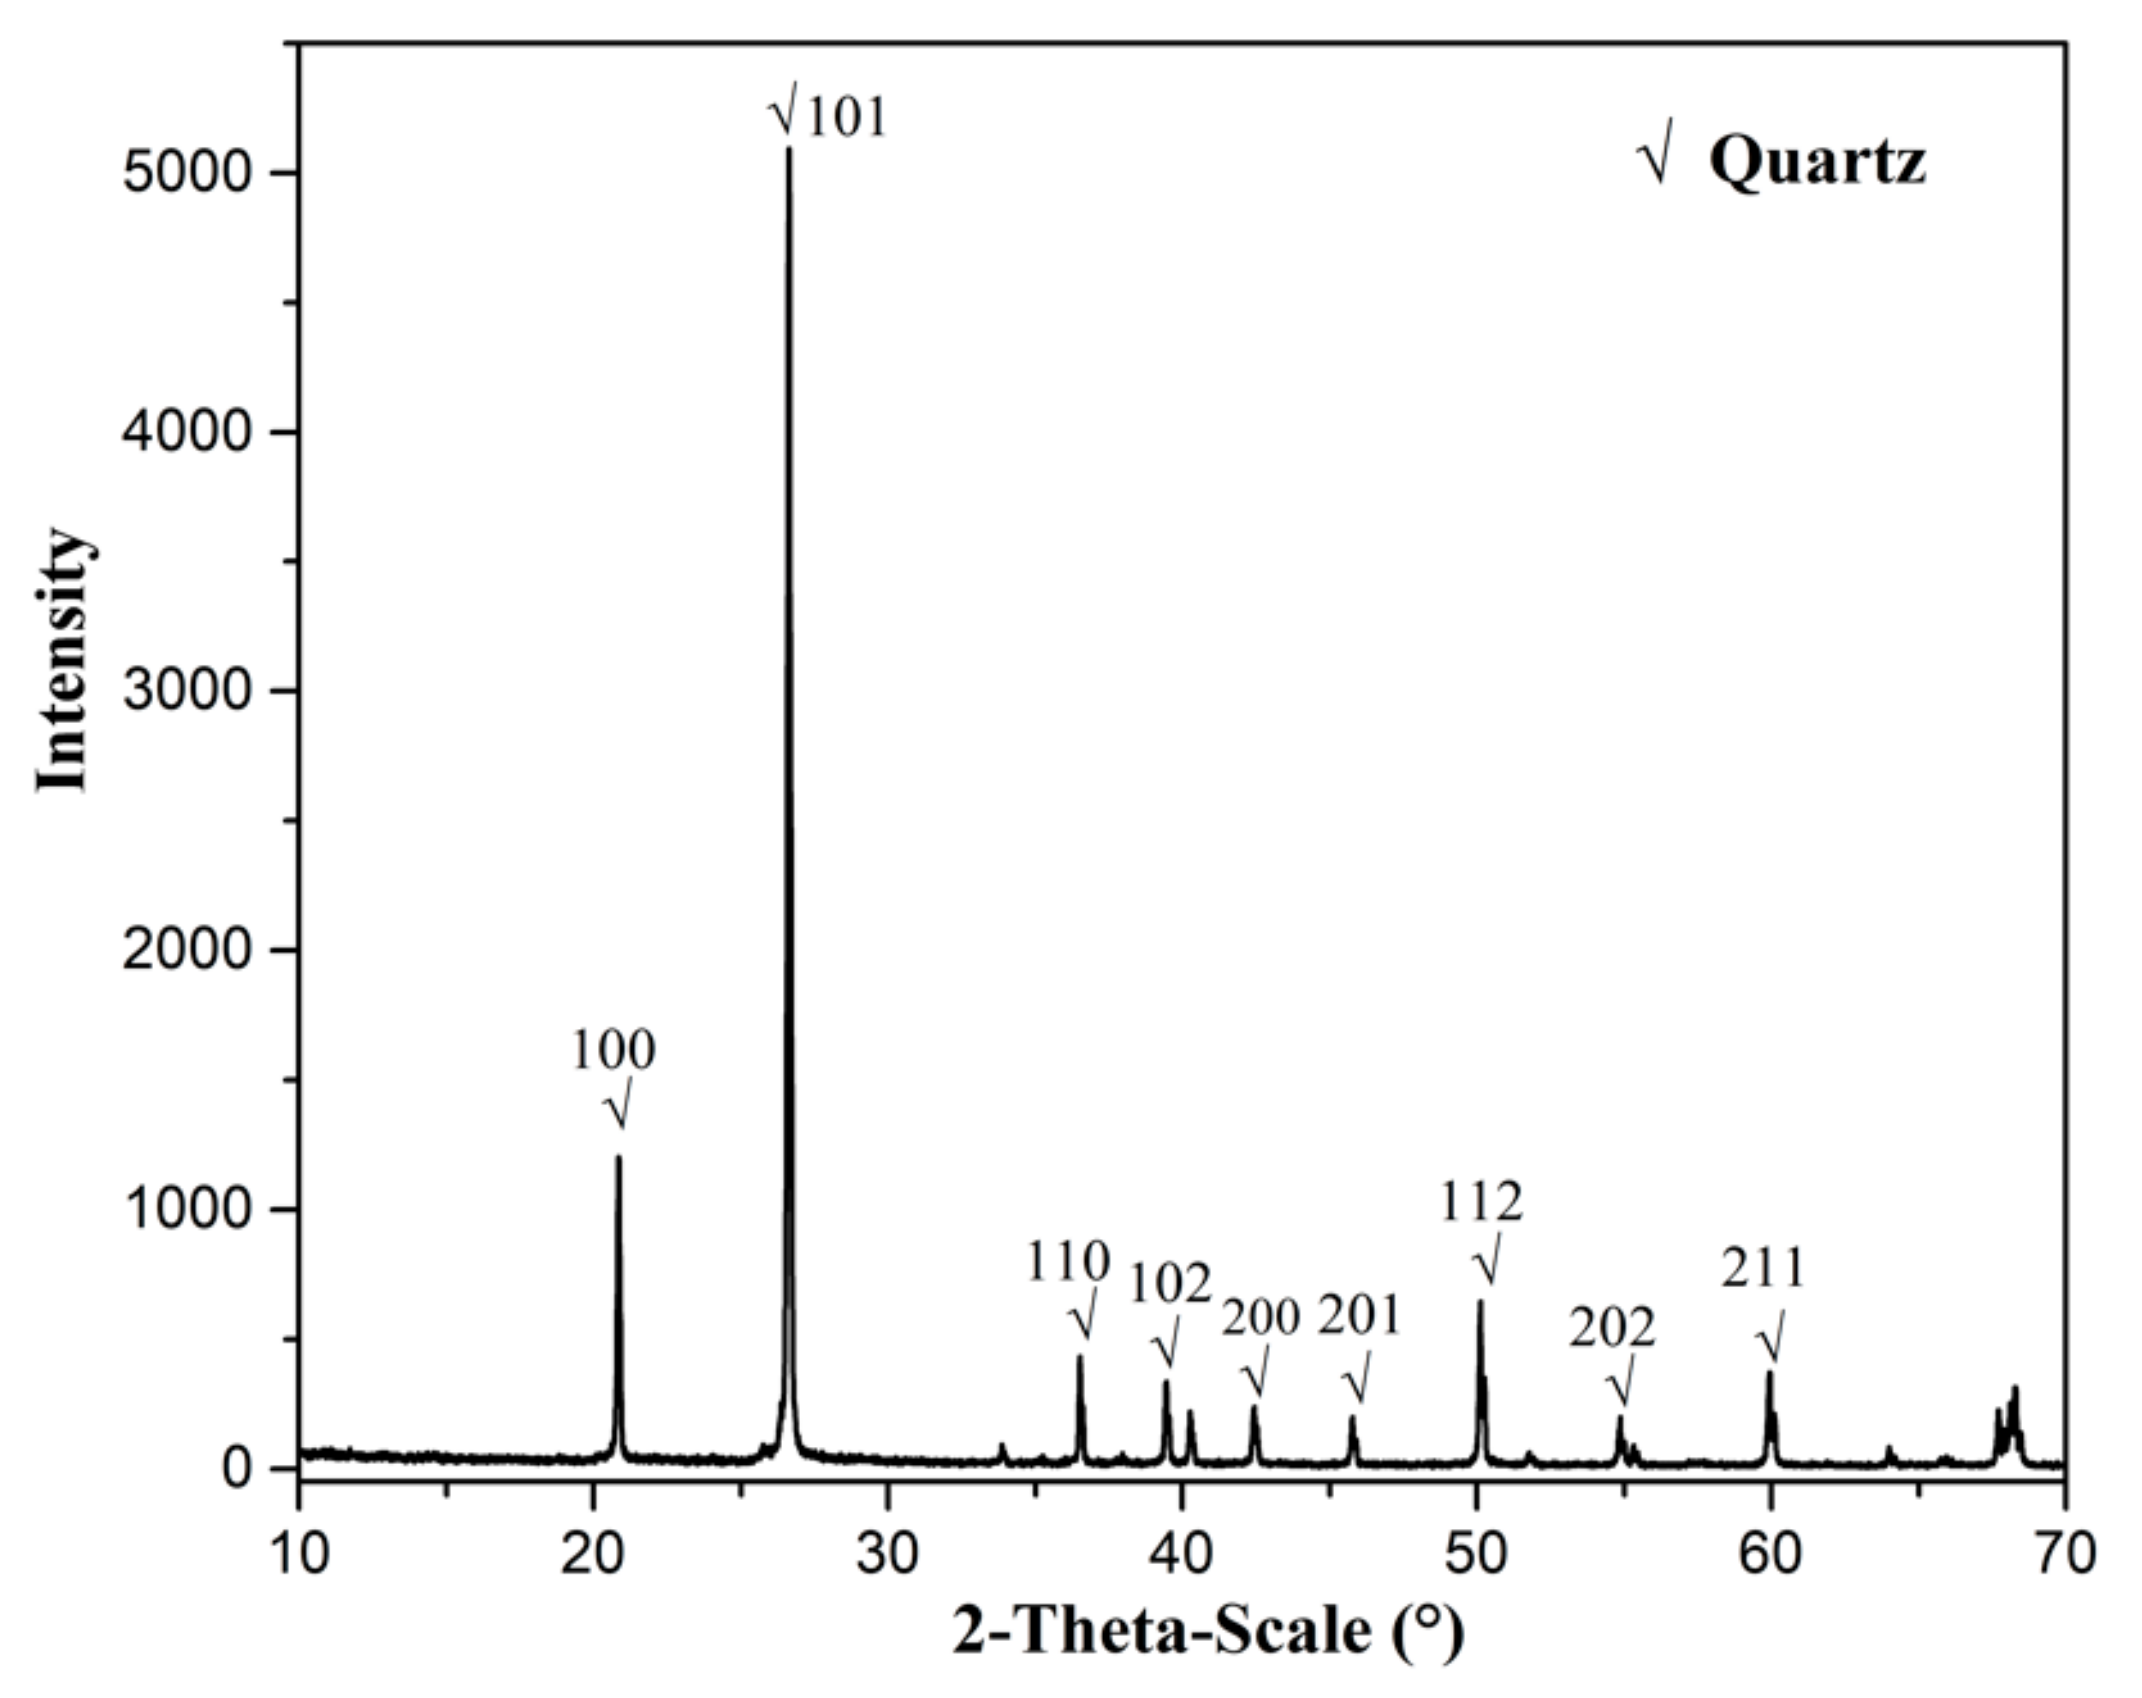
2.1. Materials and Reagents

The high-purity massive quartz crystal sample was smashed into small pieces with a maximum particle size of 30 mm by a hammer and sent to the JC6 jaw crusher for crushing to prepare smaller particles with a size below 2 mm. The crushed minerals were ground with a porcelain mortar and then sieved, among which a partial fraction (−38 μm) was further ground using an agate mortar to obtain a particle size less than 5 μm for various analyses and the sample within the range of 38–74 µm was used for micro-flotation tests [38]. The X-ray diffraction (XRD) spectrum of the sample is shown in Figure 1. The chemical element analysis results indicated that the content of SiO2 in the quartz samples was as high as 97.63%, and the sample contained very small amounts of impurities (0.035% Ca and 0.025% Fe), which was pure enough for the following tests. In the experiments, chemical pure sodium oleate (NaOL), analytical pure calcium chloride (CaCl2), sodium hydroxide (NaOH), hydrochloric acid (HCl), potassium nitrate (KNO3), and deionized water were used.

2.2. Methodology

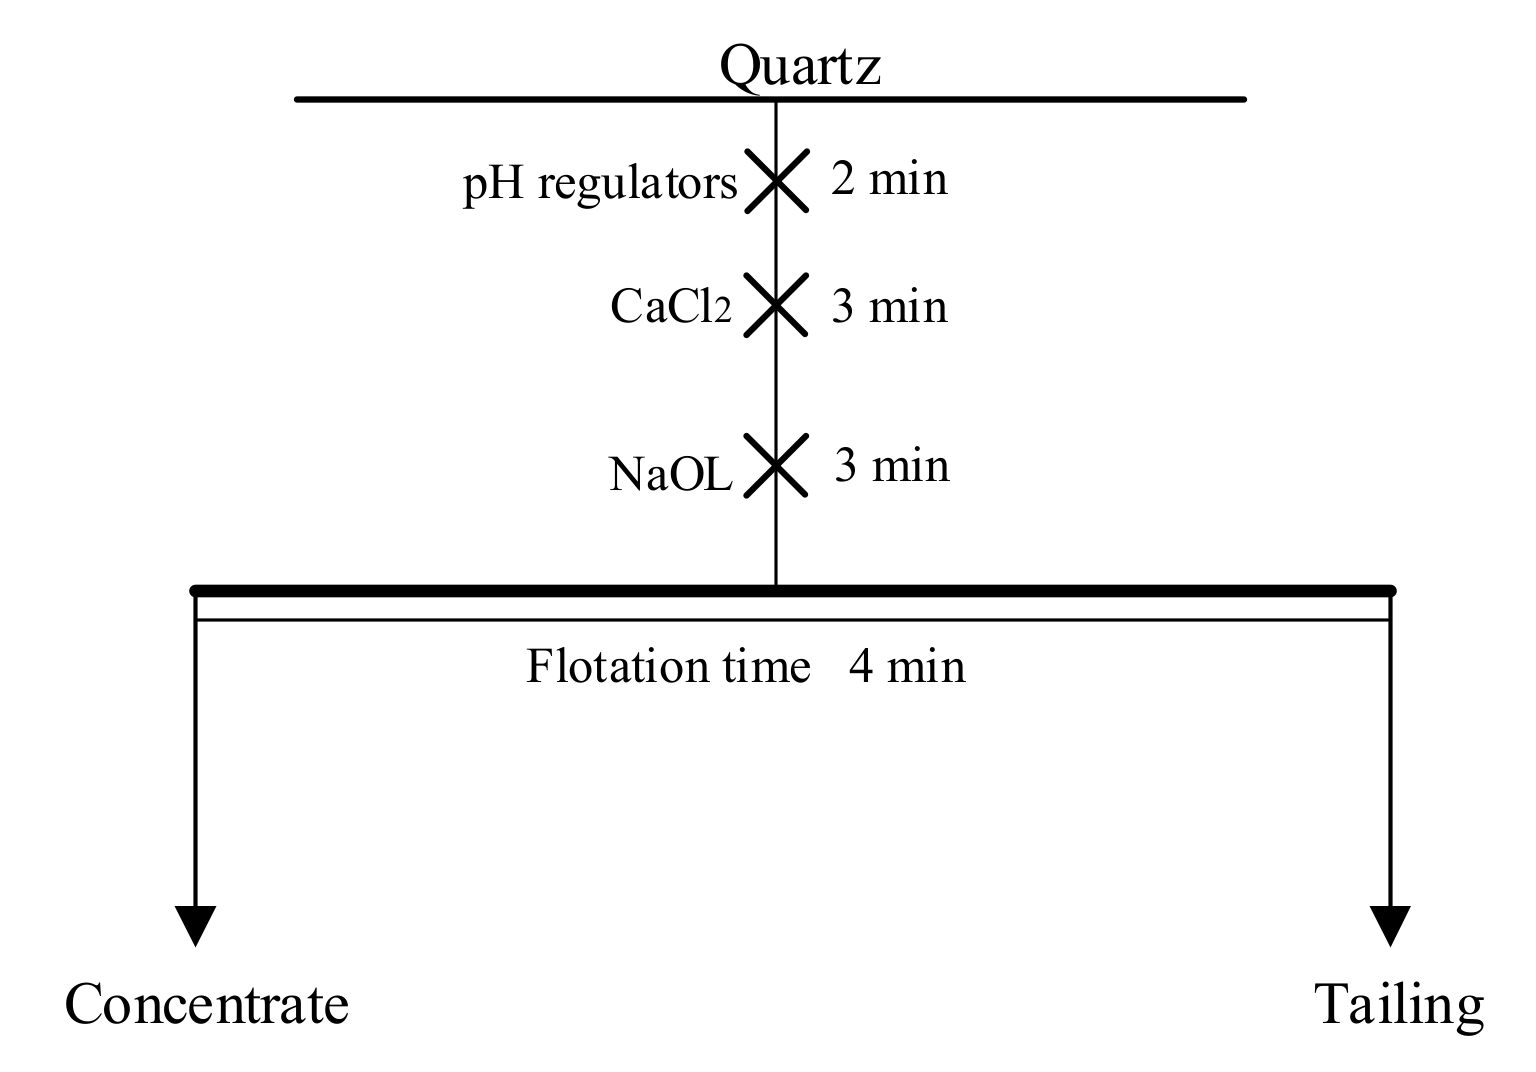
2.2.1. Micro-Flotation

All flotation tests were carried out using an XFG flotation machine with a 40 mL cell operated at 1650 rpm. In three parallel tests, 35 mL deionized water and 2 g pure mineral sample were mixed and stirred [15]. Firstly, pH regulators were added to adjust the flotation pulp to the specified pH value in the subsequent 2 min. Secondly, the pulp was conditioned with CaCl2 for 3 min. Finally, a certain amount of NaOL was added into the cell with a 3 min conditioning time. The scraping operation lasted for 4 min and the concentrate was scraped out in the form of mineralized froth every 5 s. It should be mentioned that the addition of flotation agents would make the pH of the slurry fluctuate, so the pH regulators were discontinuously added to keep the pH of the slurry stable until 1 min before scraping. The products were filtrated, dried, and weighed, and the recovery was calculated based on the solid weight distribution among the two products [38]. The specific process of flotation tests is presented in Figure 2.

2.2.2. Zeta Potential Measurements

Zeta potentials were measured by Malvern ZETASIZER Nano-Z instrument at 25 °C. The suspension with a mass concentration of 1% (40 mg –5 μm quartz: 40 mL aqueous solution) containing 1 × 10⁻² mol/L KNO3, serving as a background electrolyte, was agitated for 5 min to make the quartz particles fully disperse [35]. The desired reagent(s) was added in accordance with the actual flotation test conditions. Similar to the actual micro-flotation process, pH regulators were discontinuously added to adjust the slurry to the specified pH range until 5 min before stirring stops (note: 1 min before scraping operation, plus 4 min during bubble scraping process) during the zeta potential measurements. After 5 min standing time, a small amount of supernatant was slowly injected into a test cell with a syringe. Each sample result presented is the average of three independent measurements with a measurement tolerance of ±3 mV.

2.2.3. FTIR Spectroscopy

Characteristic peaks in the FTIR spectrums can be used to analyze the adsorption behaviors between reagents and the mineral surface [35,39]. The pure mineral was first ground to −2 μm in an agate mortar and then treated according to the procedures described in the flotation flowsheet, and finally measured by Fourier transform infrared spectroscopy (FTIR) Vertex 80v manufactured by Bruker, Germany. This equipment can create a vacuum environment to guarantee the test results are accurate enough for FTIR analysis. The infrared spectra of samples were recorded by the FTIR spectrometer at a resolution of 4 cm−1 in the range of 400 cm−1 to 4000 cm−1 at room temperature [33].

2.2.4. Computational Details

In this work, all periodic calculations were performed by utilizing the Cambridge Serial Total Energy Package (CASTEP) module [40] in Materials Studio 2017. A periodic model of the quartz bulk phase was built from the XRD crystal structure obtained from the American Mineralogist Crystal Structure Database [41]. Firstly, the quartz unit-cell underwent crystal optimization convergence tests for exchange-correlation functions and the k-point set mesh and cutoff energy, respectively [12]. Afterwards, the optimized quartz lattice parameters were compared with the obtained experimental values to ascertain the optimum parameters. The Fast Fourier Transformation (FFT) grid quality was set to a fine level. For self-consistent iteration, the density mixing electronic minimizer was used with a self-consistent field (SCF) tolerance of 2.0 × 10⁻⁶ eV/atom. The convergence tolerance during the entire simulation work set for the energy, maximum force, and maximum displacement tolerance was 2.0 × 10⁻⁵ eV/atom, 0.05 eV/Å, and 0.002 Å, respectively. All the optimal parameters confirmed in the unit-cell geometry optimization tests remained constant in all subsequent simulation jobs unless otherwise mentioned.
Surface energy is defined as the work needed to generate a unit’s new surface [25]. For higher surface energy, the corresponding cleavage surface is hard to create and thermodynamically unstable, which can serve as a good measurement for judging the stability of a specified surface [25,42]. According to previous literature and aforementioned XRD results, we found that the quartz (101) surface was the most stable cleavage plane [12,32,43]. Therefore, our subsequent simulation was based on the quartz (101) surface. The surface slab was first created by cleaving the optimized quartz bulk unit-cell at the (101) cleavage plane; then, the symmetric Si9O18 surface slab was obtained by adjusting the top position and the thickness position. The final periodic structure, whose cell formula was Si54O108, was obtained by using (2 × 3 × 1) super-cell with 20 Å vacuum thickness, which is sufficient for the prevention of interactions among slabs [32,43]. According to a previous study [35], the contact angle of quartz in distilled water is lower than 25°, which implies that the surface of quartz is highly hydrophilic. Owing to its strong hydrophilicity, it is obligatory to innovatively study the rarely reported hydroxylation behaviors between quartz (101) surface and water molecules in DFT simulations. Usually, the adsorption energy of a spontaneous chemical reaction is subtractive, and the more negative the adsorption energy, the more stable the hydroxylation configuration obtained [25].
According to the work of Wang et al. [32], the hollow site of the same Si center and the top sites of O atoms are implied as the major adsorption sites, thus we put adsorbates in the vacancy above the Si atom (this Si atom was attached to three O atoms and at the center of the O atoms) on the hydroxylated quartz (101) surface to obtain a relatively stable adsorption configuration in each simulation. The interaction strength of different adsorbates on quartz surface (101) can also be measured by the adsorption energy, which is regarded as a good measure to assess the relative interaction strength [32,44]. It is worth mentioning that the reasonable initial oleate ion structure was obtained from the National Center for Biotechnology Information [45]. Under the comprehensive consideration of acceptable calculation accuracy and affordable calculation cost, the Si18O36 layer at the bottom of the quartz periodic model and counterions (Na+, Cl) were constrained, while the rest of the parts were allowed structural relaxation within constrained volume during all optimization calculations. The k-point set was changed to gamma point and energy-cutoff was set as 381.0 eV for the subsequent structural optimization calculations.

3. Results and Discussion

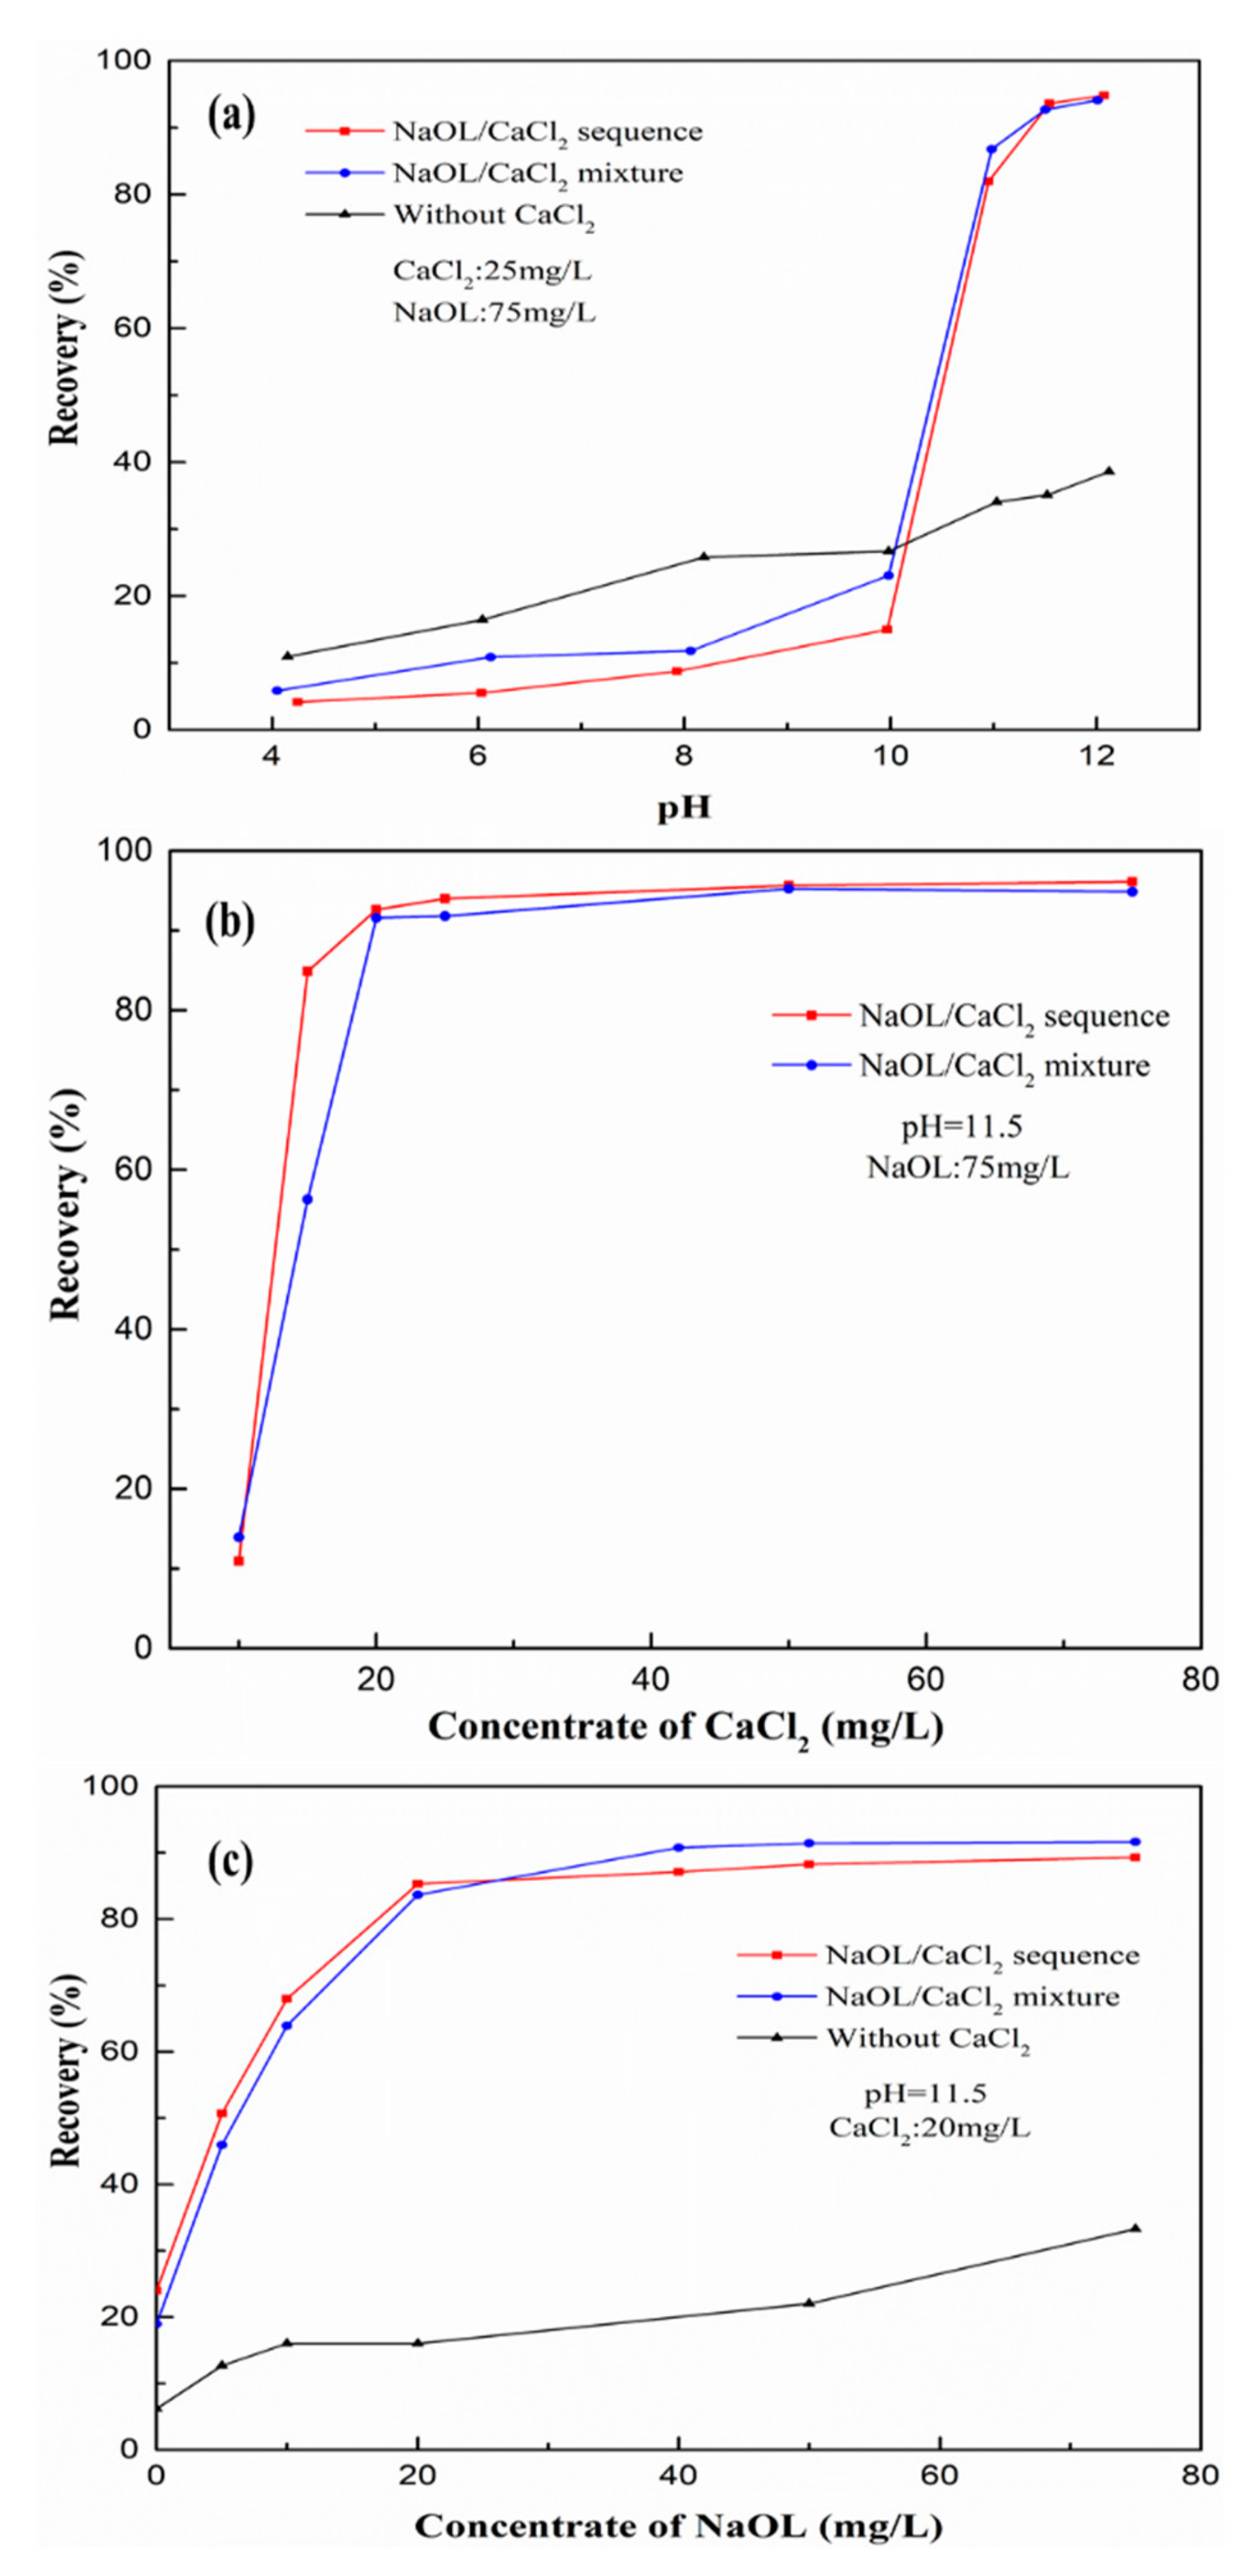
3.1. Micro-Flotation Tests

The flotation recovery of quartz as a function of pH is presented in Figure 3a. When CaCl2 was absent, the recovery of quartz increased slightly in the whole range of pH tests. The maximum recovery of quartz at pH 12 was only 38%, which is consistent with the flotation phenomena of Wang [46]. This indicates that NaOL has a poor collecting ability for quartz. According to research by Tian et al. [47], it was found that the dosing methods of benzohydroxamic acid and lead nitrate have a great influence on the flotation behavior of cassiterite. Therefore, it is worthwhile to study the effects of mixed-dosing and sequential-dosing methods of NaOL and CaCl2 on quartz. Obviously, when the CaCl2 concentration is selected as 25 mg/L, the recovery trend of quartz in the two methods (sequential dosing and mixed dosing) is consistent and there is basically no difference in the value, with the pH increasing. However, when the pH value is lower than 10, the recovery of quartz increases slowly with increasing pH, and the recovery is lower than that without CaCl2. The reason behind this phenomenon can be explained as the generation of Ca(IO)2, which consumes a lot of oleate ions. As pH continues to increase, the recovery of quartz increases sharply and reaches a balance after the pH increases to 11.5. At this point, the recovery was around 93%, which was much higher than that without CaCl2. This means that CaCl2 can greatly improve the collecting ability of NaOL for quartz in a reasonable pH range. Therefore, the optimal pH range of 11.5–12.0 was chosen for the succeeding flotation tests.
Figure 3b shows the recovery of quartz as a function of CaCl2 concentration. When the pH value was 11.5 and NaOL concentration was fixed at 75 mg/L, with an increase in CaCl2 concentration from 10 mg/L to 75 mg/L, the quartz recovery first increased sharply to the maximum value of about 92% and then reached equilibrium. The difference in dosing methods had little effect on the final experimental results. The proper CaCl2 dosage was determined as 20 mg/L.
Figure 3c illustrates the recovery of quartz as a function of NaOL concentration. When the pH value of the slurry was fixed at 11.5, for the condition without CaCl2 activation, as the NaOL concentration increased from 0 mg/L to 75 mg/L, the recovery of quartz gradually and consistently increased to a maximum value about 33% at 75 mg/L. When CaCl2 existed, the trend in quartz recovery using the two dosing methods both increased rapidly and then remained stable with NaOL concentration increasing, and the recovery of the same dosage was basically the same. The equilibrium recovery increased by 70% compared with that of NaOL alone at 40 mg/L, which indicates that the addition of CaCl2 significantly improves the flotation performance of NaOL on quartz. The most reasonable NaOL dosage can be determined as 40 mg/L.

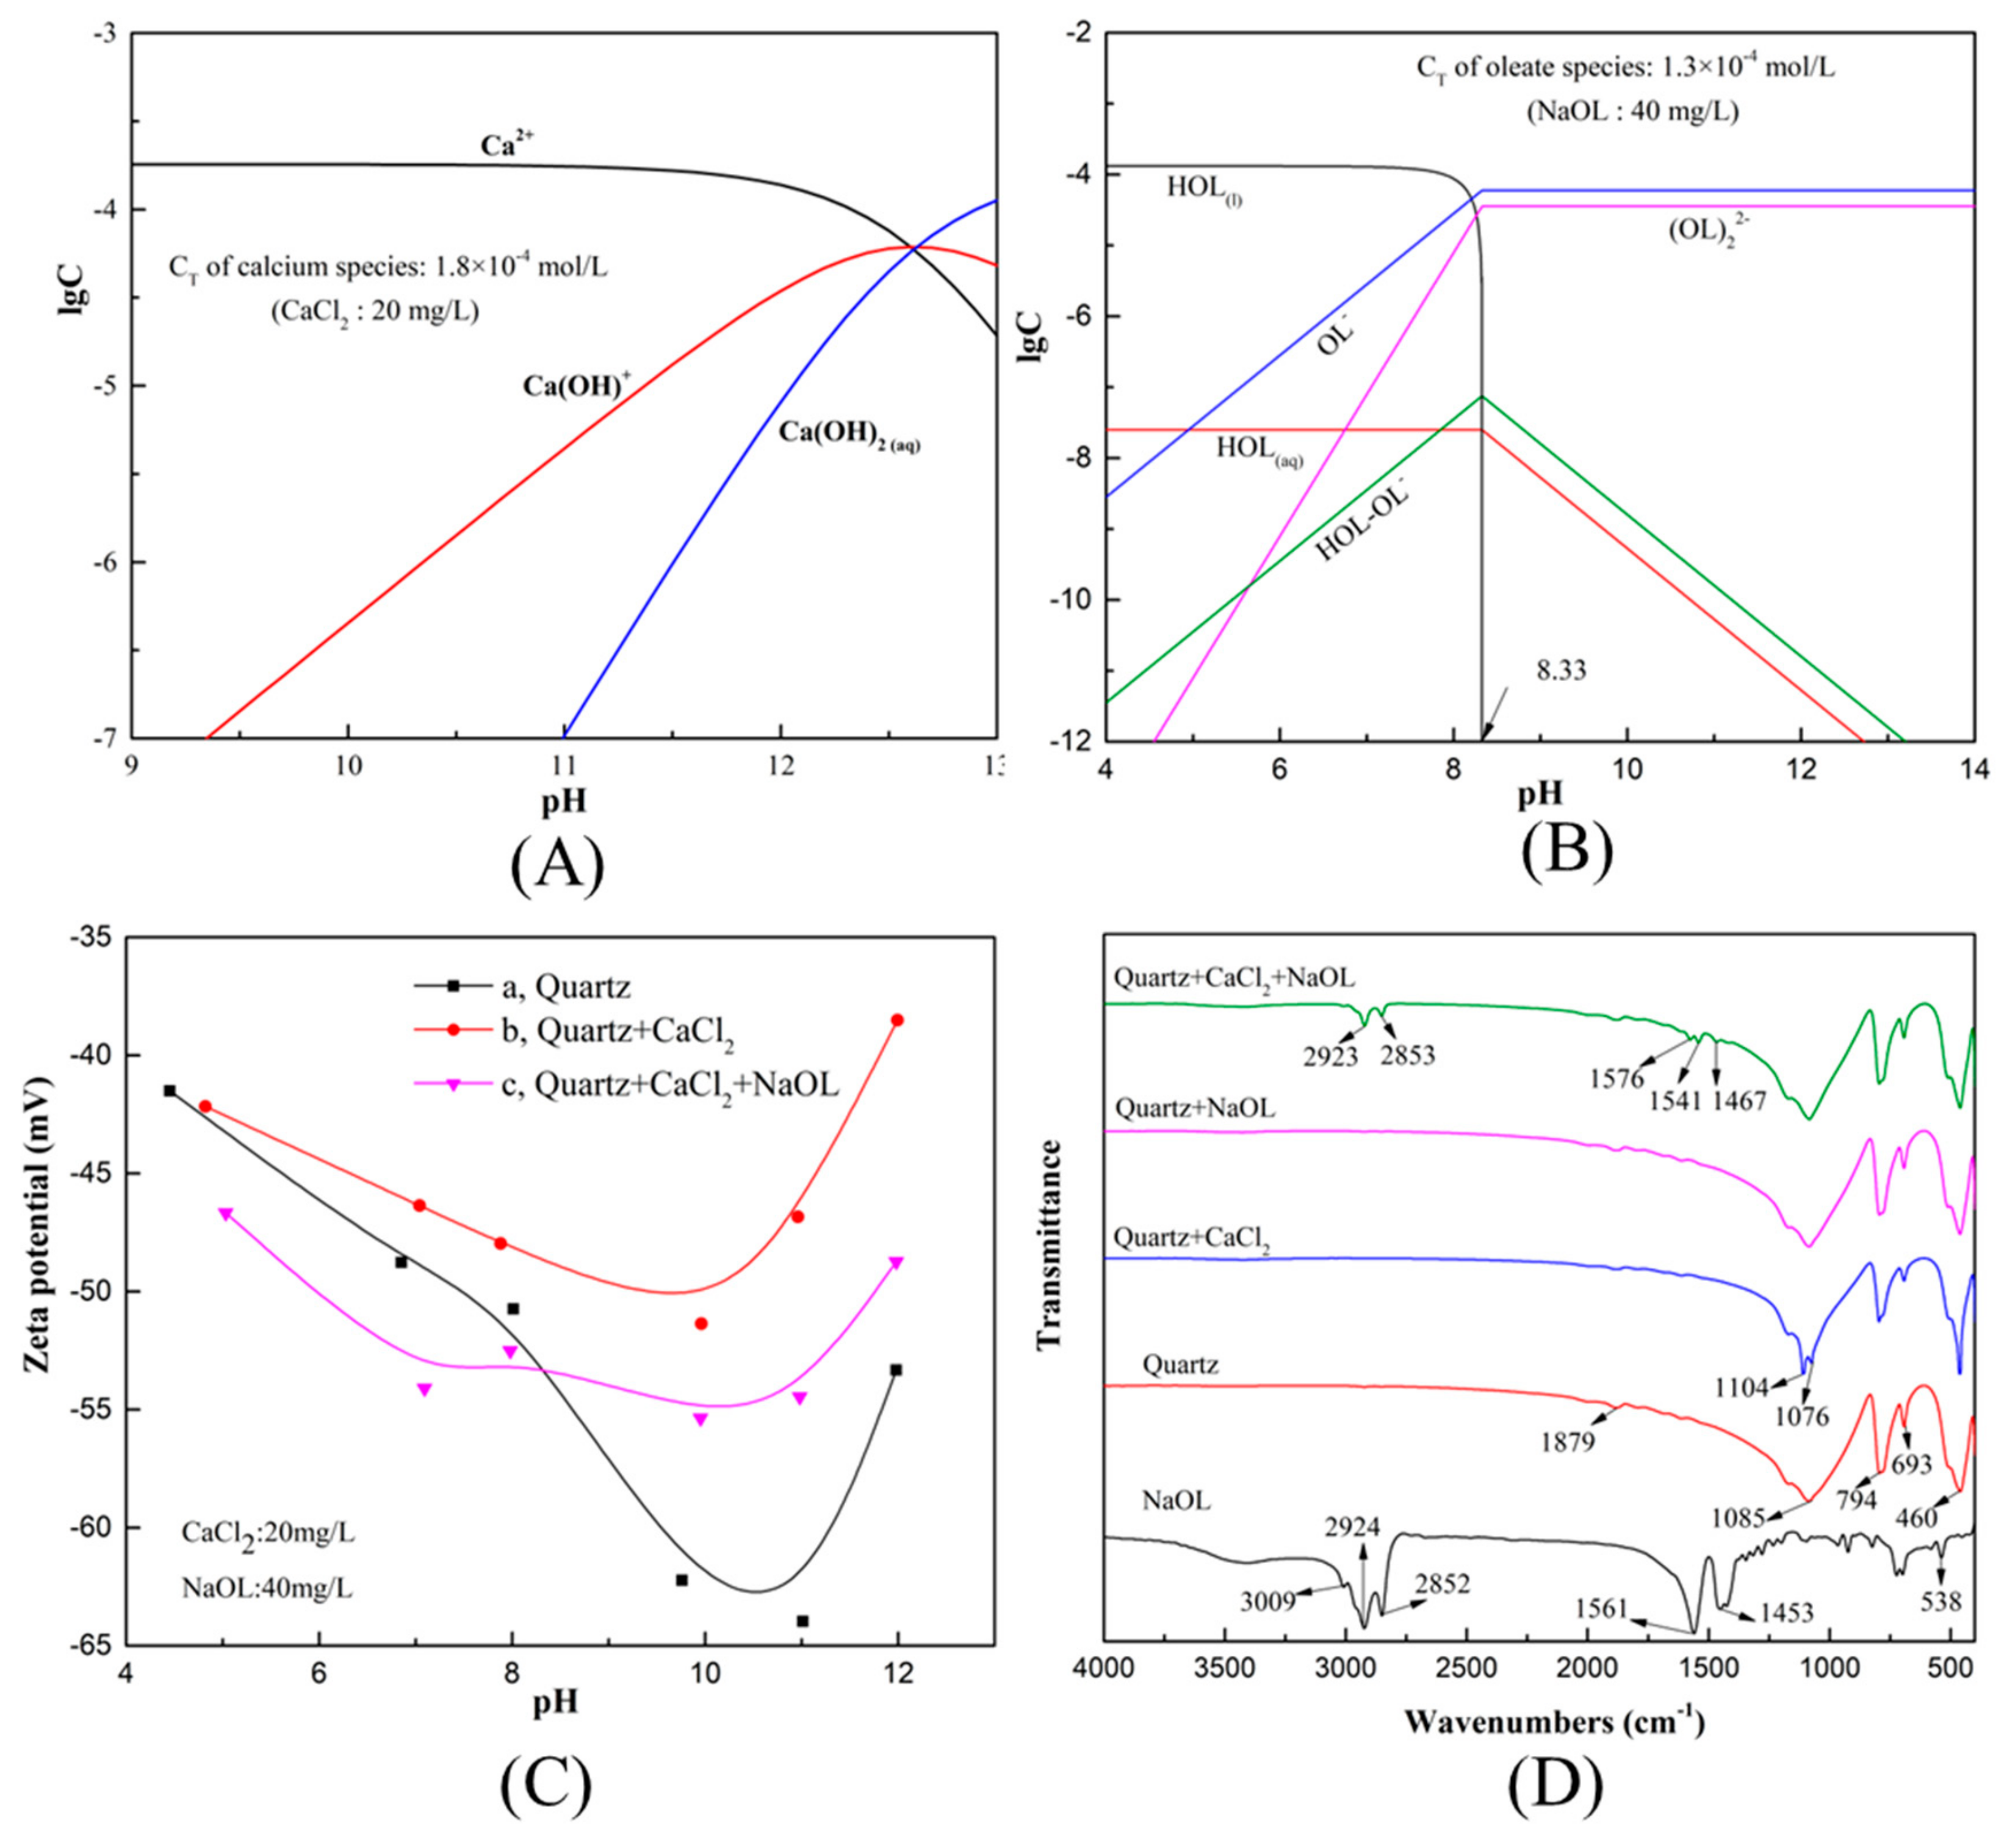
3.2. Solution Species Distribution Analysis

In aqueous solution, calcium ion may possess various forms such as Ca2+, Ca(OH)+, Ca(OH)2 molecule and Ca(OH)2 precipitate [48,49,50]. Figure 4A displays the distribution diagram of calcium species in aqueous solution at calcium (II) ions concentration of 1.8 × 10⁻⁴ mol/L (CaCl2 20 mg/L). It could be easily found that positively Ca2+ and Ca(OH)+ are the dominant species when pH is lower than 12.6 while Ca(OH)2 molecule becomes the major component when pH value is higher than 12.6. Figure 4B shows the distribution diagram of oleate ions species with total concentration of 1.8 × 10⁻⁴ mol/L (NaOL 40 mg/L) [48,51]. Obviously, oleic acid molecules and OL are the predominant components when pH is below 8.33; with pH increasing, oleate ions (OL and (OL)22) become the main components. Theoretically speaking, these species can absorb on the quartz surface due to the coexistence of electrostatic attraction and chemisorption [38]. However, according to aforesaid experimental results, the flotation recovery of quartz in the presence of calcium ion reaches highest values when the pulp pH ranges from 11 to 12. Thus, calcium species (Ca2+ and Ca(OH)+) and collector ions were considered as the possible components in the adsorption process for this study [32]. In consideration of the far-reaching influence of the hydration structures formed by metal ions in aqueous solution on the interactions of flotation reagents and mineral surfaces along with the latest research results of Wang et al. [32] and Hu et al. [15], it can be found that calcium ions are usually absorbed on the quartz surface in the form of a (Ca(OH)(H2O)3)+ cluster. Therefore, (Ca(OH)(H2O)3)+ and OL were adopted as the effective activator and collector components in the flotation system of quartz for the following DFT calculations.

3.3. Zeta Potential Analysis

It is generally acknowledged that the zeta potential is useful for understanding the adsorption behaviors of flotation reagents on minerals’ surface, which can largely explain the differences in flotation performance and flotation efficiency [33]. Figure 4C presents the zeta potential of quartz as a function of pH in the absence or presence of reagents. “a” in Figure 4C displays the variation trend in zeta potential of the quartz sample with increasing pH. Obviously, the zeta potential of the original quartz sample always had a negative value under the tested pH range of 4.5–12. During the stage with a pH 4.5–10.5, more OH ions adsorbed on the surface of quartz with increasing pH resulting in a decrease in the zeta potential [52]. However, when the pH was around 10.5, the zeta potential of quartz reached a turning point, which was attributed to the saturation adsorption of negatively charge OH ions [35]. As pH continues increasing, the zeta potential will rise due to the shielding effect of negatively charged ions and the compression of double layers [35]. The zeta potential of quartz treated by CaCl2, shown in “b” of Figure 4C, was always higher than that of pure quartz in the whole tested range of pH, and it became more evident with the increase of pH, suggesting the increased adsorption quantity of calcium species on the surface of the quartz. When NaOL was added to the quartz suspension treated with CaCl2, the zeta potential change process illustrated in “c” of Figure 4C can be divided into two parts. When pH was lower than 8.3, the zeta potential was lower than that of the original quartz. In terms of Figure 4B and “b” of Figure 4C, it’s clear that the decrease in zeta potential was mainly attributed to a small amount of adsorption of oleate ions on quartz’s surface. Moreover, the presence of large amounts of free Ca2+ led to the decrease in oleate ions, which is consistent with the conclusion from the micro-flotation tests that the recovery of quartz with the CaCl2 and NaOL treatments was lower than that of NaOL alone in this range. With the continuous increase in pH (pH > 8.33), the adsorption of oleate ions onto the quartz surface caused the decrease in zeta potential compared with “b” of Figure 4C and the increase in zeta potential compared with “a” of Figure 4C. This implies that the presence of calcium species enhanced the positive adsorption of oleate ions on the surface of the quartz, which can be confirmed by better flotation performance, as presented in Figure 3.

3.4. FTIR Tests

The FTIR spectra of NaOL and quartz test samples are presented in Figure 4D for proposing a possible adsorption mechanism of reagents on the surface of quartz. In the FTIR spectrum of NaOL, the peaks at 2924 and 2852 cm−1 resulted from the symmetric C–H vibration of –CH2– and –CH3–, respectively [53]. The peaks at 1561 and 1453 cm−1 corresponded to the asymmetric and symmetric stretching vibration of –COO–, respectively [53,54]. The quartz spectrum displayed several peaks in the region of 2000–400 cm−1. The peaks at 1085 and 794 cm−1 can be attributed to the asymmetric and symmetric stretching vibration of Si–O, and the peaks at 693 and 460 cm−1 were associated with the symmetrical and asymmetrical bending vibration [55,56]. No new peaks were formed in the FTIR spectrum of quartz treated by NaOL alone, and one can consider NaOL as the physical adsorption or non-adsorption on the quartz surface combined with the experimental results of micro-flotation. Interestingly, the peak of 1085 cm−1 disappeared in the FTIR spectrum of quartz treated with CaCl2 alone, and the peaks of 1104 and 1076 cm−1 appeared nearby, indicating that the adsorption of calcium species will change the surface structure of quartz to some extent. When quartz was treated in the order of CaCl2 and NaOL, it was observed that five distinct new peaks appeared in the FTIR spectrum, namely, 2923 cm−1, 2853 cm−1, 1576 cm−1, 1541 cm−1, and 1467 cm−1, respectively, corresponding to the stretching vibration of –CH2– and –CH3–, and –COO–. Therefore, it can be concluded that oleate ions were indirectly chemisorbed on the quartz surface via the action of calcium species under appropriate pH conditions. Two possible effects from the calcium species exist: one is that the adsorption on the surface of the quartz increased the action sites of the oleate ions, and the other is that the generated calcium oleate complexes (such as Ca(OL)+, Ca(OL)2, Ca(OH)(OL), etc.) assembled on the quartz surface to increase its hydrophobicity and float up.

3.5. Computational Results

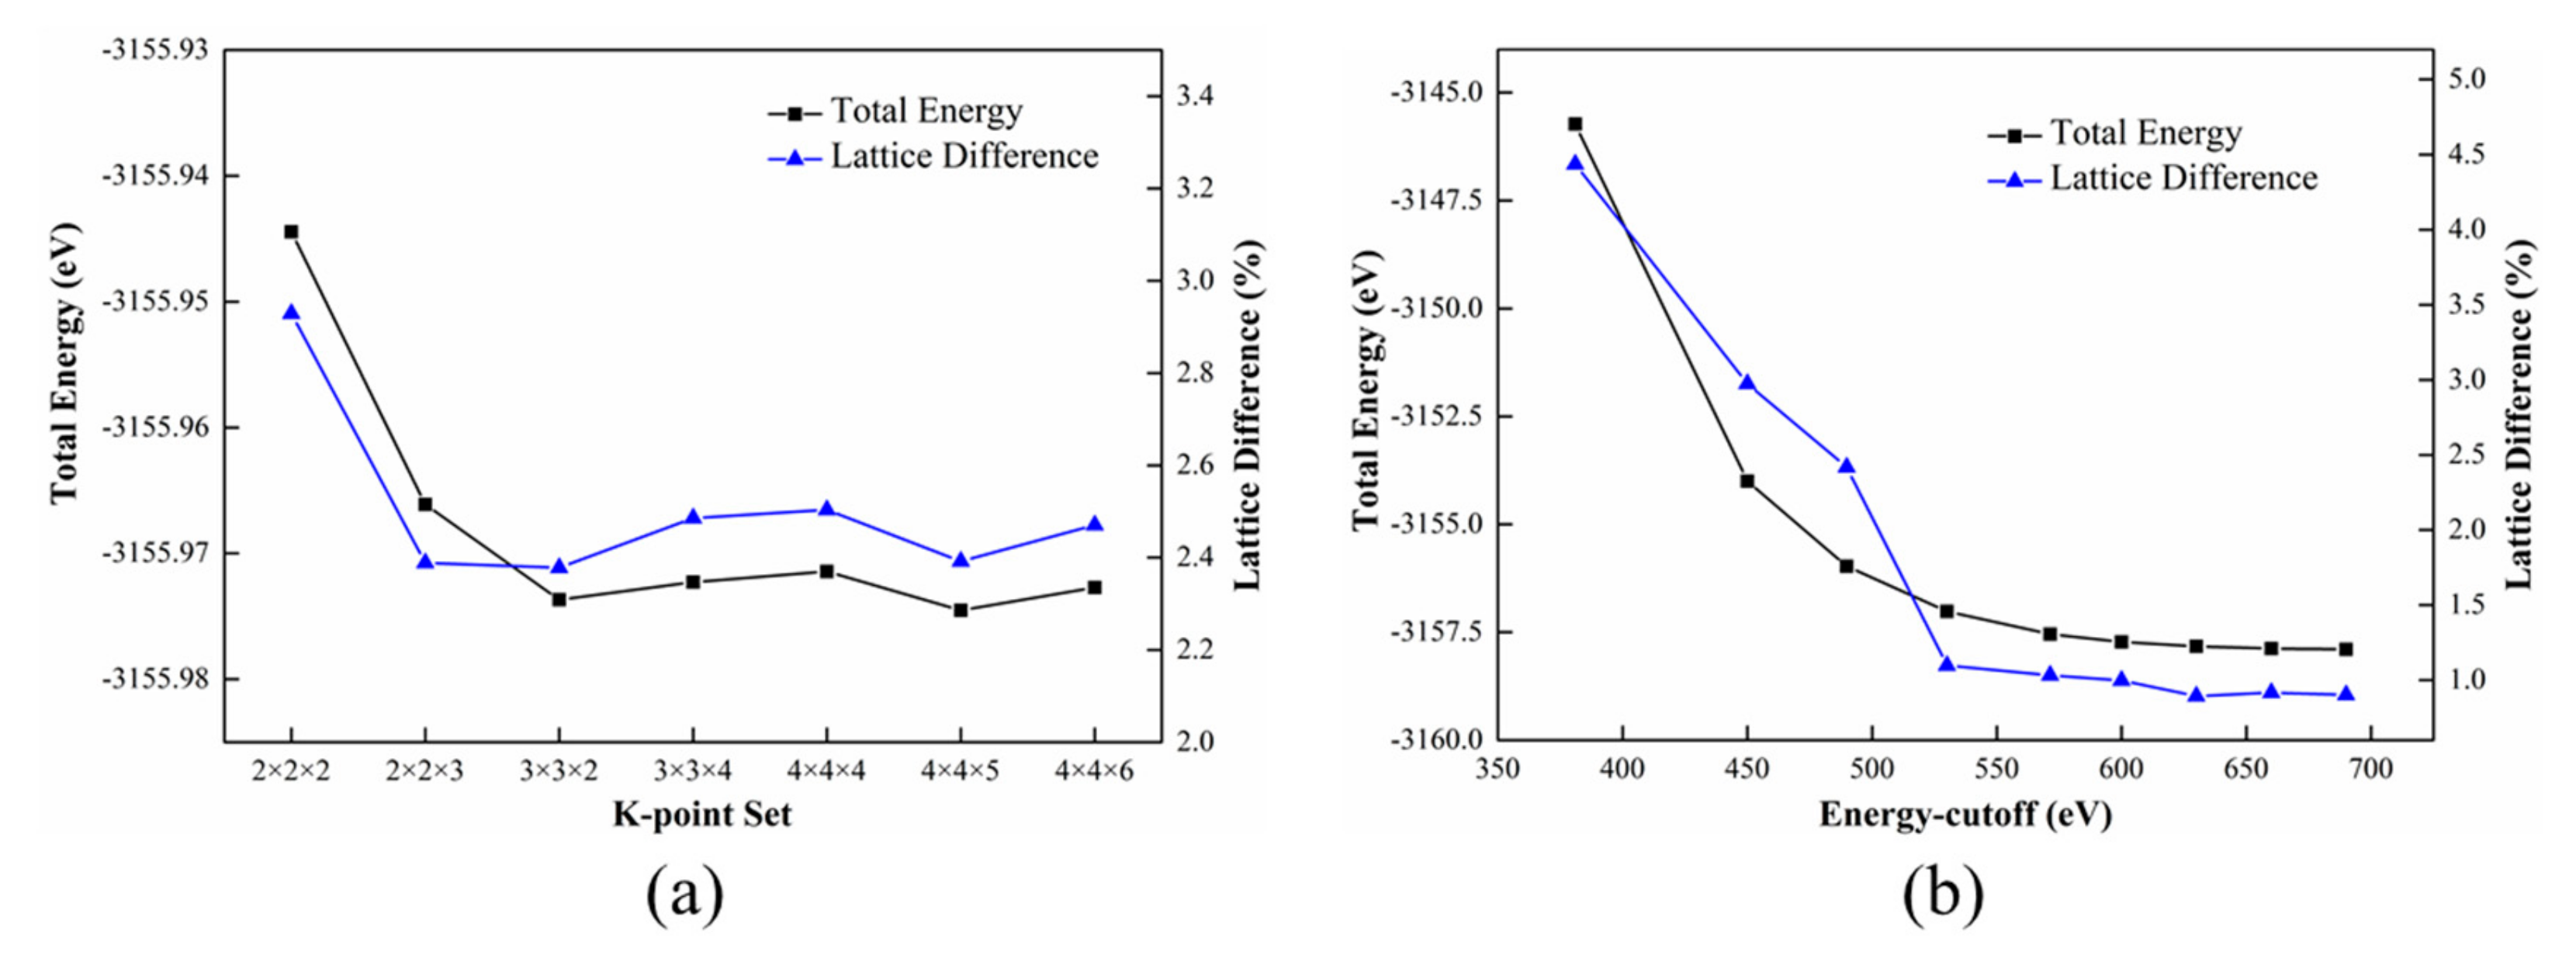
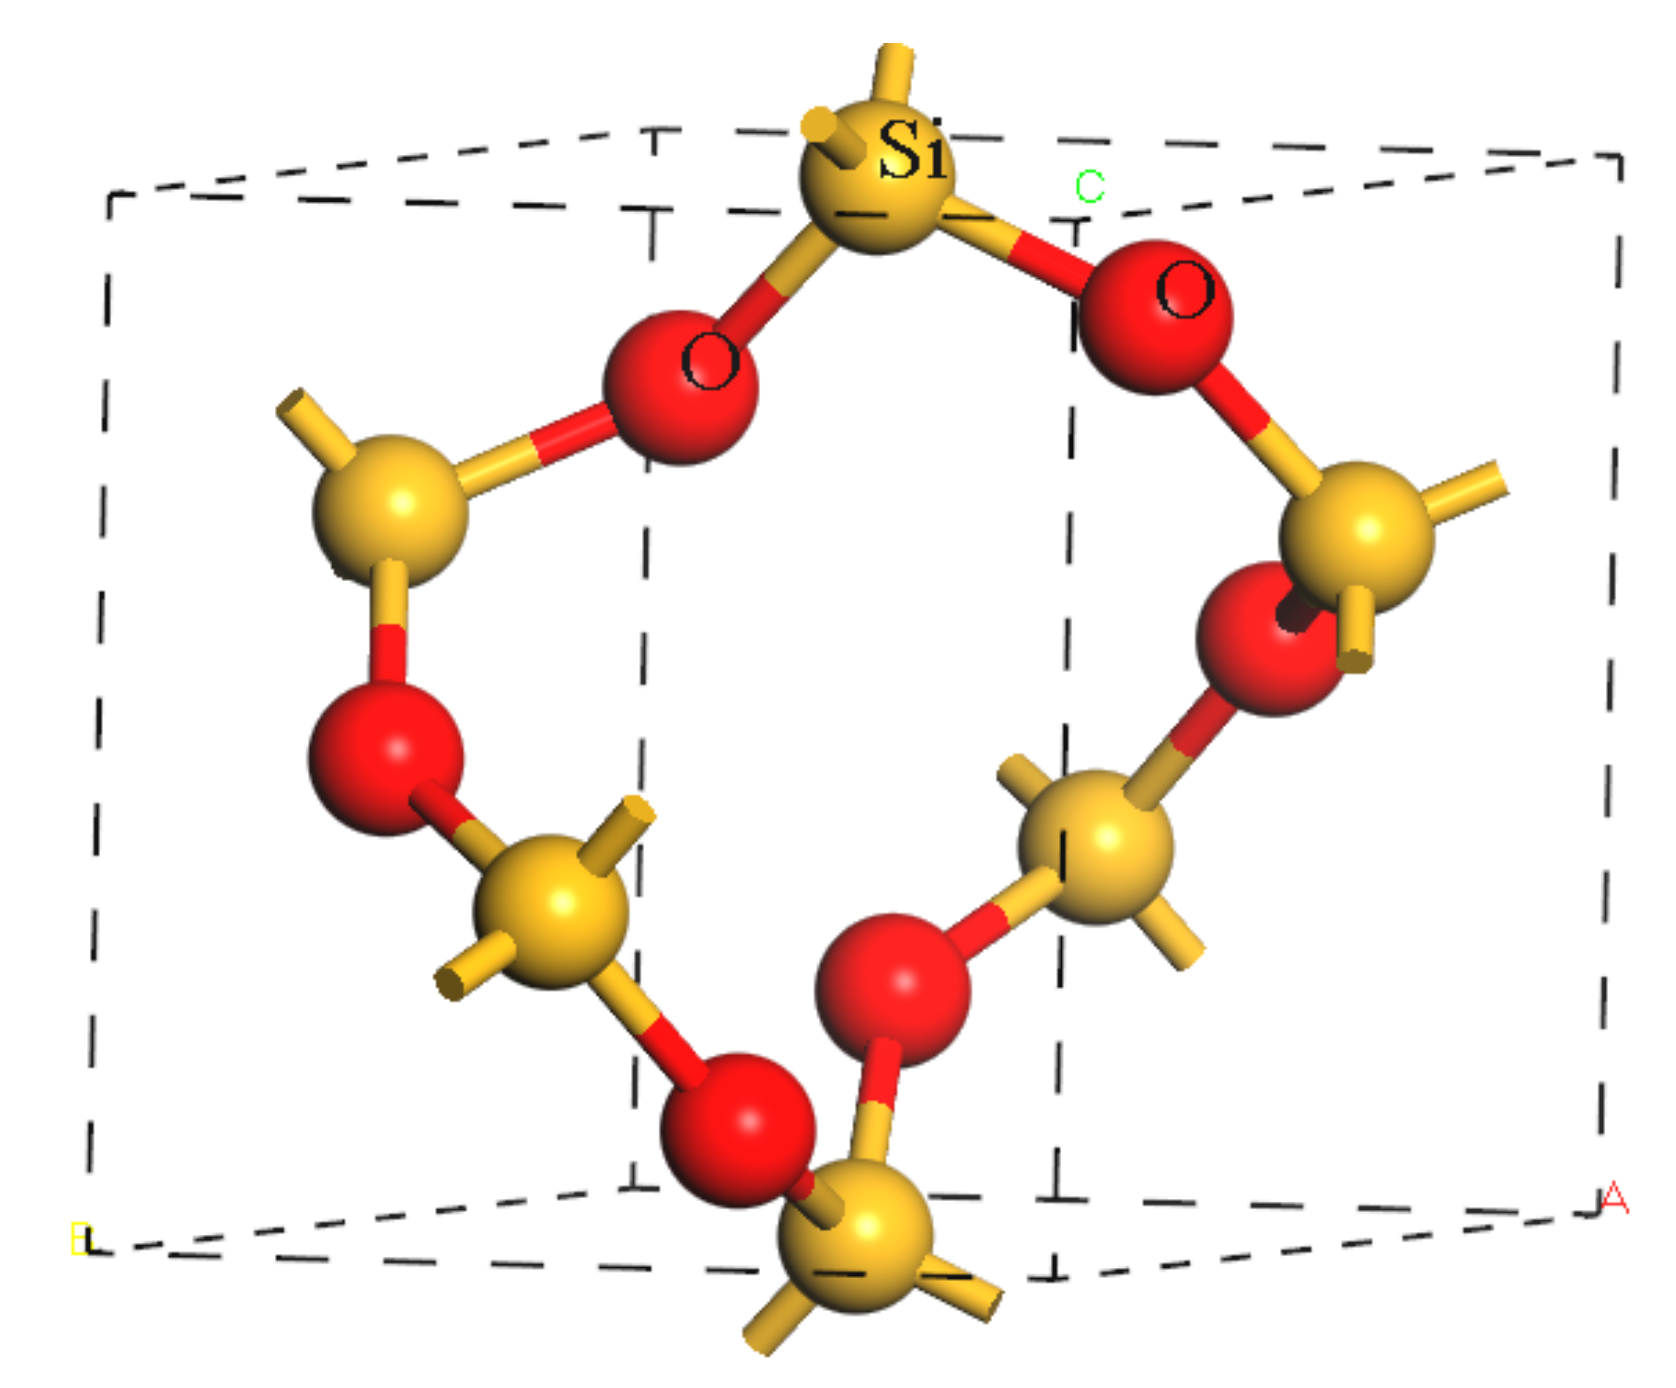
3.5.1. Quartz Bulk Cell Optimization

Firstly, the influence of various exchange-correlation functionals on the rationality of α-quartz bulk cells was studied under the cut-off energy of 489.8 eV and a k-point set of 3 × 3 × 2. At present, generalized gradient approximation (GGA) and local density approximation (LDA) were the two favorite types in practice [12,25]. Taking the limitation of LDA into consideration, GGA is more appropriate for this simulation’s calculation [12,57]. Thus, several functionals such as Perdew–Wang’s 1991 (PW91) [58], the revised Perdew–Burke–Ernzerhof (RPBE) [59], Perdew–Burke–Ernzerhof solids (PBESOL) [60], Perdew–Burke–Ernzerhof (PBE) [61], and Wu–Cohen (WC) [62] were investigated based on the GGA framework. The experimental values and optimized quartz lattice parameters are tabulated in Table 1, and the optimal functional was determined by comparing the Difference (%) between the calculated values and the experimental values. The formulas for calculating “Difference/%” are attached below:
Total Difference (Å) = (am − a) + (bm − b) + (cm − c)
Difference (%) = Total Difference /(a + b + c)
where a, b, and c represent the experimental lattice parameter values obtained from the American Mineralogist Crystal Structure Database (AMCSD) website; am, bm, and cm refer to the simulated lattice parameter values based on the identical α-quartz crystal structure combined with different functionals.
It is obvious from Table 1 that the calculated lattice parameters on account of the five GGA functionals coincided well with the experimental values from AMCSD and that the total lattice constant differences did not exceed 5%. Moreover, when the functional was determined as GGA-PBESOL, the minimal lattice parameter difference of 2.38% could be obtained [12]. Therefore, GGA-PBESOL was selected for the subsequent convergence tests.
Figure 5a shows that under the conditions of a GGA-PBESOL functional and a cut-off energy of 489.8 eV, when the k-point set increased from 2 × 2 × 2 to 4 × 4 × 6, the variation trends of the total energy and lattice constants difference were similar, both changing considerably and then tending to become stable. It was obvious that the total energy and lattice difference of the system converged to relatively low constant values at k-point 3 × 3 × 2. Thus, the proper k-point set was determined as 3 × 3 × 2.
Figure 5b presents the total energy and lattice constants difference as a function of cut-off energy. As illustrated in Figure 5b, the total energy and lattice constants differences both kept decreasing to an equilibrium value with the increase of cut-off energy. Then, the decrease in total energy was lower than 0.05 eV and the reduction in the lattice parameters difference did not exceed 0.003% when the cut-off energy was beyond 571.4 eV. Therefore, the appropriate cutoff energy was selected as 571.4 eV.
In conclusion, the rational parameters for quartz bulk cell optimization were determined as a GGA-PBESOL functional, k-point set 3 × 3 × 2, and a cutoff energy of 571.4 eV, which could generate a sufficiently accurate structure at an acceptable cost. The experimental conclusions basically tally with previous research results [12]. The optimized quartz bulk cell structure on the strength of optimum parameters is shown in Figure 6.

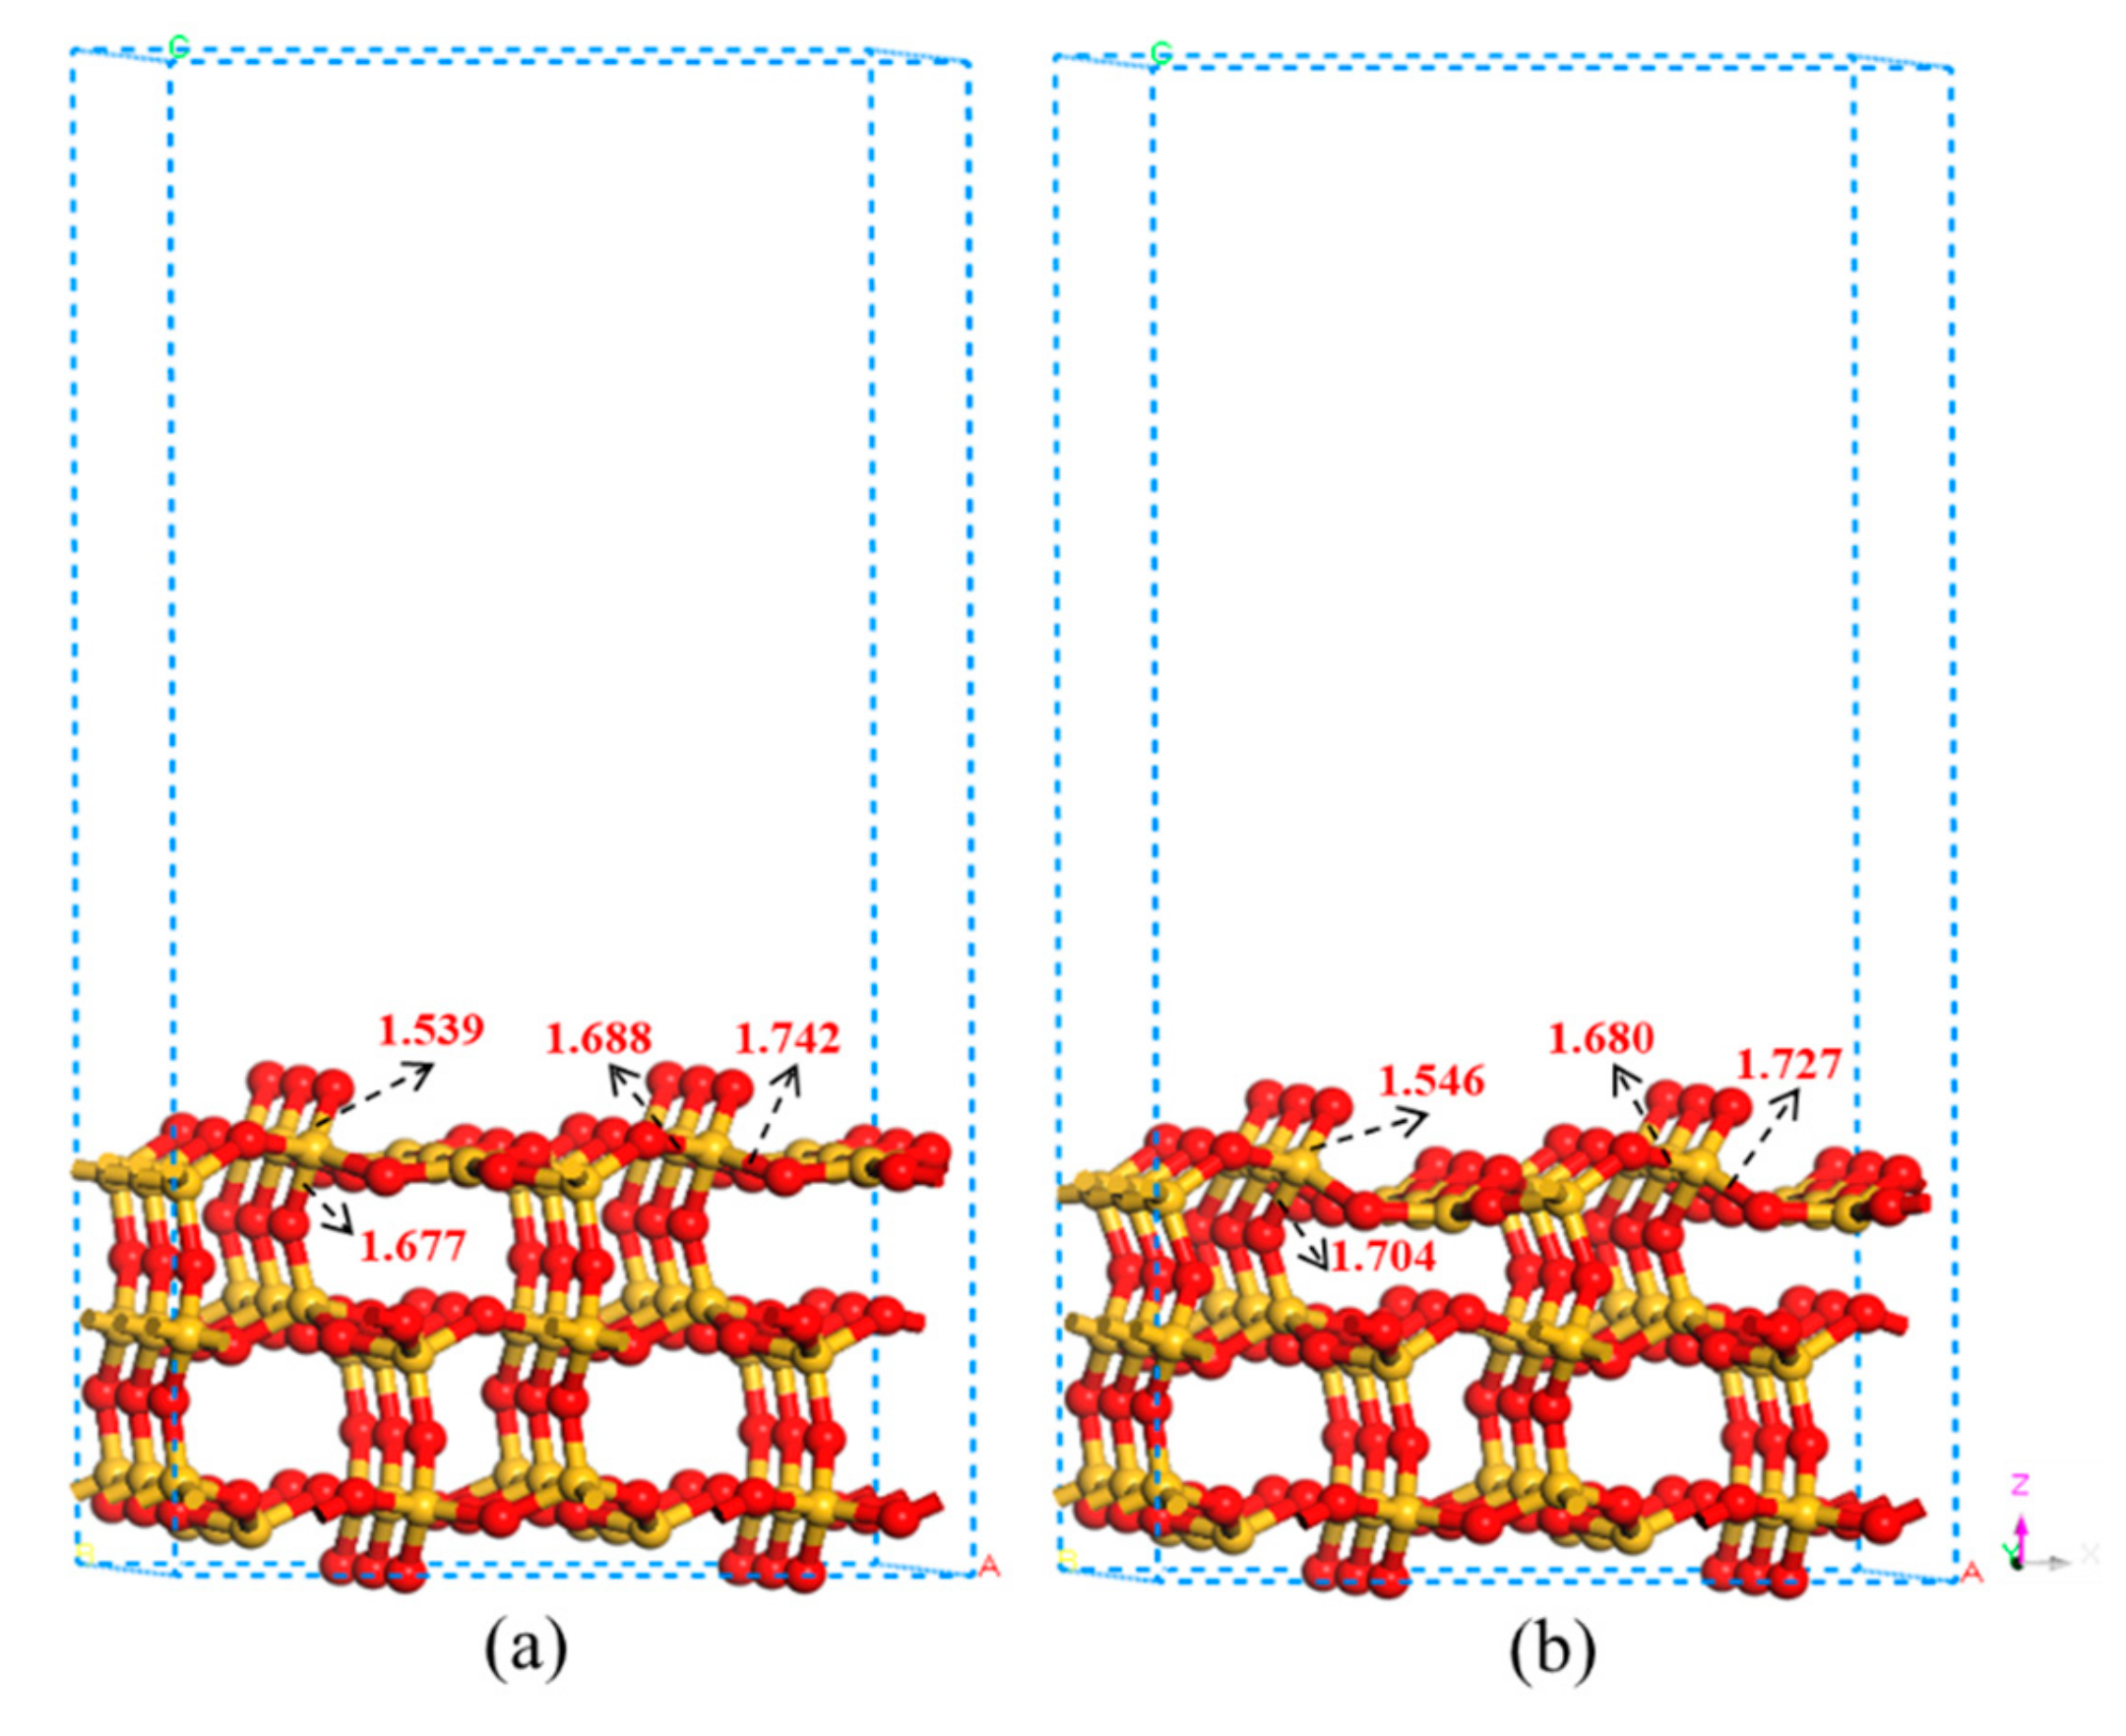
3.5.2. Hydroxylation Model of Quartz (101) Surface

The initial cleaved (101) surface structure of the quartz is shown in Figure 7a, and its optimized structure at the GGA-PBESOL level is presented in Figure 7b. It can be seen from Figure 7 that the newly generated (101) surface structure will undergo a slight reconstruction to obtain a stable surface. Each Si atom was coordinated with four O atoms to form a tetrahedral structure, where the bond lengths of the Si–O bond formed by O atoms connected up and down with a Si atom extend from 1.539 Å to 1.546 Å and 1.677 Å to 1.704 Å, respectively, and the bond lengths of the Si–O bond formed by O connected left and right, with Si shortened from 1.688 Å to 1.680 Å and 1.742 Å to 1.727 Å, respectively. Before simulating the adsorptions of various adsorbates onto the quartz surface, the first consideration was to investigate the rarely reported hydroxylation behaviors of water molecules on the α-quartz (101) surface to more accurately describe the subsequent interaction mechanisms [36]. The hydroxylation reaction of the quartz (101) surface can be evaluated by the adsorption energy (Eads) of water on the quartz’s surface. The equation for adsorption energy (Eads) can be defined as the following [15]: Eads = Esystem – (Equartz(101) + EH2O), where Esystem represents the total energy of the optimized hydroxylated configuration of the H2O-absorbed quartz (101) surface, Equartz(101) and EH2O refer to the total energy of the optimized quartz (101) surface and optimized H2O molecules in the periodic structure, respectively. Firstly, individual water molecules are placed above unsaturated Si atoms on the quartz (101) surface. Due to the strong hydrophilicity of the quartz surface, it was found that H2O would spontaneously crack into H and OH, and separately combine with O atoms and Si atoms onto the quartz (101) surface after optimization. At the same time, one can easily find that two new Si–OH silanol groups were generated accompanied by the formation of Ow–H2···Oq hydrogen bonds with distance and bond angles of 2.598 Å and 169.2°, as illustrated in Figure 8a (note that Oq and Siq belong to the surface atoms of quartz; H1, H2, and Ow belong to the water molecule). The adsorption energy of a single water molecule on the quartz (101) surface was −501.4 kJ/mol, which indicates that the hydroxylation process was thermodynamically favorable. In consideration of the existence of six unsaturated Si atoms on the cleaved quartz (101) surface, six H2O molecules were placed directly above six different unsaturated Si atoms to explore the hydroxylation behaviors of water molecules on quartz. Figure 8b presents the optimized complete hydroxylation models of the quartz (101) surface with six water molecules adsorbed at the same parameter settings. The configuration A in Figure 8b is the original optimized hydroxylation model, and the other three possible configurations can be obtained in consideration of the symmetry of the system. Clearly, the bond lengths of the newly generated Oq–H and Siq–OH in the four hydroxylation models show little difference, but there is a significant diversity in the orientation of the bonds. The adsorption energy of the four different hydroxylation configurations of the quartz (101) surface is listed in Table 2. When all the O–H bonds on the surface of the quartz intersect with each other, the obtained configuration (i.e., configuration D in Figure 8b) has the lowest energy about −2517.8 kJ/mol, indicating that configuration D was the most stable in terms of thermodynamics.

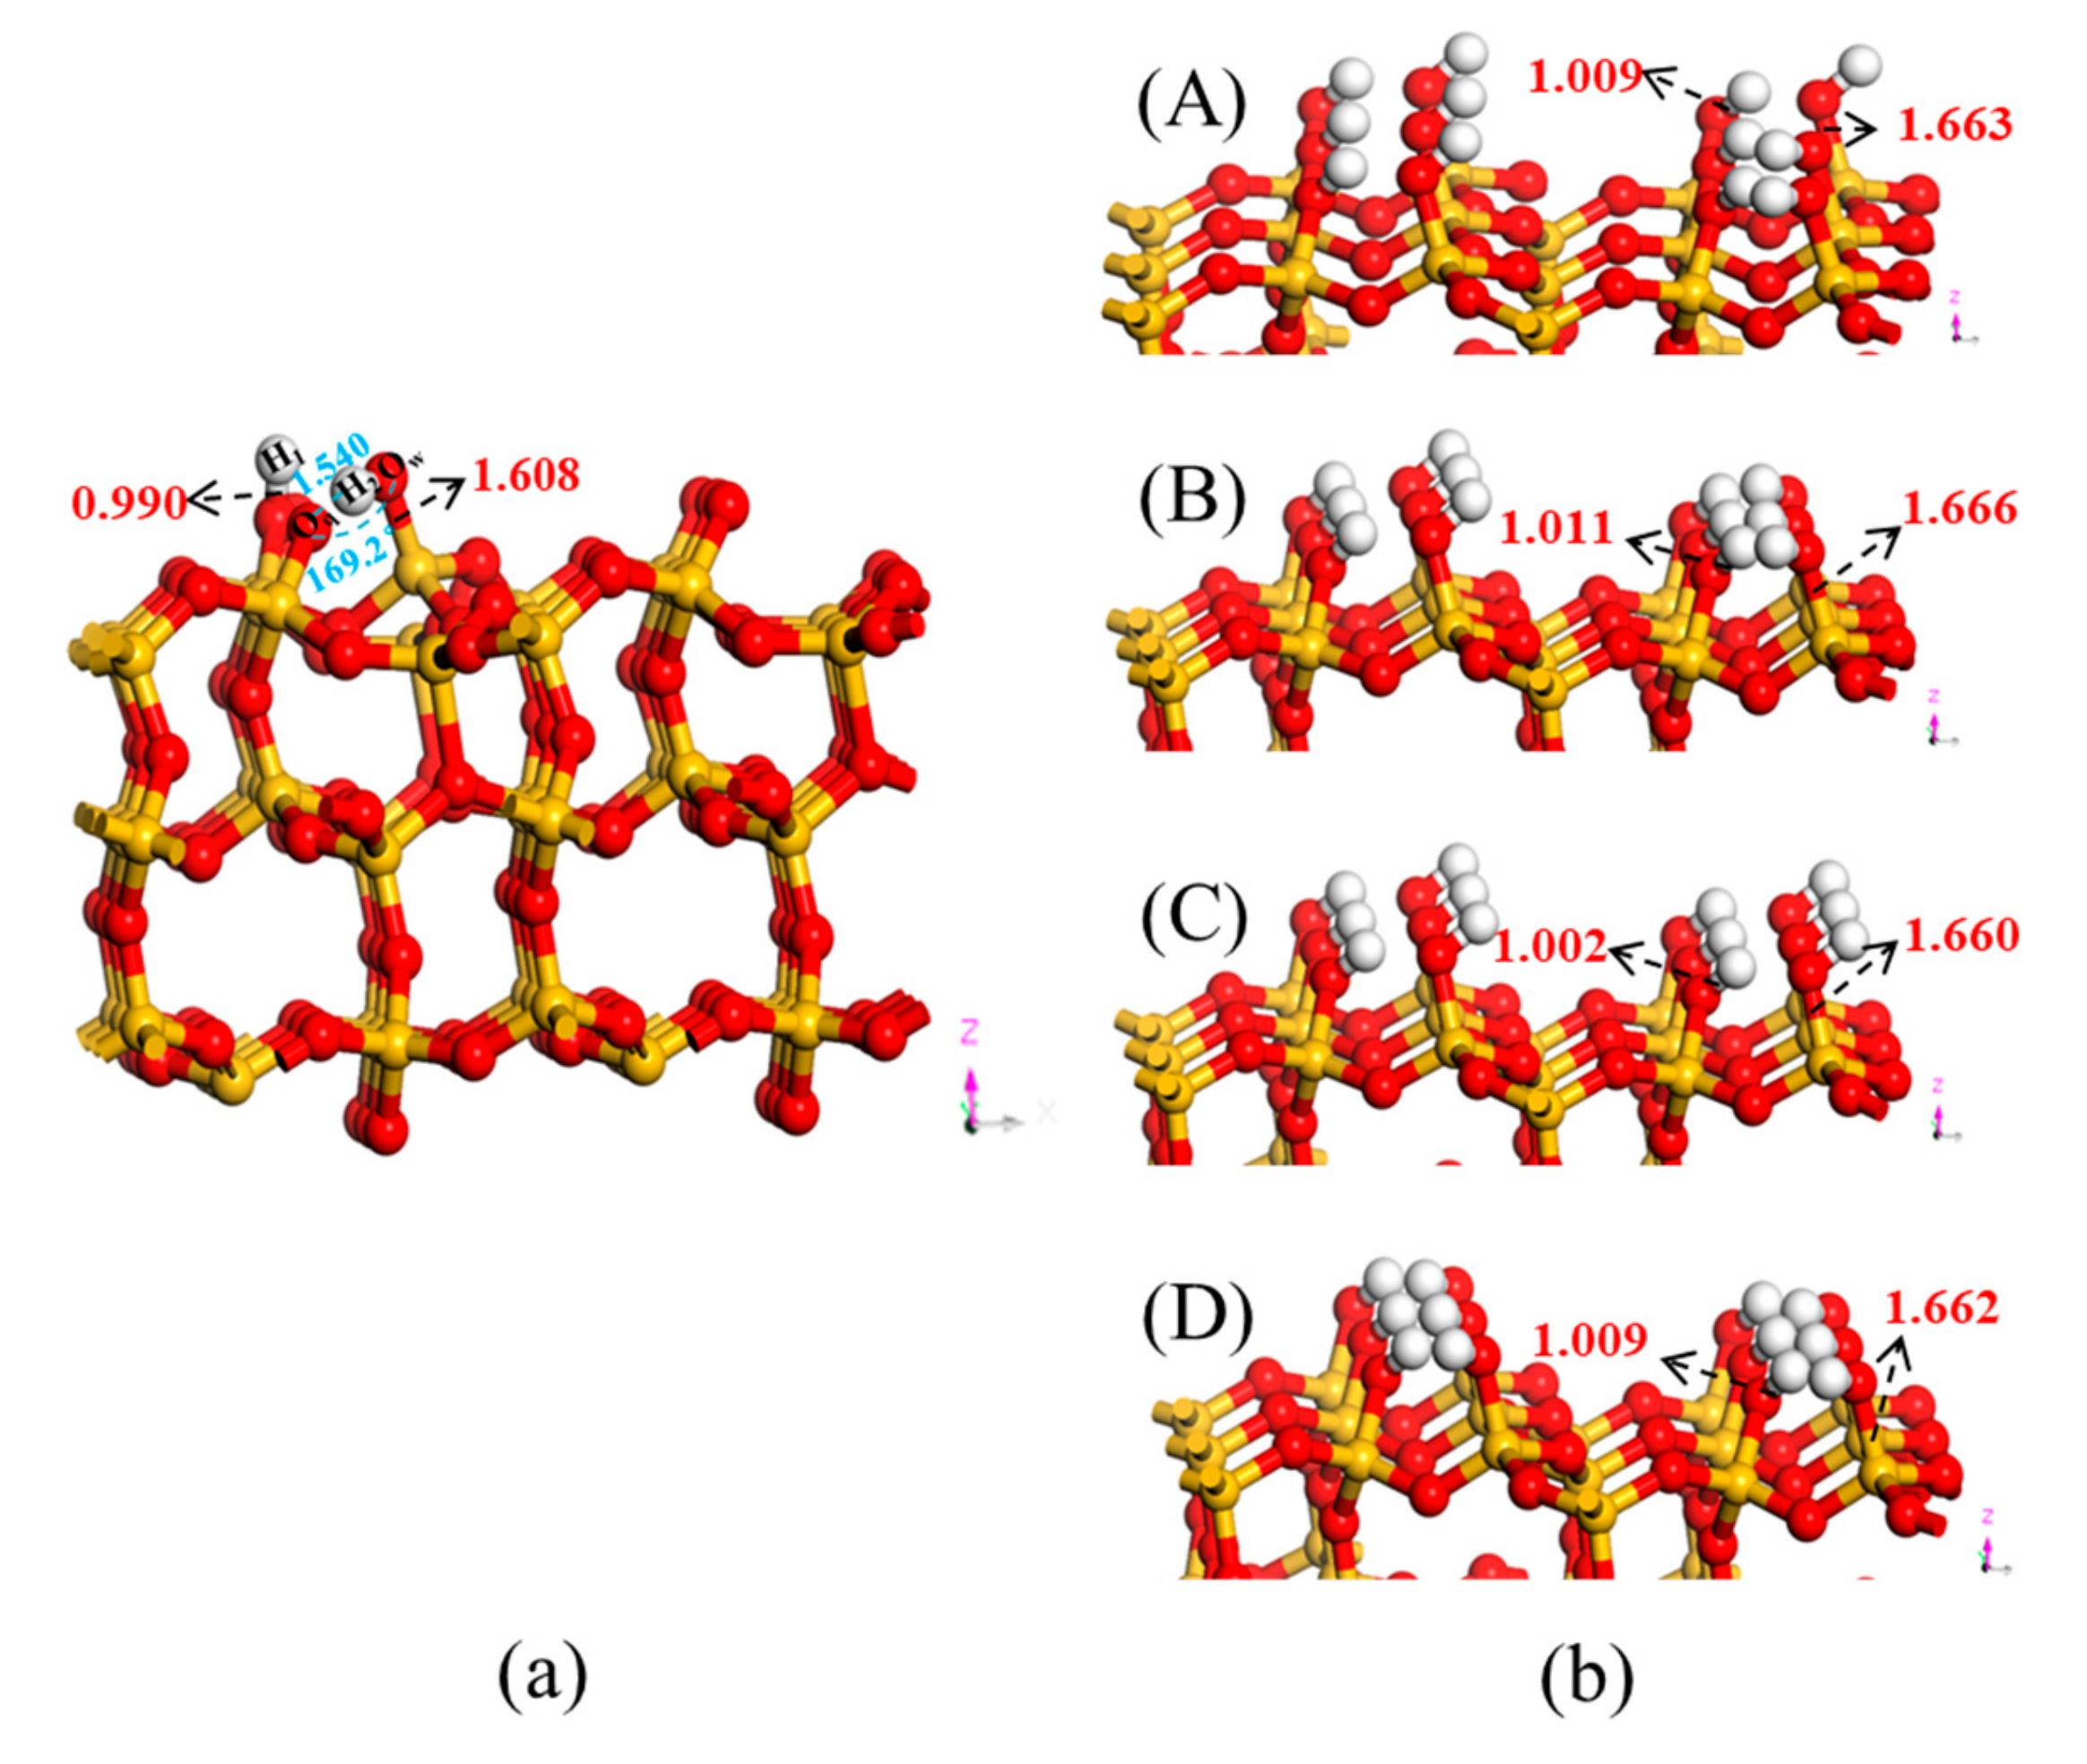
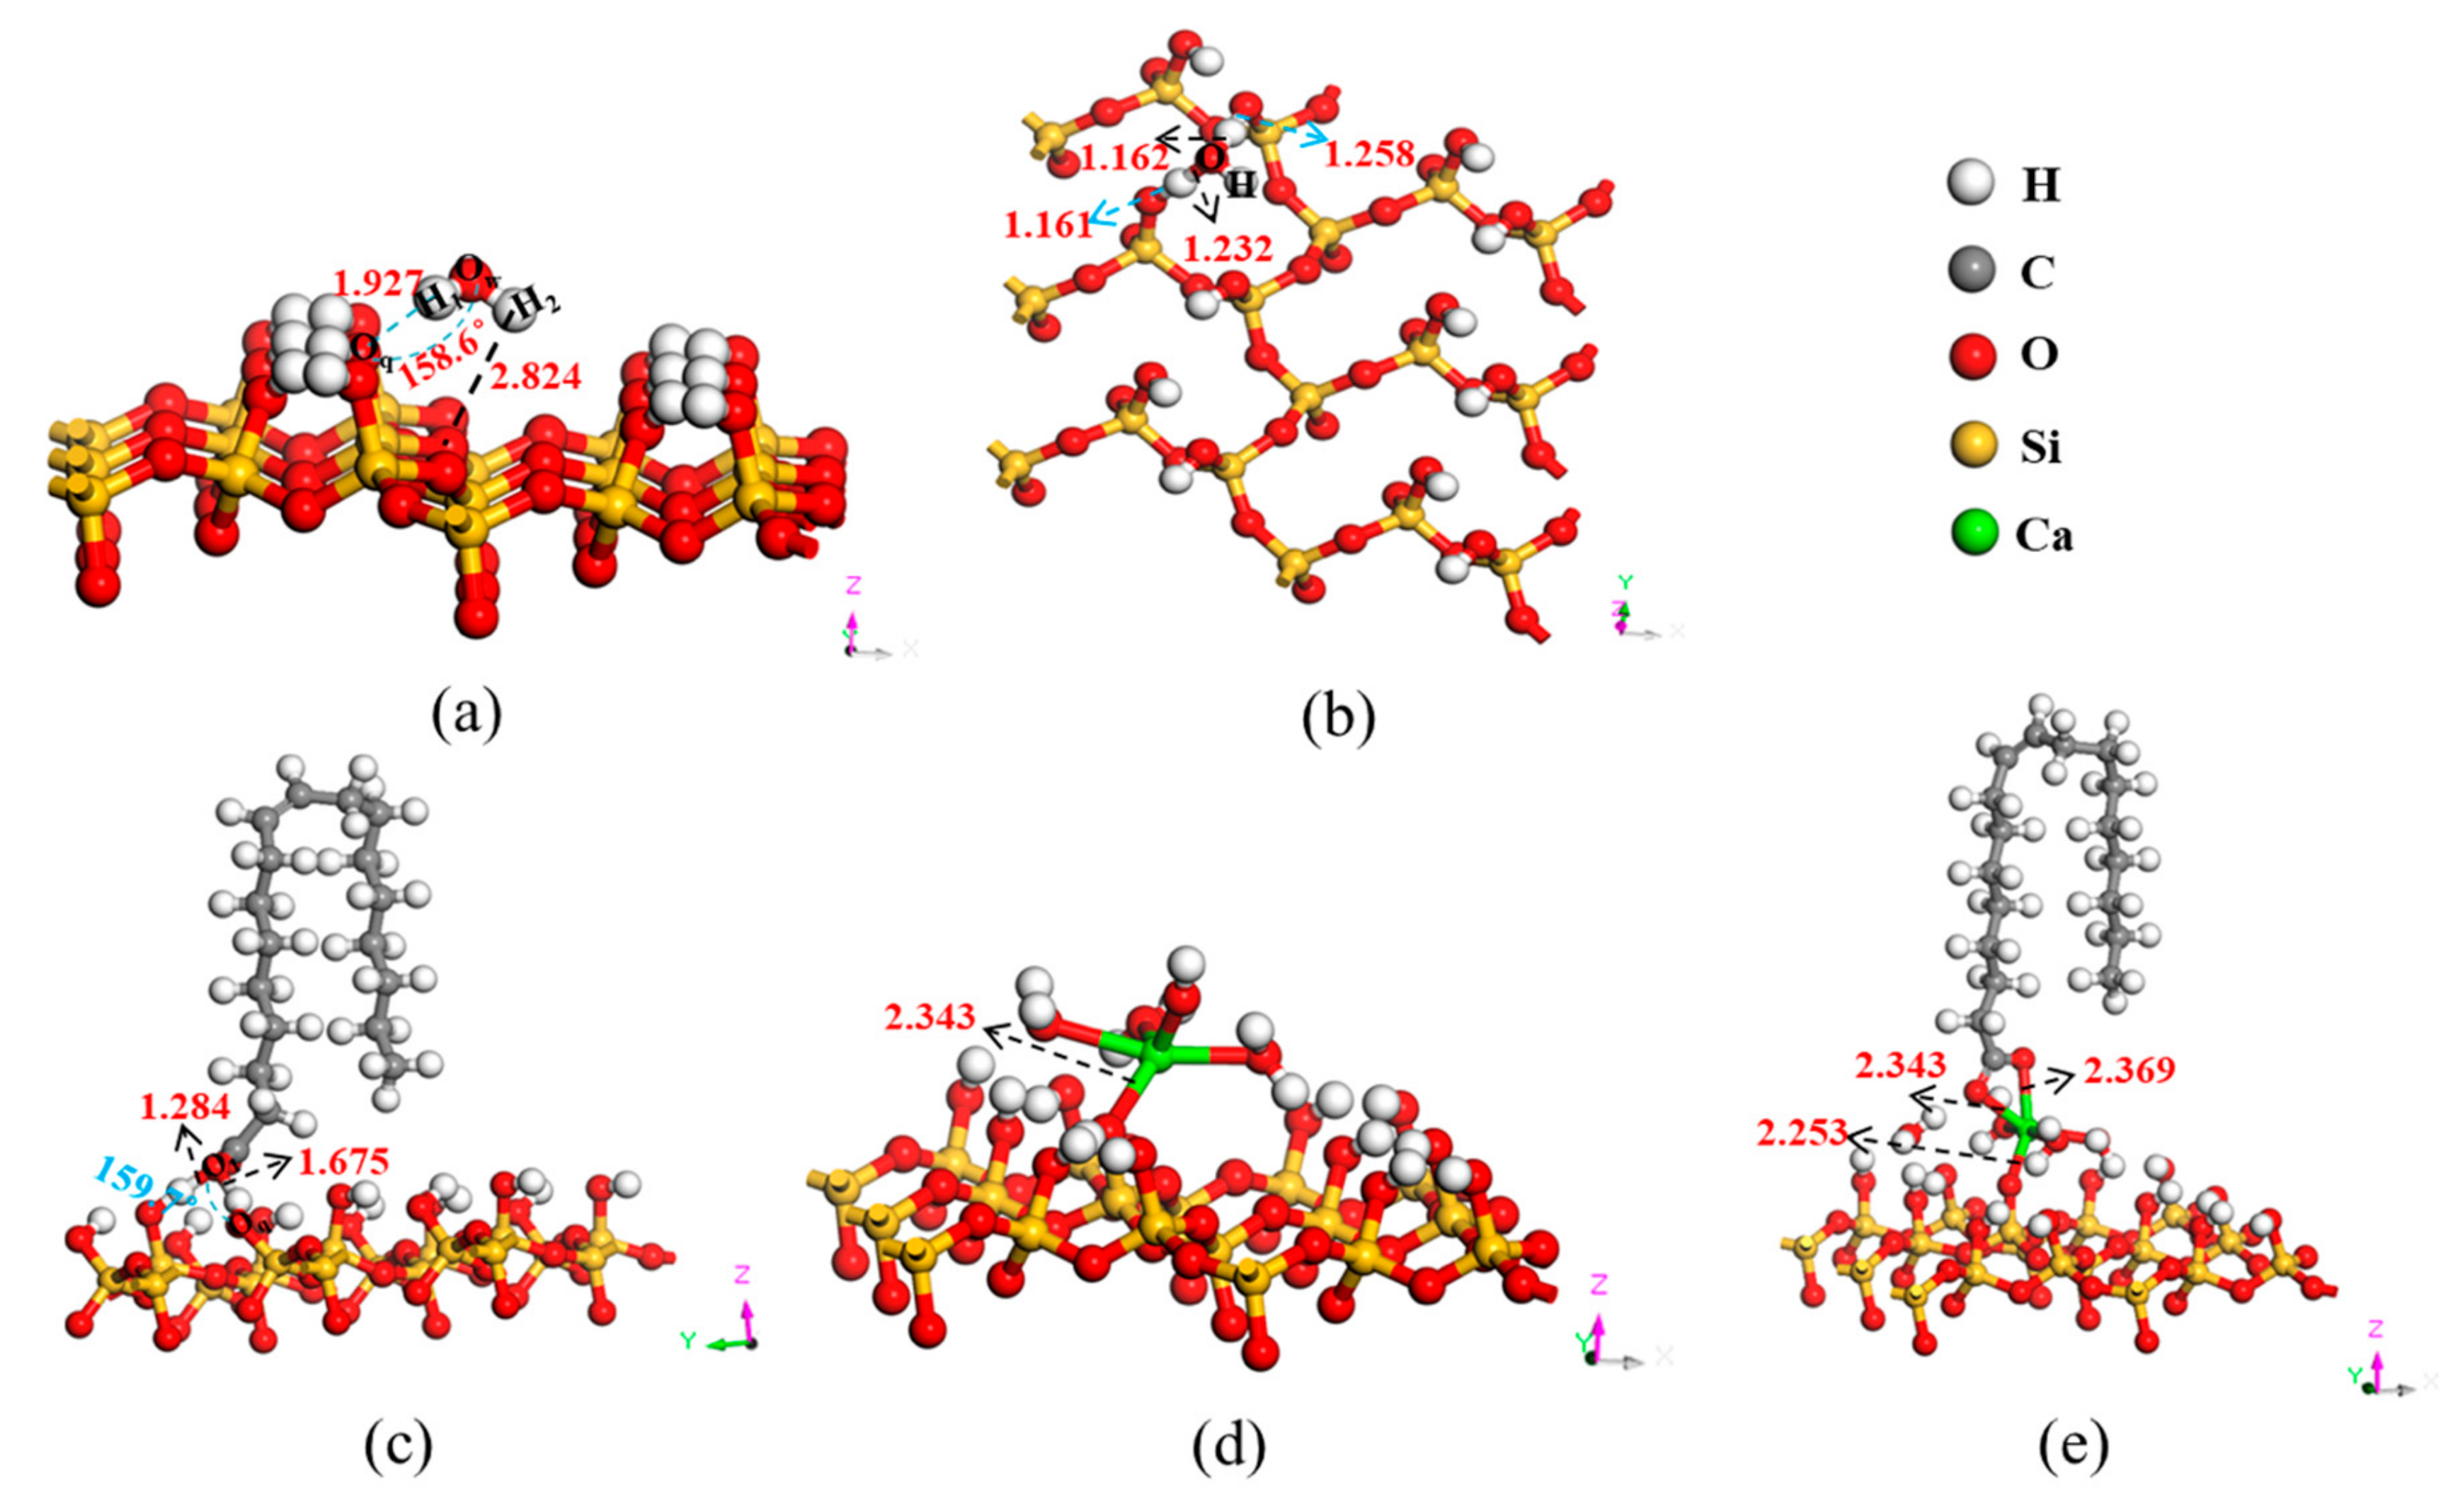
3.5.3. Adsorbates on the Hydroxylated Quartz (101) Surface

Based on the results of the flotation tests, solution chemistry calculations, and previous research work [15,29,32], it can be concluded that the main adsorbates in the pulp include H2O molecules, OH ions, Ca(H2O)3(OH)+ ions, OL (oleate ions). As the sequential-dosing method and the mixed-dosing method for NaOL and CaCl2 had no effect on the recovery of quartz flotation, the sequential-dosing method was selected to gradually study the activation and flotation mechanisms in DFT simulations to thoroughly elucidate the flotation process of quartz. The optimized adsorption structures of various adsorbates on hydroxylated quartz (101) surface are displayed in Figure 9 and the corresponding adsorption energy is listed in Table 3. Figure 9a shows the adsorption of water molecules. The closest distances between the two hydrogen atoms of the water molecule and the hydroxylated surface were 1.927 Å and 2.824 Å, respectively, and the Ow–H1···Oq hydrogen bond with the Ow···O distance of 2.879 Å and bond angle of 158.6° can be observed. The corresponding interaction energy was −20.9 kJ/mol, suggesting that a weaker interaction existed between the water molecule and the hydroxylated structure and that other adsorbates can easily expel the water molecular layers to act on the hydroxylated surface. Figure 9b depicts the adsorption of the OH ion. The distances between the O atom in the OH ion and H atoms in hydroxylated structure were 1.232 Å and 1.162 Å, respectively, and the interaction energy was −291.6 kJ/mol. The bond lengths of the covalent O–H bonds of the involved Si–OH silanol groups were 1.161 Å and 1.258 Å, respectively. It can be inferred that the O atom in the OH ion forms covalent bonds with the H atoms of the hydroxylated surface. Figure 9c describes the adsorption of the OL ion. The shorter distances between the oxygen atoms of oleate ions and the H atoms on the hydroxylated surface were 1.284 Å and 1.675 Å, respectively, and the strong hydrogen bond (Oq–H···O1 hydrogen bond: Oq···O1 distance, 2.651 Å, Oq–H···O1 angle, 159.7°) was formed [63]. The corresponding interaction energy was −203.6 kJ/mol, manifesting that pure OL had a certain collection capacity for quartz by hydrogen bonds and Van der Waals forces, which is consistent with the results of flotation tests. Figure 9d represents the adsorption of Ca(H2O)3(OH)+, and the bond length of the newly formed Ca–Ow bond was 2.343 Å (note that the Ow atom belongs to water molecules involved in hydroxylation). The interaction energy of Ca(H2O)3(OH)+ on the hydroxylated surface of approximately −254.3 kJ/mol was 50.7 kJ/mol lower than that of pure OL on the quartz surface and 37.3 kJ/mol higher than that of OH on the quartz surface, which indicates that Ca(H2O)3(OH)+ was easier to adsorb on the hydroxylated surface than OL and could activate the hydroxylated quartz (101) surface. Through careful analysis of the optimized structures, one can observe that Ca(H2O)3(OH)+ adsorbed on the quartz surface via Ow atom sites on the hydroxylated structure, which is different from OH and OL through H atom sites, so the adsorption of OH and OL had little effect on the adsorption of Ca(H2O)3(OH)+. Figure 9e presents the optimized system of hydroxylated Quartz–Ca(H2O)3(OH)–OL, formed by OL coordinating with the Ca atom based on the previous optimized structure (Figure 9d). We found that the O atoms in the OL and Ca atoms in the optimized structure (Figure 9d) formed new O–Ca bonds with bond lengths of 2.343 Å and 2.369 Å, respectively. Simultaneously, a water molecule originally bound with a Ca atom was spontaneously dissociated into free H2O due to the stable six-coordinated structure of calcium ion in the solution [29]. Besides, the bond length of the previous Ow–Ca was shortened from 2.343 Å to 2.253 Å. The adsorption energy of OL on the activated surface was −460.7 kJ/mol, which decreased by 257.1 kJ/mol compared with that of OL without activation. This indicates that activation of Ca(H2O)3(OH)+ markedly promoted the adsorption of OL on the hydroxylated quartz (101) surface, which enhanced the hydrophobicity of the surface and greatly improved the recovery of quartz.

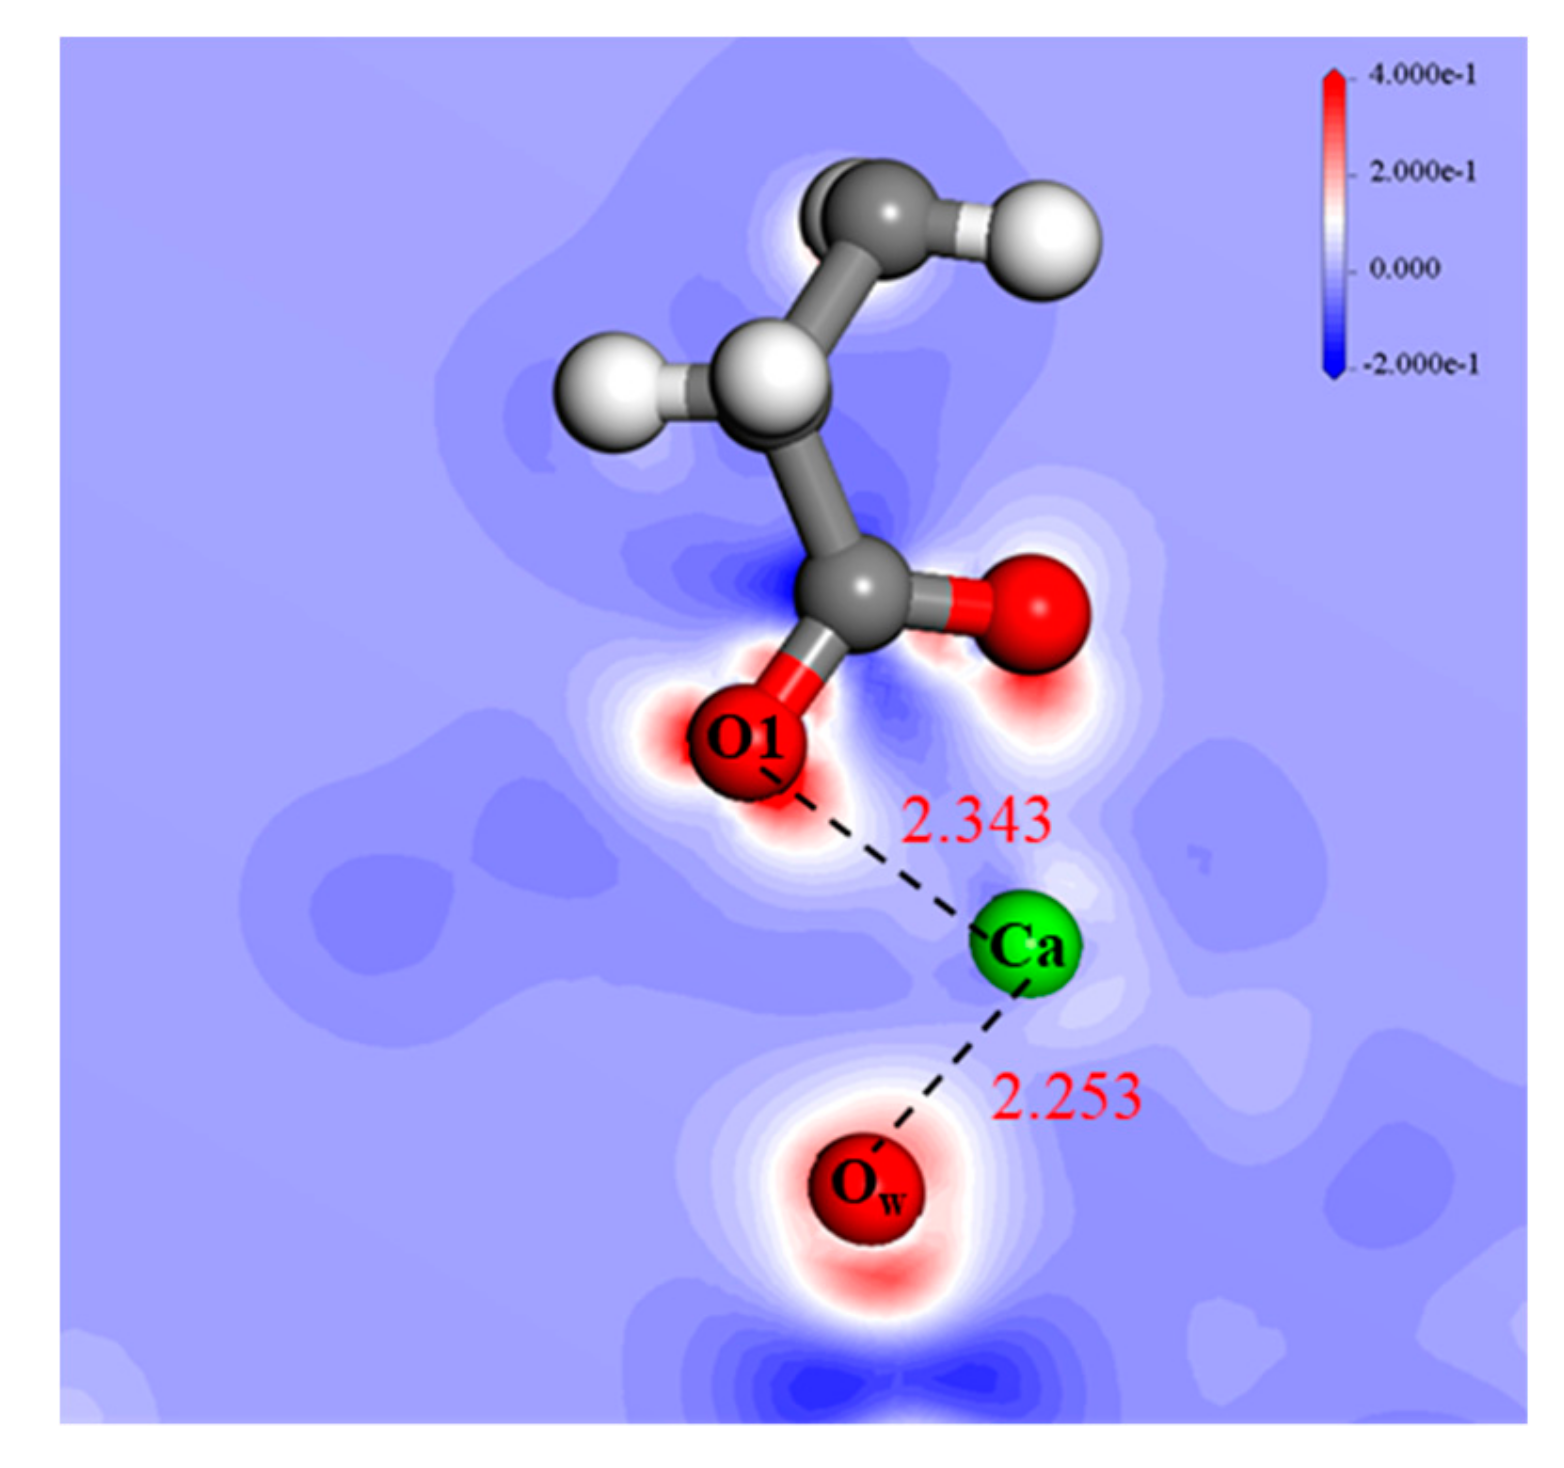
3.5.4. Electronic Properties Analyses

The Mulliken population analysis can explain the process of electron transfer, and the magnitude of bond populations was used as a handy assessment of the bond covalency [25]. The whole adsorption process can be divided into two stages: the first stage is the adsorption of Ca(H2O)3(OH)+ on the hydroxylated quartz (101) surface through the interaction with Ow atoms, followed by the adsorption of OL ions on the activated structure by calcium cluster. The involved atoms are labeled as presented in Figure 10 and the Mulliken populations for pertinent atoms and bonds are tabulated in Table 4 and Table 5, respectively. Obviously, during the adsorption process, the Mulliken charges of Ca atoms increased from +1.33 to +1.43, while the charges of Ow and O1 decreased from −1.06 to −1.13 and −0.55 to −0.70, respectively. This indicates that the electrons of the calcium cluster were transferred to the oxygen atom on the hydroxylated surface and to the oxygen atoms of OL. The bond population of Ca–Ow increased from 0.08 to 0.13, revealing the strengthened covalent character of the Ca–Ow bonds in the adsorption process of OL, which is consistent with shorter Ca–Ow bond length. The bond population of Ca–O1 changed from 0.00 to 0.07, corresponding to the formation of new bonds (note that the O1 atom belonged to the OL ion). In addition, the bond populations of Ca–Ow1 and Ca–Ow2 in the calcium cluster structure decreased from 0.05 to 0.00 and 0.32 to 0.04, respectively, implying that the adsorption of OL resulted in a certain degree of weakening of the calcium cluster structure.
Figure 10 represents the electron density difference of OL ion on Ca2+-activated hydroxylated α-quartz (101) surface. Obviously, the electron density of calcium atom decreased and the electron density of Ow and O1 atoms increased. The electron density of the overlap area between Ca and O atoms was very low, indicating a weaker covalency of Ca–O bonds, which accords with the lower bond population of Ca–O bonds. In terms of population analysis and electron density difference, it can be concluded that Ca atoms interact with the hydroxylated surface and OL by ionic Ca–O bonds during the whole adsorption process, where Ca atoms serve as a bridge between the hydroxylated quartz (101) surface and NaOL collector [12].

4. Conclusions

In this work, the rarely reported hydroxylation behaviors of water molecules on the α-quartz (101) surface were innovatively and systematically studied for the first time by DFT calculations, and the activation and flotation mechanisms of Ca (II) species and OL ions onto hydroxylated quartz structures were further scientifically and rigorously investigated by micro-flotation tests, zeta potential measurements, solution species distribution analysis, FTIR analysis, and first principles calculations.
The flotation results showed that the equilibrium recovery of quartz exceeded 87% in the presence of CaCl2 and NaOL in the optimal flotation pH range, which was up 70% compared with NaOL alone. Zeta potential analyses manifested calcium species can adsorb on the quartz surface with pH increasing and enhance the positive adsorption of oleate ions; The FTIR spectra of the quartz samples showed pure oleate ions exist physical adsorption or non-adsorption on quartz surface and oleate ions are mainly indirectly chemisorbed on the surface of quartz via calcium species. Owing to the strong hydrophilicity of quartz, the hydroxylation behaviors of H2O molecules on the α-quartz (101) surface were spontaneous and intense, and the most stable hydroxylated structure can be obtained when all the O–H bonds of the quartz surface intersect with each other in pairs.
According to the adsorption energies of various adsorbates on the pre-hydroxylated α-quartz (101) surface, the interaction strengths of the H2O, OH ions, Ca(H2O)3(OH)+ ions, and OL ions are in the order of H2O < OL < Ca(H2O)3(OH)+ < OH. However, due to the different action sites, the adsorptions of OH and OL have little effect on the adsorption of Ca(H2O)3(OH)+ on the hydroxylated surface. The interaction strength of OL on the activated structure was much higher than that of OL alone, indicating that calcium ions can advantageously promote the adsorption of OL on the surface of quartz. Mulliken population analysis along with electron density difference analysis showed electron transfer from calcium atoms to oxygen atoms on the hydroxylated surface and the oxygen atoms of OL, where Ca atoms serve as a bridge between the pre-hydroxylated quartz (101) surface and OL ions.

Author Contributions

Conceptualization, C.Z.; methodology, Z.X., S.C., and J.Z.; software, Z.X. and J.H.; validation, C.Z., D.C., P.C., and W.S.; formal analysis, Z.X., M.T., and Q.Z.; investigation, Z.X., M.T. and Q.Z.; resources, Y.H., D.C., P.C., and W.S.; data curation, C.Z. and Z.X.; writing—original draft preparation, Z.X. and J.H.; writing—review and editing, C.Z., D.C., P.C., and W.S.; visualization, Z.X. and J.H.; supervision, C.Z., D.C., P.C., and W.S.; project administration, C.Z. and Z.X.; funding acquisition, C.Z., Y.H., D.C., P.C., and W.S.

Funding

This research was funded by the Natural Science Foundation of China (Grant number 51704330), The Fund of State Key Laboratory of Mineral Processing (Grant number BGRIMM-KJSKL-2017-13), National key research and development plan (Grant number 2016YFE0101300), Open-End Fund for the Valuable and Precision Instruments of Central South University (Grant number CSUZC201805), National Key Scientific Research Project (Grant number 2018YFC1901601, 2018YFC1901602, and 2018YFC1901605), The Startup Fund of Central South University for Young Teachers (grant number 502044001), The graduate student independent exploration innovation project of Central South University (Grant number 2018zzts788), Natural Science Foundation of China (grant number 51374247), and The National 111 Project (Grant number B14034).

Acknowledgments

This work was performed in part using hardware and/or software provided by a Tianhe II supercomputer at the National Supercomputing Center in Guangzhou, and the High-Performance Computing Centers of Central South University and Nanjing University. The staff from the Supercomputing Center and High-Performance Computing Centers and the engineers from Beijing Paratera Technology Co., Ltd. provided effective support, and we offer our sincere gratitude.

Conflicts of Interest

The authors declare no conflict of interest.

References

  1. Hao, H.; Li, L.; Yuan, Z.; Liu, J. Molecular arrangement of starch, Ca2+ and oleate ions in the siderite-hematite-quartz flotation system. J. Mol. Liq. 2018, 254, 349–356. [Google Scholar] [CrossRef]
  2. Guo, W.; Zhu, Y.; Han, Y.; Wei, Y. Effects and activation mechanism of calcium ion on the flotation of quartz with fatty acid collector. J. Northeast. Univ. Nat. Sci. 2018, 39, 409–415. [Google Scholar]
  3. Sahoo, H.; Rath, S.S.; Das, B.; Mishra, B.K. Flotation of quartz using ionic liquid collectors with different functional groups and varying chain lengths. Miner. Eng. 2016, 95, 107–112. [Google Scholar] [CrossRef]
  4. Zhou, L. The Foundation of Ore Petrology; Metallurgical Industry Press: Beijing, China, 2007; pp. 145–148. [Google Scholar]
  5. Vatalis, K.I.; Charalambides, G.; Ploutarch, B.N. Market of high purity quartz innovative applications. Procedia Econ. Financ. 2015, 24, 734–742. [Google Scholar] [CrossRef]
  6. Wu, J.; Gao, X.; Chen, J.; Wang, C.; Zhang, S.; Dong, S. Review of high temperature piezoelectric materials, devices, and applications. Acta Phys. Sin. 2018, 67, 1–30. [Google Scholar]
  7. Tao, W.; Haibing, L.; Songnan, Z.; Hongwei, Y.; Haijun, W.; Xiaodong, Y. Research of precision cleaning technology of large caliber optics. Clean. World 2018, 34, 43–49. [Google Scholar]
  8. Saigusa, Y. Quartz-based piezoelectric materials. In Advanced Piezoelectric Materials, 2nd ed.; Woodhead Publishing: Sarston/Cambridge, UK, 2017; pp. 197–233. [Google Scholar]
  9. Sandvik, K.L.; Larsen, E. Iron ore flotation with environmentally friendly reagents. Miner. Metall. Process. 2014, 31, 95–102. [Google Scholar] [CrossRef]
  10. Ni, C.; Xie, G.; Jin, M.; Peng, Y.; Xia, W. The difference in flotation kinetics of various size fractions of bituminous coal between rougher and cleaner flotation processes. Powder Technol. 2016, 292, 210–216. [Google Scholar] [CrossRef]
  11. Wang, L.; Liu, R.; Hu, Y.; Liu, J.; Sun, W. Adsorption behavior of mixed cationic/anionic surfactants and their depression mechanism on the flotation of quartz. Powder Technol. 2016, 302, 15–20. [Google Scholar] [CrossRef]
  12. Zhu, Y.; Luo, B.; Sun, C.; Liu, J.; Sun, H.; Li, Y.; Han, Y. Density functional theory study of α-Bromolauric acid adsorption on the α-quartz (1 0 1) surface. Miner. Eng. 2016, 92, 72–77. [Google Scholar] [CrossRef]
  13. Kou, J.; Guo, Y.; Sun, T.; Xu, S.; Xu, C. Adsorption mechanism of two different anionic collectors on quartz surface. J. Cent. South Univ. Sci. Technol. 2015, 46, 4005–4014. [Google Scholar]
  14. Kou, J.; Xu, S.; Sun, T.; Sun, C.; Guo, Y.; Wang, C. A study of sodium oleate adsorption on Ca2+ activated quartz surface using quartz crystal microbalance with dissipation. Int. J. Miner. Process. 2016, 154, 24–34. [Google Scholar] [CrossRef]
  15. Hu, Y.; He, J.; Zhang, C.; Zhang, C.; Sun, W.; Zhao, D.; Chen, P.; Han, H.; Gao, Z.; Liu, R.; et al. Insights into the activation mechanism of calcium ions on the sericite surface: A combined experimental and computational study. Appl. Surf. Sci. 2018, 427, 162–168. [Google Scholar] [CrossRef]
  16. Wang, J.; Liu, Q.; Zeng, H. Understanding copper activation and xanthate adsorption on sphalerite by time-of-flight secondary ion mass spectrometry, X-ray photoelectron spectroscopy, and in situ scanning electrochemical microscopy. J. Phys. Chem. C 2013, 117, 20089–20097. [Google Scholar] [CrossRef]
  17. Liu, W.; Zhang, S.; Wang, W.; Zhang, J.; Yan, W.; Deng, J.; Feng, Q.; Huang, Y. The effects of Ca(II) and Mg(II) ions on the flotation of spodumene using NaOL. Miner. Eng. 2015, 79, 40–46. [Google Scholar] [CrossRef]
  18. Tian, M.; Gao, Z.; Sun, W.; Han, H.; Sun, L.; Hu, Y. Activation role of lead ions in benzohydroxamic acid flotation of oxide minerals: New perspective and new practice. J. Colloid Interface Sci. 2018, 529, 150–160. [Google Scholar] [CrossRef] [PubMed]
  19. Li, F.; Zhong, H.; Wang, S.; Liu, G. The activation mechanism of Cu(II) to ilmenite and subsequent flotation response to α-hydroxyoctyl phosphinic acid. J. Ind. Eng. Chem. 2016, 37, 123–130. [Google Scholar] [CrossRef]
  20. Luo, X.; Wang, Y.; Wen, S.; Ma, M.; Sun, C.; Yin, W.; Ma, Y. Effect of carbonate minerals on quartz flotation behavior under conditions of reverse anionic flotation of iron ores. Int. J. Miner. Process. 2016, 152, 1–6. [Google Scholar] [CrossRef]
  21. Shi, Y.; Qiu, G.; Hu, Y.; Chen, C. Surface chemical reactions in oleate flotation of quartz. Min. Metall. Eng. 2001, 21, 43–45. [Google Scholar]
  22. Gong, G.; Liu, J.; Han, Y.; Zhu, Y. An atomic scale investigation of the adsorption of sodium oleate on Ca2+ activated quartz surface. Physicochem. Probl. Miner. Process. 2019, 55, 426–436. [Google Scholar] [CrossRef]
  23. Liu, A.; Fan, J.-c.; Fan, M.-q. Quantum chemical calculations and molecular dynamics simulations of amine collector adsorption on quartz (0 0 1) surface in the aqueous solution. Int. J. Miner. Process. 2015, 134, 1–10. [Google Scholar] [CrossRef]
  24. Chen, J.; Lan, L.; Chen, Y. Computational simulation of adsorption and thermodynamic study of xanthate, dithiophosphate and dithiocarbamate on galena and pyrite surfaces. Miner. Eng. 2013, 46–47, 136–143. [Google Scholar] [CrossRef]
  25. Liu, J.; Gong, G.; Han, Y.; Zhu, Y. New insights into the adsorption of oleate on cassiterite: A DFT study. Minerals 2017, 7, 236. [Google Scholar] [CrossRef]
  26. Rath, S.S.; Sinha, N.; Sahoo, H.; Das, B.; Mishra, B.K. Molecular modeling studies of oleate adsorption on iron oxides. Appl. Surf. Sci. 2014, 295, 115–122. [Google Scholar] [CrossRef]
  27. Zhao, C.; Chen, J.; Li, Y.; Huang, D.; Li, W. DFT study of interactions between calcium hydroxyl ions and pyrite, marcasite, pyrrhotite surfaces. Appl. Surf. Sci. 2015, 355, 577–581. [Google Scholar] [CrossRef]
  28. Long, X.; Chen, Y.; Chen, J.; Xu, Z.; Liu, Q.; Du, Z. The effect of water molecules on the thiol collector interaction on the galena (PbS) and sphalerite (ZnS) surfaces: A DFT study. Appl. Surf. Sci. 2016, 389, 103–111. [Google Scholar] [CrossRef]
  29. Bakó, I.; Hutter, J.; Pálinkás, G. Car–Parrinello molecular dynamics simulation of the hydrated calcium ion. J. Chem. Phys. 2002, 117, 9838–9843. [Google Scholar] [CrossRef]
  30. Ikeda, T.; Boero, M.; Terakura, K. Hydration properties of magnesium and calcium ions from constrained first principles molecular dynamics. J. Chem. Phys. 2007, 127, 074503. [Google Scholar] [CrossRef]
  31. Wang, J.; Xia, S.; Yu, L. Adsorption of Pb(II) on the kaolinite(001) surface in aqueous system: A DFT approach. Appl. Surf. Sci. 2015, 339, 28–35. [Google Scholar] [CrossRef]
  32. Wang, X.; Liu, W.; Duan, H.; Wang, B.; Han, C.; Wei, D. The adsorption mechanism of calcium ion on quartz (101) surface: A DFT study. Powder Technol. 2018, 329, 158–166. [Google Scholar] [CrossRef]
  33. Yin, Z.; Hu, Y.; Sun, W.; Zhang, C.; He, J.; Xu, Z.; Zou, J.; Guan, C.; Zhang, C.; Guan, Q.; et al. Adsorption mechanism of 4-Amino-5-mercapto-1,2,4-triazole as flotation reagent on chalcopyrite. Langmuir 2018, 34, 4071–4083. [Google Scholar] [CrossRef]
  34. Farahat, M.; Hirajima, T.; Sasaki, K.; Doi, K. Adhesion of Escherichia coli onto quartz, hematite and corundum: Extended DLVO theory and flotation behavior. Coll. Surf. B Biointerfaces 2009, 74, 140–149. [Google Scholar] [CrossRef]
  35. Luo, B.; Zhu, Y.; Sun, C.; Li, Y.; Han, Y. Flotation and adsorption of a new collector α-Bromodecanoic acid on quartz surface. Miner. Eng. 2015, 77, 86–92. [Google Scholar] [CrossRef]
  36. De Leeuw, N.H.; Cooper, T.G. A computational study of the surface structure and reactivity of calcium fluoride. J. Mat. Chem. 2003, 13, 93–101. [Google Scholar] [CrossRef]
  37. Pradip, P.; Rai, B. Molecular modeling and rational design of flotation reagents. Int. J. Miner. Process. 2003, 72, 95–110. [Google Scholar] [CrossRef]
  38. Tian, M.; Zhang, C.; Han, H.; Liu, R.; Gao, Z.; Chen, P.; He, J.; Hu, Y.; Sun, W.; Yuan, D. Novel insights into adsorption mechanism of benzohydroxamic acid on lead (II)-activated cassiterite surface: An integrated experimental and computational study. Miner. Eng. 2018, 122, 327–338. [Google Scholar] [CrossRef]
  39. Lima, R.M.F.; Brandao, P.R.G.; Peres, A.E.C. The infrared spectra of amine collectors used in the flotation of iron ores. Miner. Eng. 2005, 18, 267–273. [Google Scholar] [CrossRef] [Green Version]
  40. Clark, S.J.; Segall, M.D.; Pickard, C.J.; Hasnip, P.J.; Probert, M.J.; Refson, K.; Payne, M.C. First principles methods using CASTEP. Z. für Krist. -Cryst. Mater. 2005, 220, 567–570. [Google Scholar] [CrossRef] [Green Version]
  41. Levien, L.; Prewitt C, T.; Weidner D, J. Structure and elastic properties of quartz at pressure. Am. Mineral. 1980, 65, 920–930. Available online: http://rruff.geo.arizona.edu/AMS/minerals/Quartz (accessed on 22 February 2019).
  42. Hu, Y.; Gao, Z.; Sun, W.; Liu, X. Anisotropic surface energies and adsorption behaviors of scheelite crystal. Coll. Surf. A Physicochem. Eng. Asp. 2012, 415, 439–448. [Google Scholar] [CrossRef]
  43. Bandura, A.V.; Kubicki, J.D.; Sofo, J.O. Periodic density functional theory study of water adsorption on the α-Quartz (101) surface. J. Phys. Chem. C 2011, 115, 5756–5766. [Google Scholar] [CrossRef]
  44. Sahoo, H.; Sinha, N.; Rath, S.S.; Das, B. Ionic liquids as novel quartz collectors: Insights from experiments and theory. Chem. Eng. J. 2015, 273, 46–54. [Google Scholar] [CrossRef]
  45. National Center for Biotechnology Information. CID=23665730 [Online]; PubChem Compound Database. Available online: https://pubchem.ncbi.nlm.nih.gov/compound/23665730 (accessed on 22 February 2019).
  46. Wang, G. Research on mechanism and application of several kinds of modified starch as hematite inhibitor. Master’s Thesis, Central South University, Changsha, China, May 2013. [Google Scholar]
  47. Tian, M.; Gao, Z.; Han, H.; Sun, W.; Hu, Y. Improved flotation separation of cassiterite from calcite using a mixture of lead (II) ion/benzohydroxamic acid as collector and carboxymethyl cellulose as depressant. Miner. Eng. 2017, 113, 68–70. [Google Scholar] [CrossRef]
  48. Wang, D.; Hu, Y. Solution Chemistry of Flotation; Hunan Science and Technology Press: Beijing, China, 1988; pp. 235–238. [Google Scholar]
  49. Lu, J.; Gao, H.; Jin, J.; Cen, D.; Ren, Z. Effect and mechanism of calcium ion on flotation of andalusite. Chin. J. Nonferrous Met. 2016, 26, 1311–1315. [Google Scholar]
  50. Luo, N.; Wei, D.-z.; Shen, Y.-b.; Liu, W.-g.; Gao, S.-l. Effect of calcium ion on the separation of rhodochrosite and calcite. J. Mat. Res. Technol. 2018, 7, 96–101. [Google Scholar] [CrossRef]
  51. Robert, P.; Per, S. Solution chemistry studies and flotation behaviour of apatite, calcite and fluorite minerals with sodium oleate collector. Int. J. Miner. Process. 1985, 15, 193–218. [Google Scholar]
  52. Filippov, L.O.; Duverger, A.; Filippova, I.V.; Kasaini, H.; Thiry, J. Selective flotation of silicates and Ca-bearing minerals: The role of non-ionic reagent on cationic flotation. Miner. Eng. 2012, 36–38, 314–323. [Google Scholar] [CrossRef]
  53. Liu, H.; Khoso, S.A.; Sun, W.; Zhu, Y.; Han, H.; Hu, Y.; Kang, J.; Meng, X.; Zhang, Q. A novel method for desulfurization and purification of fluorite concentrate using acid leaching and reverse flotation of sulfide. J. Clean. Prod. 2019, 209, 1006–1015. [Google Scholar] [CrossRef]
  54. Xue, J.; Wang, S.; Zhong, H.; Li, C.; Wu, F. Influence of sodium oleate on manganese electrodeposition in sulfate solution. Hydrometallurgy 2016, 160, 115–122. [Google Scholar] [CrossRef]
  55. Saikia, B.J.; Parthasarathy, G.; Sarmah, N.C. Fourier transform infrared spectroscopic estimation of crystallinity in SiO2 based rocks. Indian Acad. Sci. 2008, 31, 775–779. [Google Scholar] [CrossRef]
  56. Ren, L.; Qiu, H.; Zhang, Y.; Nguyen, A.V.; Zhang, M.; Wei, P.; Long, Q. Effects of alkyl ether amine and calcium ions on fine quartz flotation and its guidance for upgrading vanadium from stone coal. Powder Technol. 2018, 338, 180–189. [Google Scholar] [CrossRef]
  57. John, P.P.; Kieron, B.; Wang, Y. Generalized gradient approximation for the exchange-correlation hole of a many-electron system. Phys. Rev. B 1996, 54, 16533–16539. [Google Scholar] [Green Version]
  58. Perdew, J.P.; Chevary, J.A.; Vosko, S.H.; Jackson, K.A.; Pederson, M.R.; Singh, D.J.; Fiolhais, C. Atoms, molecules, solids, and surfaces: Applications of the generalized gradient approximation for exchange and correlation. Phys. Rev. B 1992, 46, 6671–6687. [Google Scholar] [CrossRef]
  59. Hammer, B.H.; Hansen, L.B.; Norskov, J.K. Improved adsorption energetics within density-functional theory using revised Perdew-Burke-Ernzerhof functionals. Phys. Rev. B 1999, 59, 7413–7421. [Google Scholar] [CrossRef] [Green Version]
  60. Perdew, J.P.; Ruzsinszky, A.; Csonka, G.I.; Vydrov, O.A.; Scuseria, G.E.; Constantin, L.A.; Zhou, X.; Burke, K. Restoring the Density-Gradient Expansion for Exchange in Solids and Surfaces. Phys. Rev. Lett. 2008, 100, 1–4. [Google Scholar] [CrossRef]
  61. Perdew, J.P.; Burke, K.; Ernzerhof, M. Generalized gradient approximation made simple. Phys. Rev. Lett. 1996, 77, 3865–3868. [Google Scholar] [CrossRef]
  62. Wu, Z.; Cohen, R.E. More accurate generalized gradient approximation for solids. Phys. Rev. B 2006, 73, 1–6. [Google Scholar] [CrossRef]
  63. Wang, X.; Zhang, Q.; Li, X.; Ye, J.; Li, L. Structural and electronic properties of different terminations for quartz (001) surfaces as well as water molecule adsorption on it: A first-principles study. Minerals 2018, 8, 58. [Google Scholar] [CrossRef]
Figure 1. The XRD spectrum of the used quartz pure mineral sample.
Minerals 09 00450 g001
Figure 2. The flowsheet and conditions of the micro-flotation tests.
Minerals 09 00450 g002
Figure 3. Quartz recovery as a function of pH (a), CaCl2 concentration (b), and NaOL concentration (c).
Minerals 09 00450 g003
Figure 4. (A) Species distribution diagram of calcium ion as a function of pH; (B) species distribution diagram of oleate ion as a function of pH; (C) zeta potentials of quartz as a function of pH in the absence or presence of flotation reagents; (D) FTIR spectra of the quartz test sample with different conditions.
Minerals 09 00450 g004
Figure 5. Total energy and lattice parameter difference as a function of k-point set with a cutoff energy of 489.8 eV and a GGA-PBESOL functional (a), as a function of cutoff energy with the k-point set to 3 × 3 × 2 and with a GGA-PBESOL functional (b).
Minerals 09 00450 g005
Figure 6. The optimized quartz bulk unit-cell with the optimum parameters of a GGA-PBESOL functional, 3 × 3 × 2 k-point set, 571.4 eV cut-off energy (color codes: yellow—Si, red—O).
Minerals 09 00450 g006
Figure 7. Quartz (101) surface structures: (a) original configuration and (b) optimized configuration (color codes: red—O, yellow—Si).
Minerals 09 00450 g007
Figure 8. The hydroxylation model of the quartz (101) surface with one water molecule adsorbed (a), four possible complete hydroxylation models of the quartz (101) surface with six water molecules adsorbed (b) (some structural fragments were cut out for the convenience of comparing structural differences) (color codes: gray—H, red—O, yellow—Si).
Minerals 09 00450 g008
Figure 9. The optimized adsorption model of a water molecule on the hydroxylated quartz (101) surface (a), OH ions on the hydroxylated quartz (101) surface (b), OL on the hydroxylated quartz (101) surface (c), Ca(H2O)3(OH)+ ions on the hydroxylated quartz (101) surface (d), OL on the previously activated structure (e).
Minerals 09 00450 g009
Figure 10. The electron density difference of OL ions adsorbed on the Ca2+-activated hydroxylated α-quartz (101) surface after optimization (blue contour represents decreased electron density and red contour indicates increased electron density).
Minerals 09 00450 g010
Table 1. Comparison of the computed quartz parameters from different generalized gradient approximation (GGA) functionals with experimental values under the condition of a cut-off energy of 489.8 eV and k-point mesh 3 × 3 × 2.
Data SourcesFunctionalsa/Åb/Åc/ÅTotal Difference/ÅDifference/%
AMCSD-4.9144.9145.405--
Calculated ValuesGGA-WC5.0545.0545.5240.3992.62
GGA-PBE5.0885.0885.5740.5183.40
GGA-RPBE5.1425.1425.6310.6844.49
GGA-PBESOL5.0355.0355.5260.3632.38
GGA-PW915.1235.1235.5840.5973.92
Table 2. The adsorption energy of the hydroxylation models of the quartz (101) surface with water molecules adsorbed.
ConfigurationaABCD
Adsorption energy (kJ/mol)−501.4−2483.8−2489.3−2467.9−2517.8
Table 3. The calculated adsorption energy of various adsorbates on the hydroxylated quartz (101) surface; unit is kJ/mol.
AdsorbateH2OOHOLCa(H2O)3(OH)+OL on the Ca(H2O)3(OH)+-Activated Surface
Interaction energy−20.9−291.6−203.6−254.3−460.7
Table 4. Mulliken populations of NaOL on the Ca(H2O)3(OH)+-activated hydroxylated α-quartz (101) surface.
AtomIn SequencespdTotalCharge (e)
CaBefore2.095.990.588.671.33
After2.106.000.478.571.43
OwBefore1.845.210.007.06−1.06
After1.875.250.007.13−1.13
O1Before1.854.700.006.55−0.55
After1.814.890.006.70−0.70
The energy levels corresponding to the angular quantum number 0, 1, 2 are marked by the spectroscopy symbols s, p, d, respectively.
Table 5. The bond populations of NaOL on the Ca(H2O)3(OH)+-activated hydroxylated α-quartz (101) surface.
BondMulliken Populations
BeforeLength/ÅAfterLength/Å
Ca–Ow0.082.3430.132.253
Ca–Ow10.052.5530.00-
Ca–Ow20.322.0360.042.511
Ca–O10.00-0.072.343

