Effects of Al3+ Substitution on Structural and Magnetic Behavior of CoFe2O4 Ferrite Nanomaterials


1
College of Medical Informatics, Hainan Medical University, Haikou 571199, China
2
Guangxi Key Laboratory of Nuclear Physics and Nuclear Technology, Guangxi Normal University, Guilin 541004, China
3
Sate Key Laboratory for Chemistry and Molecular Engineering of Medicinal Resources, Guangxi Normal University, Guilin 541004, China
4
College of Physics and Technology, Guangxi Normal University, Guilin 541004, China
*
Author to whom correspondence should be addressed.
Nanomaterials 2018, 8(10), 750; https://doi.org/10.3390/nano8100750
Submission received: 20 August 2018
/
Revised: 16 September 2018
/
Accepted: 17 September 2018
/
Published: 21 September 2018
Abstract
:A sol-gel autocombustion method was used to synthesize Al3+ ion-substituted cobalt ferrite CoAlxFe2−xO4 (x = 0–1.5). According to X-ray diffraction analysis (XRD), cobalt ferrite was in a single cubic phase after being calcined at 1000 °C for 3 h. Moreover, the lattice constant decreased with increase in aluminum substituents. When the sample was analyzed by Scanning Electron Microscopy (SEM), we found that uniformly sized, well-crystallized grains were distributed in the sample. Furthermore, we confirmed that Al3+ ion-substituted cobalt ferrite underwent a transition from ferrimagnetic to superparamagnetic behavior; the superparamagnetic behavior was completely correlated with the increase in Al3+ ion concentration at room temperature. All these findings were observed in Mössbauer spectra. For the cobalt ferrite CoAlxFe2−xO4, the coercivity and saturation magnetization decrease with an increase in aluminum content. When the annealing temperature of CoAl0.1Fe1.9O4 was steadily increased, the coercivity and saturation magnetization initially increased and then decreased.
1. Introduction
Ferrite is an important magnetic material. Cobalt ferrite is a hard ferromagnetic material, and its characteristic properties are as follows: moderate saturation magnetization (80 emu/g), high coercivity (5000 Oe), high Curie temperature TC (520 °C), large anisotropy constant (2.65 × 10⁵–5.1 × 10⁵ J/m3) [1,2]. Cobalt ferrite has the following properties: high electromagnetic performance, large magneto-optic effect, excellent chemical stability, and excellent mechanical hardness [1,2,3]. Because cobalt ferrite is a hard ferromagnetic material, it is used as a high-density recording medium [4]. Cobalt ferrite substituted nonmagnetic Al3+ ions; such material has low magnetic coercivity and large resistivity. Soft ferrite is the core material in power transformers that are used in the field of electronics and telecommunication. Singhal et al. [5] used the aerosol route for substituting Fe3+ ions in cobalt ferrite with Al3+ ions. The magnetic hyperfine field decreases; the ratio of Fe3+(oct.)/Fe3+(tet.) ions increases with an increase in Al3+ ions. Chae et al. [6] synthesized AlxCoFe2−xO4 ferrite powders, and they determined magnetic properties of the sample. In AlxCoFe2−xO4 ferrite powders, saturation magnetization and coercive force decrease with increasing concentration of Al. In a study conducted by Kumar et al. [7], it was found that crystallite size of cobalt ferrite increased when they were doped with Al3+ ions. Consequently, saturation magnetization, coercive force, remnant magnetization, and magnetic anisotropy constant decreased in these doped structures. Raghavender et al. [8] investigated the dielectric properties of cobalt ferrite by doping with Al3+ ions. These ferrite materials exhibit low dielectric character, so they are extensively used in high-frequency applications. In this study, ferrite CoAlxFe2−xO4 (x = 0–1.5) materials were synthesized with a sol-gel autocombustion process. The aim of this study was to determine the variation in the magnetic performance of cobalt ferrite powders, which were partially doped with nonmagnetic aluminum cations.
2. Experimentation
2.1. Sample Preparation
Cobalt ferrite powders CoAlxFe2−xO4 (x = 0–1.5) were synthesized with a sol-gel autocombustion process. The raw materials of the sample were of analytical grade: Co(NO3)2·6H2O, Al(NO3)3·9H2O, Fe(NO3)3·9H2O, C6H8O7·H2O (citric acid), and NH3·H2O (ammonia). The molar of metal nitrates Al(NO3)3·9H2O was 0–0.15 mol. The molar ratio of metal nitrates to citric acid was maintained at 1:1. After weighing metal nitrates and citric acid, they were dissolved in deionized water to prepare solutions. Ammonia was added to increase the pH of the metal nitrate solution from 7 to 9. A dried gel was obtained by stirring the metal nitrate mixture in a thermostat water bath at 80 °C. Citric acid was added continuously to the dried gel. The resultant gel was dried in an oven at 120 for 2 h. The resultant powder was then burnt by igniting it in air. The dried powders were ground and sintered at specific temperatures.
2.2. Characterization
The structure and crystallite sizes of CoAlxFe2−xO4 (x = 0–1.5) were determined by X-ray diffraction (D/max-2500V/PC, Rigaku Corporation, Tokyo, Japan) in the 2θ range of 20–70°. Micrographs were observed by scanning electron microscopy (NoVaTM Nano SEM 430, FEI Corporation, Hillsboro, OR, USA). Saturation magnetization was determined by Quantum Design MPMS series XL-7 (Quantum Design Corporation, San Diego, CA, USA). To obtain the Mössbauer spectrum, a Mössbauer spectroscope was operated in constant acceleration mode with a 57Co source (Fast Tec PC-mossII, FAST Corporation, Oberhaching, Bavaria, Germany).
3. Results and Discussion
3.1. X-ray Diffraction Analysis (XRD)
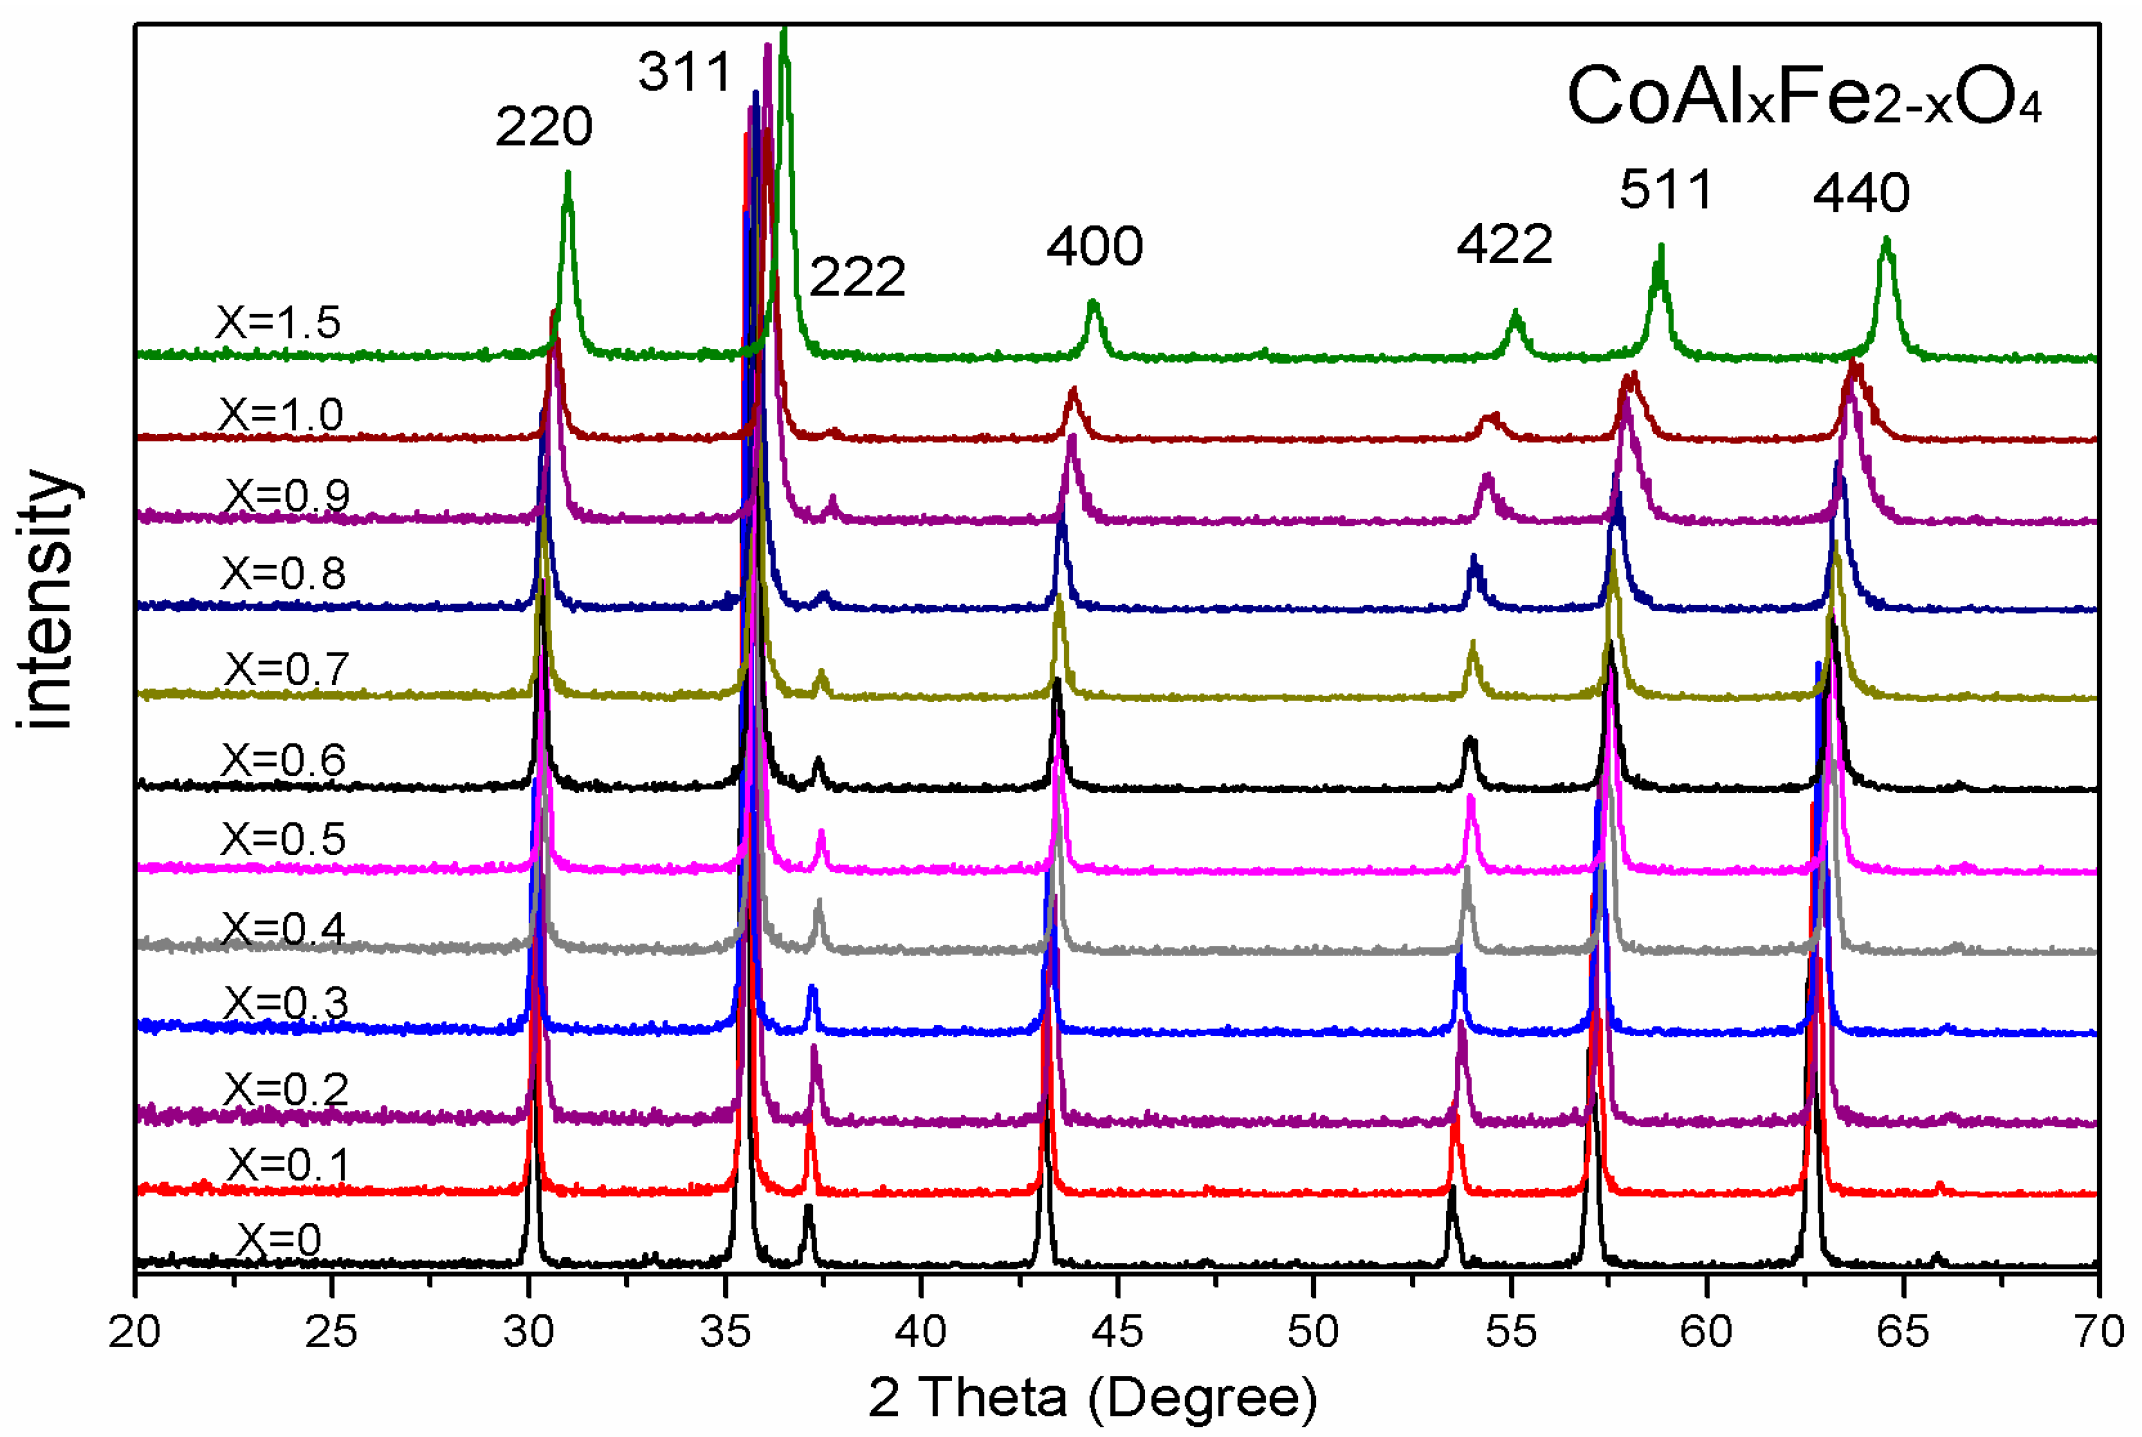
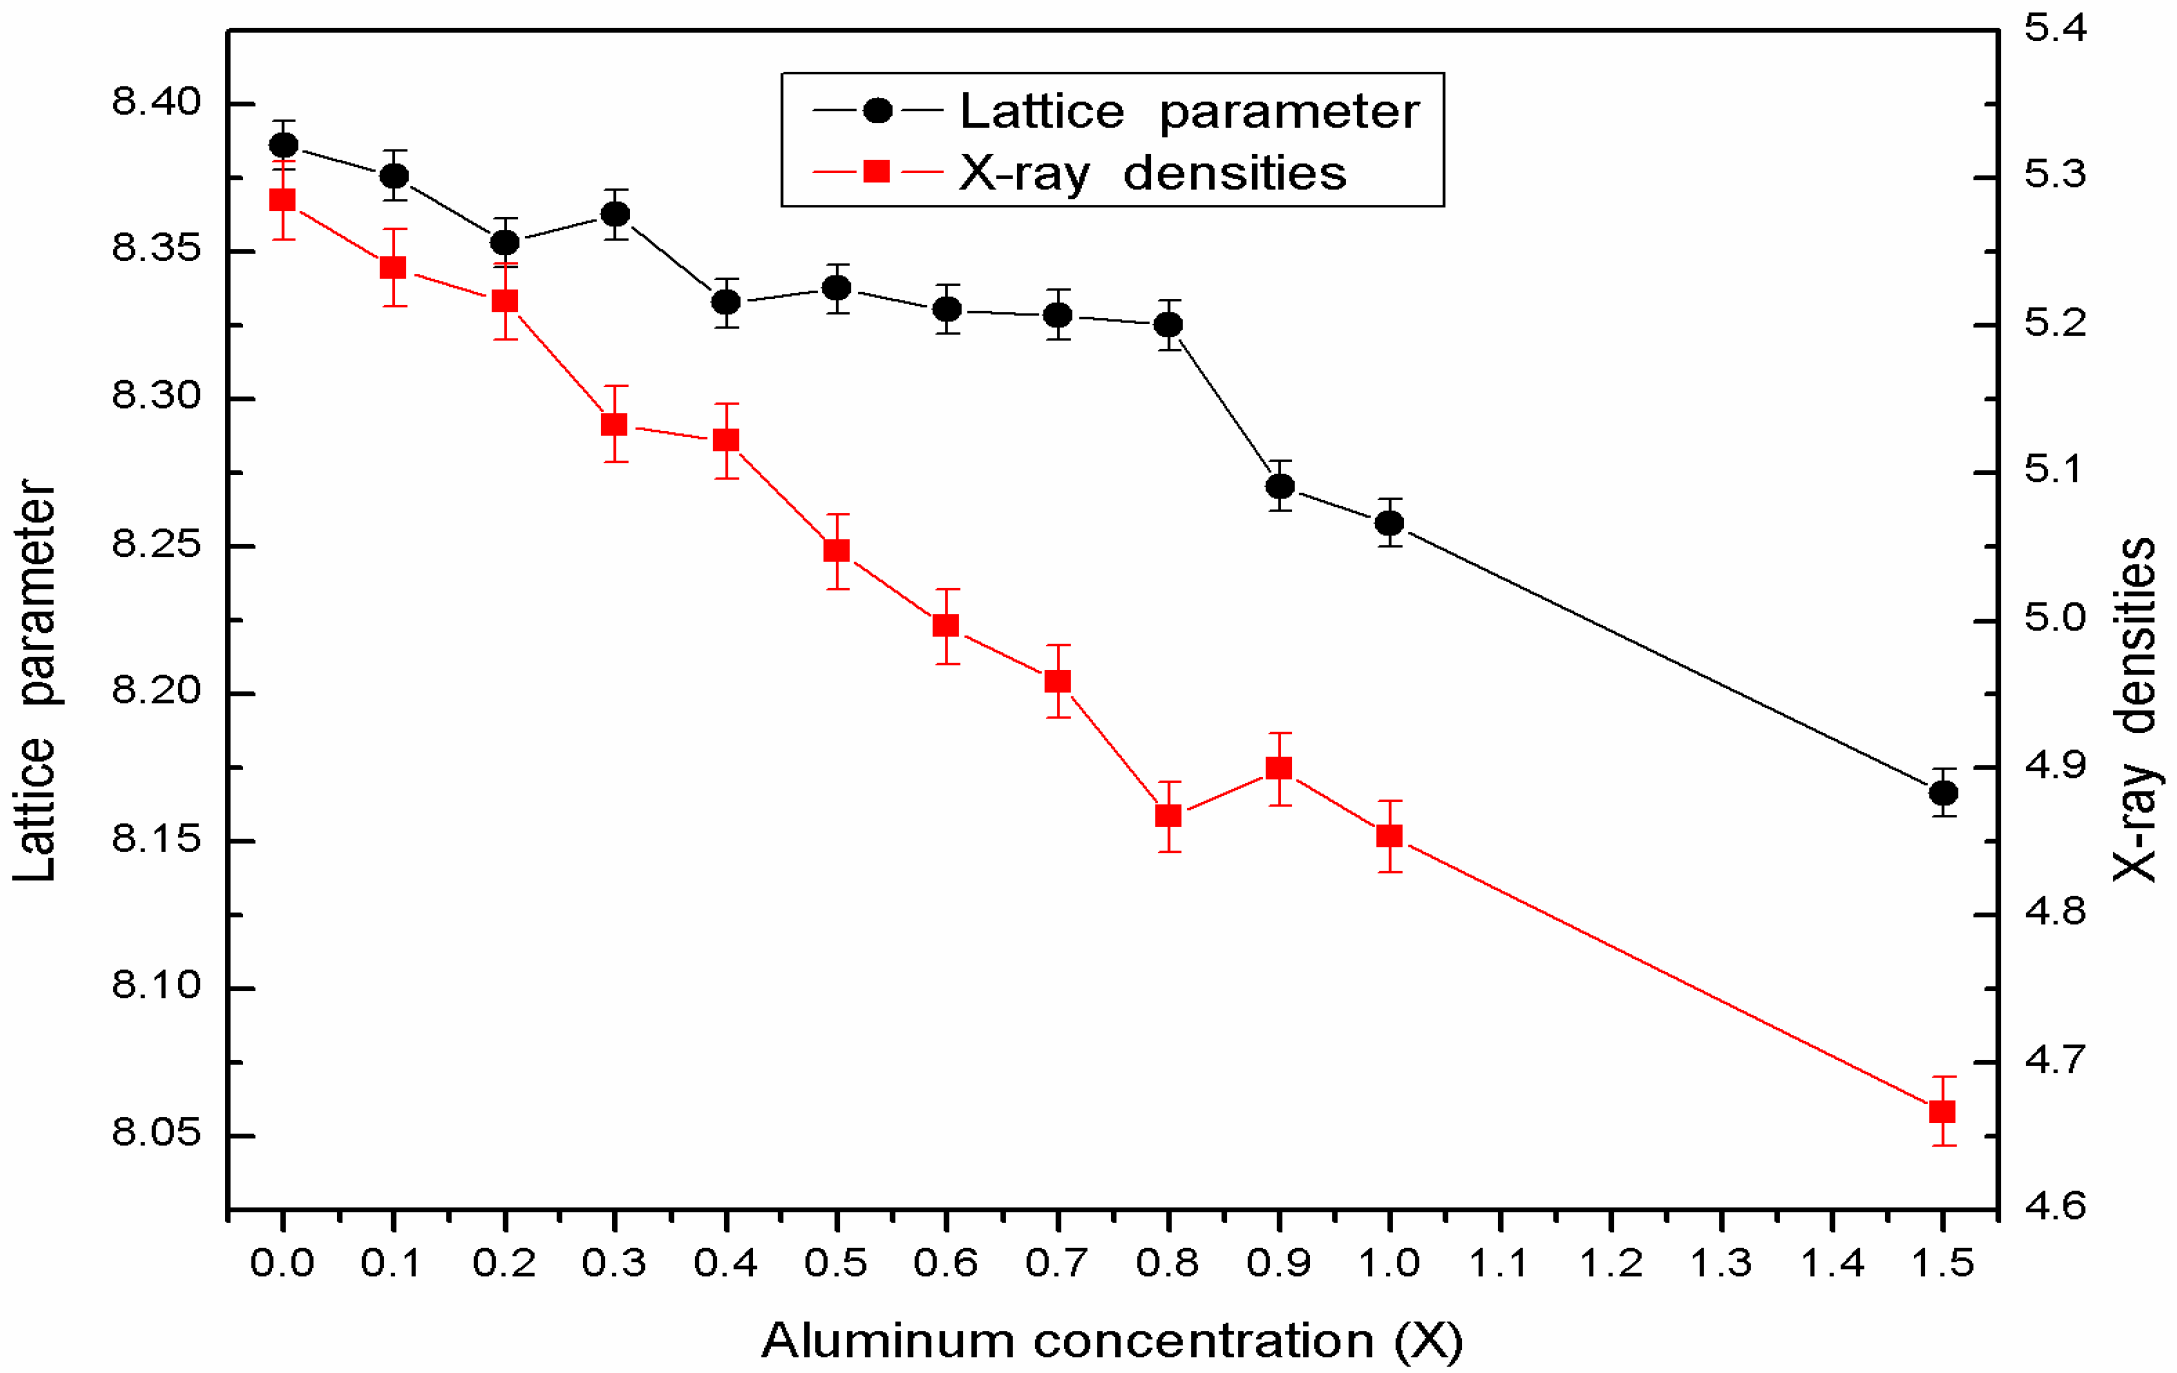
Figure 1 illustrates XRD patterns for CoAlxFe2−xO4 (x = 0–1.5) ferrites, which were calcined at 1000 °C. The XRD spectrum shows that all the samples have a single-phase structure. An impurity peak was not observed in these samples. Table 1 and Figure 2 prove that the lattice constant can be decreased by increasing the concentration of Al3+ ions. The decrease in lattice parameter is probably attributed to the radius of Al3+ ions (0.50 Å), which is smaller than Fe3+ ions (0.64 Å) [5,6]. X-ray density was determined from the following equation [5,8]:
where a is the lattice constant; M is the relative molecular weight; and N is the Avogadro number. Table 1 and Figure 2 show that density decreases with an increase in Al3+ ion content. Because the atomic weight of Fe is greater than that of Al, the relative density constant decreases with increasing Al3+ ion substitution. X-ray density decreases under the following condition: the relative decrease in molecular mass is greater than the negligible decline in the lattice parameter. The average crystallite size decreases with an increase in the concentration of Al3+ ions. This phenomenon has been attributed to the size mismatch of Al3+ and Fe3+ ions, increasing strain and stress in the sample [7].
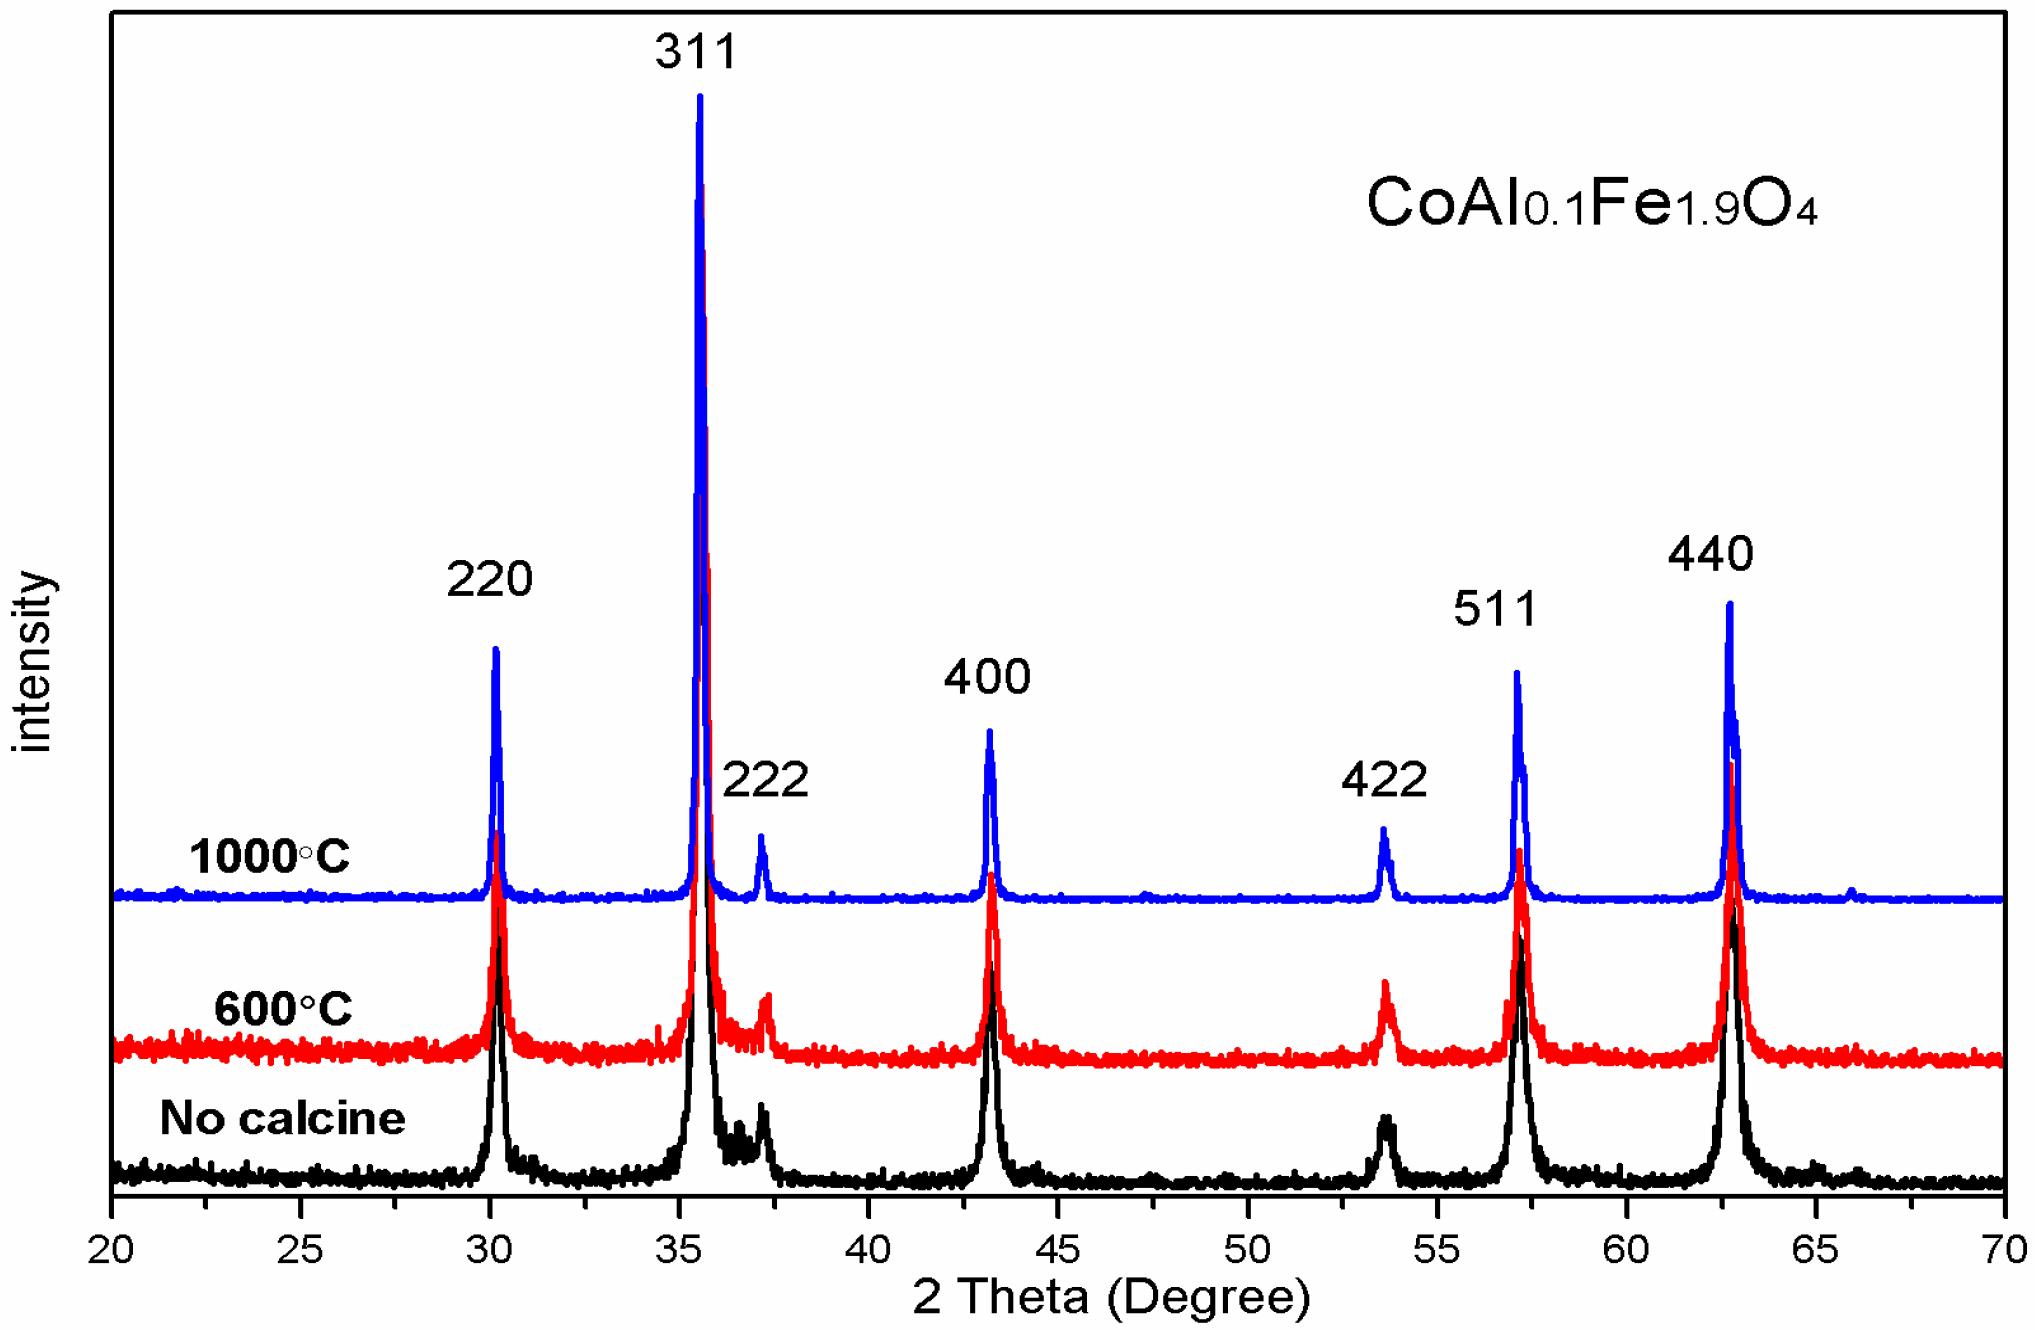
As shown in Figure 3, X-ray patterns (XRD) of CoAl0.1Fe1.9O4 were sintered at different temperatures. An average CoAl0.1Fe1.9O4 crystallite size increase by increasing the calcining temperature is observed in Table 2. All the samples were single-phase structures of spinel ferrite, which indicates the absence of an additional phase. No significant changes were observed in the lattice parameter of all samples. The average crystallite size of CoAl0.1Fe1.9O4 increased with an increase in calcination temperature [5].
3.2. Scanning Electron Microscopy (SEM)
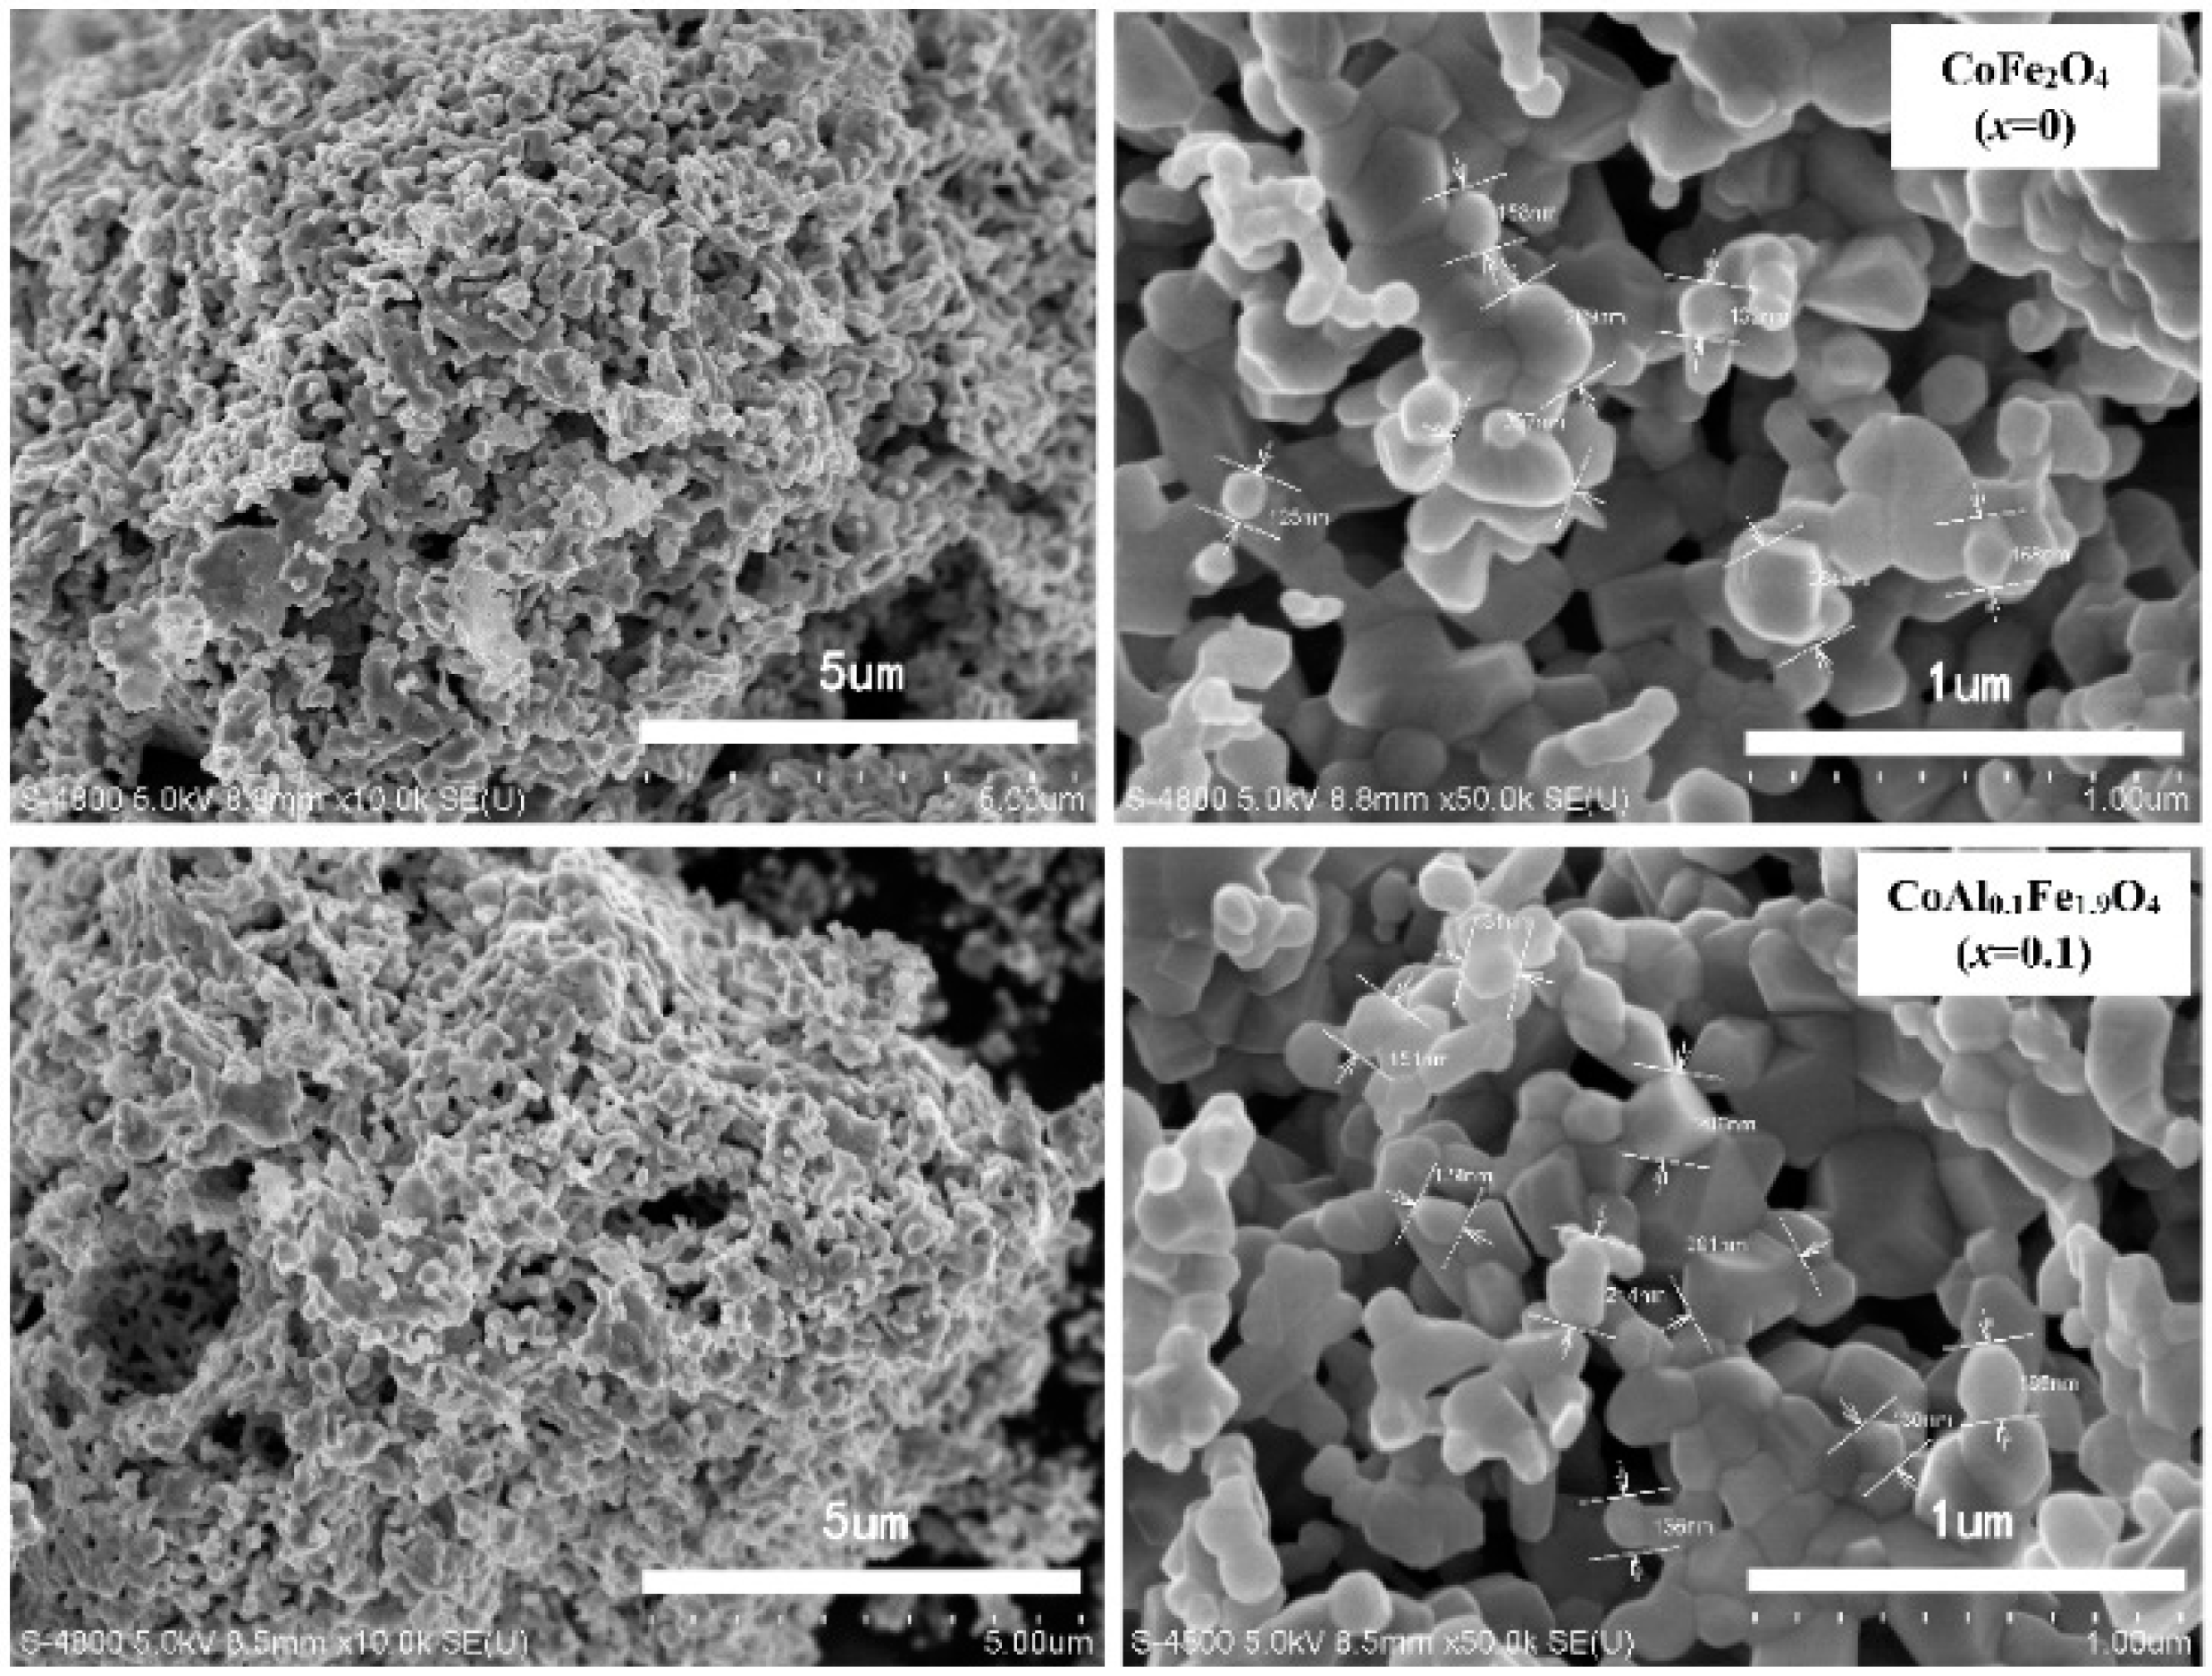
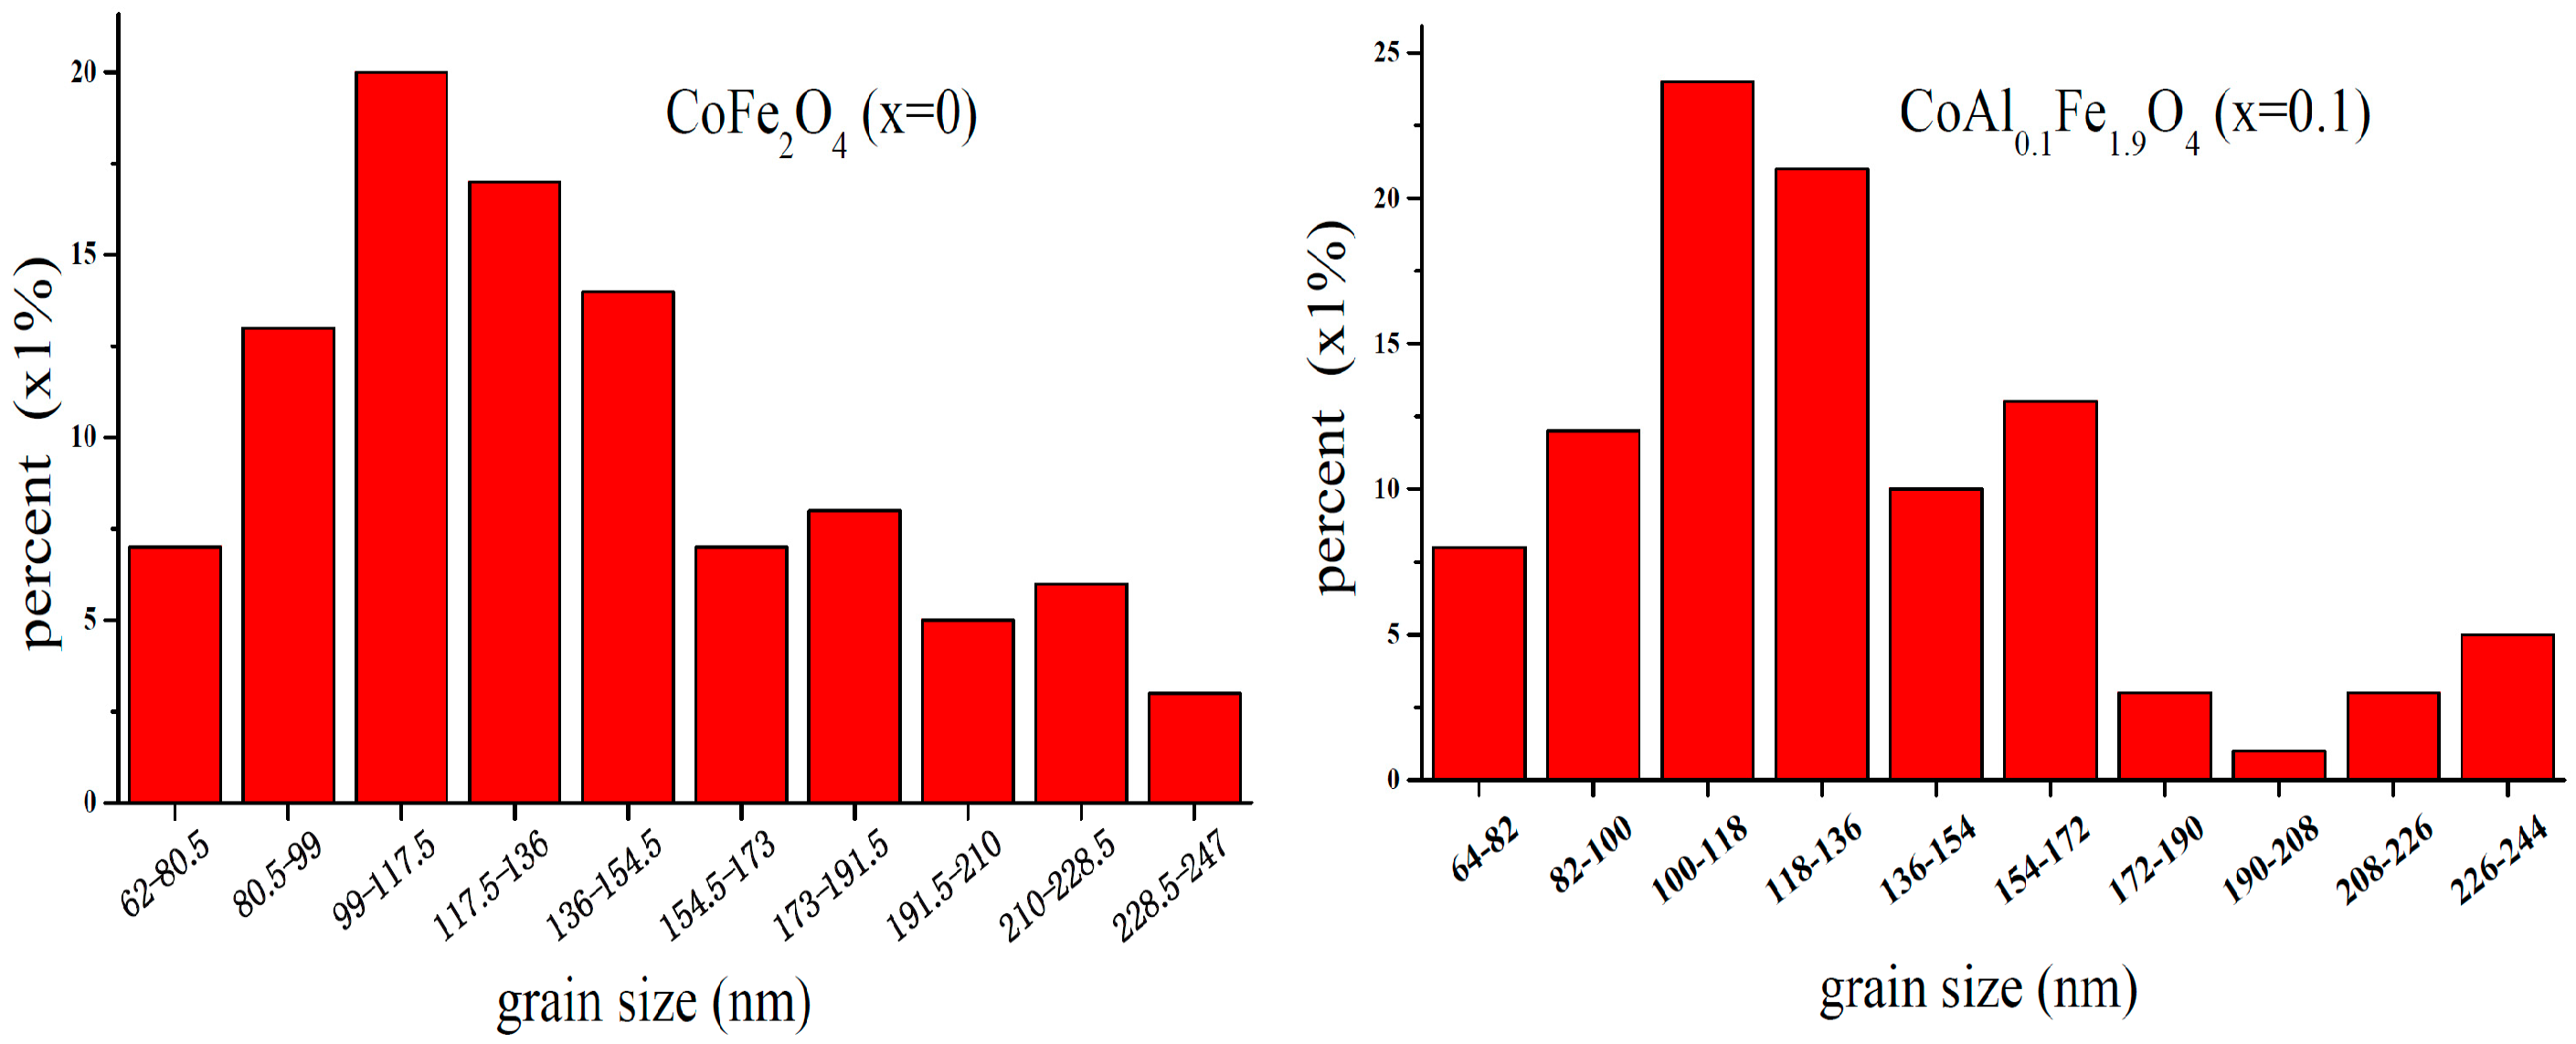
Figure 4 shows SEM micrographs of CoAlxFe2−xO4 (x = 0, 0.1) samples, which were annealed at 1000 °C for 3 h. Uniformly-sized, well-crystallized grains of CoAlxFe2−xO4 were obtained. Figure 5 illustrates the grain-size distribution of CoAlxFe2−xO4 (x = 0, 0.1) ferrites. The average grain size of CoFe2O4 and CoAl0.1Fe1.9O4 was about 137.5 nm and 130.5 nm, respectively. The average grain size decreased when aluminum substituents were increased. The XRD pattern confirms that the average crystallite size tends to decrease with increasing Al content. The average grain size was greater than a nanoparticle (100 nm), and the sintering temperature of the sample was very high because grain size increased with increasing annealing temperature [9].
3.3. Mössbauer Spectroscopy
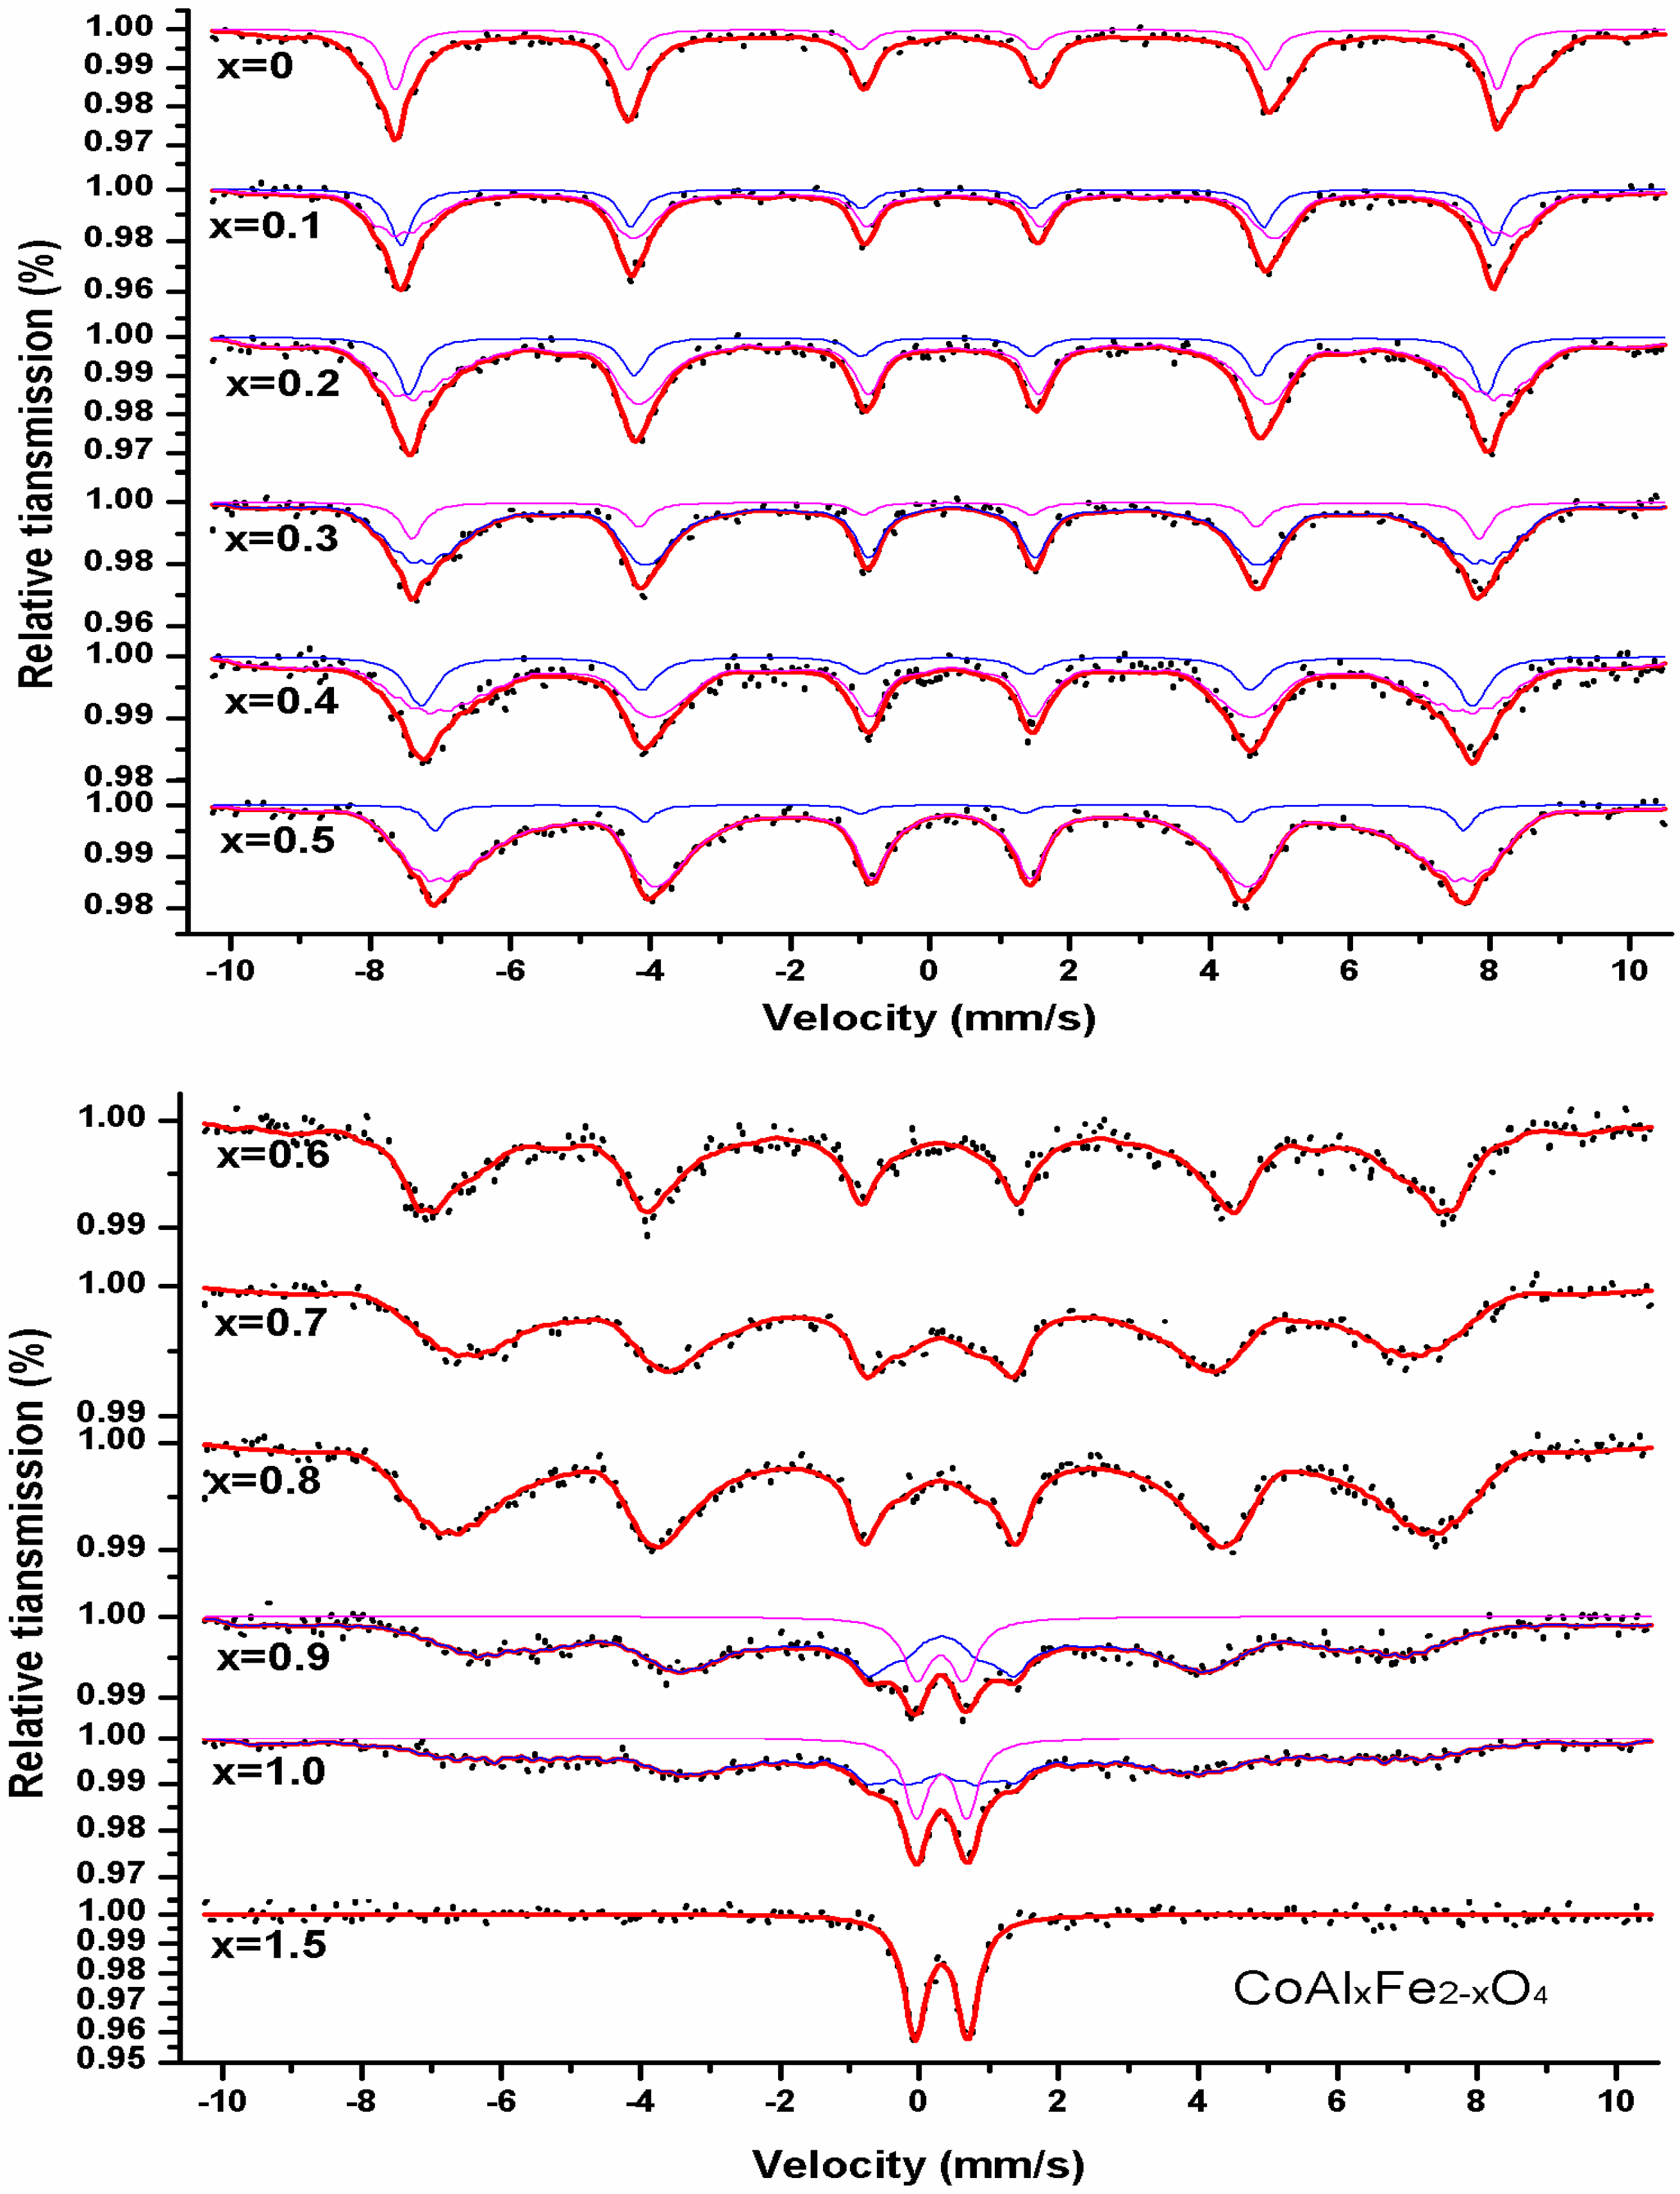
Figure 6 shows the Mösbauer spectra of CoAlxFe2−xO4 acquired at room temperature. The hyperfine parameters, isomer shift (I.S.), magnetic hyperfine field (Hhf), quadrupole shift (Q.S.), relative area (A0), and line width (Г), were obtained by fitted spectra using Mösswinn 3.0 software (FAST Corporation, Oberhaching, Germany), and calibration was relative to a 25 μm thick sample of high-purity alpha iron. The characteristic features of the spectra were as follows: there were two Zeeman-splitting sextets; one sextet was assigned to Fe3+ ion at the tetrahedral site, while the other sextet was attributed to Fe3+ ions at the octahedral site. This proved the ferromagnetism of the samples. The first sextet had a larger value of isomer shift, and it was assigned to octahedral B site. The second sextet had a smaller value of isomer shift, and was assigned to tetrahedral A site. Compared to the tetrahedral A-site ions, the bond separation of Fe3+ ions was greater in the octahedral B site of the Fe3+-O2− complex (Table 3). This minimized the overlapping of orbits of Fe3+ ions at the octahedral B-site; the larger isomeric shift was attributed to smaller covalency at octahedral B site [6].
It is well known that the values of isomeric shift are in the range of 0.6–1.7 mm/s for Fe2+(S = 2) ions; the values of isomeric shift are in the range of 0.1–0.5 mm/s for Fe3+(S = 1/2, 3/2, 5/2) ions [10]. As shown in Table 3, the values of I.S. indicate that iron is in Fe3+ state. By increasing the aluminum content, the values of the magnetic hyperfine field decreased at tetrahedral A and octahedral B sites. This is because magnetic ions (Fe3+ ions) are substituted by nonmagnetic ions (Al3+ ions), affecting the supertransferred hyperfine fields [5]. For all samples, the quadrupole shift value was very small for the magnetic sextet at the A and B site. This indicates that spinel ferrites have local cubic symmetry. The spectra of CoAlxFe2−xO4 (0.6 ≤ x ≤ 0.8) included the magnetic sextet of B site; the magnetic sextet of A site vanished. This indicates that Fe3+ ions existed only in the octahedral B site. When the spectrum of CoAlxFe2−xO4 (composition with x = 0.9 and 1.0) was analyzed, a single sextet and a central paramagnetic doublet were observed; this indicates relaxation effects. When the nonmagnetic Al content was increased in CoAlxFe2−xO4, the samples changed into a superparamagnetic character. The behavior of the sample went from a completely magnetic state to a mixed state of magnetic and superparamagnetic order [11,12]. For samples with x = 1.5, Mössbauer spectra consisted only of a central doublet; this exhibits a superparamagnetic character. The central doublet was attributed to the nearest nonmagnetic neighbors of magnetically isolated Fe3+ ions. This leads to the deficiency of long-range magnetic ordering [13,14].
The cation distribution of CoAlxFe2−xO4 ferrite can be written as follows:
(CoβFeαAl1−α−β)A[Co1−βFe2−x−αAlx−1+α+β]BO4
Based on the above cation distribution, the absorption-area ratio of A sites to B sites can be written as follows [12]:
where fA and fB are the recoil-free fractions of Fe3+ ions in tetrahedral A sites and octahedral B sites, respectively. The Mössbauer absorption area is proportional to the distribution of iron ions of A sites and B sites. In the current study, we assumed that fA and fB are equal [12]. Table 4 shows the cation distribution of all samples, and it was calculated using Equation (3).
3.4. Magnetic Analysis
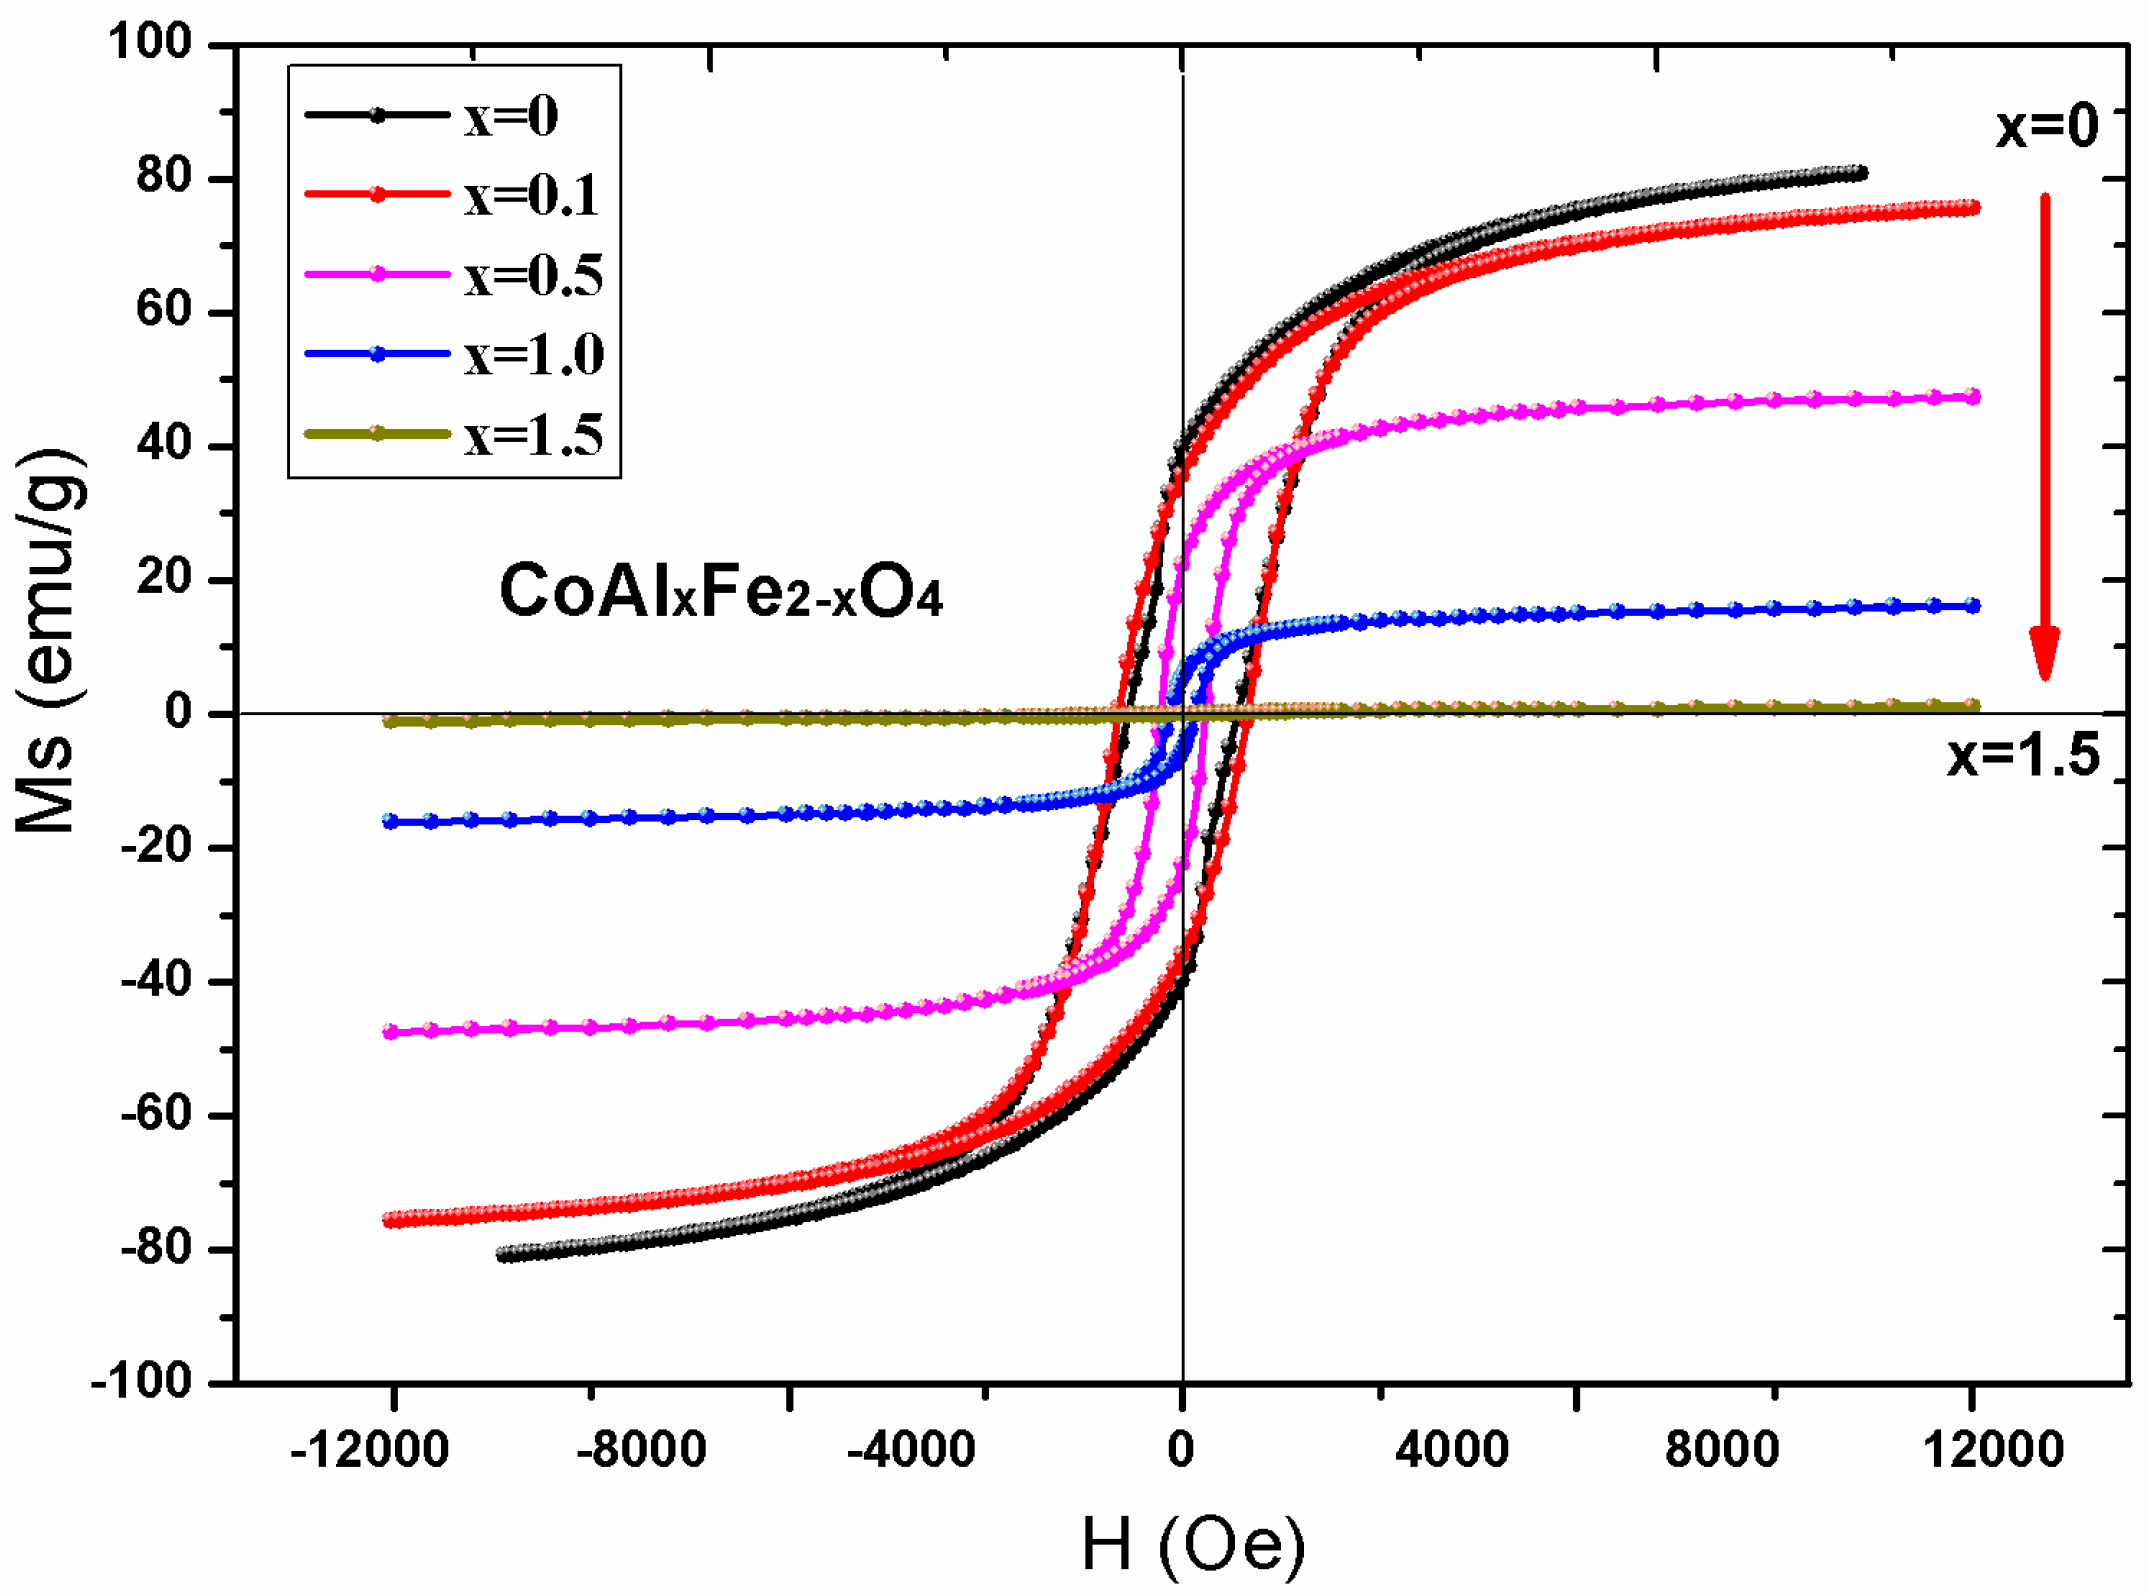
Figure 7 illustrates the hysteresis loops of CoAlxFe2−xO4 samples at room temperature. For all the samples, magnetization reached saturation when the strength of the magnetic field was 10,000 Oe. Table 5 shows that saturation magnetization decreased with an increase in Al3+ ion content. The saturation magnetization can be expressed with the following equation [12]:
where nB is the magnetic moment and M is the relative molecular mass. The relative molecular mass of CoAlxFe2−xO4 decreased with an increase in Al content. The change in magnetic moment nB was determined by Néel’s theory of magnetism. The magnetic moment of Al3+, Co2+, and Fe3+ ions was 0 μB, 3 μB, and 5 μB [15,16,17], respectively. Néel’s theory of magnetism was used to develop two sublattice models, which were then used to explain cation distribution in the Mössbauer spectra (Table 4). Magnetic moment nB is expressed by Equation (5) [15,16]:
where MB and MA are magnetic moments of the B and A sublattices, respectively. Figure 8 illustrates the changes in experimental and calculated magnetic moments, with changes in Al3+ ion content.
nB = MB – MA
Figure 8 illustrates that the experimental and calculated magnetic moment decreases with an increase in Al content (x ≤ 0.1). According to Equation (4), calculated saturation magnetization decreased with an increase in Al3+ ion substitution. The change trend of experimental and calculated saturation magnetization was similar for x ≤ 0.1, and there was deviation between experimental and calculated saturation magnetization, which can be attributed to the actual situation of ion distribution being more complicated than that obtained from the Mössbauer spectra. For the substituents (x ≥ 0.5), there was a big difference between calculated saturation magnetization and experimental saturation magnetization, and the experimental value was smaller than the calculated value for saturation magnetization [18,19,20]. This can be explained by the three-sublattice model of Yafet-Kittel (YK) [16]. It is reasonable that the spin-canting arrangement of the magnetic moment appeared on B sites of the sample when the content of nonmagnetic Al3+ ion substituents was too high in cobalt ferrite samples. This led to a decrease in A–B interaction and an increase in B–B interaction, which subsequently decreased magnetization.
Table 5 shows that the coercivity of CoAlxFe2−xO4 decreased with an increase in Al3+ ion content (x). Based on the results of the Mössbauer spectroscopy, we inferred that Co2+ ions of CoFe2O4 samples were located at the tetrahedral A sites and octahedral B sites. The magnetocrystalline anisotropy is primarily attributed to Co2+ ions of octahedral sites, which are present in pure cobalt ferrite CoFe2O4 [7]. The electron configuration of Co2+ ions is 3d7 [21]. The anisotropy is attributed to Co2+ ions in the octahedral site, causing frozen orbital angular momentum and spin coupling [22]. The Al3+ ions elicit zero angular momentum (l = 0), which does not affect magnetic anisotropy [23,24,25]. When Al3+ ions were replaced with Fe3+ ions, the spin-orbit coupling weakened and magnetocrystalline anisotropy decreased.
Equation (6) describes the relationship between the following parameters: coercivity HC, magnetic anisotropy K1, and saturation magnetization MS [7]:
When magnetic anisotropy decreased with an increase in Al3+ ions, it led to a decrease in coercivity.
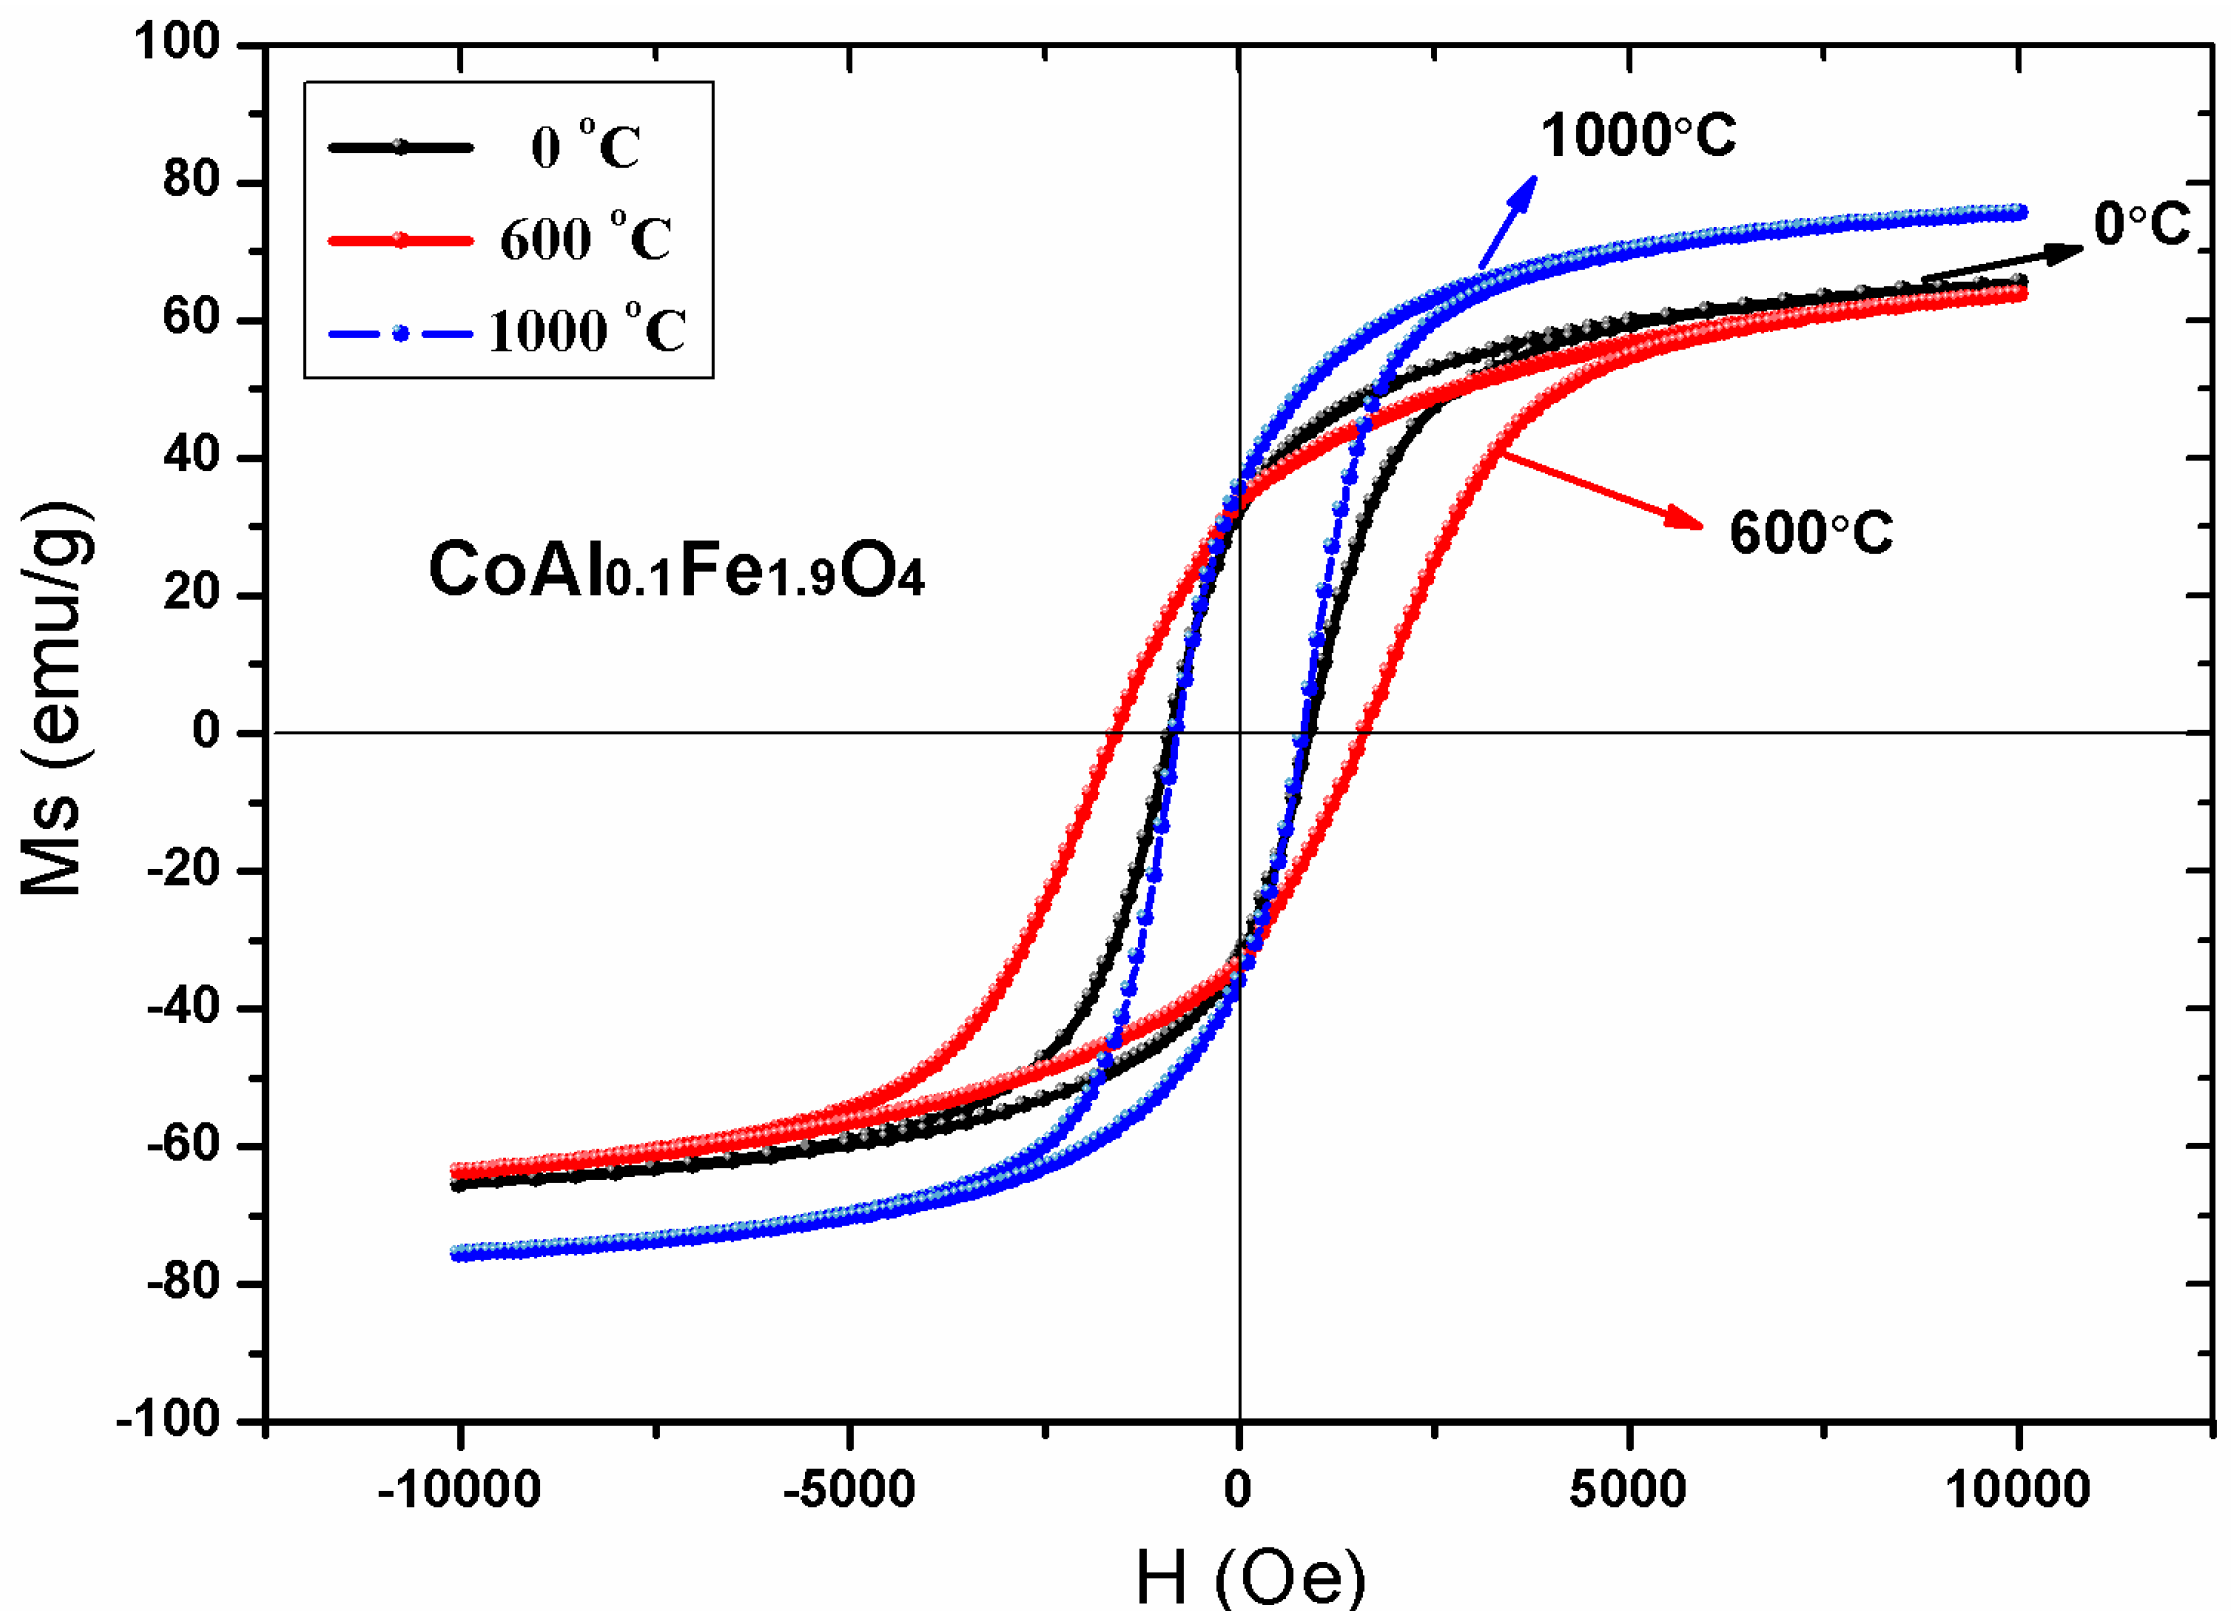
Figure 9 shows the magnetic hysteresis curves of an unsintered CoAl0.1Fe1.9O4 sample at room temperature; magnetic hysteresis curves of CoAl0.1Fe1.9O4 sample were also obtained after sintering them at 600 °C and 1000 °C, respectively. Table 6 shows that the saturation magnetization of CoAl0.1Fe1.9O4 sample increased with an increase in sintering temperature; these changes were attributed to an increase in particle size [5]. There is no significant change in the saturation magnetization of the unsintered CoAl0.1Fe1.9O4 sample; moreover, the CoAl0.1Fe1.9O4 sample did not show any significant change even after being annealed at 600 °C. This confirms that the uncalcined sample has good crystallinity, which was further established by XRD.
With a steadily increasing sintering temperature, the coercivity of CoAl0.1Fe1.9O4 sample initially increased and then steadily decreased. This may be attributed to variation in grain size. The coercivity of the single-domain region is given by the following equation: HC = g–h/D2. In the multidomain region, the relationship between coercivity and grain size is established by the following equation: HC = (a + b)/(D). Here, ‘D’ is the diameter and ‘g, h, a, and b’ are constants of the particle [5,26]. Hence, coercivity increased with increasing grain size in the single-domain region. In the multidomain region, coercivity decreased with an increase in particle diameter [27,28]. In our study, we determined the grain size of CoAl0.1Fe1.9O4 samples that were calcined at different temperatures; the grain size of CoAl0.1Fe1.9O4 samples varied from the single-domain region to the multidomain region. With an increasing annealing temperature, the coercivity of CoAl0.1Fe1.9O4 sample increased initially and then decreased.
4. Conclusions
XRD analysis reveals the single-phase structure of CoAlxFe2−xO4 samples that were calcined at 1000 °C. The lattice constant decreased when smaller Al3+ ions were replaced with larger Fe3+ ions. The XRD spectra of CoAl0.1Fe1.9O4 samples were obtained after sintering them at different temperatures; these samples were prepared with a sol-gel autocombustion method, so they had good crystallinity. SEM results indicate that well-crystallized particles of uniform size were present in the sample. We obtained the Mössbauer spectra of CoAlxFe2−xO4 samples, which were calcined at 1000 °C. The Mössbauer spectra reveal that with an increase in aluminum concentration, CoAlxFe2−xO4 samples undergo a transition from ferrimagnetic behavior to superparamagnetic behavior. Cation distribution was estimated from the Mössbauer data. The coercivity and saturation magnetization of CoAlxFe2−xO4 samples decreased with an increase in Al content (x). The changes in saturation magnetization can be attributed to Néel’s theory and the Yafet-Kittel model. Coercivity decreased with an increase in aluminum content, which is attributed to the weakening of magnetocrystalline anisotropy. The coercivity and saturation magnetization of CoAl0.1Fe1.9O4 sample initially increased and then steadily decreased. Particle size increased with an increase in annealed temperature.
Author Contributions
Q.L., Y.H. and J.M.X. contributed equally to this work. Q.L. and Y.H. participated in experimental design. Q.L. and J.P.L. performed the experiments. Z.P.G. and F.Y. contributed the reagents, materials, and analysis tools. F.Y. and J.M.X. collected the data. J.P.L. and J.M.X. analyzed the data. J.P.L. and Y.H. are corresponding authors who contributed equally to this study.
Funding
This work was financially supported by the National Natural Science Foundation of China (No. 11364004, 11164002), the Hainan Provincial Natural Science Foundation of China (No.818MS065), and the Science research project of Hainan higher education institutions (Grant No. Hnjg2017-41). All authors discussed the results and commented on the manuscript. The project was funded by the Guangxi Key Laboratory of Nuclear Physics and Nuclear Technology.
Conflicts of Interest
The authors declare no conflict of interest.
References
- Mohamed, R.M.; Rashada, M.M.; Haraz, F.A.; Sigmund, W. Structure and magnetic properties of nanocrystalline cobalt ferrite powders synthesized using organic acid precursor method. J. Magn. Magn. Mater. 2010, 322, 2058–2064. [Google Scholar] [CrossRef]
- Amiri, S.; Shokrollahi, H. The role of cobalt ferrite magnetic nanoparticles in medical science. Mater. Sci. Eng. C 2013, 33, 1–8. [Google Scholar] [CrossRef] [PubMed]
- Sanpo, N.; Berndt, C.C.; Wen, C.; Wang, J. Transition metal-substituted cobalt ferrite nanoparticles for biomedical applications. Acta Biomater. 2013, 9, 5830–5837. [Google Scholar] [CrossRef] [PubMed]
- Chia, C.H.; Zakaria, S.; Yusoffa, M.; Goh, S.C.; Haw, C.Y.; Ahmadi, S.; Huang, N.M.; Lim, H.N. Size and crystallinity-dependent magnetic properties of CoFe2O4 nanocrystals. Ceramurg. Int. 2010, 36, 605–609. [Google Scholar] [CrossRef]
- Singhal, S.; Barthwal, S.K.; Chandra, K. XRD, magnetic and Mössbauer spectral studies of nano size aluminum substituted cobalt ferrites (CoAlxFe2−xO4). J. Magn. Magn. Mater. 2006, 306, 233–240. [Google Scholar] [CrossRef]
- Chae, K.P.; Lee, J.-G.; Kweon, H.S.; Lee, Y.B. Synthesis and magnetic properties of AlxCoFe2−xO4 ferrite powders. Phys. Status Solidi 2004, 201, 1883–1888. [Google Scholar] [CrossRef]
- Kumar, L.; Kar, M. Influence of Al3+ ion concentration on the crystal structure and magnetic anisotropy of nanocrystalline spinel cobalt ferrite. J. Magn. Magn. Mater. 2011, 323, 2042–2048. [Google Scholar] [CrossRef]
- Raghavender, A.T.; Jadhav, K.M. Dielectric properties of Al-substituted Co ferrite nanoparticles. Bull. Mater. Sci. 2009, 32, 575–578. [Google Scholar] [CrossRef] [Green Version]
- Chae, K.P.; Lee, J.; Kweon, H.S.; Lee, Y.B. The crystallographic, magnetic properties of Al, Ti doped CoFe2O4 powders grown by sol-gel method. J. Magn. Magn. Mater. 2004, 283, 103–108. [Google Scholar] [CrossRef]
- Kumar, S.; Farea, A.M.M.; Batoo, K.M.; Lee, C.G.; Koo, B.H.; Ali, Y. Mössbauer studies of Co0.5CdxFe2.5-xO4 (0.0-0.5) ferrite. Phys. B 2008, 403, 3604–3607. [Google Scholar] [CrossRef]
- He, Y.; Lei, C.; Lin, Q.; Dong, J.; Yu, Y.; Wang, L. Mössbauer and Structural properties of La-substituted Ni0.4Cu0.2Zn0.4Fe2O4 nanocrystalline ferrite. Sci. Adv. Mater. 2015, 7, 1809–1815. [Google Scholar] [CrossRef]
- Wang, L.; Lu, J.B.; Li, J.; Hua, J.; Liu, M.; Zhang, Y.M.; Li, H.B. Cation distribution and magnetic properties of CoAlxFe2−xO4/SiO2 nanocomposites. Phys. B 2013, 421, 8–12. [Google Scholar] [CrossRef]
- Zhang, C.; Liu, L.; Cui, X.; Zheng, L.; Deng, Y.; Shi, F. Chlorine as an Indicator in the Controllable Preparation of Active Nano-Gold Catalyst. Sci. Rep. 2013, 3, 1503. [Google Scholar] [CrossRef] [PubMed] [Green Version]
- Singhal, S.; Barthwal, S.K.; Chandra, K. Cation distribution in the nano size aluminium substituted cobalt ferrites using XRD, magnetic and Mössbauer spectral studies. Indian J. Pure Appl. Phys. 2007, 45, 821–825. [Google Scholar]
- Jadhav, K.M.; Kawade, V.B.; Modi, K.B.; Bichile, G.K.; Kulkarni, R.G. Structural, magnetization and susceptibility studies on cobalt-ferri-aluminates synthesized by wet-chemical method. Phys. B 2000, 291, 379–386. [Google Scholar] [CrossRef]
- Jadhav, S.S.; Shirsath, S.E.; Patange, S.M.; Jadhav, K.M. Effect of Zn substitution on magnetic properties of nanocrystalline cobalt ferrite. J. Appl. Phys. 2010, 108, 093920. [Google Scholar] [CrossRef]
- Wang, L.; Wang, D.; Cao, Q.; Zheng, Y.; Xuan, H.; Gao, J.; Du, Y. Electric control of magnetism at room temperature. Sci. Rep. 2012, 2, 223. [Google Scholar] [CrossRef] [PubMed]
- Babić-Stojić, B.; Janković, V.; Milivojević, D.; Jagličć, Z.; Markovec, D.; Jović, N.; Marinović-Cinović, M. Magnetic and Structural Studies of CoFe2O4 Nanoparticles Suspended in an Organic Liquid. J. Nanomater. 2013, 2013, 741036. [Google Scholar] [CrossRef]
- Lin, Q.; Lei, C.; He, Y.; Xu, J.; Wang, R. Mössbauer and XRD studies of Ni0.6Cu0.2Zn0.2CexFe2−xO4 ferrites By Sol-Gel auto-combustion. J. Nanosci. Nanotechnol. 2015, 15, 2997–3003. [Google Scholar] [CrossRef] [PubMed]
- Yafet, Y.; Kittel, C. Antiferromagnetic Arrangements in Ferrites. Phys. Rev. 1952, 87, 290–294. [Google Scholar] [CrossRef]
- Sharifi, I.; Shokrollahi, H. Nanostructural, magnetic and Mössbauer studies of nanosized Co1−xZnxFe2O4 synthesized by co-precipitation. J. Magn. Magn. Mater. 2012, 324, 2397–2403. [Google Scholar] [CrossRef]
- GöZüak, F.; Köseoğlu, Y.; Baykal, A.; Kavas, H. Synthesis and characterization of Co1−xZnxFe2O4magnetic nanoparticles via a PEG-assisted route. J. Magn. Magn. Mater. 2009, 321, 2170–2177. [Google Scholar] [CrossRef]
- Huang, F.; Wang, Z.; Lu, X.; Zhang, J.; Min, K.; Lin, W.; Ti, R.; Xu, T.; He, J.; Yue, C.; et al. Peculiar magnetism of BiFeO3 nanoparticles with size approaching the period of the spiral spin structure. Sci. Rep. 2013, 3, 2907. [Google Scholar] [CrossRef] [PubMed]
- Gabal, M.A.; Abdel-Daiem, A.M.; al Angari, Y.M.; Ismaeel, I.M. Influence of Al-substitution on structural, electrical and magnetic properties of Mn-Zn ferrites nanopowders prepared via the sol-gel auto-combustion method. Polyhedron 2013, 57, 105–111. [Google Scholar] [CrossRef]
- He, Y.; Yang, X.; Lin, J.; Lin, Q.; Dong, J. Mössbauer spectroscopy, Structural and magnetic studies of Zn2+ substituted magnesium ferrite nanomaterials prepared by Sol-Gel method. J. Nanomater. 2015, 2015, 854840. [Google Scholar] [CrossRef]
- Maghsoudi, I.; Shokrollahi, H.; Hadianfard, M.J.; Amighian, J. Synthesis and characterization of NiAlxFe2−xO4 magnetic spinel ferrites produced by conventional method. Powder Technol. 2013, 235, 110–114. [Google Scholar] [CrossRef]
- Lin, J.; He, Y.; Lin, Q.; Wang, R.; Chen, H. Microstructural and Mössbauer spectroscopy Studies of Mg1−xZnxFe2O4 (x = 0.5, 0.7) nanoparticles. J. Spectrosc. 2014, 2014, 540319. [Google Scholar] [CrossRef]
- Motavallian, P.; Abasht, B.; Abdollah-Pour, H. Zr doping dependence of structural and magnetic properties of cobalt ferrite synthesized by sol-gel based Pechini method. J. Magn. Magn. Mater. 2018, 451, 577–586. [Google Scholar] [CrossRef]
Figure 1.
X-ray diffraction (XRD) patterns of CoAlxFe2−xO4 calcined at 1000 °C.

Figure 2.
The change in the lattice parameter and X-ray densities of CoAlxFe2−xO4.

Figure 3.
XRD patterns of ferrite CoAl0.1Fe1.9O4 calcined at different temperatures.

Figure 4.
Scanning electron microscopy (SEM) micrographs of CoFe2O4 (x = 0) and CoAl0.1Fe1.9O4 (x = 0.1) calcined at 1000 °C.
Figure 4.
Scanning electron microscopy (SEM) micrographs of CoFe2O4 (x = 0) and CoAl0.1Fe1.9O4 (x = 0.1) calcined at 1000 °C.

Figure 5.
Histogram of grain-size distribution for CoFe2O4 (x = 0) and CoAl0.1Fe1.9O4 (x = 0.1), which were calcined at 1000 °C.
Figure 5.
Histogram of grain-size distribution for CoFe2O4 (x = 0) and CoAl0.1Fe1.9O4 (x = 0.1), which were calcined at 1000 °C.

Figure 6.
Mössbauer spectra of CoAlxFe2−xO4 samples calcined at 1000 °C.

Figure 7.
The hysteresis loops of CoAlxFe2−xO4 samples calcined at 1000 °C.

Figure 8.
Variation in the experimental magnetic moment and calculated magnetic moment with changes in aluminum concentration.
Figure 8.
Variation in the experimental magnetic moment and calculated magnetic moment with changes in aluminum concentration.

Figure 9.
Room-temperature hysteresis curves of CoAl0.1Fe1.9O4 samples calcined at different temperatures.
Figure 9.
Room-temperature hysteresis curves of CoAl0.1Fe1.9O4 samples calcined at different temperatures.


Table 1.
The XRD data of CoAlxFe2−xO4 calcined at 1000 °C.
| Content (x) | Lattice Parameter (Å) | Average Crystallite Size (Å) | Density (g/cm3) |
|---|---|---|---|
| 0 | 8.38615 | 520 | 5.2847 |
| 0.1 | 8.37572 | 688 | 5.2392 |
| 0.2 | 8.35311 | 504 | 5.2161 |
| 0.3 | 8.36258 | 642 | 5.1328 |
| 0.4 | 8.33272 | 582 | 5.1216 |
| 0.5 | 8.33749 | 537 | 5.0470 |
| 0.6 | 8.33045 | 420 | 4.9959 |
| 0.7 | 8.32861 | 410 | 4.9583 |
| 0.8 | 8.32516 | 365 | 4.8666 |
| 0.9 | 8.27064 | 280 | 4.8992 |
| 1.0 | 8.25813 | 266 | 4.8534 |
| 1.5 | 8.16640 | 241 | 4.6668 |
Table 2.
XRD data of ferrite CoAl0.1Fe1.9O4 calcined at different temperatures.
| Temperature (℃) | Lattice Parameter (Å) | Average Crystallite Size (Å) | Density (g/cm3) |
|---|---|---|---|
| unsintered | 8.37425 | 337 | 5.2378 |
| 600 | 8.36801 | 346 | 5.2537 |
| 1000 | 8.37572 | 688 | 5.2392 |
Table 3.
Mössbauer parameters of CoAlxFe2−xO4 samples, which were calcined at 1000 °C.
| Content (x) | Component | Isomer Shift (I.S.) (mm/s) | Quadrupole Shift (Q.S.) (mm/s) | H(T) | Line Width (Γ) (mm/s) | Relative Area (A0) (%) |
|---|---|---|---|---|---|---|
| 0 | Sextet (A) | 0.238 | −0.011 | 48.852 | 0.366 | 28.4 |
| Sextet (B) | 0.355 | 0.0004 | 45.889 | 0.338 | 71.6 | |
| 0.1 | Sextet (A) | 0.245 | −0.002 | 48.387 | 0.376 | 29.88 |
| Sextet (B) | 0.332 | −0.017 | 45.563 | 0.348 | 70.2 | |
| 0.2 | Sextet (A) | 0.236 | 0.019 | 47.733 | 0.417 | 22.9 |
| Sextet (B) | 0.334 | 0.001 | 45.360 | 0.348 | 77.1 | |
| 0.3 | Sextet (A) | 0.236 | −0.030 | 47.293 | 0.381 | 15.8 |
| Sextet (B) | 0.311 | −0.002 | 44.824 | 0.348 | 84.2 | |
| 0.4 | Sextet (A) | 0.236 | 0.015 | 46.594 | 0.526 | 22.5 |
| Sextet (B) | 0.307 | −0.006 | 43.361 | 0.358 | 77.5 | |
| 0.5 | Sextet (A) | 0.224 | 0.102 | 45.589 | 0.329 | 7.5 |
| Sextet (B) | 0.305 | −0.003 | 42.156 | 0.374 | 92.5 | |
| 0.6 | Sextet (B) | 0.273 | −0.048 | 40.664 | 0.424 | 100 |
| 0.7 | Sextet (B) | 0.297 | −0.003 | 34.682 | 0.402 | 100 |
| 0.8 | Sextet (B) | 0.301 | 0.008 | 37.958 | 0.394 | 100 |
| 0.9 | Sextet (B) | 0.320 | −0.003 | 35.164 | 0.341 | 87.6 |
| Double | 0.302 | 0.670 | - | 0.466 | 12.4 | |
| 1.0 | Sextet (B) | 0.306 | −0.045 | 31.352 | 0.283 | 82.6 |
| Double | 0.321 | 0.726 | - | 0.406 | 17.4 | |
| 1.5 | Double | 0.318 | 0.752 | - | 0.389 | 100 |
Table 4.
The cationic distribution of all samples, which were calcined at 1000 °C.
| Sample | Cation Distribution |
|---|---|
| CoFe2O4 | (Co0.43Fe0.57)A[Co0.57Fe1.43]BO4 |
| CoAl0.1Fe1.9O4 | (Co0.43Fe0.57)A[Co0.57Fe1.33Al0.1]BO4 |
| CoAl0.2Fe1.8O4 | (Co0.43Fe0.41Al0.16)A[Co0.57Fe1.39Al0.04]BO4 |
| CoAl0.3Fe1.7O4 | (Co0.43Fe0.27Al0.3)A[Co0.57Fe1.43]BO4 |
| CoAl0.4Fe1.6O4 | (Co0.43Fe0.36Al0.21)A[Co0.57Fe1.27Al0.19]BO4 |
| CoAl0.5Fe1.5O4 | (Co0.43Fe0.11Al0.46)A[Co0.57Fe1.39Al0.04]BO4 |
| CoAl0.6Fe1.4O4 | (Co0.43Al0.57)A[Co0.57Fe1.40Al0.03]BO4 |
| CoAl0.7Fe1.3O4 | (Co0.43Al0.57)A[Co0.57Fe1.30Al0.13]BO4 |
| CoAl0.8Fe1.2O4 | (Co0.43Al0.57)A[Co0.57Fe1.20Al0.23]BO4 |
| CoAl0.9Fe1.1O4 | (Co0.43Al0.57)A[Co0.57Fe1.10Al0.33]BO4 |
| CoAl1.0Fe1.0O4 | (Co0.43Al0.57)A[Co0.57Fe1.00Al0.43]BO4 |
| CoAl1.5Fe0.5O4 | (Co0.43Al0.57)A[Co0.57Fe0.50Al0.93]BO4 |
Table 5.
Magnetic parameters of CoAlxFe2−xO4 calcinated at 1000 °C obtained from hysteresis measurements.
Table 5.
Magnetic parameters of CoAlxFe2−xO4 calcinated at 1000 °C obtained from hysteresis measurements.
| Content (x) | Ms (emu/g) | Hc (Oe) | Mr (emu/g) | nB |
|---|---|---|---|---|
| 0 | 80.89 | 802.77 | 37.15 | 3.40 |
| 0.1 | 75.66 | 802.76 | 37.75 | 3.14 |
| 0.5 | 47.43 | 301.11 | 22.54 | 1.87 |
| 1.0 | 16.13 | 150.56 | 5.45 | 0.59 |
| 1.5 | 1.06 | 150.38 | 0.10 | 0.04 |
Table 6.
Magnetic data for CoAl0.1Fe1.9O4 sample calcined at different temperatures.
| Temperature (°C) | Ms (emu/g) | Hc (Oe) | Mr (emu/g) | nB |
|---|---|---|---|---|
| unsintered | 65.52 | 902.92 | 32.77 | 2.72 |
| 600 | 63.78 | 1605.13 | 33.53 | 2.65 |
| 1000 | 75.66 | 802.76 | 37.75 | 3.14 |
© 2018 by the authors. Licensee MDPI, Basel, Switzerland. This article is an open access article distributed under the terms and conditions of the Creative Commons Attribution (CC BY) license (http://creativecommons.org/licenses/by/4.0/).
Share and Cite
MDPI and ACS Style
Lin, Q.; He, Y.; Xu, J.; Lin, J.; Guo, Z.; Yang, F. Effects of Al3+ Substitution on Structural and Magnetic Behavior of CoFe2O4 Ferrite Nanomaterials. Nanomaterials 2018, 8, 750. https://doi.org/10.3390/nano8100750
AMA Style
Lin Q, He Y, Xu J, Lin J, Guo Z, Yang F. Effects of Al3+ Substitution on Structural and Magnetic Behavior of CoFe2O4 Ferrite Nanomaterials. Nanomaterials. 2018; 8(10):750. https://doi.org/10.3390/nano8100750
Chicago/Turabian StyleLin, Qing, Yun He, Jianmei Xu, Jinpei Lin, Zeping Guo, and Fang Yang. 2018. "Effects of Al3+ Substitution on Structural and Magnetic Behavior of CoFe2O4 Ferrite Nanomaterials" Nanomaterials 8, no. 10: 750. https://doi.org/10.3390/nano8100750
Note that from the first issue of 2016, this journal uses article numbers instead of page numbers. See further details here.