Link between Food Energy Density and Body Weight Changes in Obese Adults

Abstract
:1. Introduction
2. Experimental Section
2.1. Search Strategy
2.2. Inclusion and Exclusion Criteria
2.3. Data Extraction and Analysis
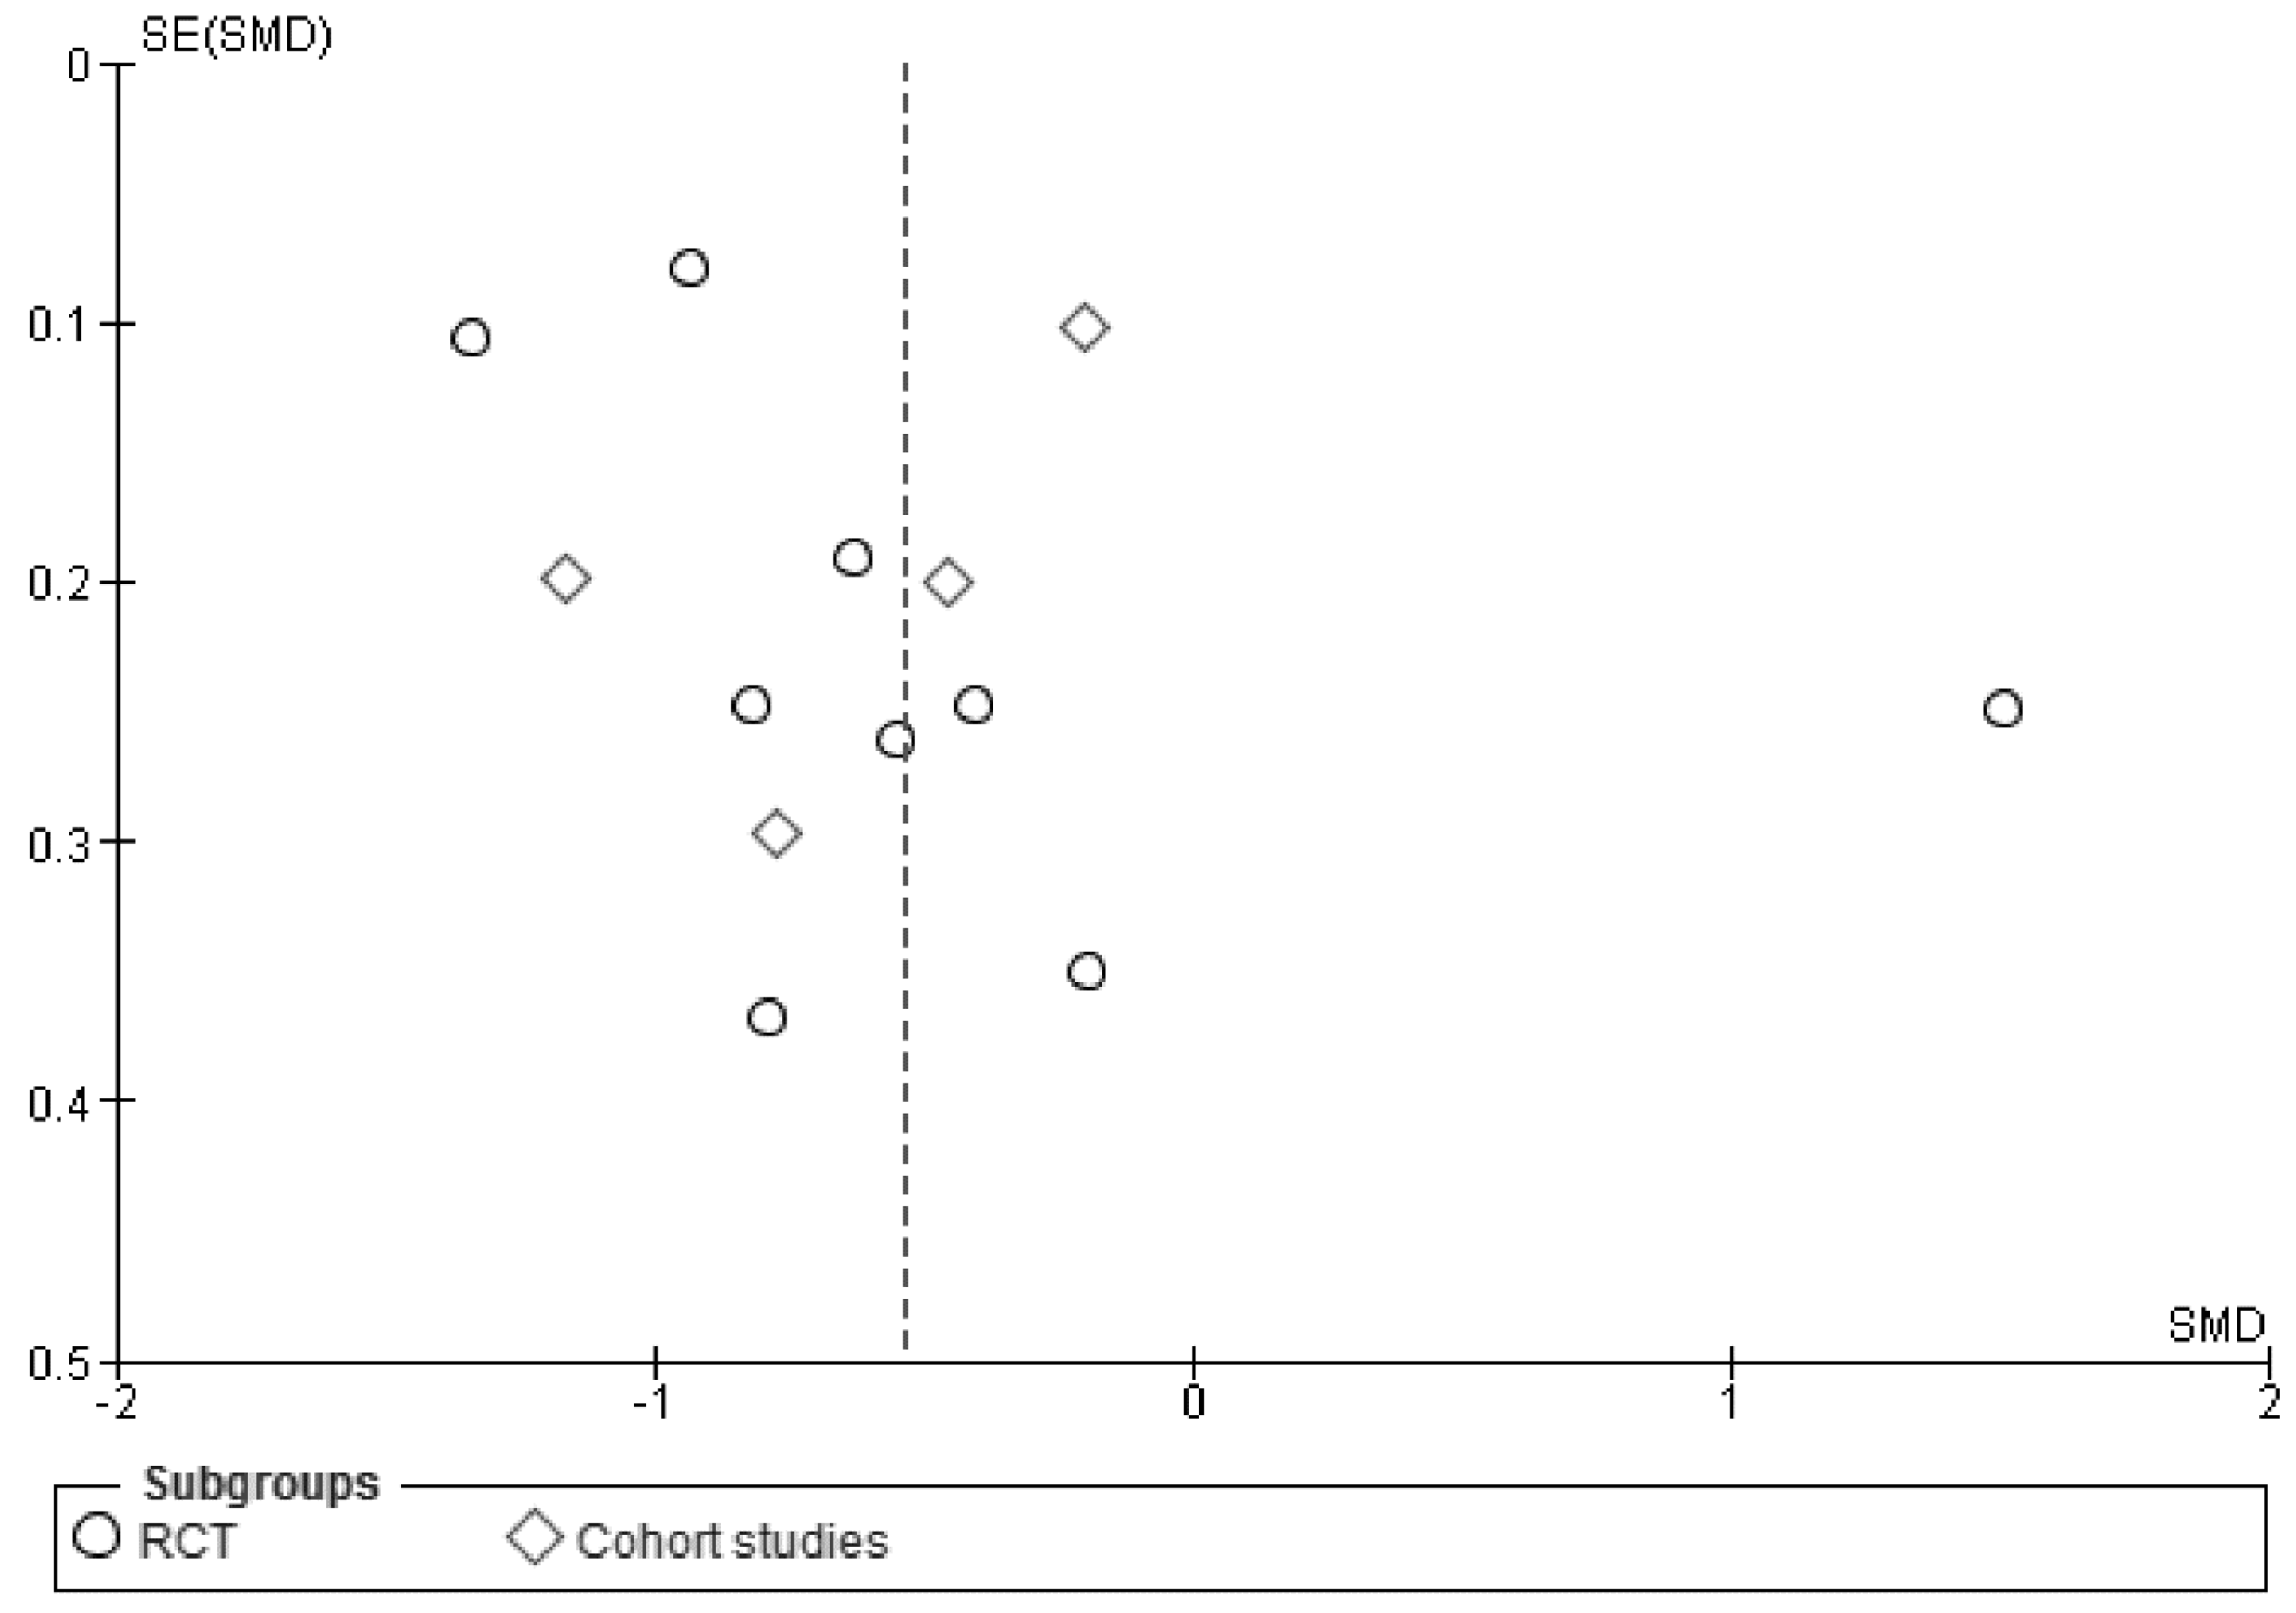
2.4. Statistical Approach
3. Results
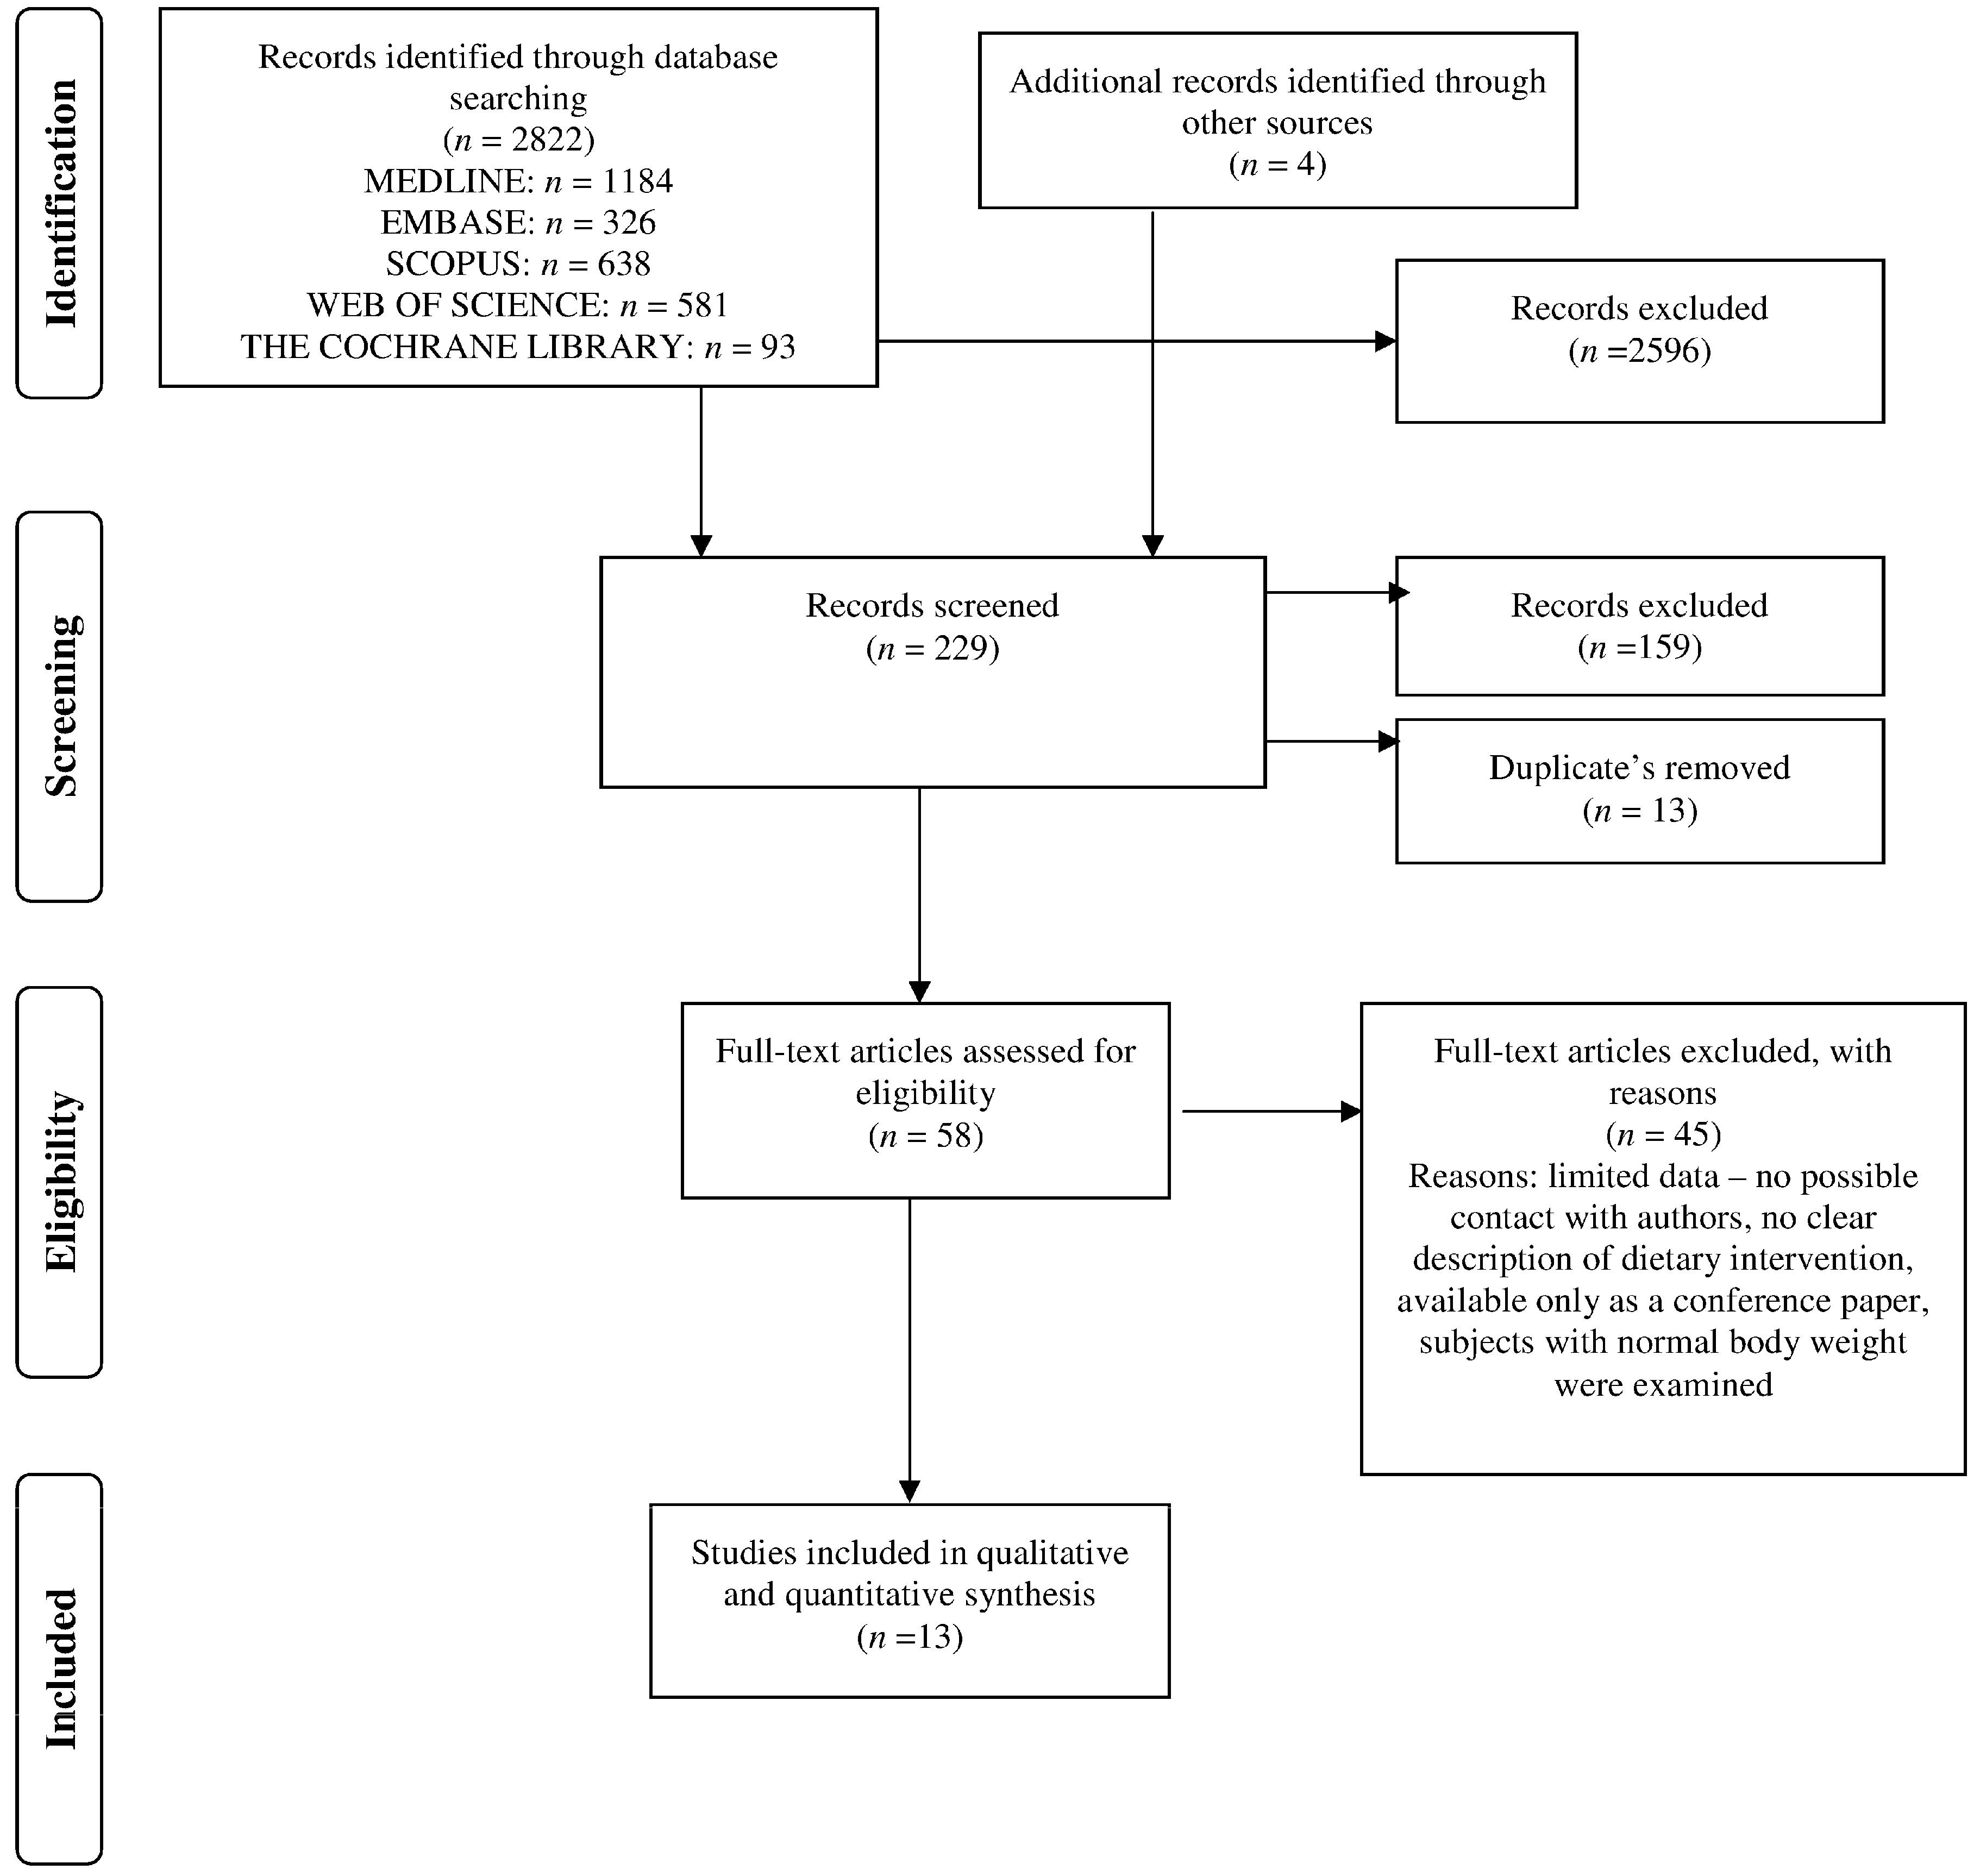
3.1. Search Results
3.2. Study and Population Characteristic
3.3. Body Weight Changes in Relation to Energy Density of Foods and Energy Intake
4. Discussion
4.1. Limitations
4.2. Practical Application
5. Conclusions
Acknowledgments
Author Contributions
Conflicts of Interest
References
- Drewnowski, A. Obesity and the food environment: Dietary energy density and diet costs. Am. J. Prev. Med. 2004, 27, 154–162. [Google Scholar] [CrossRef] [PubMed]
- Bechthold, A. Food Energy Density and Body Weight. Ernahrungs Umschau 2014, 6, 2–11. [Google Scholar]
- Ello-Martin, J.A.; Ledikwe, J.H.; Rolls, B.J. The influence of food portion size and energy density on energy intake: Implications for weight management. Am. J. Clin. Nutr. 2005, 82, 236–241. [Google Scholar]
- Bell, E.A.; Castellanos, V.H.; Pelkman, C.L.; Thorwart, M.L.; Rolls, B.J. Energy density of foods affects energy intake in normal-weight women. Am. J. Clin. Nutr. 1998, 67, 412–420. [Google Scholar]
- Stubbs, R.J.; Johnstone, AM.; Harbron, C.G.; Reid, C. Covert manipulation of energy density of high carbohydrate diets in “pseudo free-living” humans. Int. J. Obes. 1998, 22, 885–892. [Google Scholar] [CrossRef]
- Rolls, B.J.; Bell, E.A.; Castellanos, V.H.; Chow, M.; Pelkman, C.L.; Thorwart, M.L. Energy density but not fat content of foods affected energy intake in lean and obese women. Am. J. Clin. Nutr. 1999, 69, 863–871. [Google Scholar] [PubMed]
- Bell, E.A.; Rolls, B.J. Energy density of foods affects energy intake across multiple levels of fat content in lean and obese women. Am. J. Clin. Nutr. 2001, 73, 1010–1018. [Google Scholar] [PubMed]
- Obesity and Overweight—Fact Sheet No. 311. Available online: http://www.who.int/mediacentre/factsheets/fs311/en/index.html World Health Organization (accessed on 14 June 2015).
- Stelmach-Mardas, M.; Mardas, M.; Walkowiak, J.; Boeing, H. Long-term weight status in regainers after weight loss by lifestyle intervention: Status and challenges. Proc. Nutr. Soc. 2014, 73, 509–518. [Google Scholar] [CrossRef] [PubMed]
- Stelmach-Mardas, M.; Mardas, M.; Warchoł, W.; Jamka, M.; Walkowiak, J. Successful maintenance of body weight reduction after individualized dietary counseling in obese subjects. Sci. Rep. 2014. [Google Scholar] [CrossRef] [PubMed]
- Drewnowski, A.; Almiron-Roig, E.; Marmonier, C.; Lluch, A. Dietary energy density and body weight: Is there a relationship? Nutr. Rev. 2004, 62, 403–413. [Google Scholar] [CrossRef] [PubMed]
- Dobrowolska-Iwanek, J.; Zagrodzki, P.; Brzozowska, A.; Walkowiak, J.; Rodacki, T.; Wojtanowska-Krosniak, A.; Stelmach-Mardas, M. Link between Food Energy Density and Body Weight Changes in Obese Adults. Available online: http://www.crd.york.ac.uk/PROSPERO/display_record.asp?ID=CRD42015017070 (accessed on 12 March 2016).
- Moher, D.; Liberati, A.; Tetzlaff, J.; Altman, D.G.; PRISMA Group. Preferred reporting items for systematic reviews and meta-analyses: The PRISMA statement. Ann. Intern. Med. 2009, 151, 264–269. [Google Scholar] [CrossRef] [PubMed]
- Wells, G.A.; Shea, B.; O’Connell, D.; Robertson, J.; Peterson, J.; Welch, V.; Losos, M.; Tugwell, P. The Newcastle-Ottawa Scale (NOS) for Assessing the Quality of Nonrandomized Studies in Meta-Analyses. Available online: http://www.evidencebasedpublichealth.de/download/Newcastle_Ottowa_Scale_Pope_Bruce.pdf (accessed on 12 March 2016).
- Borenstein, M.; Hedges, L.V.; Higgins, J.P.T.; Rothstein, H.R. Introduction to Meta-Analysis; John Wiley & Sons Ltd.: Chichester, UK, 2009. [Google Scholar]
- Ello-Martin, J.A.; Roe, L.S.; Ledikwe, J.H.; Beach, A.M.; Rolls, B.J. Dietary energy density in the treatment of obesity: A year-long trial comparing 2 weight-loss diets. Am. J. Clin. Nutr. 2007, 85, 1465–1477. [Google Scholar] [PubMed]
- De Oliveira, M.C.; Sichieri, R.; Venturim Mozzer, R. A low-energy-dense diet adding fruit reduces weight and energy intake in women. Appetite 2008, 51, 291–295. [Google Scholar] [CrossRef] [PubMed]
- Lowe, M.R.; Tappe, K.A.; Annunziato, R.A.; Riddell, L.J.; Coletta, M.C.; Crerand, C.E.; Didie, E.R.; Ochner, C.N.; McKinney, S. The effect of training in reduced energy density eating and food self-monitoring accuracy on weight loss maintenance. Obesity 2008, 16, 2016–2023. [Google Scholar] [CrossRef] [PubMed]
- Stookey, J.D.; Constant, F.; Popkin, B.M.; Gardner, C.D. Drinking water is associated with weight loss in overweight dieting women independent of diet and activity. Obesity 2008, 16, 2481–2488. [Google Scholar] [CrossRef] [PubMed]
- Bermudez, O.I.; Gao, X. Greater consumption of sweetened beverages and added sugars is associated with obesity among US young adults. Ann. Nutr. Metab. 2010, 57, 211–218. [Google Scholar] [CrossRef] [PubMed]
- Tucker, L.A.; Tucker, J.M.; Bailey, B.W.; LeCheminant, J.D. A 4-year study of prospective soft drink consumption and weight gain: The role of calorie intake and physical activity. Am. J. Health Promot. 2015, 29, 262–265. [Google Scholar] [CrossRef] [PubMed]
- Greene, L.F.; Malpede, C.Z.; Henson, C.S.; Hubbert, K.A.; Heimburger, D.C.; Ard, J.D. Weight maintenance 2 years after participation in a weight loss program promoting low-energy density foods. Obesity 2006, 14, 1795–1801. [Google Scholar] [CrossRef] [PubMed]
- Petersen, M.; Taylor, M.A.; Saris, W.H.; Verdich, C.; Toubro, S.; Macdonald, I.; Rössner, S.; Stich, V.; Guy-Grand, B.; Langin, D.; et al. Randomized, multi-center trial of two hypo-energetic diets in obese subjects: High- versus low-fat content. Int. J. Obes. 2006, 30, 552–560. [Google Scholar] [CrossRef] [PubMed]
- Vander Wal, J.S.; Waller, S.M.; Klurfeld, D.M.; McBurney, M.I.; Cho, S.; Kapila, M.; Dhurandhar, N.V. Effect of a post-dinner snack and partial meal replacement program on weight loss. Int. J. Food Sci. Nutr. 2006, 57, 97–106. [Google Scholar] [CrossRef] [PubMed]
- Ledikwe, J.H.; Rolls, B.J.; Smiciklas-Wright, H.; Mitchell, D.C.; Ard, J.D.; Champagne, C.; Karanja, N.; Lin, P.H.; Stevens, V.J.; Appel, L.J. Reductions in dietary energy density are associated with weight loss in overweight and obese participants in the PREMIER trial. Am. J. Clin. Nutr. 2007, 85, 1212–1221. [Google Scholar] [PubMed]
- Abete, I.; Parra, D.; Martinez, J.A. Energy-restricted diets based on a distinct food selection affecting the glycemic index induce different weight loss and oxidative response. Clin. Nutr. 2000, 27, 545–551. [Google Scholar] [CrossRef] [PubMed]
- Savage, J.S.; Marini, M.; Birch, L.L. Dietary energy density predicts women’s weight change over 6 year. Am. J. Clin. Nutr. 2008, 88, 677–684. [Google Scholar] [PubMed]
- Poulsen, S.K.; Due, A.; Jordy, A.B.; Kiens, B.; Stark, K.D.; Stender, S.; Holst, C.; Astrup, A.; Larsen, T.M. Health effect of the New Nordic Diet in adults with increased waist circumference: A 6-month randomized controlled trial. Am. J. Clin. Nutr. 2014, 99, 35–45. [Google Scholar] [CrossRef] [PubMed]
- Pérez-Escamilla, R.; Obbagy, J.E.; Altman, J.M.; Essery, E.V.; McGrane, M.M.; Wong, Y.P.; Spahn, J.M.; Williams, C.L. Dietary energy density and body weight in adults and children: A systematic review. J. Acad. Nutr. Diet. 2012, 112, 671–684. [Google Scholar] [CrossRef] [PubMed]
- Kral, T.V.; Rolls, B.J. Energy density and portion size: Their independent and combined effects on energy intake. Physiol. Behav. 2004, 82, 131–138. [Google Scholar] [CrossRef] [PubMed]
- Poppitt, S.D.; Prentice, A.M. Energy density and its role in the control of food intake: Evidence from metabolic and community studies. Appetite 1996, 26, 153–174. [Google Scholar] [CrossRef] [PubMed]
- Westerterp-Plantenga, M.S.; Pasman, W.J.; Yedema, M.J.W.; Wijckmans-Duijsens, N.E.G. Energy intake adaptation of food to extreme energy densities of food by obese and non-obese women. Eur. J. Clin. Nutr. 1996, 50, 401–407. [Google Scholar] [PubMed]
- Johnson, L.; Wilks, D.C.; Lindroos, A.K.; Jebb, S.A. Reflections from a systematic review of dietary energy density and weight gain: Is the inclusion of drinks valid? Obes. Rev. 2009, 10, 681–692. [Google Scholar] [CrossRef] [PubMed]
- Jéquier, E. Energy expenditure in obesity. Clin. Endocrinol. Metab. 1984, 13, 563–580. [Google Scholar] [CrossRef]
- Luke, A.; Schoeller, D.A. Basal metabolic rate, fat-free mass, and body cell mass during energy restriction. Metabolism 1992, 41, 450–456. [Google Scholar] [CrossRef]
- Martí-Henneberg, C.; Capdevila, F.; Arija, V.; Pérez, S.; Cucó, G.; Vizmanos, B.; Fernández-Ballart, J. Energy density of the diet, food volume and energy intake by age and sex in a healthy population. Eur. J. Clin. Nutr. 1999, 53, 421–428. [Google Scholar] [CrossRef] [PubMed]


| Study | Study Design | Number of Participants/Nationality/Gender | Length of Intervention; Number of Dropped out | Age (Year) | Assessment Methods | Anthropometry | Type of Exposure | New-Castle Ottawa Scale |
|---|---|---|---|---|---|---|---|---|
| Greene et al., 2006 [22] | Cohort study | 74/American/61 women | 2 years; 4.05% dropouts | 51.5 ± 12.9 | 4-day food record, anthropometrical measurements * | Body weight | Weight management and maintenance in relation to dietary pattern | 8 |
| Petersen et al., 2006 [23] | RCT | 771/Europeans/579 women | 10-weeks; 15.8% dropouts: 13.6% (n = 53) in low-fat group and 18.3% (n = 70) in high-fat group | 36–39 | 3-day weighted diet records before and during last week of study; 1-day weighted records in 2nd, 5th, 7th weeks, anthropometrical measurements * | Body weight and height, waist and hip circumferences, fat mass, fat-free mass | Low-fat diet: 20%–25% energy from fat, 15% from protein, 60%–65% from CHO; high-fat diet: 40%–45% energy from fat, 15% from protein, 40%–45% from CHO; both diets provided 600 kcal/day less than individually estimated energy requirement | 8 |
| Vander Wal et al., 2006 [24] | RCT | 80/Americans/61 women | 8 weeks; 23.8% dropouts: 27.5% (n = 11) in PDS group and 20.0% (n = 8) in NS group | 18–65 | Questionnaire, anthropometrical measurements * | Body weight, BMI, waist circumference, fat% | Standardized bowl of ready-to-eat cereal (RTEC) 1. “post-dinner snack” (PDS): bowel of RTEC and 2/3 cup of low-fat milk after supper; 2. “no snack” (NS): no snacks after meals | 8 |
| Ello-Martin et al., 2007 [16] | RCT | 97/American/all women | 1 year; 26.8% dropouts: 27.1% (n = 13) in RF + FV group and 26.5% (n = 13) in RF group | 20–60 | 3-day diet records (2 weekdays and 1 weekend day) anthropometrical measurements * | Body weight, height, waist circumference | Reduction in fat intake in diet (RF) or reduction in fat intake + increased consumption of water-rich foods (RF + FV) | 8 |
| Ledikwe et al., 2007 [25] | RCT | 658/Americans/61% women | 24-weeks | 49.0–50.5 | Two 24-h dietary recalls, anthropometrical measurements * | Body weight, height, waist circumference | Behavioral intervention | 8 |
| Abete et al., 2008 [26] | RCT | 32/Spanish/14 women | 8 weeks; no dropouts | 36 ± 7 | 3-day weighted diet records, anthropometrical measurements * | Body weight; waist and hip circumferences | higher-GI (84% of total carbohydrates from rice and potatoes), 2. lower-GI (84% of total carbohydrates from whole-meal pasta and legumes), both diet were energy restricted (−30% of individually measured total energy expenditure), and designed as: (% energy) carbohydrates 53%, proteins 17%, fat 30% | 7 |
| de Oliveira et al., 2008 [17] | RCT (secondary data analysis) | 49/Brazilian/all women | 10 weeks; no dropouts | 30–50 | 3-day diet records including 1 weekend day anthropometrical measurements * | Body weight, BMI, mid-arm circumference | Normal diet with addition of either three apples or three pears or three oat cookies | 7 |
| Lowe et al., 2008 [18] | RCT | 103/American/all women | 14-weeks | 43.9 ± 10.5 | 5-day food records, anthropometrical measurements * | Body weight, height | Cognitive-behavioral treatment (CBT); CBT with an enhanced food monitoring accuracy (EFMA) program; or these two interventions plus a reduced energy density eating (REDE) program | 8 |
| Savage et al., 2008 [19] | Cohort study | 186/American/all women | 6-years | 24.1–46.6 | Three 24-h dietary recalls | Body weight, height | Food energy density: low, medium and high | 7 |
| Stookey et al., 2008 [20] | RCT (secondary data analysis) | 173/American/all women | 12 months; 17.3% dropouts (n = 30; data on dietary intake not available) and 15.6% (n = 27) | 25–50 | Three 24-h dietary recalls at 4-time points anthropometrical measurements * | Body weight, height, waist circumference, % of body fat | Atkins, Zone, LEARN or Ornish diets | 8 |
| Bermudez and Gao, 2010 [27] | Cohort study | 947/Americans/51.2% women | - | 20–39 | 24-h Recall anthropometrical measurements * | Body weight and height | Sugar-sweetened beverages and added sugars in normal diet | 7 |
| Poulsen et al., 2014 [28] | RCT | 181/Danish/128 women | 1 week run-in period, 26 weeks intervention; 18.8% dropouts (n = 34) | 20–66 | Dietary-compliance and satisfaction questionnaire; anthropometrical measurements * | Body weight, waist and hip circumferences | New Nordic Diet (NND) or average Danish diet (ADD) | 7 |
| Tucker et al., 2015 [21] | Cohort study | 228/American/all women | 4 years; 25.4% dropouts (n = 58) | 35–45 | Questionnaire concerning soft drinks intake; 7-day weighed diet records; anthropometrical measurements * | Body weight | Habitual diets with soft drinks: sugar sweetened or artificially sweetened or no soft drinks | 7 |
| Study | Analyzed Groups | Food Energy Density (kcal/g) | Energy Intake (kcal/Day) | Energy Expenditure kcal/Day | Body Weight (kg) Mean ± SD | ||
|---|---|---|---|---|---|---|---|
| Baseline | Intervention | Baseline | Intervention | ||||
| Greene et al., 2006 [22] | Two groups of men and women; Maintainers: n1 = 59 Gainers: n2 = 15 | Maintainers: 1.58 Gainers: 2.01 | Maintainers: 1608 Gainers: 1989 | N/A | N/A | Maintainers: 87.7 ± 22.4 Gainers: 98.8 ± 33.9 | Maintainers: 86.5 ± 22.7 Gainers: 106.8 ± 36.5 |
| Petersen et al., 2006 [23] | Two groups of women; HF *: n1 = 235, LF *: n2 = 251 Two groups of men; HF *: n1 = 77, LF *: n2 = 85 | N/A * N/A | Women: 2029 ± 55 Men: 2675 ± 838 ^ | Women HF: 1514 ± 258 LF: 1447 ± 258 Men HF: 1928 ± 312 LF: 1900 ± 442 | Women HF: 1740 ± 226 # LF: 1744 ± 251 # Men HF: 2151 ± 323 # LF: 2119 ± 304 # | Women HF: 97.4 ± 14.9 LF: 96.7 ± 15.2 Men HF: 110.9 ± 14.7 LF: 110.3 ± 17.6 | Women HF: 91.3 ± N/A * LF: 90.0 ± N/A Men HF: 102.7 ± N/A LF: 102.7 ± N/A |
| Vander Wal et al., 2006 [24] | Two groups of men and women; PDS *: n1 = 29 NS *: n2 = 32 | N/A | PDS: 2316 ± 915 NS: 2383 ± 998 | PDS: 2081 ± N/A NS: 1649 ± N/A | N/A | PDS: 109.97 ± 22.92 NS: 106.91 ± 15.87 | PDS: 106.26 ± N/A NS: 102.20 ± N/A |
| Ello-Martin et al., 2007 [16] | Two groups of women; RF *: n1 = 36 RF + FV *: n2 = 35 | Baseline: RF: 1.85 ± 0.07 RF + FV: 1.74 ± 0.06; At the end: RF: 1.49 ± 0.07 RF + FV: 1.33 ± 0.04 | RF: 1836 ± 68 RF + FV: 1937 ± 78 | RF: 1307 ± 62 RF + FV: 1437 ± 60 | N/A | RF: 90.2 ± 1.4 RF + FV: 90.8 ± 1.8 | RF: 83.8 ± 1.7 RF + FV: 82.9 ± 2.0 |
| Ledikwe et al., 2007 [25] | Three groups of women and men: Advice group: n1 = 223 Established group: n2 = 219 Established + DASH group: n3 = 216 | Advice group: 1.53 ± 0.03 Established Group: 1.69 ± 0.03 Established + DASH group: 2.11 ± 0.03 | Advice group: 1596 ± 36 Established Group: 1720 ± 38 Established + DASH group: 1842 ± 42 | Advice group: 1632 ± N/A Established Group: 1476 ± N/A Established + DASH group: 1396 ± N/A | N/A | Changes: Advice group: 1.1 ± 0.2 Established Group: 5.1 ± 0.4 Established + DASH group: 6.1 ± 0.4 | |
| Abete et al., 2008 [26] | Two groups of men and women; hGI *: n1 = 16 lGI *: n2 = 16 | N/A | N/A | N/A | Baseline hGI: 1698 ± 245 lGI: 1621 ± 287 Interventionh GI: 1584 ± N/A lGI: 1522 ± N/A | hGI: 94.4 ± 13.1 lGI: 94.3 ± 16.1 | hGI: 89.4 ± N/A lGI: 87.2 ± N/A |
| de Oliveira et al., 2008 [17] | Three groups of women; A *: n1 = 13 P *: n2 = 13 C *: n3 = 7 | Baseline: A: 1.67 ± 1.14 P: 1.72 ± 1.25 C: 2.20 ± 1.31 At the end: A: 1.64 ± N/A P: 1.65 ± N/A C: 2.06 ± N/A | A: 2401 ± 389 P: 2459 ± 464 C: 2383 ± 31 | A: 2376 ± N/A P: 2439 ± N/A C: 2384 ± N/A | N/A | A: 77.25 ± 10.75 P: 79.41 ± 12.89 C: 78.74 ± 8.40 | A: 75.93 ± 11.35 P: 77.24 ± 11.47 C: 78.01 ± 9.17 |
| Lowe et al., 2008 [18] | Three groups of women; CBT: n1 = 35 CBT and EFMA: n2 = 35 CBT, EFMA, and REDE: n3 = 33 | N/A | 2164 ± 631 | 1735 ± 417 | N/A | Changes: CBT: −1.31 ± 4.71 CBT and EFMA: −0.32 ± 4.72 CBT, EFMA, and REDE: −2.22 ± 4.15 | |
| Savage et al., 2008 [19] | Three groups of women: Low ED: n1 = 61 Medium ED: n2 = 63 High ED: n3 = 59 | Low ED: 1.3 ± 0.2 Medium ED: 1.7 ± 0.1 High ED: 2.1 ± 0.2 | Low ED: 1514 ± 437 Medium ED: 1649 ± 394 High ED: 1737 ± 409 | N/A | N/A | Changes: Low ED: 2.5 ± 6.8 High ED: 6.4 ± 6.5 | |
| Stookey et al., 2008 [20] | Four groups of women: At *: n1 = 42 Z *: n2 = 47 L *: n3 = 42 O *: n4 = 42 | N/A | N/A | N/A | N/A | At: 86.5 ± 3.9 Z: 85.0 ± 2.7 L: 83.1 ± 2.6 O: 87.2 ± 3.2 | At: 80.8 ± 5.2 Z: 82.5 ± 4.1 L: 81.0 ± 4.5 O: 85.2 ± 4.5 |
| Bermudez and Gao, 2010 [27] | Q1 *: n1 = 184 Q4 *: n2 = 211 | N/A | Q1: 2141 ± 812 Q4: 2626 ± 929 | N/A | Q1: 77.8 ± 22.8 Q4: 84.0 ± 33.4 | ||
| Poulsen et al., 2014 [28] | Two groups of women: NND: n1 = 86 ADD: n2 = 50 | Baseline: NND: 1.10 ± 0.25 ADD: 1.15 ± 0.22 At the end: NND: 0.90 ± 0.24 ADD: 1.13 ± 0.27 | NND: 2329 ± 462 ADD: 2447 ± 645 | NND: 1965 ± 613 ADD: 2366 ± 675 | N/A | NND: 89.7 ± 16.4 ADD: 90.3 ± 18.2 | NND: 85.0 ± N/A ADD: 88.8 ± N/A |
| Tucker et al., 2015 [21] | Three groups of women; S *: n1 = 44 Ar *: n2 = 46 NSD *: n3 = 61 | N/A | 2017 ± 324 (data not differentiated at baseline) | N/A | N/A | Changes: S *: 2.7 ± 5.1 Ar *: −1.0 ± 4.4 NSD *: −0.5 ± 5.1 | |
© 2016 by the authors; licensee MDPI, Basel, Switzerland. This article is an open access article distributed under the terms and conditions of the Creative Commons Attribution (CC-BY) license (http://creativecommons.org/licenses/by/4.0/).
Share and Cite
Stelmach-Mardas, M.; Rodacki, T.; Dobrowolska-Iwanek, J.; Brzozowska, A.; Walkowiak, J.; Wojtanowska-Krosniak, A.; Zagrodzki, P.; Bechthold, A.; Mardas, M.; Boeing, H. Link between Food Energy Density and Body Weight Changes in Obese Adults. Nutrients 2016, 8, 229. https://doi.org/10.3390/nu8040229
Stelmach-Mardas M, Rodacki T, Dobrowolska-Iwanek J, Brzozowska A, Walkowiak J, Wojtanowska-Krosniak A, Zagrodzki P, Bechthold A, Mardas M, Boeing H. Link between Food Energy Density and Body Weight Changes in Obese Adults. Nutrients. 2016; 8(4):229. https://doi.org/10.3390/nu8040229
Chicago/Turabian StyleStelmach-Mardas, Marta, Tomasz Rodacki, Justyna Dobrowolska-Iwanek, Anna Brzozowska, Jarosław Walkowiak, Agnieszka Wojtanowska-Krosniak, Paweł Zagrodzki, Angela Bechthold, Marcin Mardas, and Heiner Boeing. 2016. "Link between Food Energy Density and Body Weight Changes in Obese Adults" Nutrients 8, no. 4: 229. https://doi.org/10.3390/nu8040229