Non-Isothermal Crystallization Behavior of PEEK/Graphene Nanoplatelets Composites from Melt and Glass States


 ,
,
Abstract
:
1. Introduction
2. Materials and Methods
2.1. Materials
2.2. Nanocomposite Films Preparation by Extrusion-Moulding and Hot Press
2.3. Rheological Measurements
2.4. Differential Scanning Calorimetry
2.5. Wide and Small Angle X-ray Diffraction
3. Results and Discussion
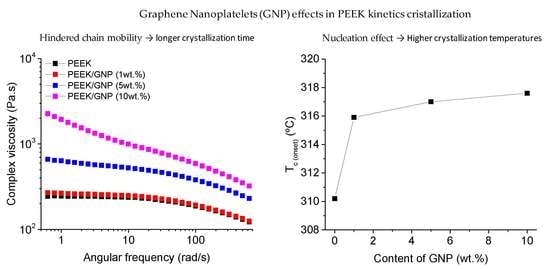
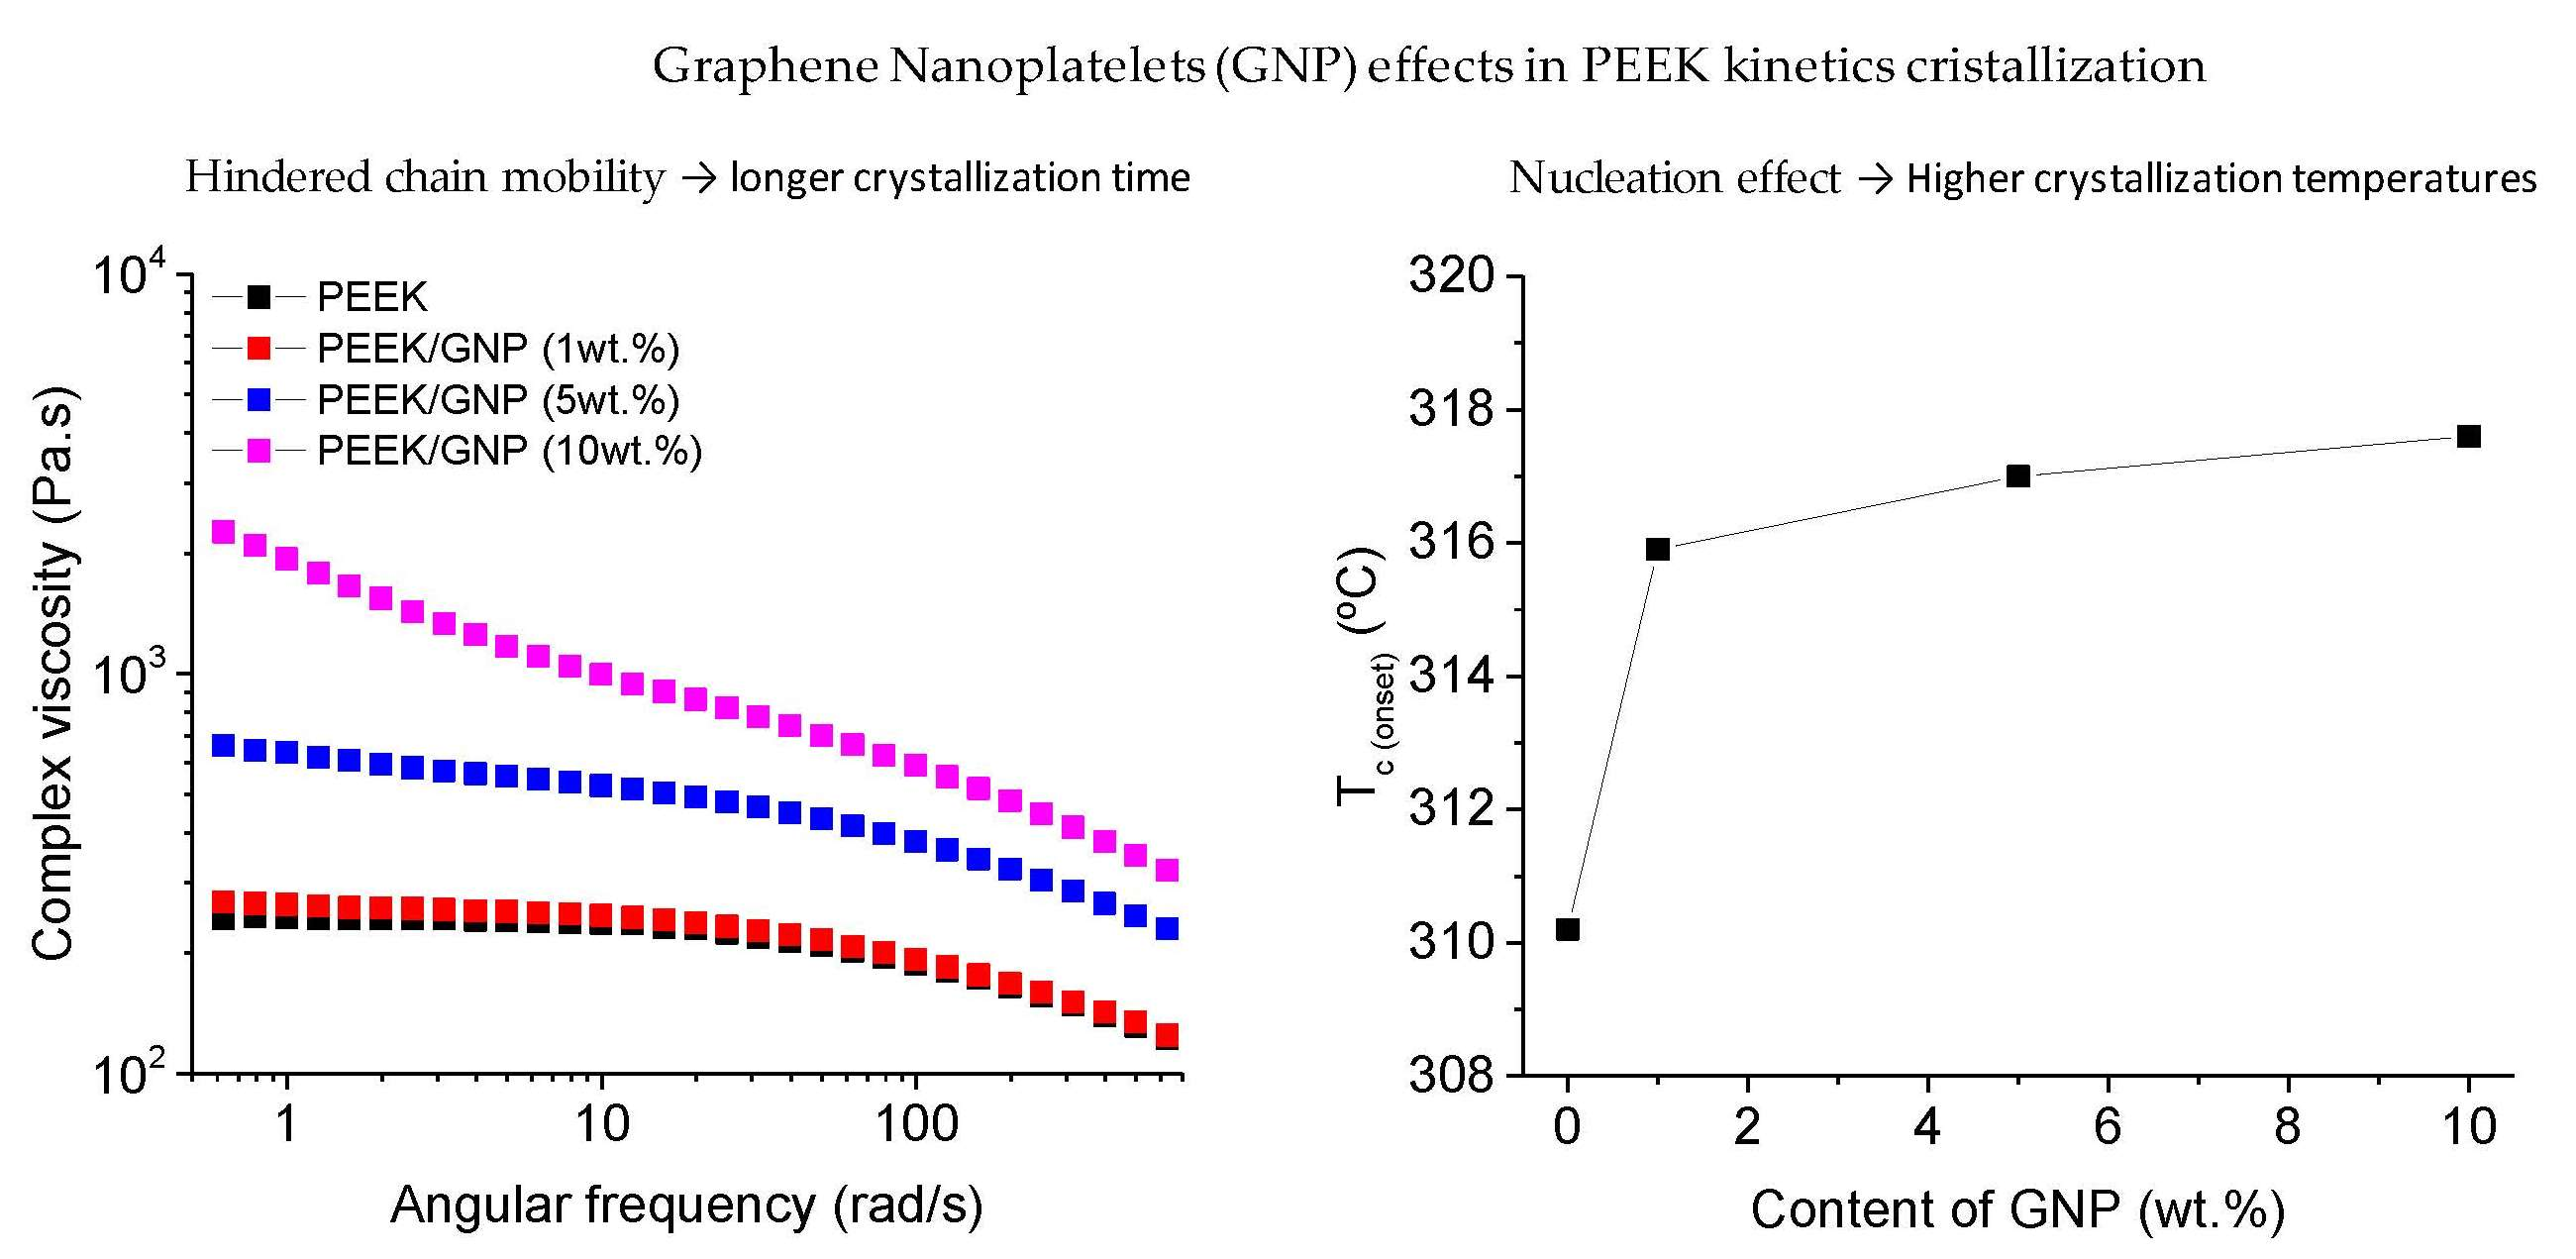
3.1. Rheological Properties
3.2. Thermal Behaviour of PEEK Nanocomposites
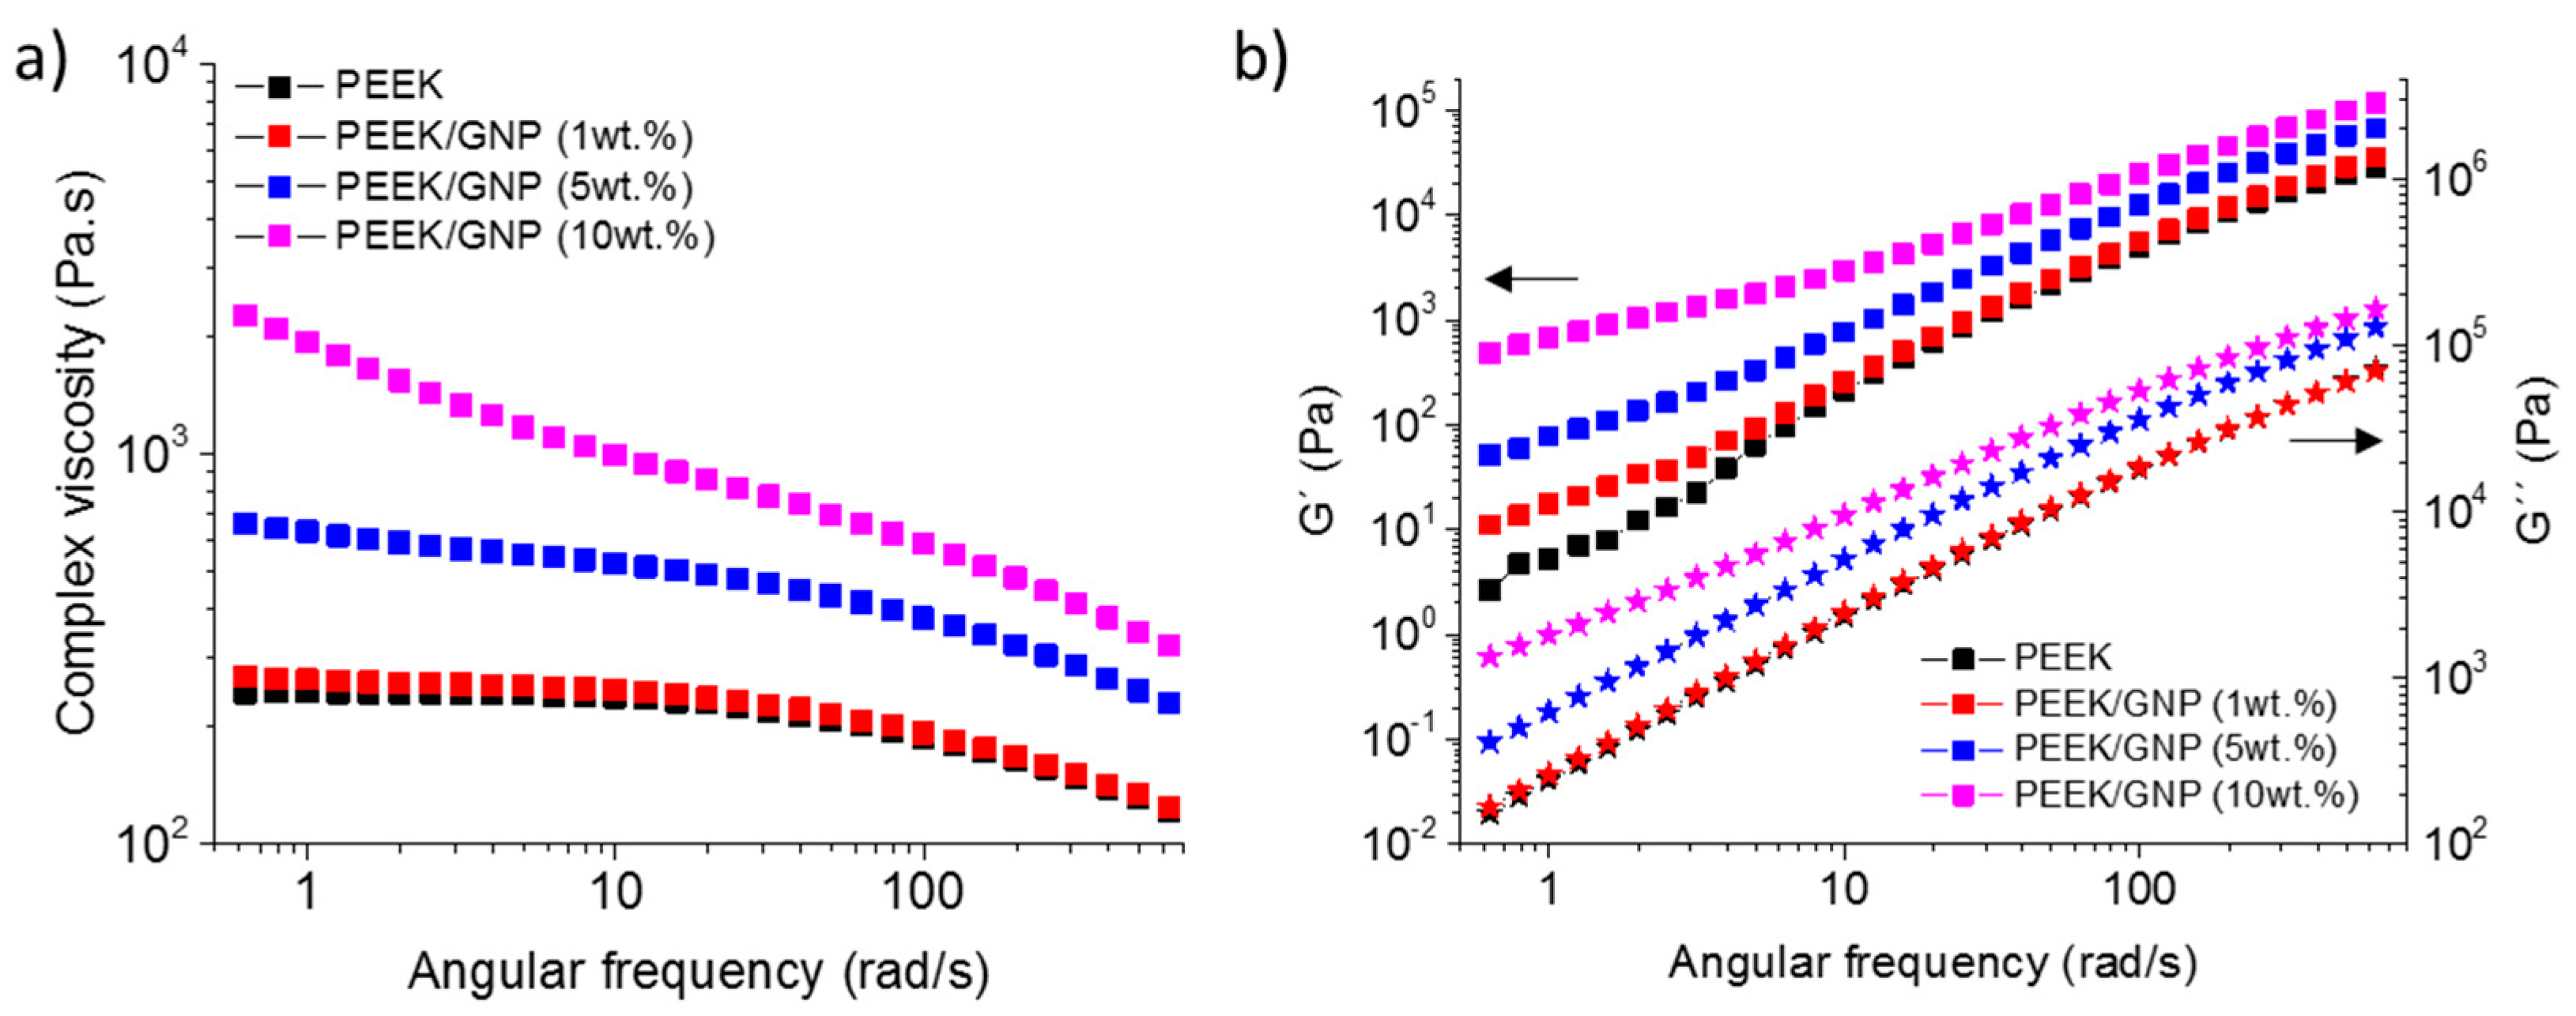
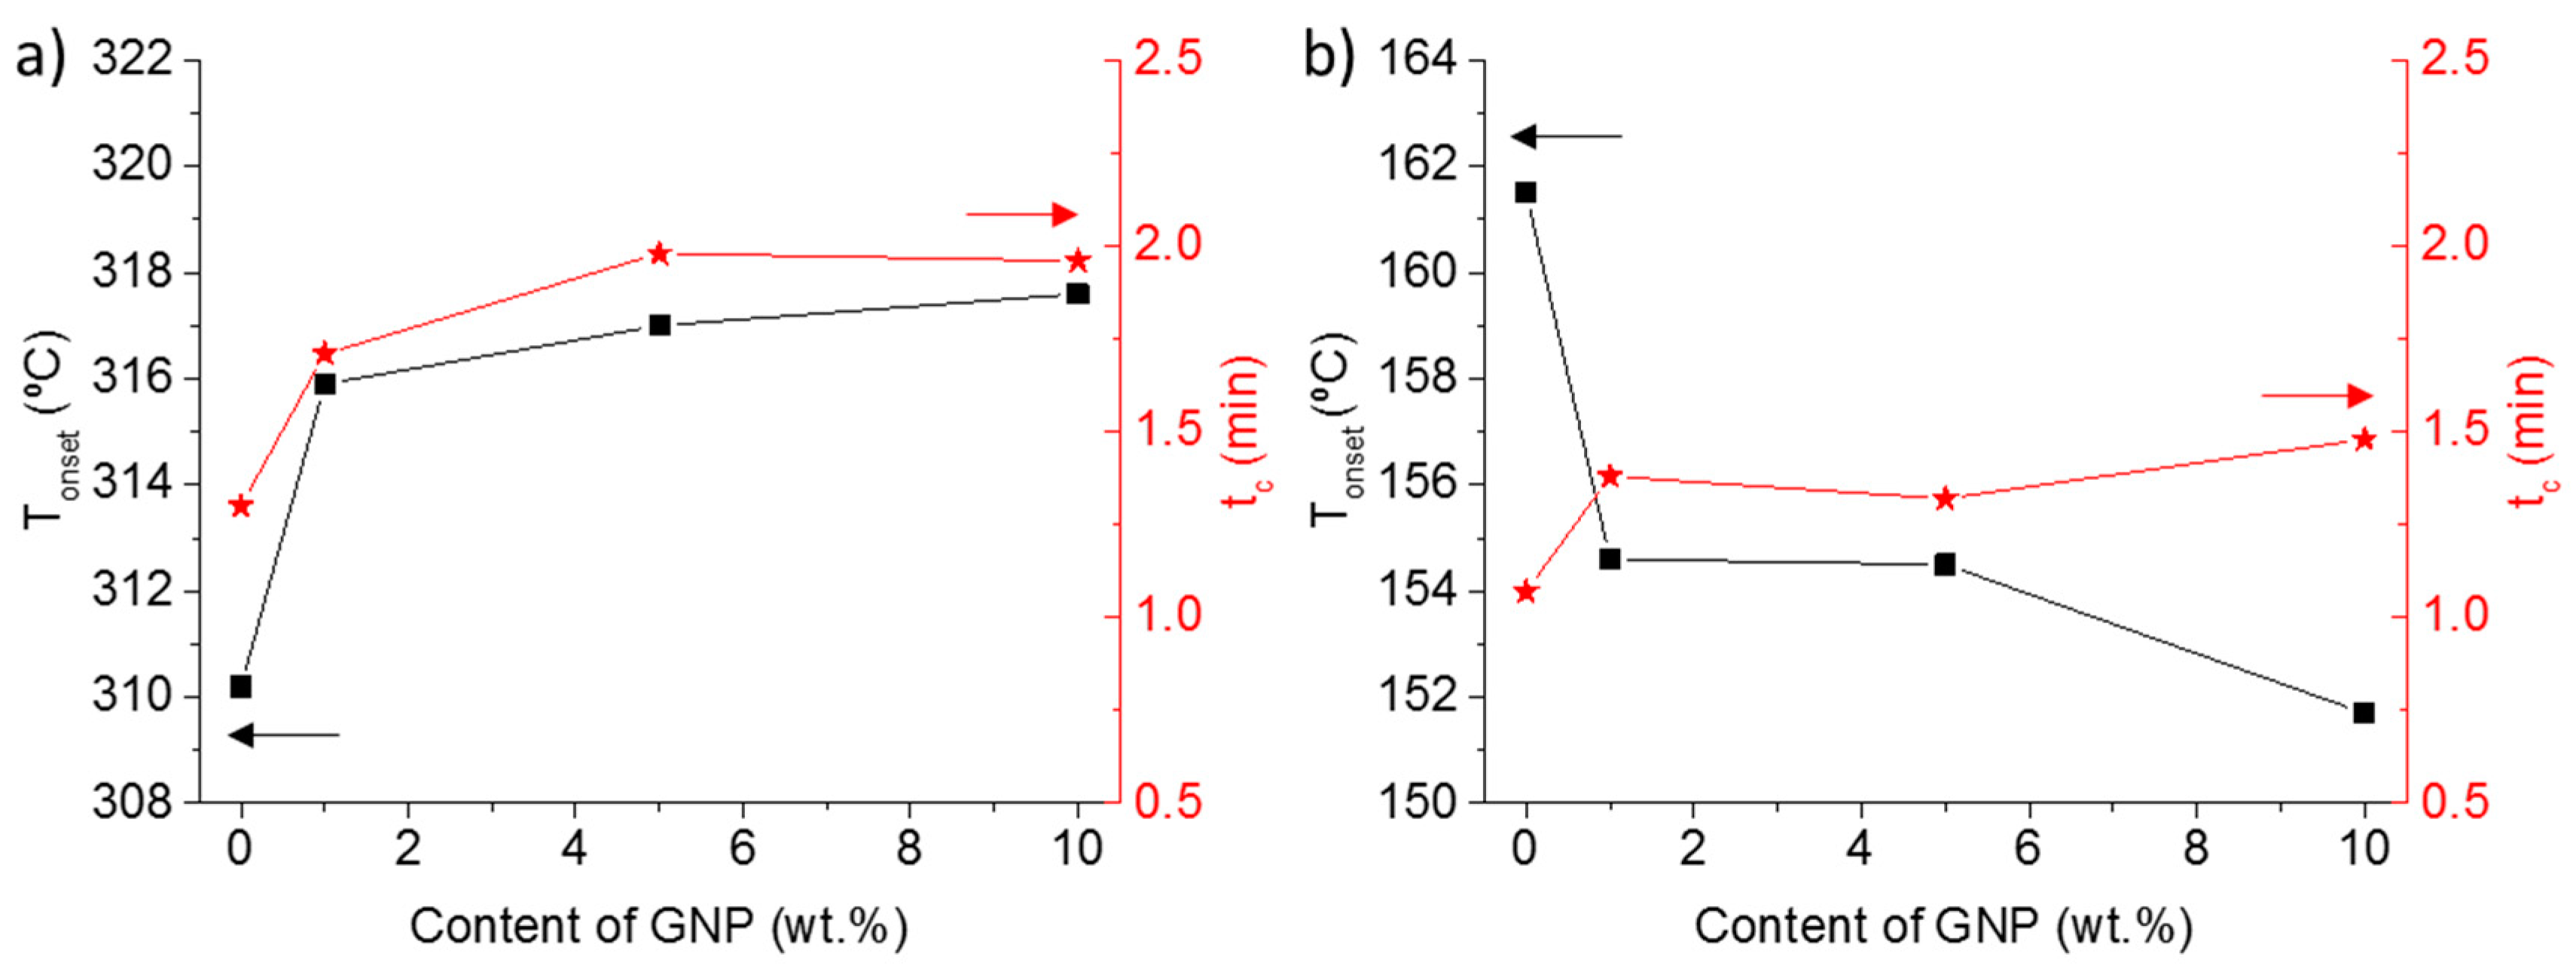
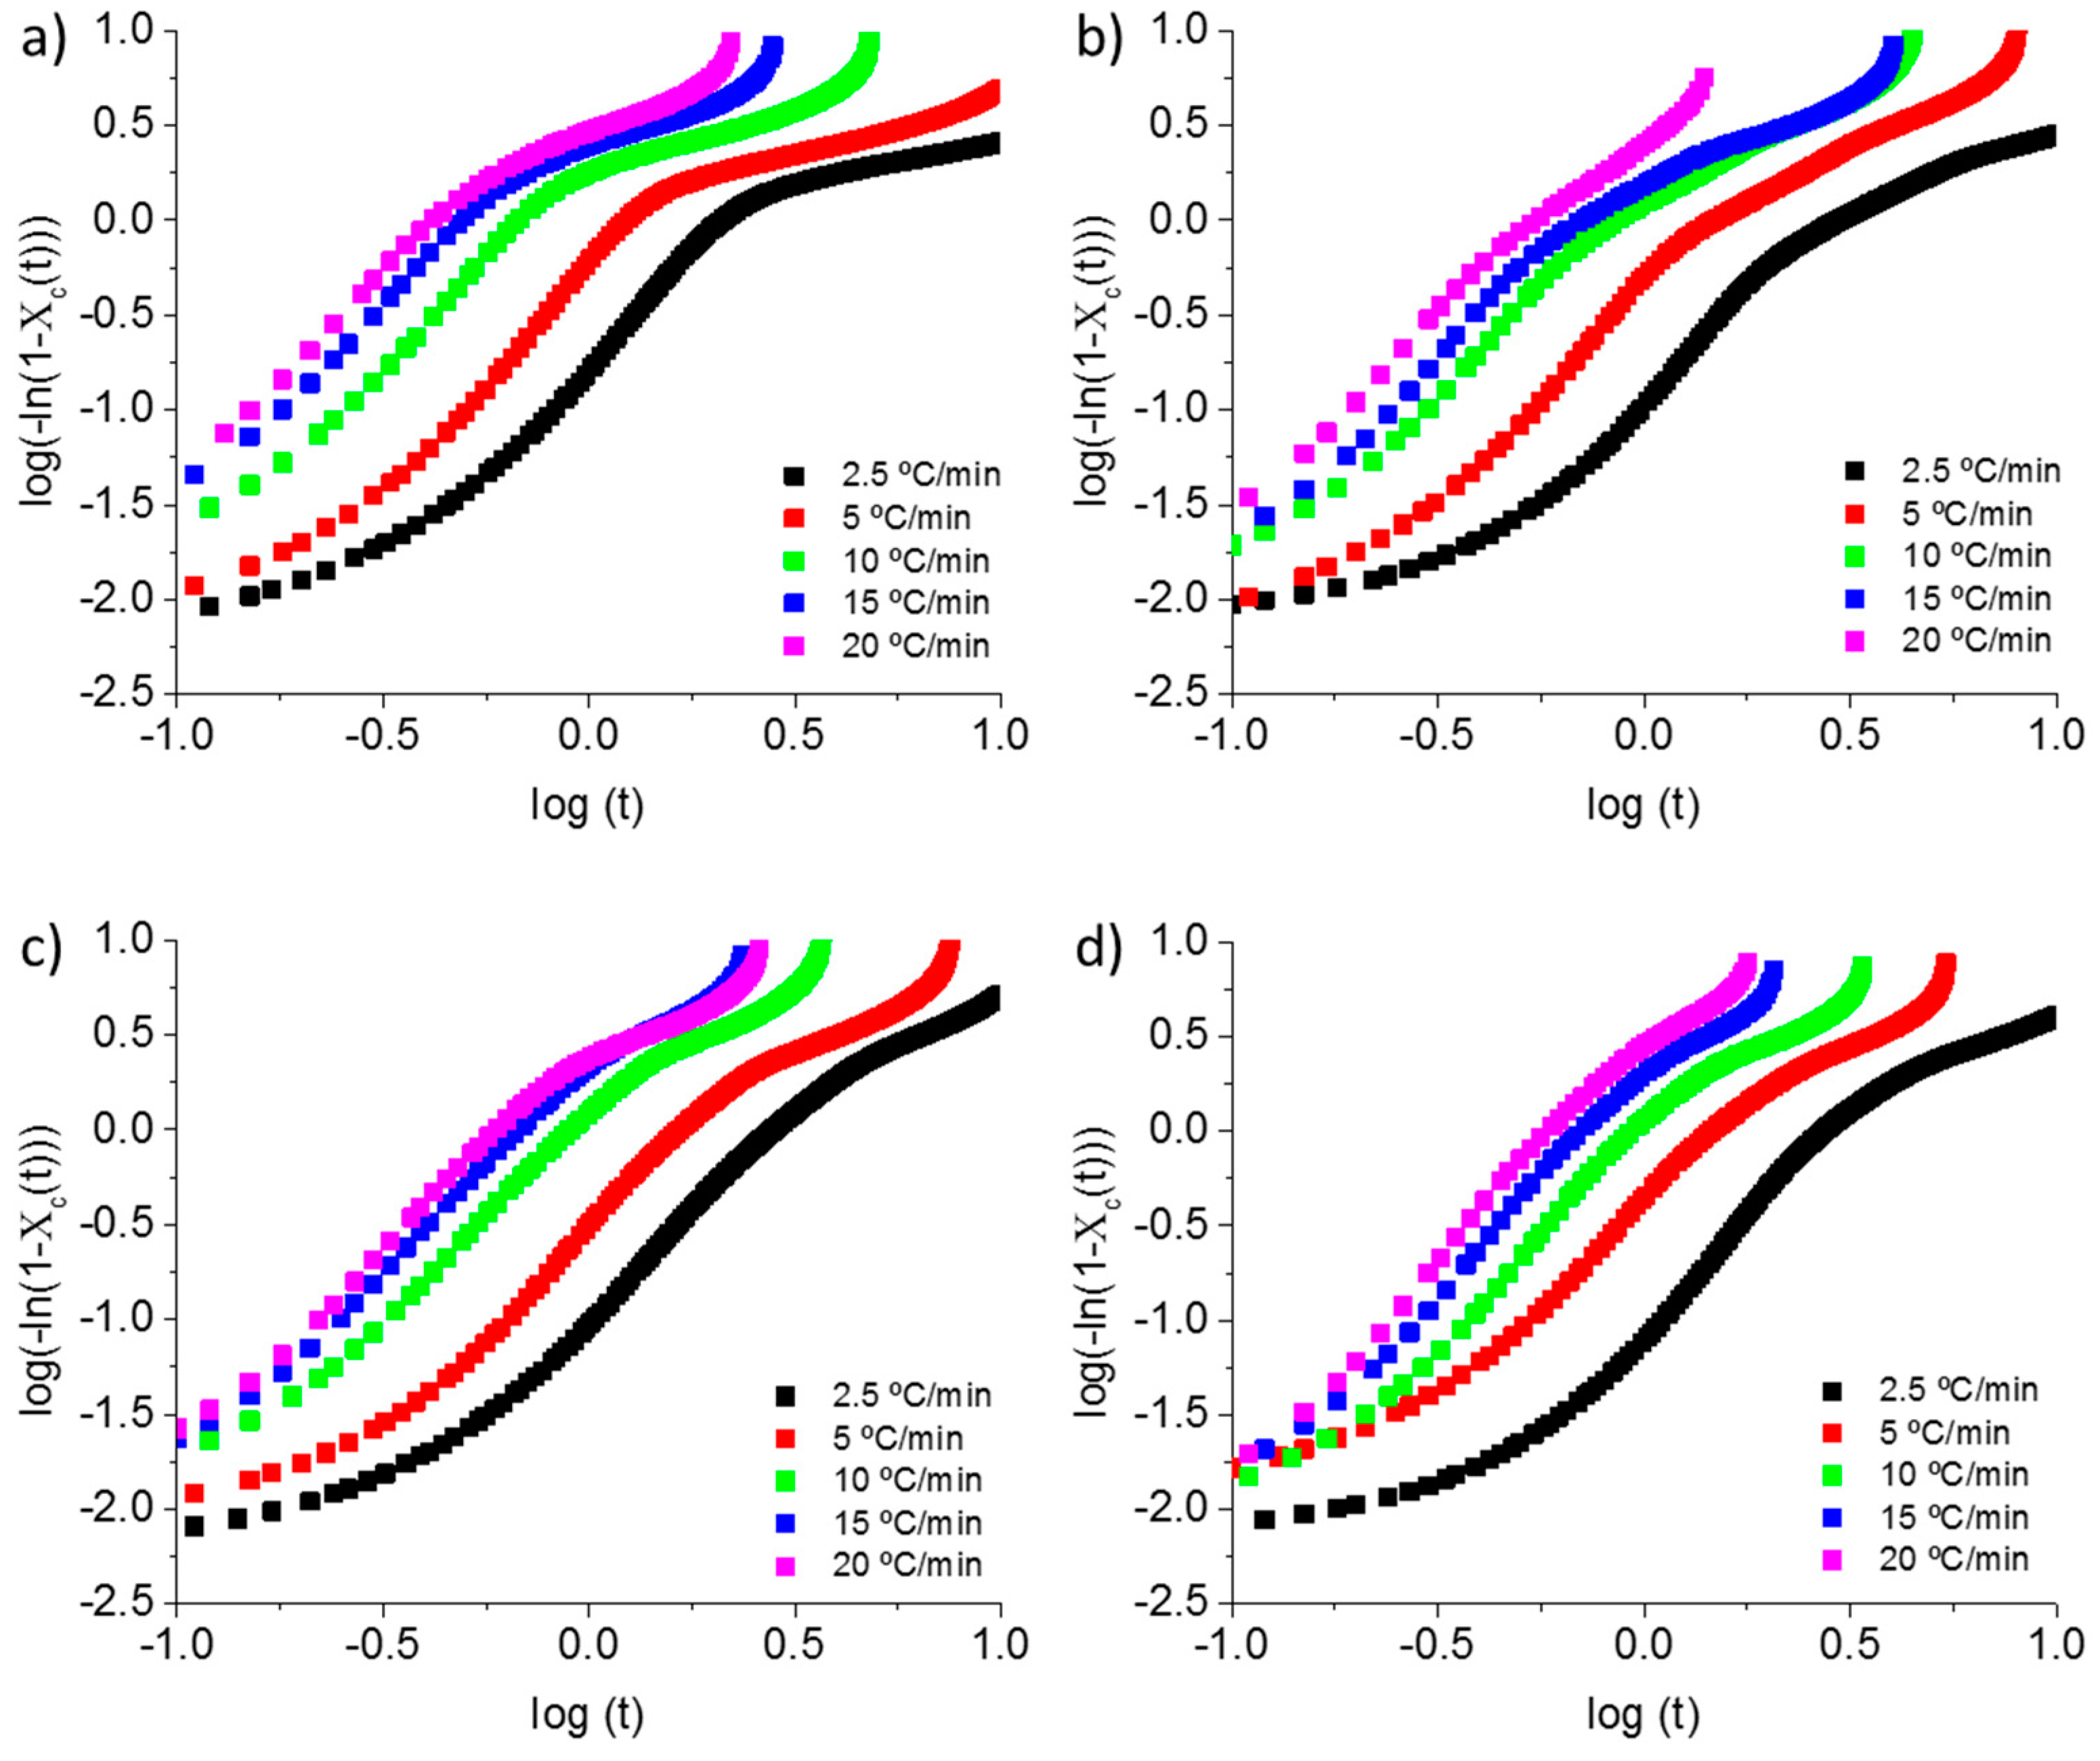
Crystallization Kinetics
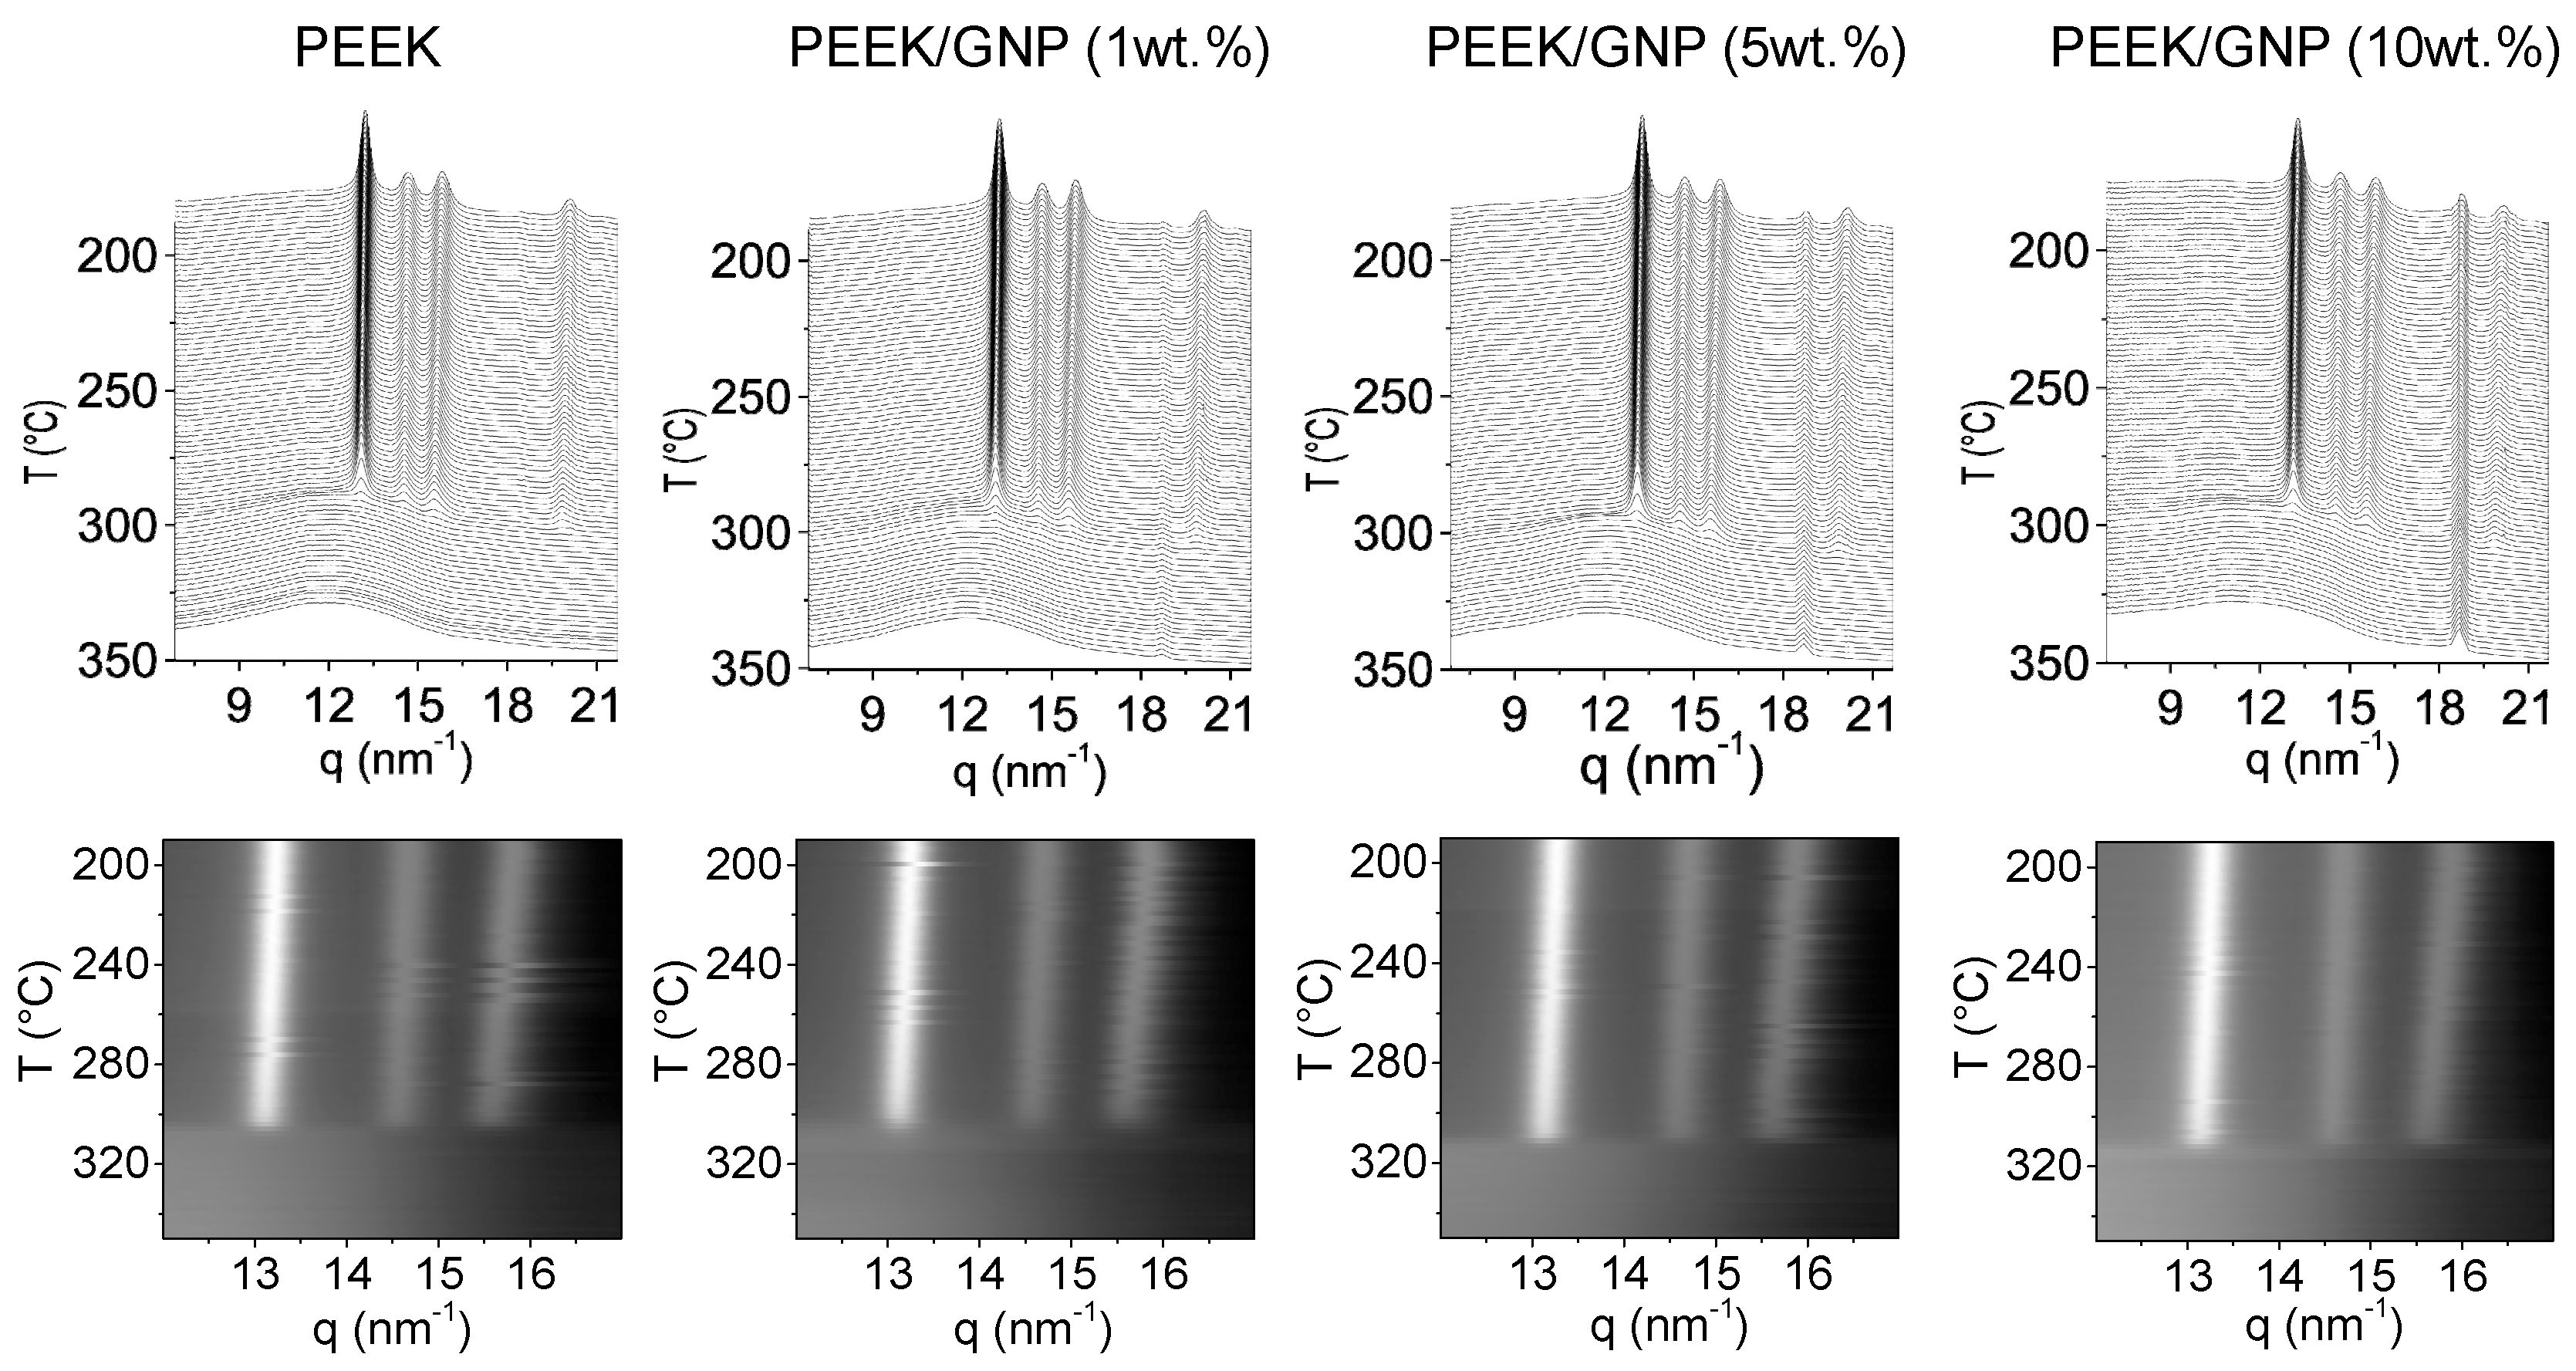
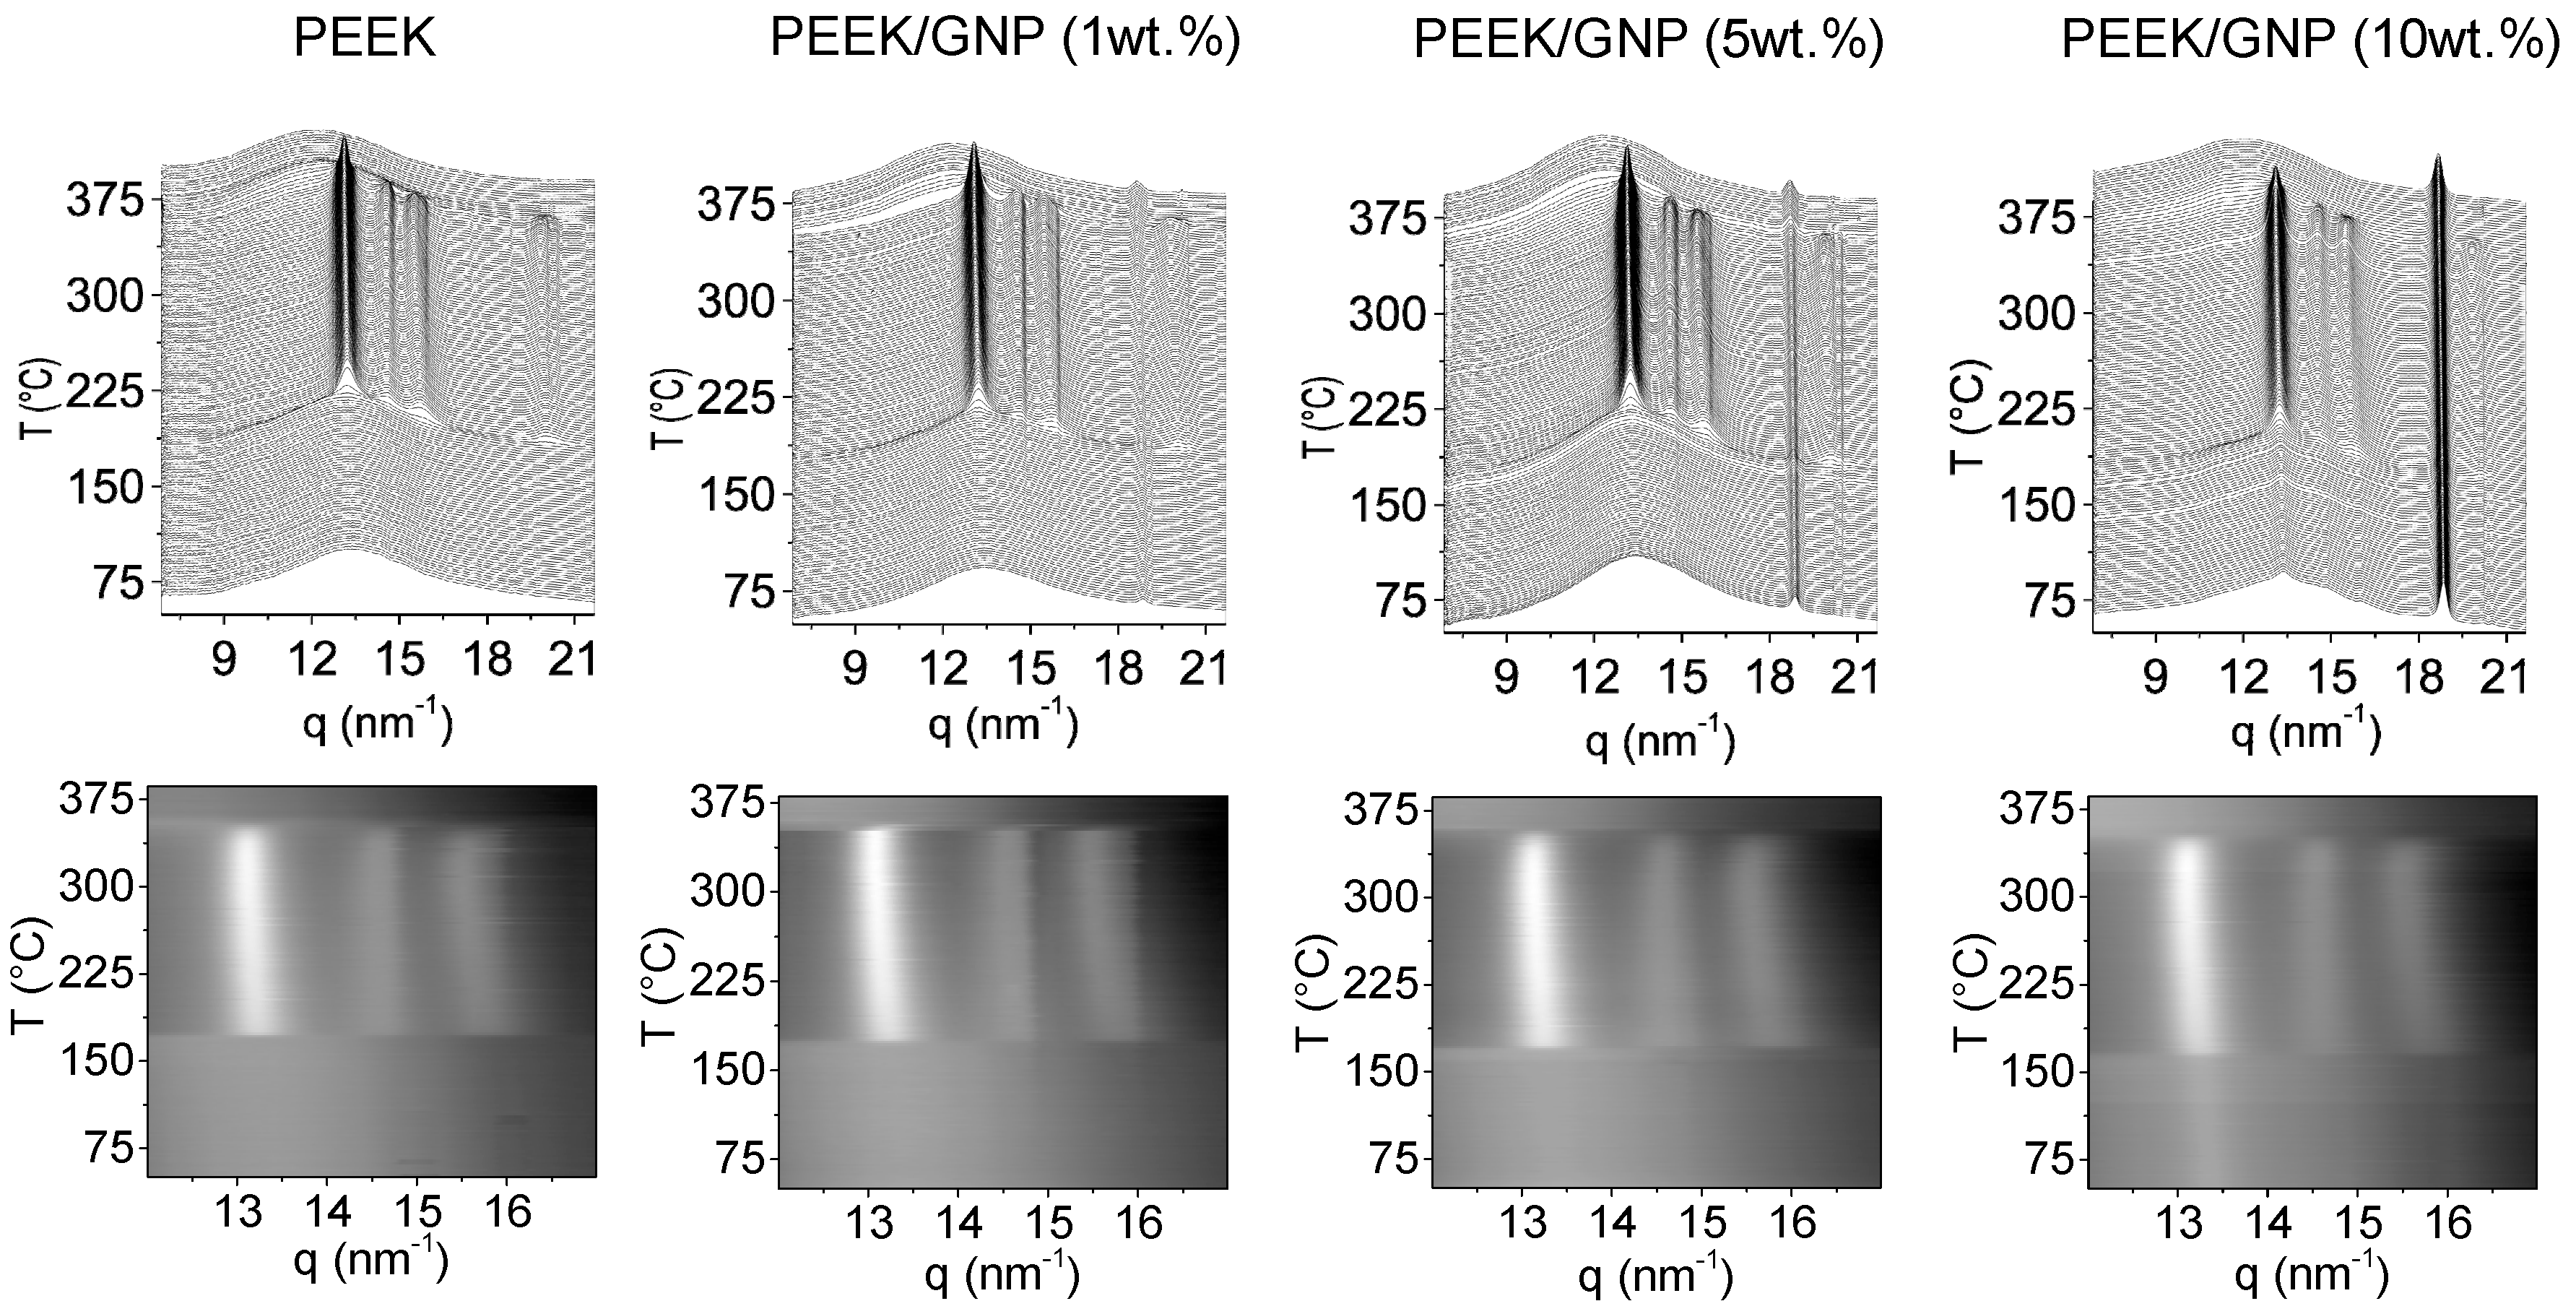
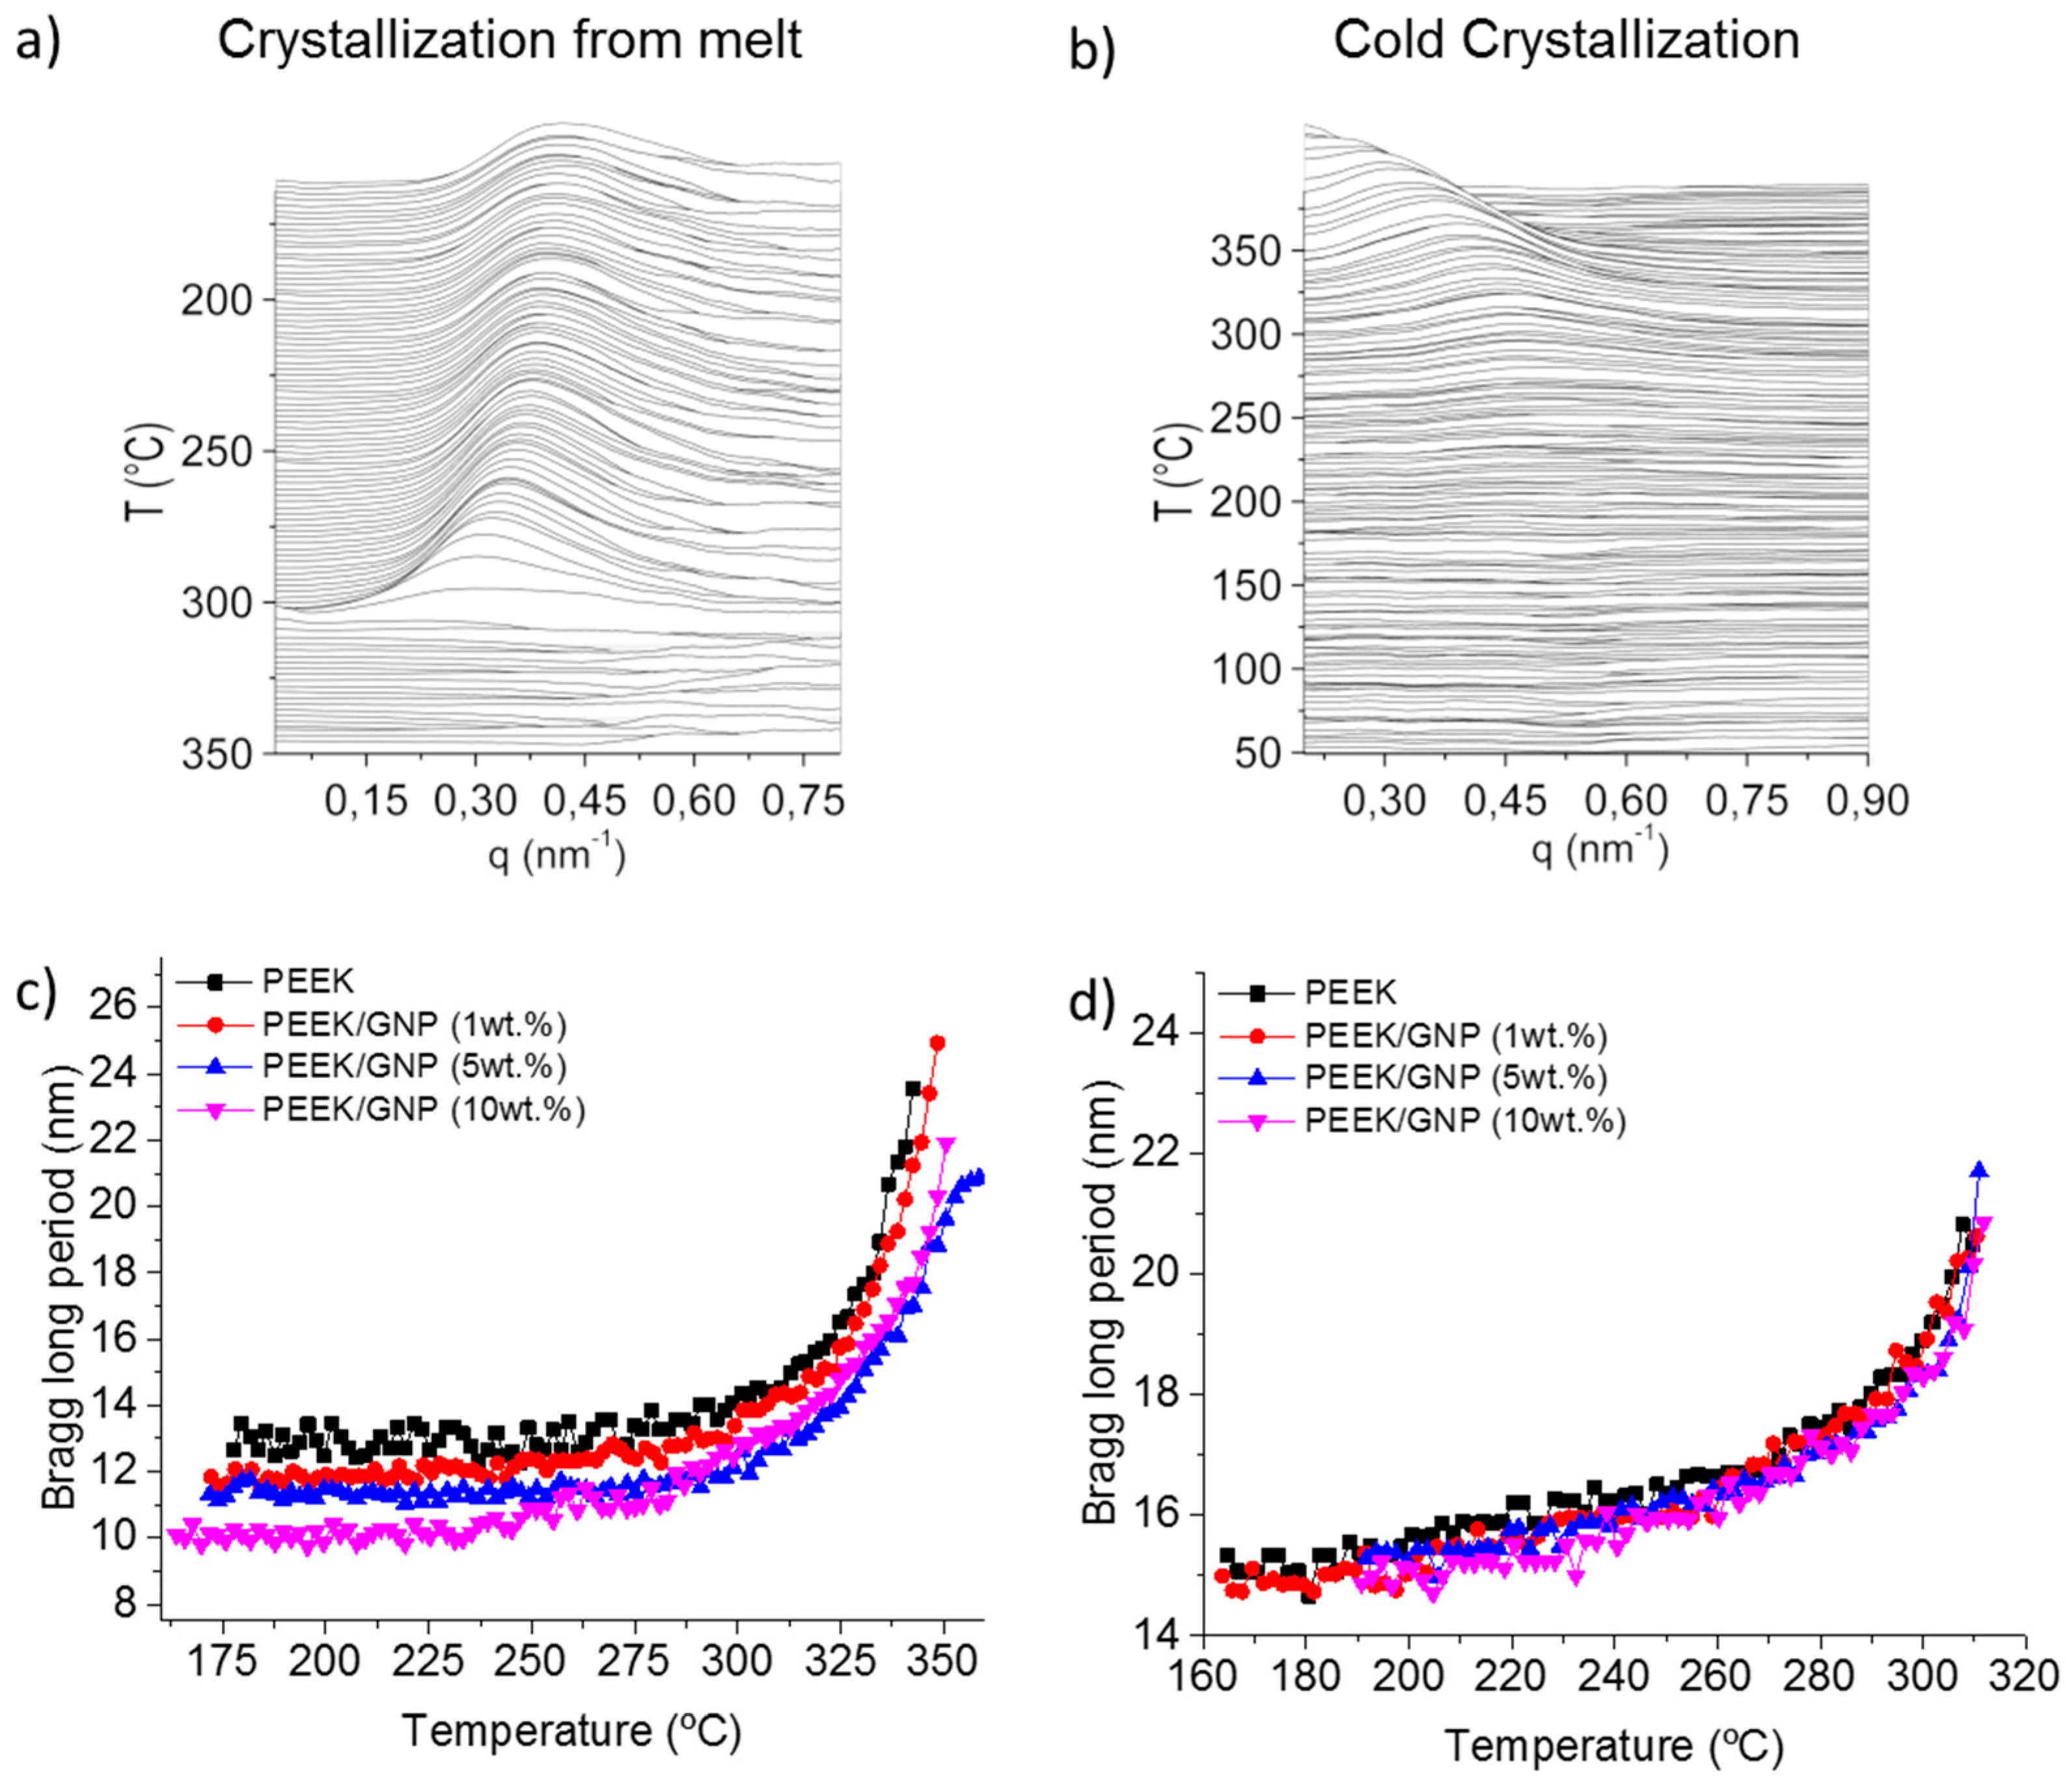
3.3. Non-Isothermal Crystallization Morphology
4. Conclusions
Supplementary Materials
Author Contributions
Funding
Acknowledgments
Conflicts of Interest
References
- Kuo, M.C.; Huang, J.C.; Chen, M. Non-isothermal crystallization kinetic behavior of alumina nanoparticle filled poly(ether ether ketone). Mater. Chem. Phys. 2006, 99, 258–268. [Google Scholar] [CrossRef]
- Qiu, Z.; Mo, Z.; Yu, Y.; Zhang, H.; Sheng, S.; Song, C. Nonisothermal melt and cold crystallization kinetics of poly(aryl ether ketone ether ketone ketone). J. Appl. Polym. Sci. 2000, 77, 2865–2871. [Google Scholar] [CrossRef]
- Sattari, M.; Molazemhosseini, A.; Naimi-Jamal, M.R.; Khavandi, A. Nonisothermal crystallization behavior and mechanical properties of PEEK/SCF/nano-SiO2 composites. Mater. Chem. Phys. 2014, 147, 942–953. [Google Scholar] [CrossRef]
- Non-Isothermal Crystallization of Poly(etheretherketone) Aromatic Polymer Composite|Peggy Cebe|Download. Available online: http://booksc.org/book/5346834/26d8ce (accessed on 6 February 2018).
- Díez-Pascual, A.M.; Naffakh, M.; Marco, C.; Ellis, G.; Gómez-Fatou, M.A. High-performance nanocomposites based on polyetherketones. Prog. Mater. Sci. 2012, 57, 1106–1190. [Google Scholar] [CrossRef]
- Baltá Calleja, F.J.; Denchev, Z.; Ezquerra, T.A.; Hsiao, B.S.; Nogales Ruiz, A.; Sics, I. Molecular dynamics and microstructure development during cold crystallization in poly(ether-ether-ketone) as revealed by real time dielectric and X-ray methods. J. Chem. Phys. 2001, 115, 3804–3813. [Google Scholar]
- Naffakh, M.; Gómez, M.A.; Ellis, G.; Marco, C. Isothermal Crystallization Kinetics of PEEK/Vectra® Blends by DSC and Time-Resolved Synchrotron X-ray Diffraction. Polym. Eng. Sci. Newtown 2006, 46, 1411–1418. [Google Scholar] [CrossRef]
- Jin, L.; Ball, J.; Bremner, T.; Sue, H.-J. Crystallization behavior and morphological characterization of poly(ether ether ketone). Polymer 2014, 55, 5255–5265. [Google Scholar] [CrossRef]
- Wei, C.-L.; Chen, M.; Yu, F.-E. Temperature modulated DSC and DSC studies on the origin of double melting peaks in poly(ether ether ketone). Polymer 2003, 44, 8185–8193. [Google Scholar] [CrossRef]
- Lovinger, A.J.; Davis, D.D. Electron-microscopic investigation of the morphology of a melt-crystallized polyaryletherketone. J. Appl. Phys. 1985, 58, 2843–2853. [Google Scholar] [CrossRef]
- The Physics of Polymers—Concepts for Understanding Their Structures and Behavior|Gert R. Strobl|Springer. Available online: https://www.springer.com/la/book/9783540252788 (accessed on 25 September 2018).
- Velisaris, C.N.; Seferis, J.C. Crystallization kinetics of polyetheretherketone (peek) matrices. Polym. Eng. Sci. 1986, 26, 1574–1581. [Google Scholar] [CrossRef]
- Ko, T.Y.; Woo, E.M. Changes and distribution of lamellae in the spherulites of poly(ether ether ketone) upon stepwise crystallization. Polymer 1996, 37, 1167–1175. [Google Scholar] [CrossRef]
- Lattimer, M.P.; Hobbs, J.K.; Hill, M.J.; Barham, P.J. On the origin of the multiple endotherms in PEEK. Polymer 1992, 33, 3971–3973. [Google Scholar] [CrossRef]
- Lee, Y.; Porter, R.S. Double-melting behavior of poly(ether ether ketone). Macromolecules 1987, 20, 1336–1341. [Google Scholar] [CrossRef]
- Choe, C.R.; Lee, K.H. Nonisothermal crystallization kinetics of poly(etheretherketone) (PEEK). Polym. Eng. Sci. 1989, 29, 801–805. [Google Scholar] [CrossRef]
- Cazé, C.; Devaux, E.; Crespy, A.; Cavrot, J.P. A new method to determine the Avrami exponent by d.s.c. studies of non-isothermal crystallization from the molten state. Polymer 1997, 38, 497–502. [Google Scholar]
- Seo, Y.; Kim, S. Nonisothermal crystallization behavior of poly(aryl ether ether ketone). Polym. Eng. Sci. 2001, 41, 940–945. [Google Scholar] [CrossRef]
- Rong, C.; Ma, G.; Zhang, S.; Song, L.; Chen, Z.; Wang, G.; Ajayan, P.M. Effect of carbon nanotubes on the mechanical properties and crystallization behavior of poly(ether ether ketone). Compos. Sci. Technol. 2010, 70, 380–386. [Google Scholar] [CrossRef]
- Díez-Pascual, A.M.; Naffakh, M.; González-Domínguez, J.M.; Ansón, A.; Martínez-Rubi, Y.; Martínez, M.T.; Simard, B.; Gómez, M.A. High performance PEEK/carbon nanotube composites compatibilized with polysulfones-II. Mechanical and electrical properties. Carbon 2010, 48, 3500–3511. [Google Scholar] [CrossRef]
- Díez-Pascual, A.M.; Naffakh, M.; Gómez, M.A.; Marco, C.; Ellis, G.; Martínez, M.T.; Ansón, A.; González-Domínguez, J.M.; Martínez-Rubi, Y.; Simard, B. Development and characterization of PEEK/carbon nanotube composites. Carbon 2009, 47, 3079–3090. [Google Scholar] [CrossRef] [Green Version]
- Wang, F.; Drzal, L.T.; Qin, Y.; Huang, Z. Mechanical properties and thermal conductivity of graphene nanoplatelet/epoxy composites. J. Mater. Sci. 2015, 50, 1082–1093. [Google Scholar] [CrossRef]
- Tewatia, A.; Hendrix, J.; Dong, Z.; Taghon, M.; Tse, S.; Chiu, G.; Mayo, W.E.; Kear, B.; Nosker, T.; Lynch, J. Characterization of melt-blended grapheme—Poly(ether ether ketone) nanocomposite. Mater. Sci. Eng. B 2017, 216, 41–49. [Google Scholar] [CrossRef]
- Hwang, Y.; Kim, M.; Kim, J. Improvement of the mechanical properties and thermal conductivity of poly(ether-ether-ketone) with the addition of graphene oxide-carbon nanotube hybrid fillers. Compos. Part A Appl. Sci. Manuf. 2013, 55, 195–202. [Google Scholar] [CrossRef]
- Hou, X.; Hu, Y.; Hu, X.; Jiang, D. Poly (ether ether ketone) composites reinforced by graphene oxide and silicon dioxide nanoparticles: Mechanical properties and sliding wear behavior. High Perform. Polym. 2018, 30, 406–417. [Google Scholar] [CrossRef]
- Liu, C.; Chan, K.; Shen, J.; Liao, C.; Yeung, K.; Tjong, S.; Liu, C.; Chan, K.W.; Shen, J.; Liao, C.Z.; et al. Polyetheretherketone Hybrid Composites with Bioactive Nanohydroxyapatite and Multiwalled Carbon Nanotube Fillers. Polymers 2016, 8, 425. [Google Scholar] [CrossRef]
- Gonçalves, J.; Lima, P.; Krause, B.; Pötschke, P.; Lafont, U.; Gomes, J.; Abreu, C.; Paiva, M.; Covas, J.; Gonçalves, J.; et al. Electrically Conductive Polyetheretherketone Nanocomposite Filaments: From Production to Fused Deposition Modeling. Polymers 2018, 10, 925. [Google Scholar] [CrossRef]
- Herrera-Ramirez, L.C.; Castell, P.; Fernandez-Blazquez, J.P.; Fernandez, A.; de Villoria, R.G. How do graphite nanoplates affect the fracture toughness of polypropylene composites? Compos. Sci. Technol. 2015, 111, 9–16. [Google Scholar] [CrossRef]
- M. Schultz, J.-N.C.J. The influence of microstructure on the failure behavior of PEEK. J. Mater. Sci. 1990, 25, 3746–3752. [Google Scholar]
- Filik, J.; Ashton, A.W.; Chang, P.C.Y.; Chater, P.A.; Day, S.J.; Drakopoulos, M.; Gerring, M.W.; Hart, M.L.; Magdysyuk, O.V.; Michalik, S.; et al. Processing two-dimensional X-ray diffraction and small-angle scattering data in DAWN 2. J. Appl. Cryst. 2017, 50, 959–966. [Google Scholar] [CrossRef] [Green Version]
- Cser, F. About the Lorentz correction used in the interpretation of small angle X-ray scattering data of semicrystalline polymers. J. Appl. Polym. Sci. 2001, 80, 2300–2308. [Google Scholar] [CrossRef]
- Bangarusampath, D.S.; Ruckdäschel, H.; Altstädt, V.; Sandler, J.K.W.; Garray, D.; Shaffer, M.S.P. Rheology and properties of melt-processed poly(ether ether ketone)/multi-wall carbon nanotube composites. Polymer 2009, 50, 5803–5811. [Google Scholar] [CrossRef]
- Wu, D.; Wu, L.; Sun, Y.; Zhang, M. Rheological properties and crystallization behavior of multi-walled carbon nanotube/poly(ε-caprolactone) composites. J. Polym. Sci. Part B Polym. Phys. 2007, 45, 3137–3147. [Google Scholar] [CrossRef]
- Zhan, Y.; Long, Z.; Wan, X.; He, Y.; Liu, X. Exfoliated graphite nanoplatelets/poly(arylene ether nitrile) nanocomposites: In situ synthesis, characterization, and enhanced properties. High Perform. Polym. 2017, 29, 1121–1129. [Google Scholar] [CrossRef]
- Thankappan Nair, S.; Vijayan, P.P.; Xavier, P.; Bose, S.; George, S.C.; Thomas, S. Selective localisation of multi walled carbon nanotubes in polypropylene/natural rubber blends to reduce the percolation threshold. Compos. Sci. Technol. 2015, 116, 9–17. [Google Scholar] [CrossRef]
- Ozawa, T. Kinetics of non-isothermal crystallization. Polymer 1971, 12, 150–158. [Google Scholar] [CrossRef]
- Yang, X.; Wu, Y.; Wei, K.; Fang, W.; Sun, H. Non-Isothermal Crystallization Kinetics of Short Glass Fiber Reinforced Poly (Ether Ether Ketone) Composites. Materials 2018, 11, 2094. [Google Scholar] [CrossRef] [PubMed]
- Liu, T.; Mo, Z.; Wang, S.; Zhang, H. Nonisothermal melt and cold crystallization kinetics of poly(aryl ether ether ketone ketone). Polym. Eng. Sci. 1997, 37, 568–575. [Google Scholar] [CrossRef]
- Jeziorny, A. Parameters characterizing the kinetics of the non-isothermal crystallization of poly(ethylene terephthalate) determined by d.s.c. Polymer 1978, 19, 1142–1144. [Google Scholar] [CrossRef]
- Sommer, J.-U. Crystallization of Polymers.Volume 2: Kinetics and Mechanisms. By Leo Mandelkern. ChemPhysChem 2005, 6, 2437–2438. [Google Scholar] [CrossRef]
- Deng, S.; Lin, Z.; Xu, B.; Qiu, W.; Liang, K.; Li, W. Isothermal crystallization kinetics, morphology, and thermal conductivity of graphene nanoplatelets/polyphenylene sulfide composites. J. Therm. Anal. Calorim. 2014, 118, 197–203. [Google Scholar] [CrossRef]
- Wang, H.; Zhou, F.; Wang, T.; Zhang, H.; Liu, T.; Yang, Y. Isothermal and nonisothermal crystallization kinetics of poly(ether ether ketone)/gadolinium oxide composites. High Perform. Polym. 2013, 25, 584–593. [Google Scholar] [CrossRef]
- Hay, J.N.; Langford, J.I.; Lloyd, J.R. Variation in unit cell parameters of aromatic polymers with crystallization temperature. Polymer 1989, 30, 489–493. [Google Scholar] [CrossRef]
- Jenkins, M.J.; Hay, J.N.; Terrill, N.J. Structure evolution in melt crystallised PEEK. Polymer 2003, 44, 6781–6787. [Google Scholar] [CrossRef]
- Gedler, G.; Antunes, M.; Velasco, J.I. Graphene-induced crystallinity of bisphenol A polycarbonate in the presence of supercritical carbon dioxide. Polymer 2013, 54, 6389–6398. [Google Scholar] [CrossRef]
- Fernandez-Blazquez, J.P.; Perez-Manzano, J.; Bello, A.; Perez, E. The two crystallization modes of mesophase forming polymers. Macromolecules 2007, 40, 1775–1778. [Google Scholar] [CrossRef]
- Hsiao, B.S.; Sauer, B.B.; Verma, R.K.; Zachmann, H.G.; Seifert, S.; Chu, B.; Harney, P. New Insight of Isothermal Melt Crystallization in Poly(aryl ether ether ketone) via Time-Resolved Simultaneous Small-Angle X-ray Scattering/Wide-Angle X-ray Diffraction Measurements. Macromolecules 1995, 28, 6931–6936. [Google Scholar] [CrossRef]
- Xu, J.-Z.; Chen, C.; Wang, Y.; Tang, H.; Li, Z.-M.; Hsiao, B.S. Graphene Nanosheets and Shear Flow Induced Crystallization in Isotactic Polypropylene Nanocomposites. Macromolecules 2011, 44, 2808–2818. [Google Scholar] [CrossRef]
- Iqbal, M.Z.; Abdala, A.A.; Mittal, V.; Seifert, S.; Herring, A.M.; Liberatore, M.W. Processable conductive graphene/polyethylene nanocomposites: Effects of graphene dispersion and polyethylene blending with oxidized polyethylene on rheology and microstructure. Polymer 2016, 98, 143–155. [Google Scholar] [CrossRef] [Green Version]


| Crystallization | Parameters | PEEK | 1 wt % GNP | 5 wt % GNP | 10 wt % GNP |
|---|---|---|---|---|---|
| From melt (−10 °C/min) | Tonset (°C) | 310.2 | 315.9 | 317 | 317.6 |
| Tc (°C) | 302.4 | 306.7 | 306.9 | 308.1 | |
| FWHM (min) | 0.49 | 0.60 | 0.85 | 0.80 | |
| tc (min) | 1.3 | 1.71 | 1.98 | 1.96 | |
| ΔHm (J/g) | 52.2 | 50.6 | 48.4 | 46.5 | |
| Xc (%) | 40.1 | 39.3 | 39.2 | 39.7 | |
| Tm (°C) | 344.8 | 344.6 | 344.9 | 345.2 | |
| From glass (10 °C/min) | Tonset (°C) | 161.5 | 154.6 | 154.5 | 151.7 |
| Tcc (°C) | 169.3 | 165.3 | 164.8 | 163 | |
| FWHM (min) | 0.32 | 0.43 | 0.41 | 0.66 | |
| tc (min) | 1.07 | 1.38 | 1.32 | 1.48 | |
| ΔHm (J/g) | 40.65 | 39.9 | 40.1 | 34.02 | |
| Xcc (%) | 31.3 | 31.0 | 32.5 | 29.1 | |
| ΔHm − ΔHcc (J/g) | 0.7 | 0.9 | 0.5 | 15 | |
| Tm (°C) | 345.3 | 345.8 | 345.4 | 345.3 |
| β (°C/min) | PEEK | 1 wt % GNP | 5 wt % GNP | 10 wt % GNP | ||||
|---|---|---|---|---|---|---|---|---|
| n | Zc | n | Zc | n | Zc | n | Zc | |
| −2.5 | 2.4 | 0.49 | 2.36 | 0.42 | 2.24 | 0.40 | 2.37 | 0.38 |
| −5 | 2.39 | 0.90 | 2.25 | 0.85 | 2.3 | 0.79 | 2.3 | 0.85 |
| −10 | 2.25 | 1.09 | 2.38 | 1.06 | 2.22 | 1.02 | 2.5 | 0.97 |
| −15 | 2.14 | 1.10 | 2.41 | 1.08 | 2.23 | 1.06 | 2.59 | 1.07 |
| −20 | 2.15 | 1.10 | 2.34 | 1.08 | 2.3 | 1.06 | 2.63 | 1.08 |
| 2.5 | 3.5 | 0.36 | 2.84 | 0.18 | 3.2 | 0.11 | ||
| 5 | 3.4 | 0.87 | 2.38 | 0.68 | 2.81 | 0.70 | ||
| 10 | 3.72 | 1.05 | 2.36 | 0.95 | 2.48 | 0.97 | ||
| 15 | 4.19 | 1.17 | 2.78 | 1.01 | 2.6 | 1.07 | ||
| 20 | 3.86 | 1.18 | 2.73 | 1.08 | 2.36 | 1.07 | ||
© 2019 by the authors. Licensee MDPI, Basel, Switzerland. This article is an open access article distributed under the terms and conditions of the Creative Commons Attribution (CC BY) license (http://creativecommons.org/licenses/by/4.0/).
Share and Cite
Alvaredo, Á.; Martín, M.I.; Castell, P.; Guzmán de Villoria, R.; Fernández-Blázquez, J.P. Non-Isothermal Crystallization Behavior of PEEK/Graphene Nanoplatelets Composites from Melt and Glass States. Polymers 2019, 11, 124. https://doi.org/10.3390/polym11010124
Alvaredo Á, Martín MI, Castell P, Guzmán de Villoria R, Fernández-Blázquez JP. Non-Isothermal Crystallization Behavior of PEEK/Graphene Nanoplatelets Composites from Melt and Glass States. Polymers. 2019; 11(1):124. https://doi.org/10.3390/polym11010124
Chicago/Turabian StyleAlvaredo, Ángel, María Isabel Martín, Pere Castell, Roberto Guzmán de Villoria, and Juan P. Fernández-Blázquez. 2019. "Non-Isothermal Crystallization Behavior of PEEK/Graphene Nanoplatelets Composites from Melt and Glass States" Polymers 11, no. 1: 124. https://doi.org/10.3390/polym11010124