
A New Method for Determination of Pectin Content Using Spectrophotometry

School of Light Industry and Engineering, South China University of Technology, No.381 Wushan Road, Tianhe District, Guangzhou 510640, China
*
Author to whom correspondence should be addressed.
Polymers 2021, 13(17), 2847; https://doi.org/10.3390/polym13172847
Submission received: 12 July 2021
/
Revised: 15 August 2021
/
Accepted: 20 August 2021
/
Published: 25 August 2021
(This article belongs to the Section Polymer Analysis and Characterization)
Abstract
:The study aimed at developing a new spectrophotometric method for determining the pectin content. Take commercial pectin as an example, and the method is based on the reaction of copper ions with pectin to produce copper pectate. The spectrophotometer was used to measure the remaining content of copper ions so as to calculate the pectin content. This method eliminated the weight step and avoided the error associated with it. Effects of reaction time, temperature, and pH on absorbance were also studied. Additionally, the accuracy of this method was verified. It indicated excellent repeatability and accuracy with the relative standard deviation of 2.09%. In addition, three different plant types were used to demonstrate the reliability of the method. To summarize, this method can be widely used for the determination of pectin content in many materials.
1. Introduction
Pectin is one kind of polymer with a complex chemical structure, which is mainly consisted of α-D-galacturonic acids [1]. As an important component of biomass, it is widely found in the intercellular layer and cell walls of plant cells [2]. Pectin is commonly used as a gelling agent [3], emulsifier, stabilizer [4], thickener, and heavy metal adsorbent [5] in the fields of food [6], medical, cosmetic, and other industries [7]. Rapid and accurate determination of pectin content is vital for improving its processing efficiency and optimizing the extraction method.
Currently, the pectin content determination methods typically include spectrometric method, chromatographic method, gravimetric method, etc. [8]. The mechanism of spectrometric method and chromatographic method is that hydrolysis products such as monosaccharides or galacturonic acid of pectin in acidic conditions could be measured by instruments [9,10]. Though they possess the advantages of high resolution and fast analysis speed, some complex pretreatment of samples is required [11], and other components such as cellulose and hemicellulose can also be hydrolyzed causing higher absorbance [12]. Most importantly, these methods must decompose pectin, therefore making it hard to retain it, so it is only slightly applied in some fields. Gravimetric method has been used widely the most. It is based on the chelation reaction of pectin with metal ions (Ca2+, Cu2+, Fe3+, Mg2+, etc.) to produce precipitation [13]. The content of pectin can be measured by calculating the weight of the precipitation. This process is complicated and time-consuming, although it can acquire the result directly. In the meantime, there are materials in which the amount of pectin is scarce and researchers must be extremely precise in order to reduce the error [14].
Based on the mechanism of gravimetric method, a novel method for determination of pectin content by spectrophotometry was proposed in this paper. By measuring the change of metal ion content before and after the reaction, the precipitation weight of pectin was calculated to obtain the content of pectin. Compared with the gravimetric method, it has the characteristics of higher efficiency and less error. In contrast with the spectrometric method and chromatographic method, the complex sample pretreatment process is eliminated so the pectin could be retained, and the reagents used in this method are less toxic and environmentally friendly. In a word, the method is effective, precise and accurate, which provides a new direction for the determination and application of pectin content in many materials.
2. Materials and Methods
2.1. Materials
Bark of paper mulberry; Wikstroemia; Sisal; Pectin: Aladdin, Shanghai, China; NH3·H2O: Guangzhou Chemical Reagent Factory, Guangzhou, China; NaOH: Guangzhou Chemical Reagent Factory, Guangzhou, China; CH3COOH: Tianjin Damao Chemical reagent Factory, Tianjin, China; CuCl2: Tianjin Damao Chemical reagent Factory, Tianjin, China; Na2CO3: Tianjin Damao Chemical reagent Factory, Tianjin, China; NaHCO3: Tianjin Damao Chemical reagent Factory, Tianjin, China. All the reagents used were obtained from commercial sources and the experimental water was distilled water.
UV-Vis spectrophotometer: UV-1900, Shimadzu, Japan.
FT-IR Spectrometer FTIR: Nicolet IS50—Nicolet Continuum, Thermo Fisher Scientific, Waltham, MA, USA.
Electro- Thermostatic Blast Oven: DHG-9070A, Shanghai Shenxian Constant temperature equipment Factory, Shanghai, China.
Electro-Thermostatic Water Bath: HH-6, Changzhou Aohua instrument, Changzhou, China.
2.2. Experimental Methods and Procedures
2.2.1. Precipitated Pectin
The precipitation of calcium pectate and copper pectate was according to the precipitation of calcium pectate in GB/T 10742-2008 [15]. Among them, the precipitators were calcium chloride and copper chloride.
2.2.2. Pectin Determination with Gravimetric Method
The filter paper with calcium pectinate (or copper pectinate) precipitation in Section 2.2.1 was placed in a flat weighing flask. Then, the flat weighing flask was moved into oven and dried to constant weight at 105 °C. In the meanwhile, the moisture content and the dry weight of filter paper were calculated. The content of pectin was expressed by the weight of calcium pectate (or copper pectate). The calculation formula is as follows:
where X is pectin content (measured by calcium pectinate or copper pectinate, in %); m is the absolute dry weight of the filter paper (in g); m1 is the total weight of dried calcium pectate (or copper pectinate) and filter paper (in g); m0 is the weight of the sample (in g); and W is the moisture of the sample (in %).
2.2.3. Pectin Determination with Copper Ion Colorimetry Method
- Establishment of Cu2+ Working Curve
Two milliliters of different concentrations (3~10.5 mmol/L) of CuCl2 solution were put into a set of 10 mL of the volumetric flask containing buffer solution, respectively. The resulting solution was transferred to the quartz cuvette, and buffer solution was used as a blank sample. The absorbance at 712 nm was determined by a UV-Vis spectrophotometer. A linear standard curve was established between the absorbance and the content of Cu2+.
- 2.
- Determination of Pectin Content
Two milliliters of filtrate in Section 2.2.1 steps was added into 10 mL of the volumetric flask, which contains 8 mL of buffer solution. After mixing well, the mixture was moved to a quartz cuvette, and the absorbance at 712 nm was measured in a UV-vis spectrophotometer to determine the content of Cu2+ in the filtrate, which can further be used to calculate the pectin content. The calculation formula is as follows:
where X is pectin content (measured by copper pectate content, in %); C is the concentration of Cu2+ according to the working curve (in mmol/L); n0 is the content of Cu2+ before the reaction (in mmol); V is the total volume of the filtrate (in mL); 64 is the relative atomic weight of copper; 0.1172 is the ratio of copper atoms in copper pectate; m0 is the weight of the sample (in g); and W is the moisture of the sample (in %).
3. Results
3.1. Sample Analyses
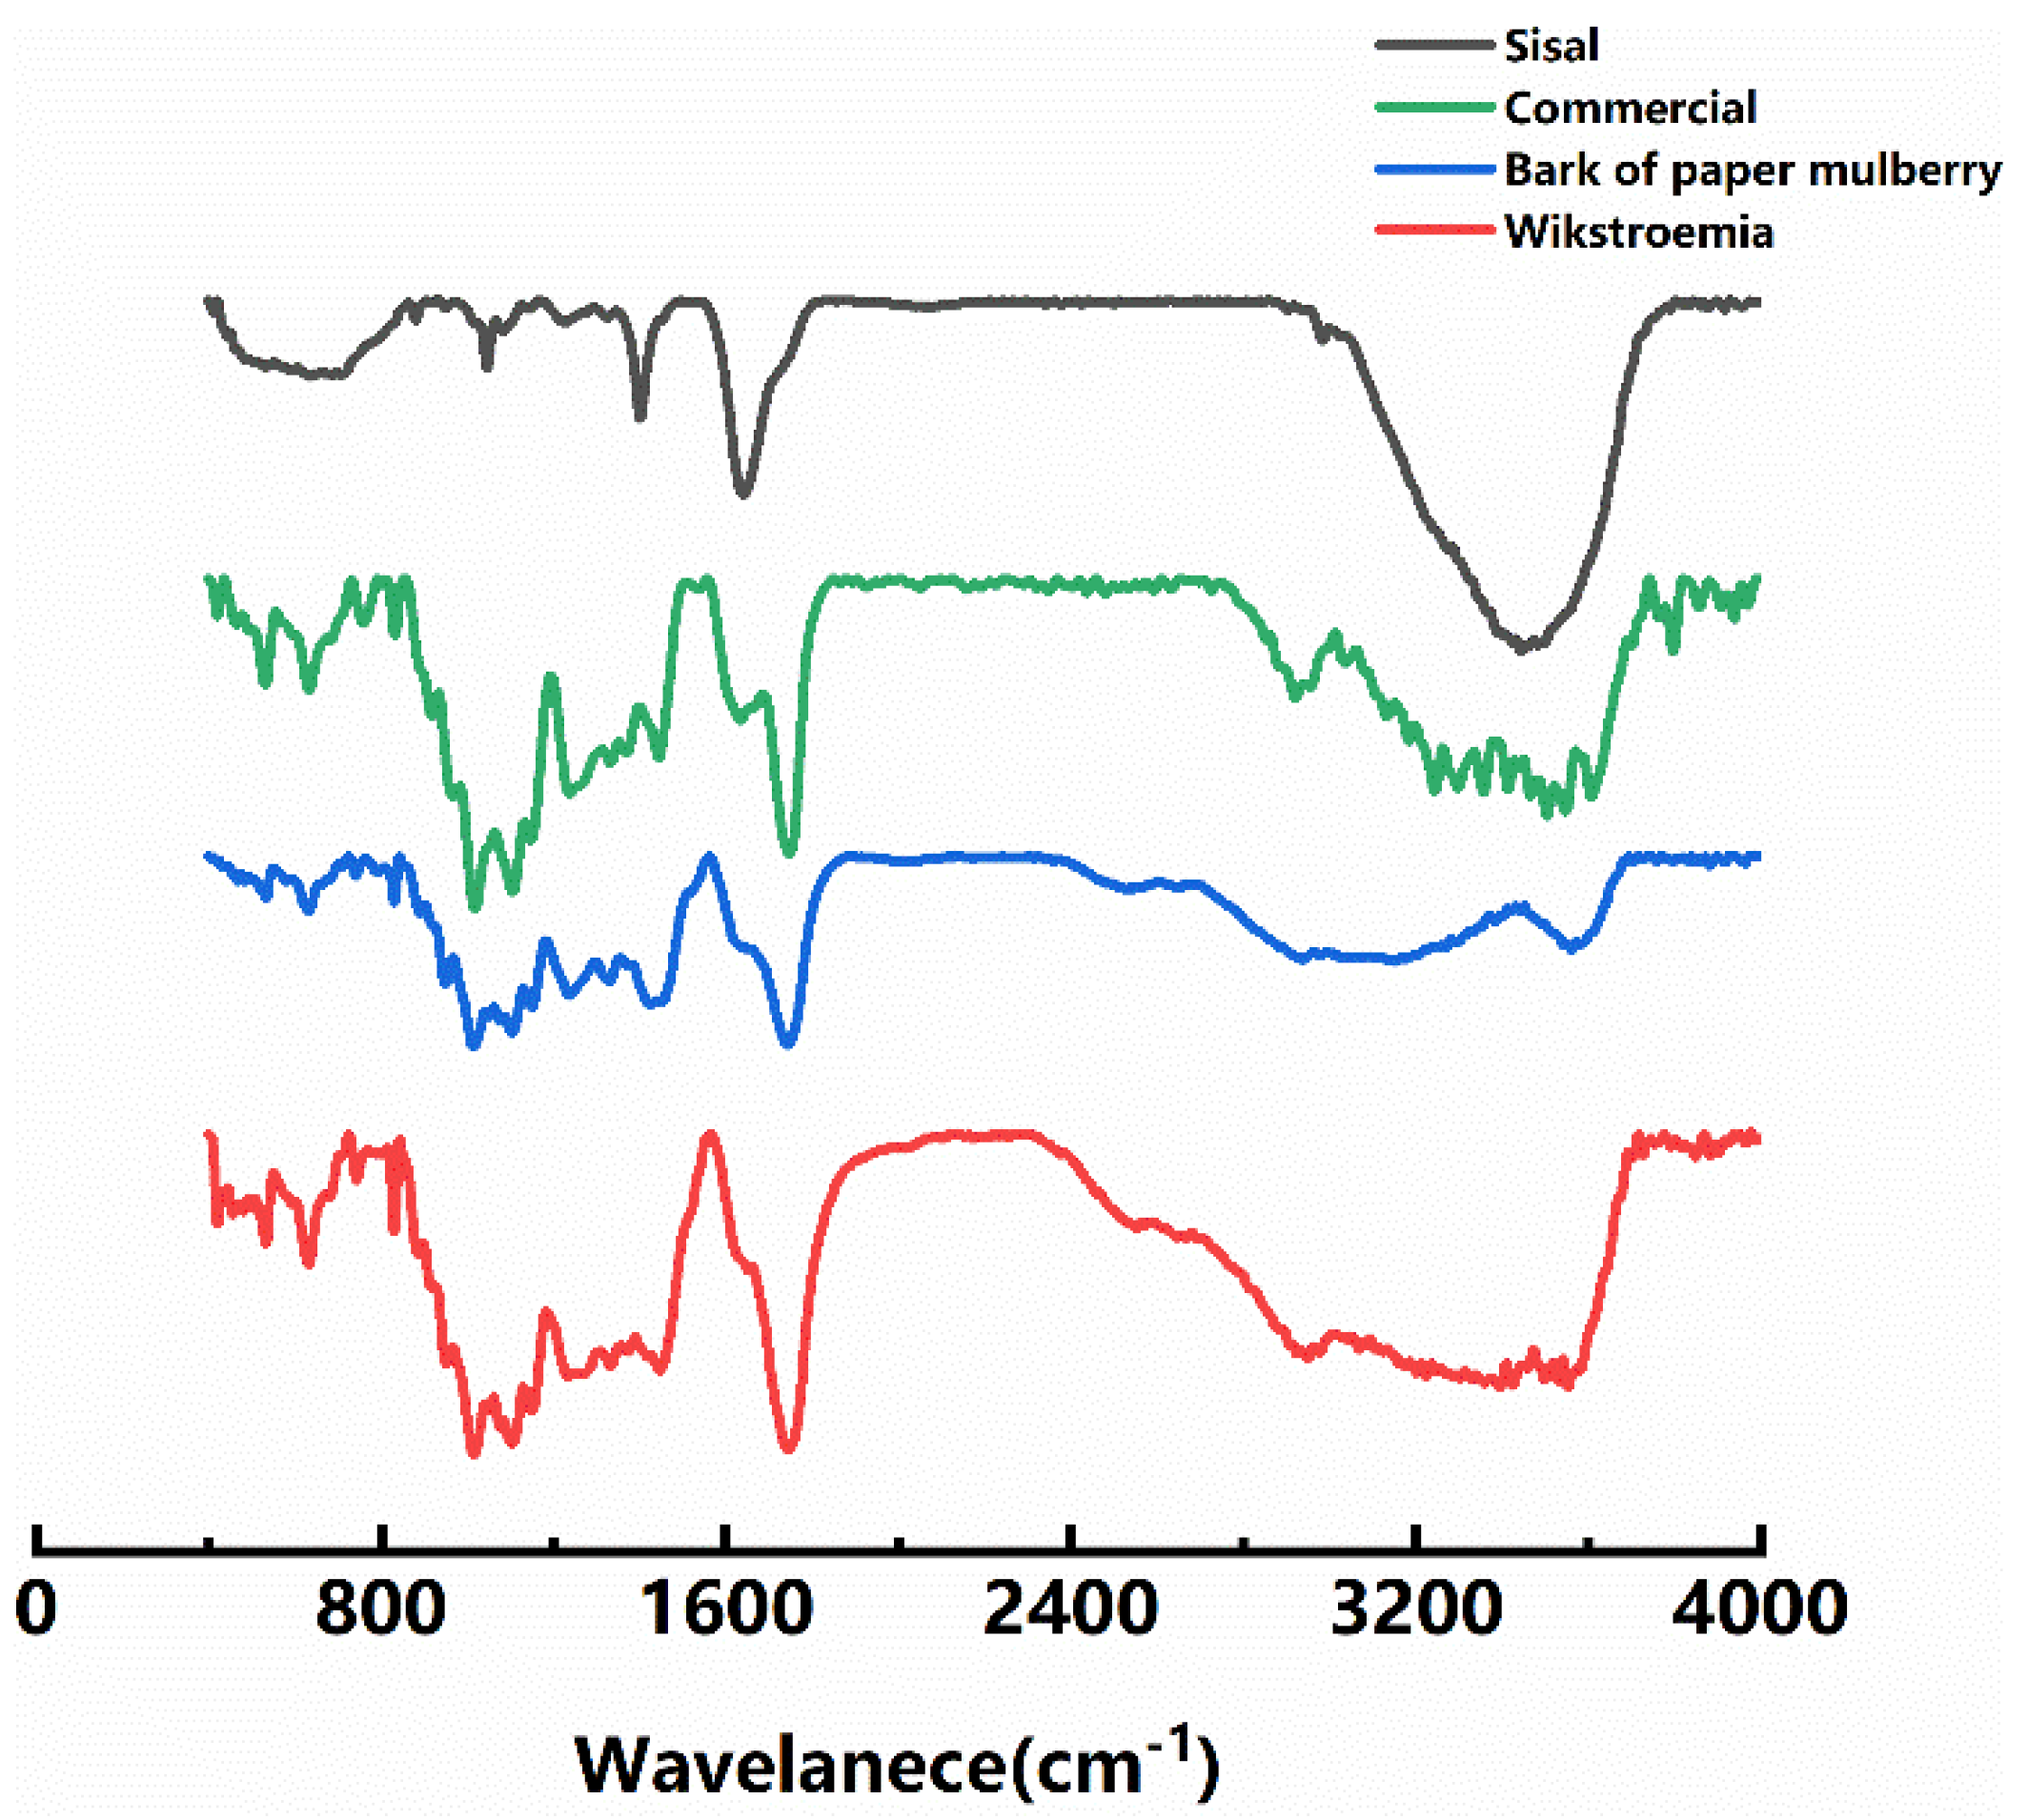
The chemical characteristics of several different pectin types were analyzed by FT-IR, and the results are shown in Figure 1. The wide peak between 2300 and 3800 cm−1 is the result of O–H stretching vibration of intramolecular or intermolecular hydrogen bonds, and the vibration of pectin is mainly caused by intramolecular and intermolecular hydrogen bonds of galacturonic acid polymers. The weak absorption peak near 2930~2980 cm−1 is caused by the stretching vibration of C–H (including CH, CH2 and CH3) of sugars. For pectin samples, the residue of methyl galacturonic acid produces O–CH3 stretching vibration between 2950 and 2750 cm−1. The absorption peak near 1745 cm–1 is the stretching vibration of the ester bond (–COOR) C–O formed by the carboxyl aldehyde group. The absorption peak at 1630 cm−1 is the asymmetric stretching vibration of free carboxylic acid or carboxylic acid salt (–COO) C=O, and is also the absorption peak of the sugar hydrate sample. The absorption peak of 1300~1000 cm−1 is caused by the stretching vibration of C–O, one of which is attributed to C–O–H on the sugar ring and C–O–C glycoside bond, and the other is attributed to C–O–H and C–O–R of the carboxyl galacturonic acid group [16].
Meanwhile, the degree of esterification (DE) was determined using FTIR analysis method. Results are shown in Table 1. It can be seen that the pectin samples we used included both LMP(DE < 50%, Low Methoxyl pectin) and HMP(DE ≥ 50%, High Methoxyl pectin). DE is a ratio of methyl-esterified carboxyl groups to the number of total carboxyl groups present. The percentage of DE was determined according to Equation (3) [17]:
where A1630 and A1745 denote the absorbance intensity, respectively, at 1630 and 1745 cm−1 for non-methyl-esterified carboxyl groups and the methyl-esterified carboxyl groups.
3.2. The Mechanism of the Copper Ion Colorimetry Method
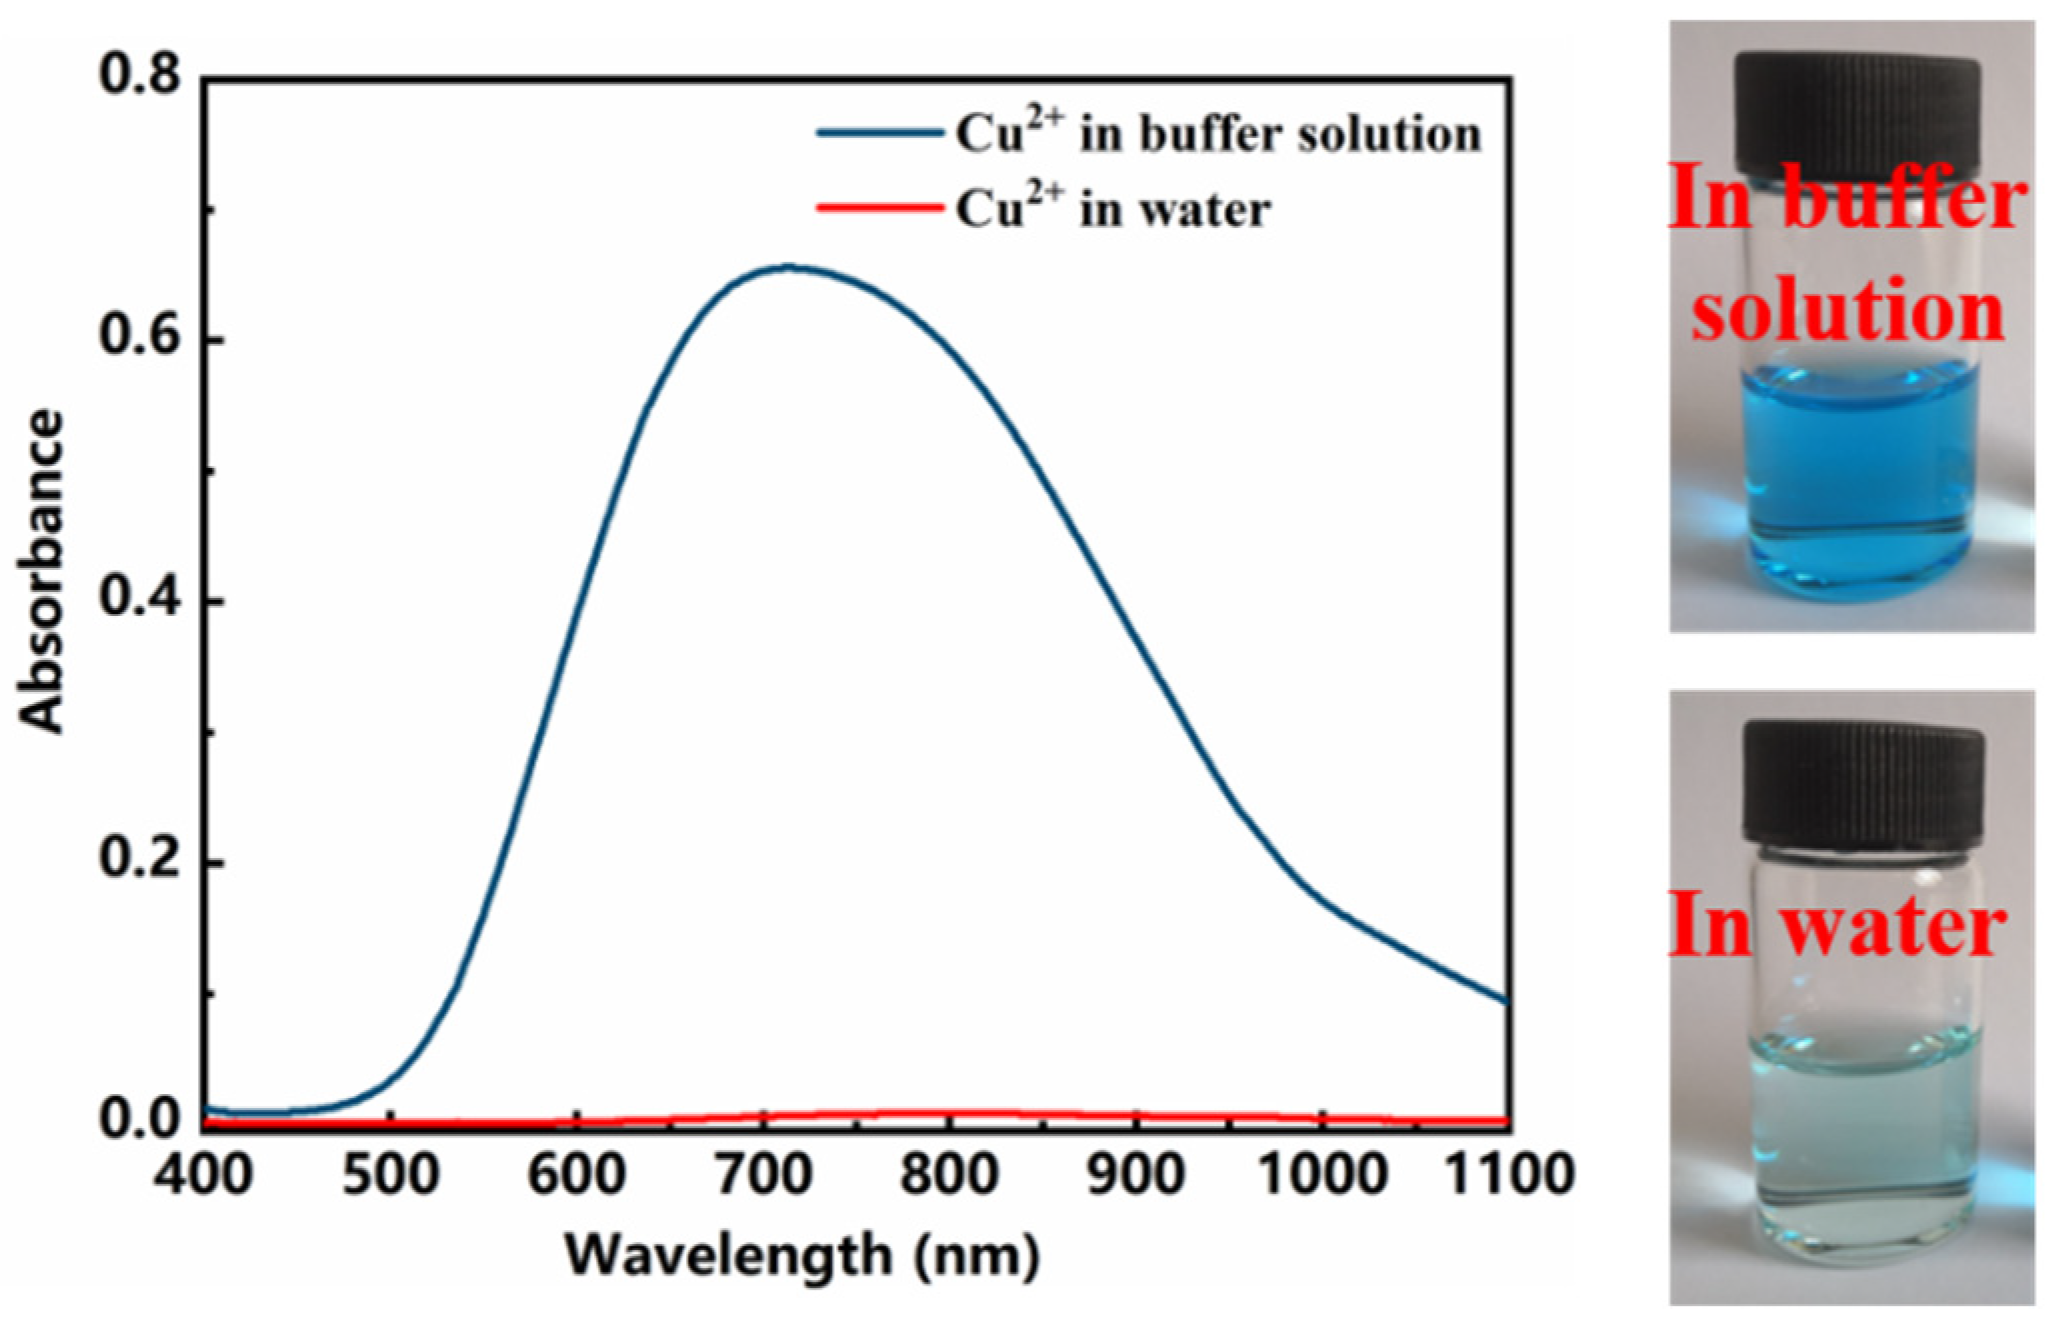
When determining pectin content with the gravimetric method, Ca2+ is used as the precipitant during the process of a precipitation reaction. However, the absorbance of Ca2+ is difficult to determine unless the addition of a certain number of chromogenic agents [18,19,20]. Even in this situation, its absorbance should be measured after a period of time in a dark environment. This process is complicated, and the absorbance fluctuates greatly. Therefore, Cu2+ is selected as the metal ion to be measured. In addition, Cu2+ could react with buffer solution to produce basic copper carbonate, as shown in below reaction, which has the specific absorption peak around 710 nm [21]. Figure 2 showed the spectrum of Cu2+ in buffer solution and water, respectively.
2Cu2+ + CO32- + 2OH− = Cu2(OH)2CO3
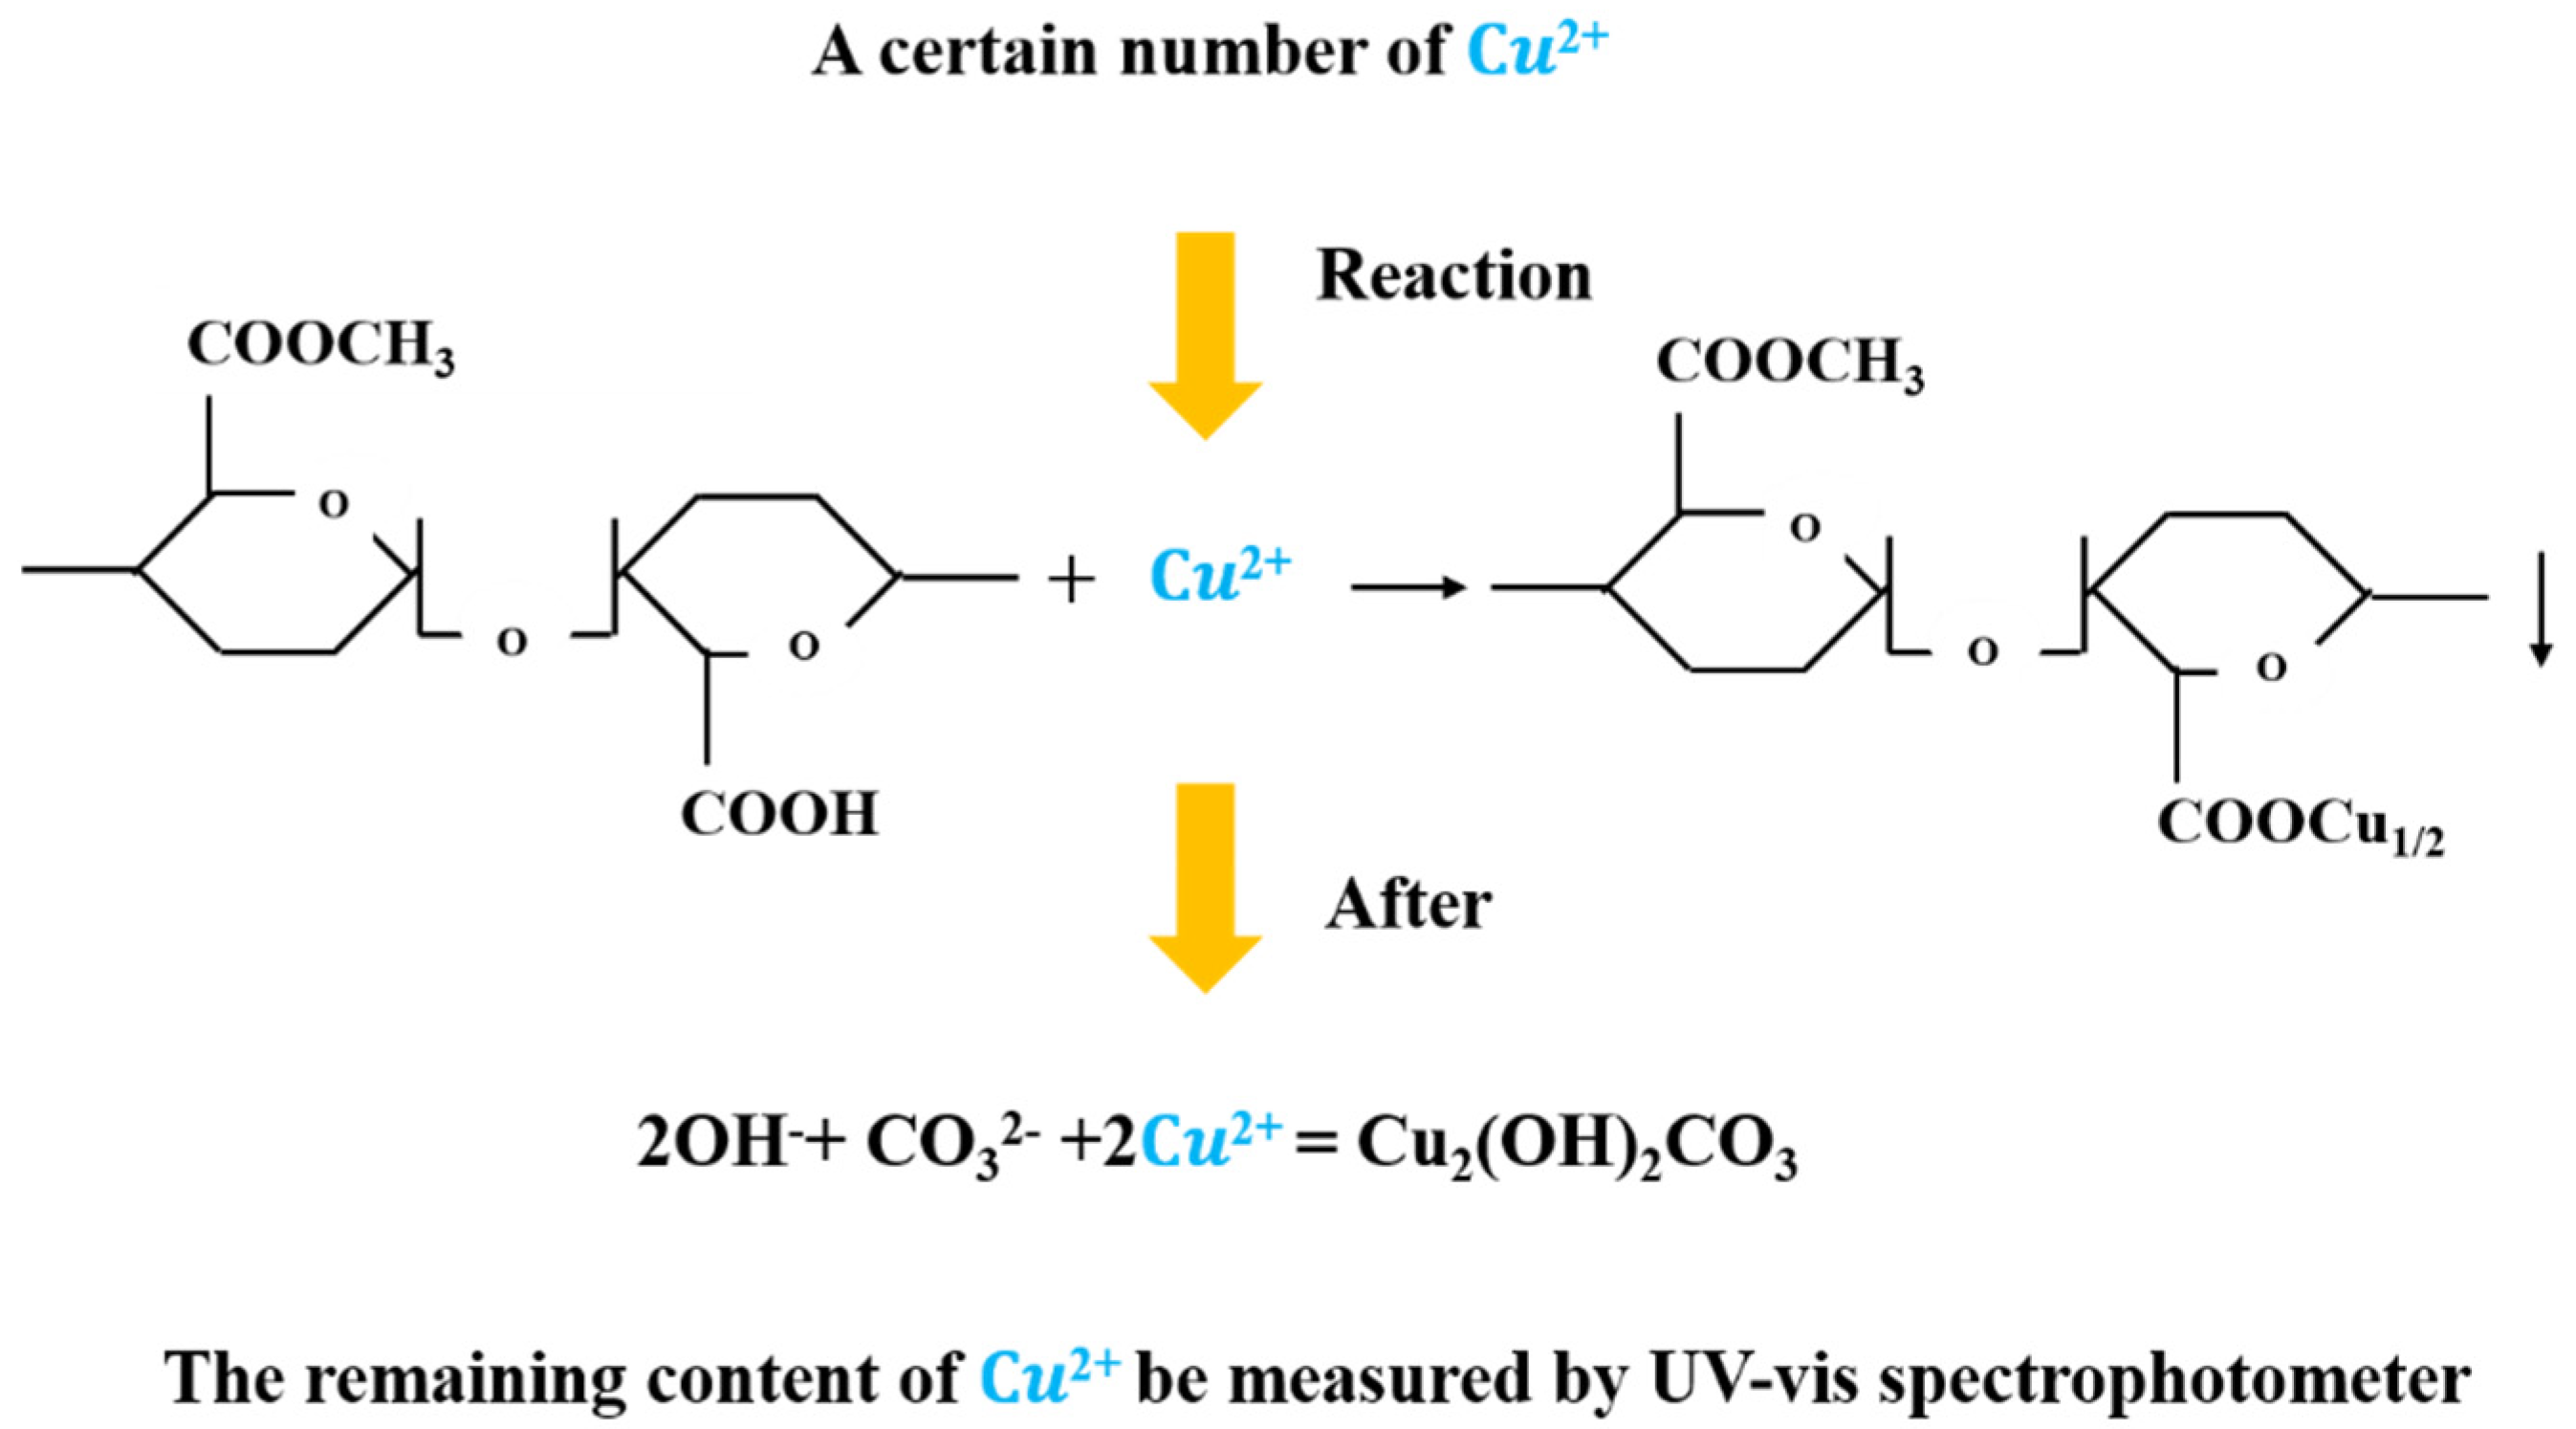
The molecular formula of copper pectate is C17H22O16Cu, where Cu accounts for 11.72% of the weight of copper pectate [22,23]. Therefore, the content of copper pectate can be obtained by measuring the content of Cu2+, which can be calculated by measuring the Cu2+ content in the filtrate. Based on this mechanism (as shown in Figure 3), a new method for the rapid determination of pectin content was established in this paper.
3.3. Effects of Process Parameters on Absorbance of Basic Copper Carbonate
3.3.1. Determination of Optimal Wavelength
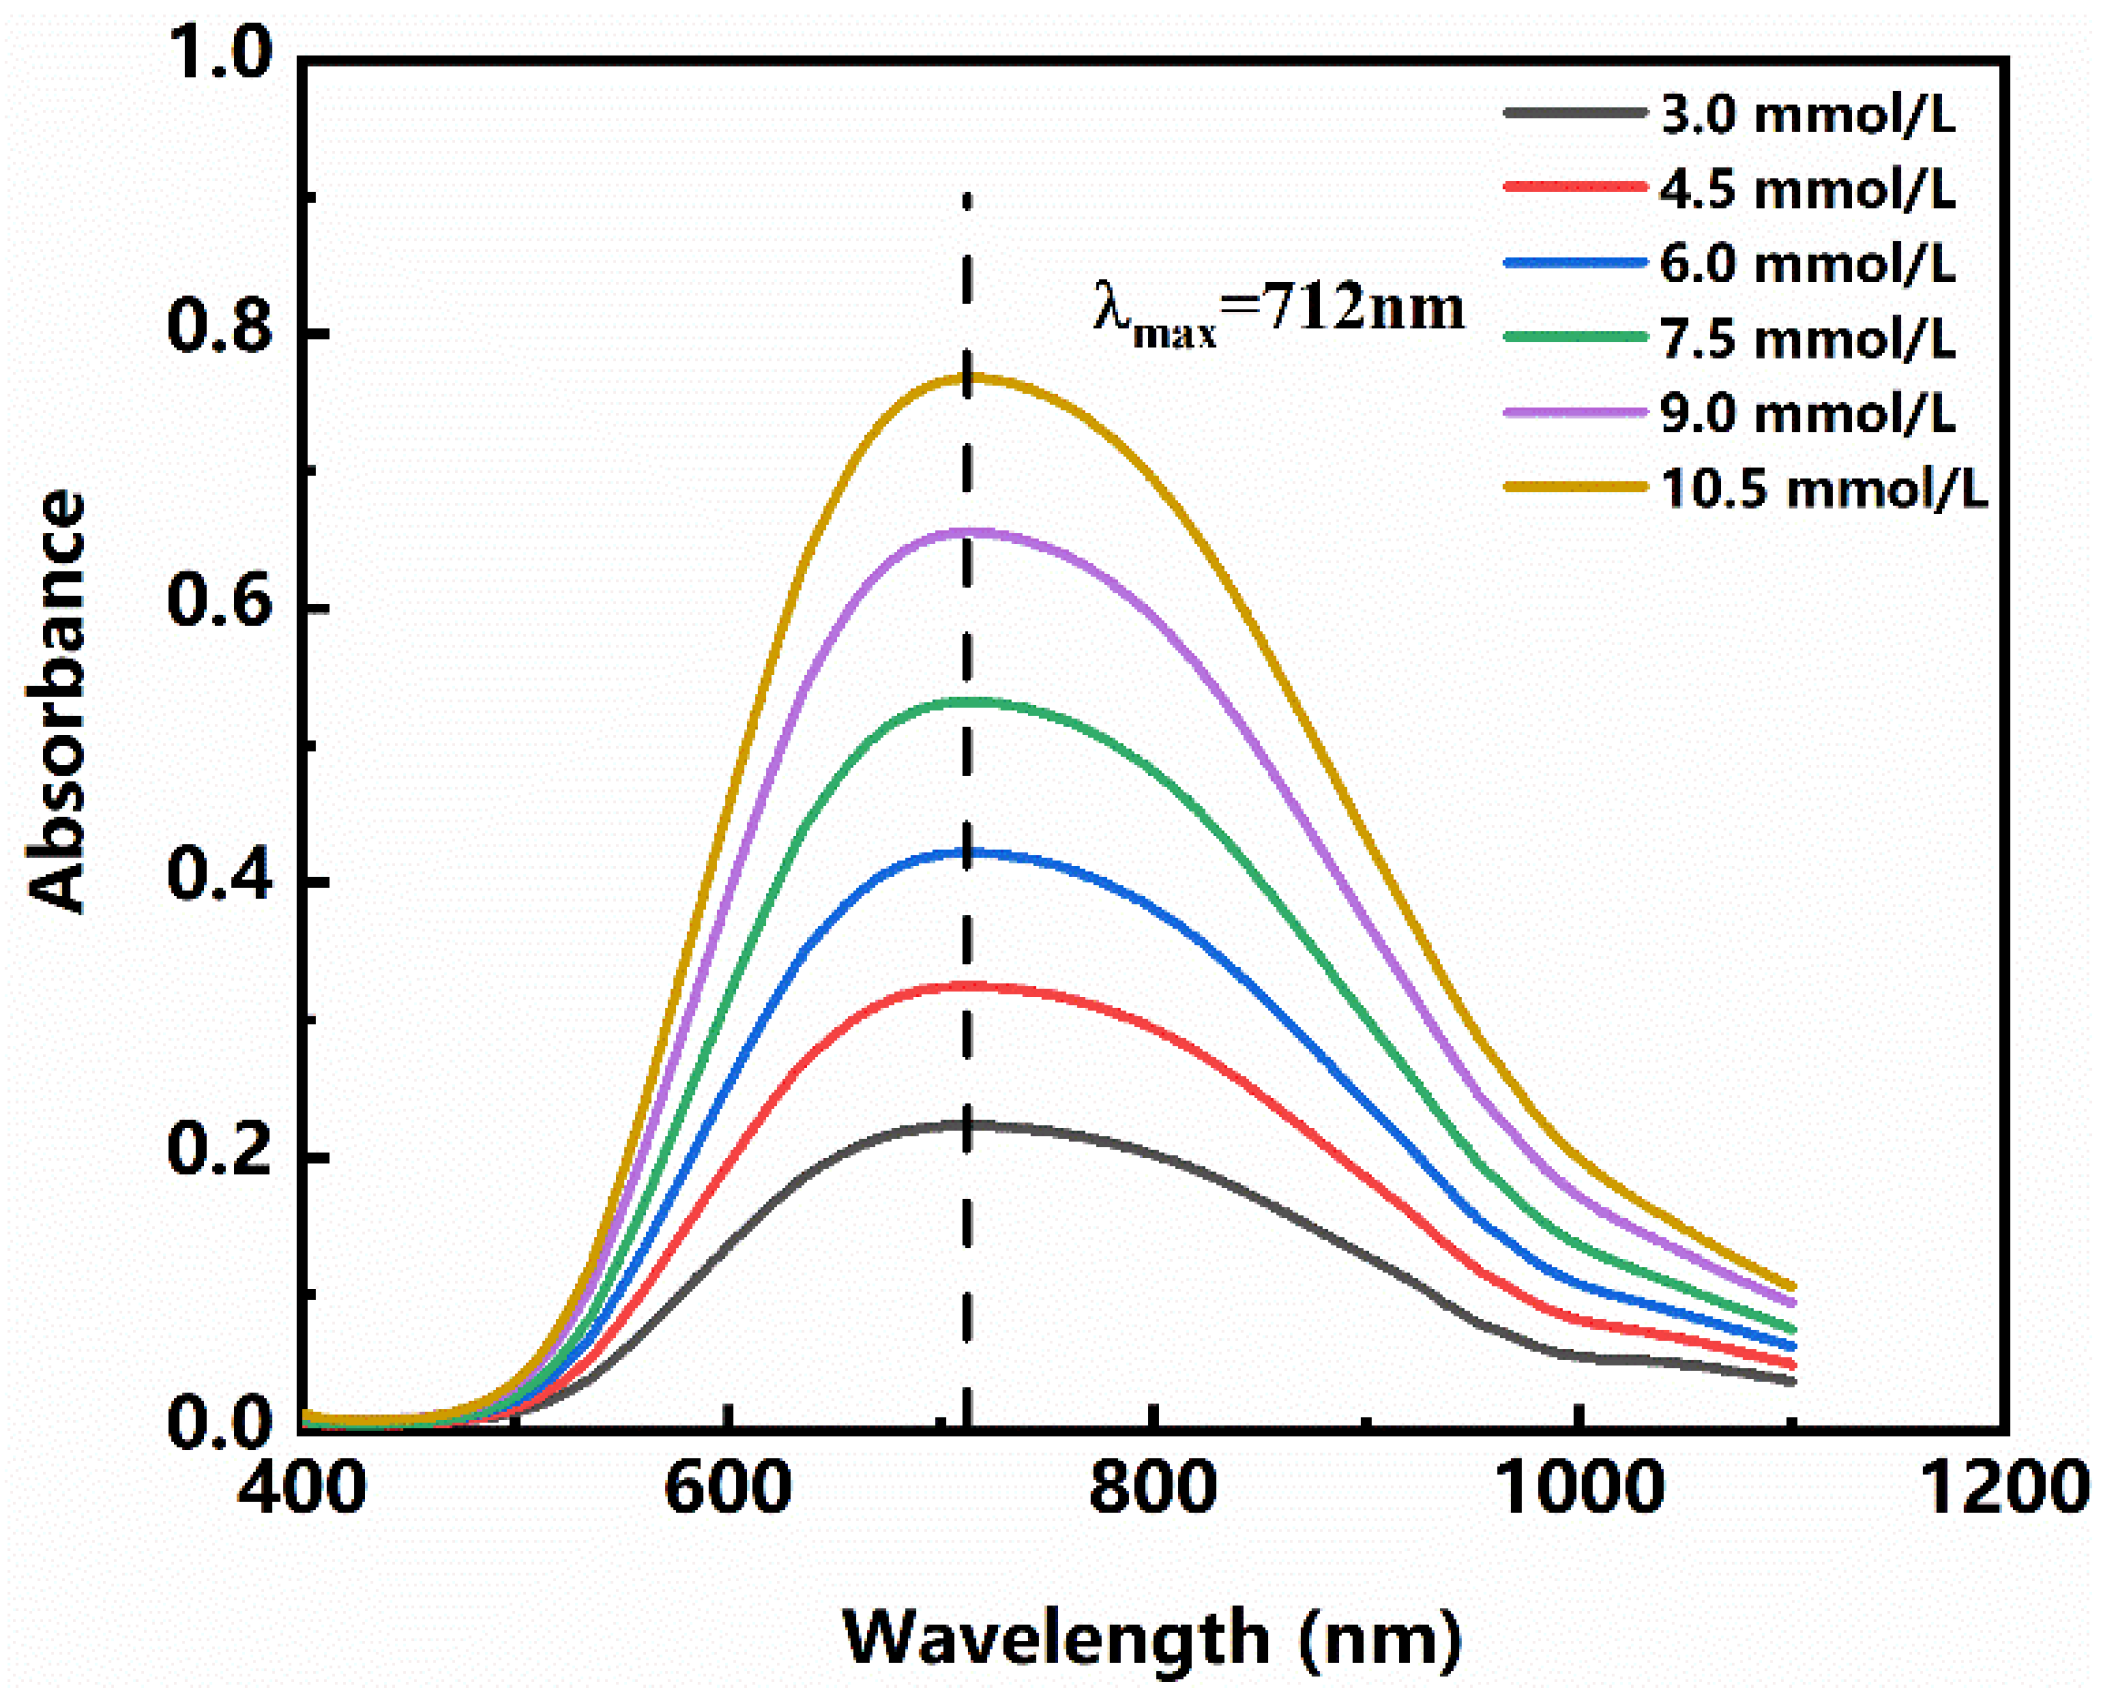
Absorption for different concentrations of Cu2+ is presented in Figure 4. It serves to show that the solution has an absorption maximum at 712 nm, which is consistent with the literature [24]. As the concentration of Cu2+ changes, the absorbance of its absorption maximum peak has a good linear relationship and conforms to the Beer–Lambert Law [25]. Therefore, 712 nm is selected as the determination wavelength in this paper.
3.3.2. Effect of Reaction Time
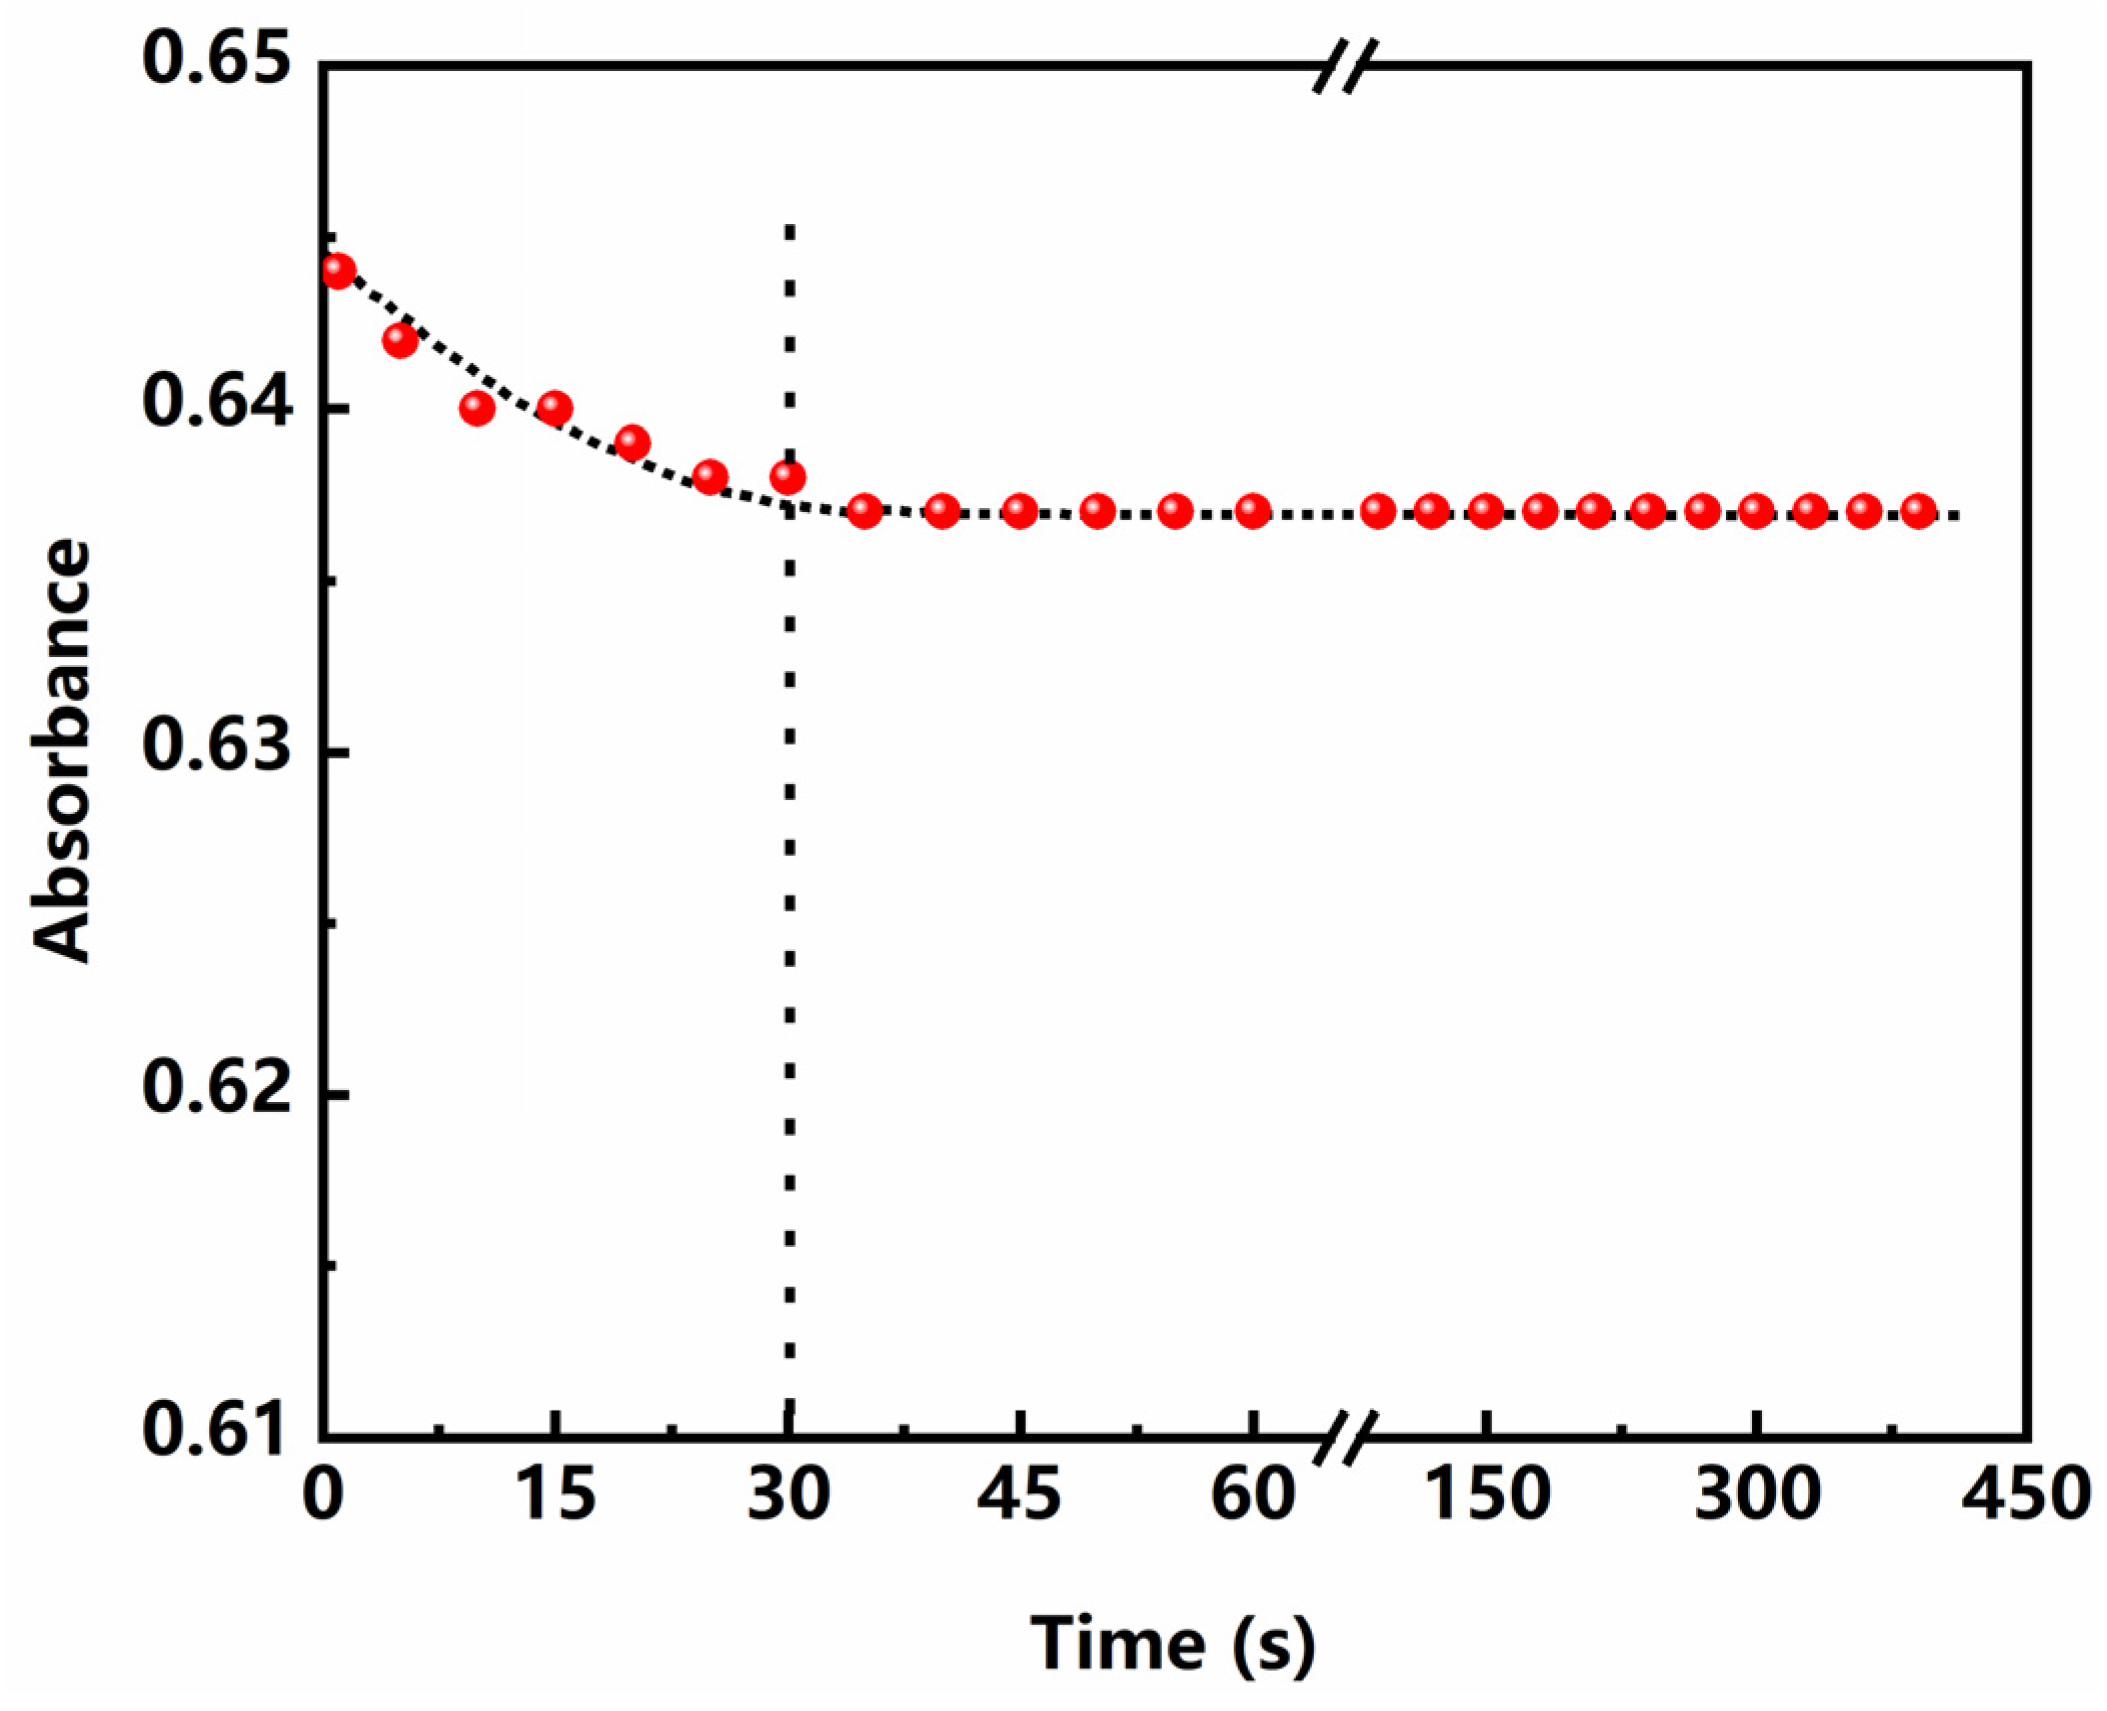
The effect of reaction time on the absorbance is shown in Figure 5. It can be seen from the figure that the absorbance of the reaction solution decreased gradually at first and then achieved equilibrium. It was observed that a minimum of 30 s was required for complete conversion of Cu2+ to basic copper carbonate. Therefore, the buffer solution was added and stayed for 30 s to determine in this experiment.
3.3.3. Effect of Reaction Temperature
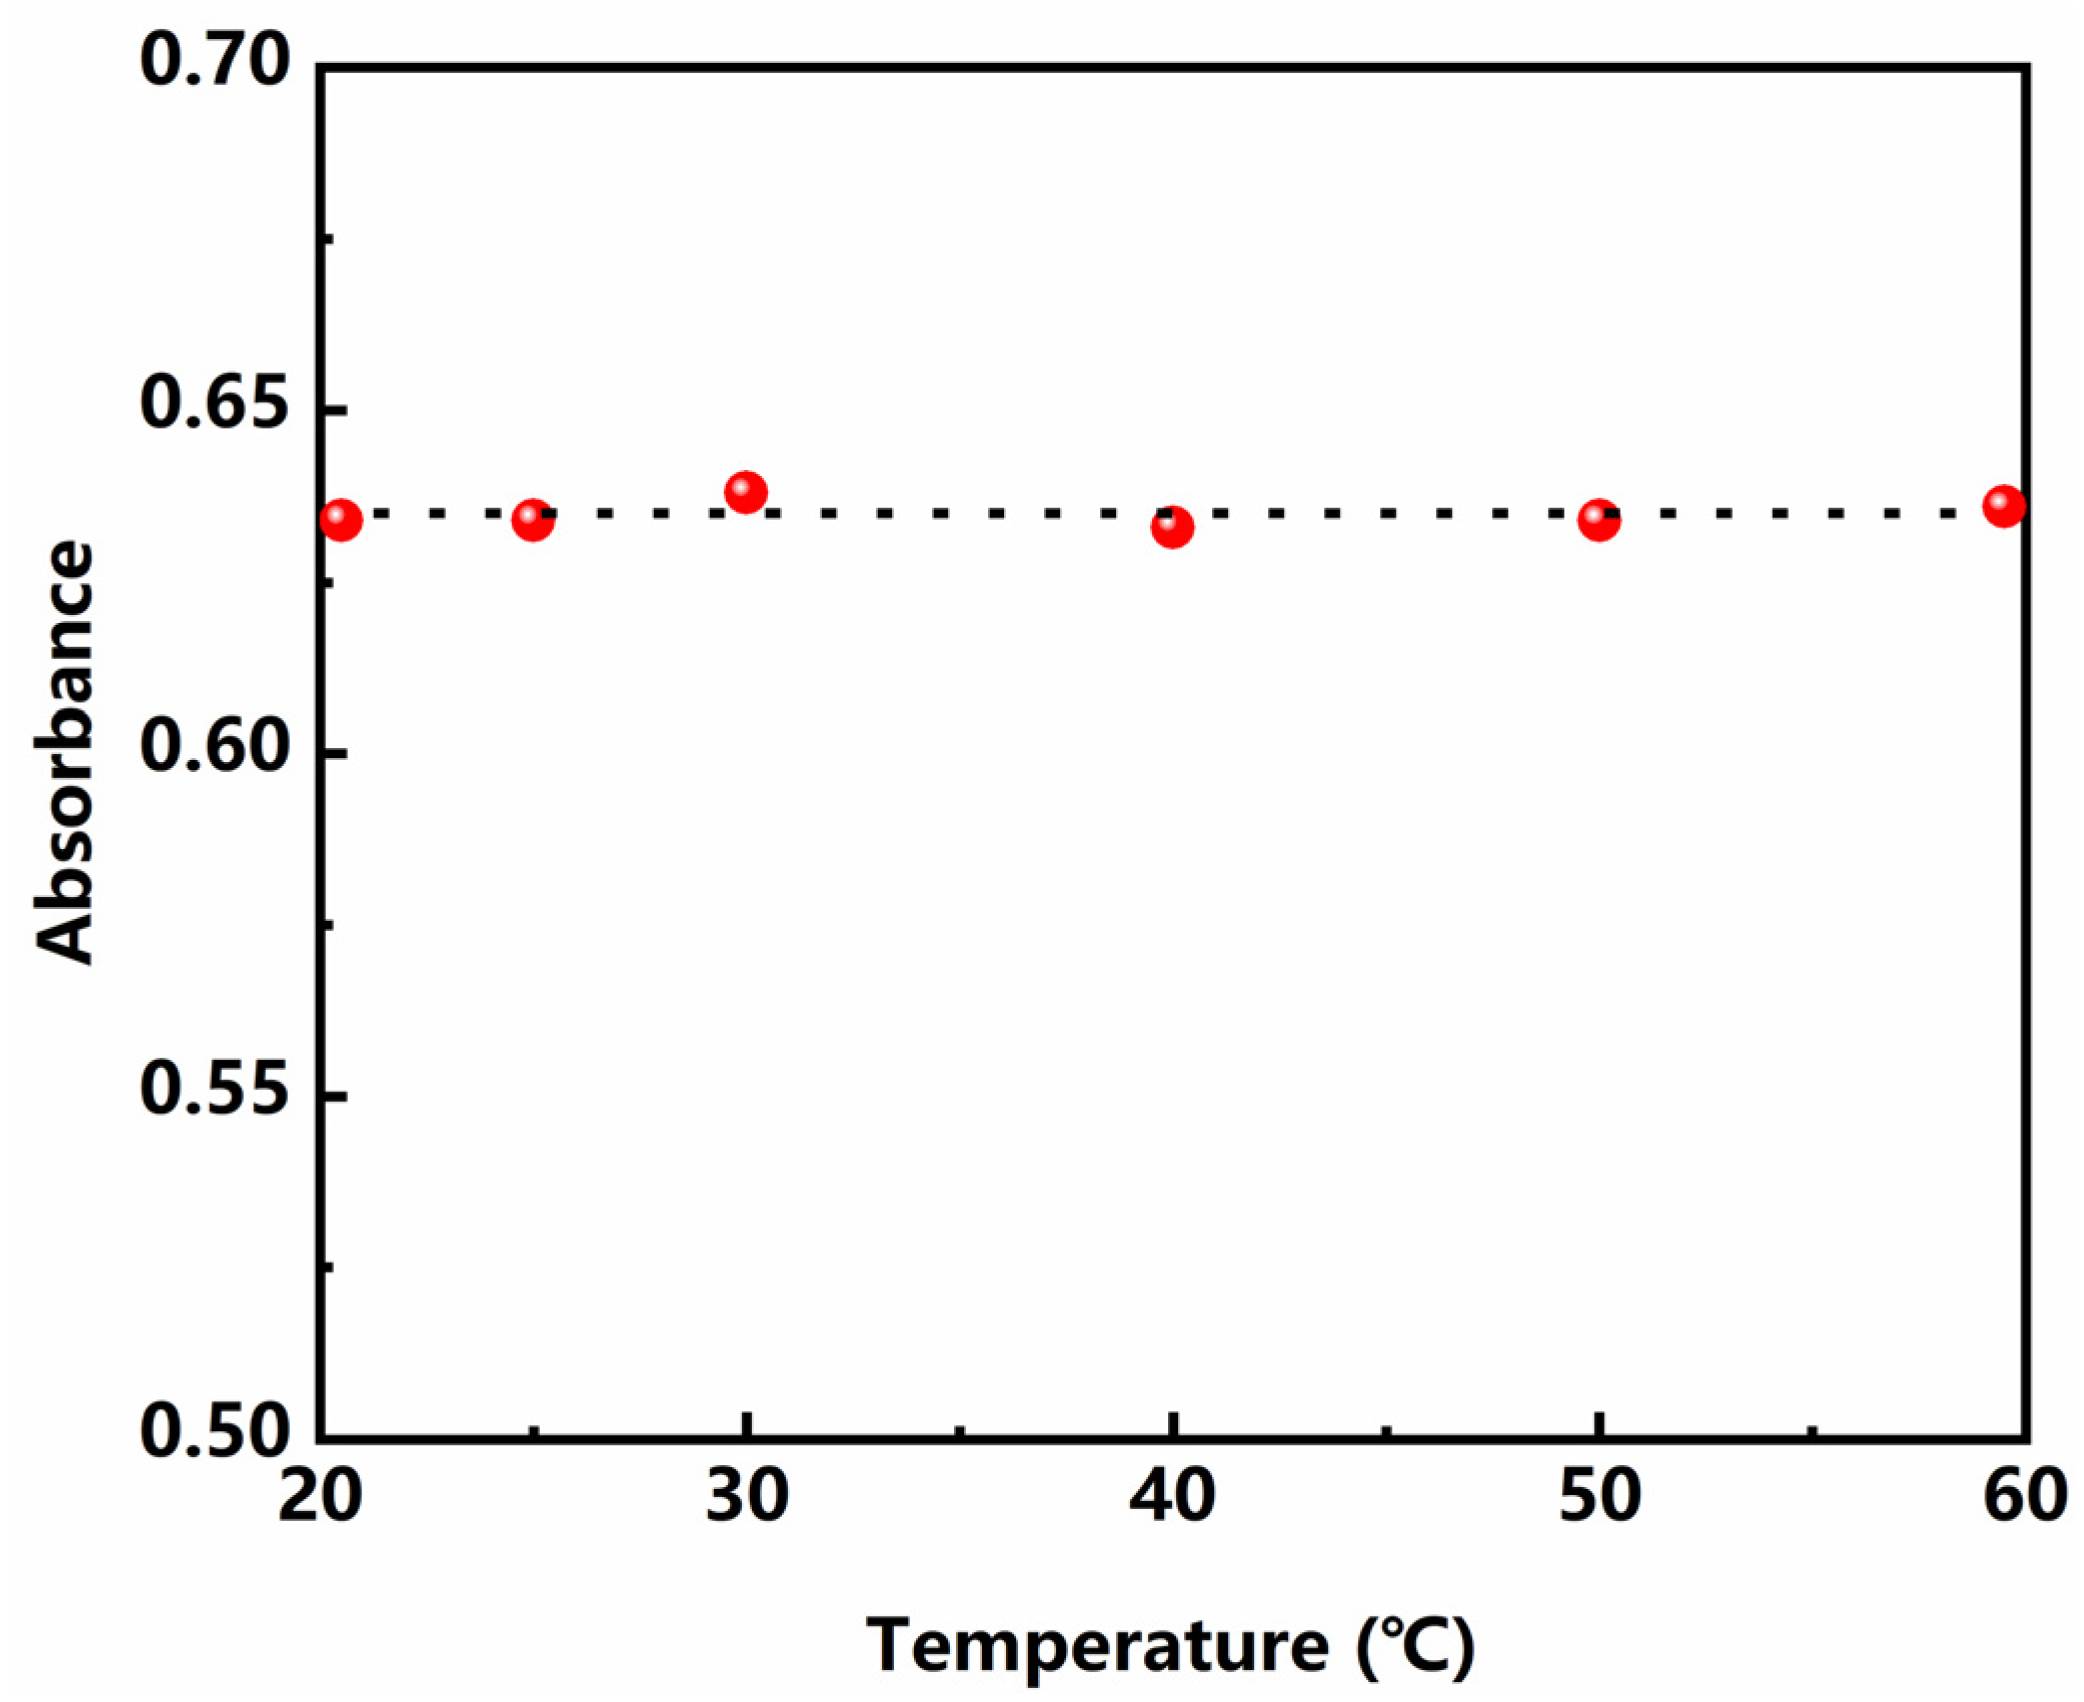
Figure 6 represents the absorbance changing with reaction temperature at 712 nm for basic copper carbonate. It can be seen that the absorbance remains stable when the reaction temperature increased from 20 to 60 °C, indicating that the reaction system has good stability. All the experiments in this study were conducted at room temperature.
3.3.4. Effect of pH
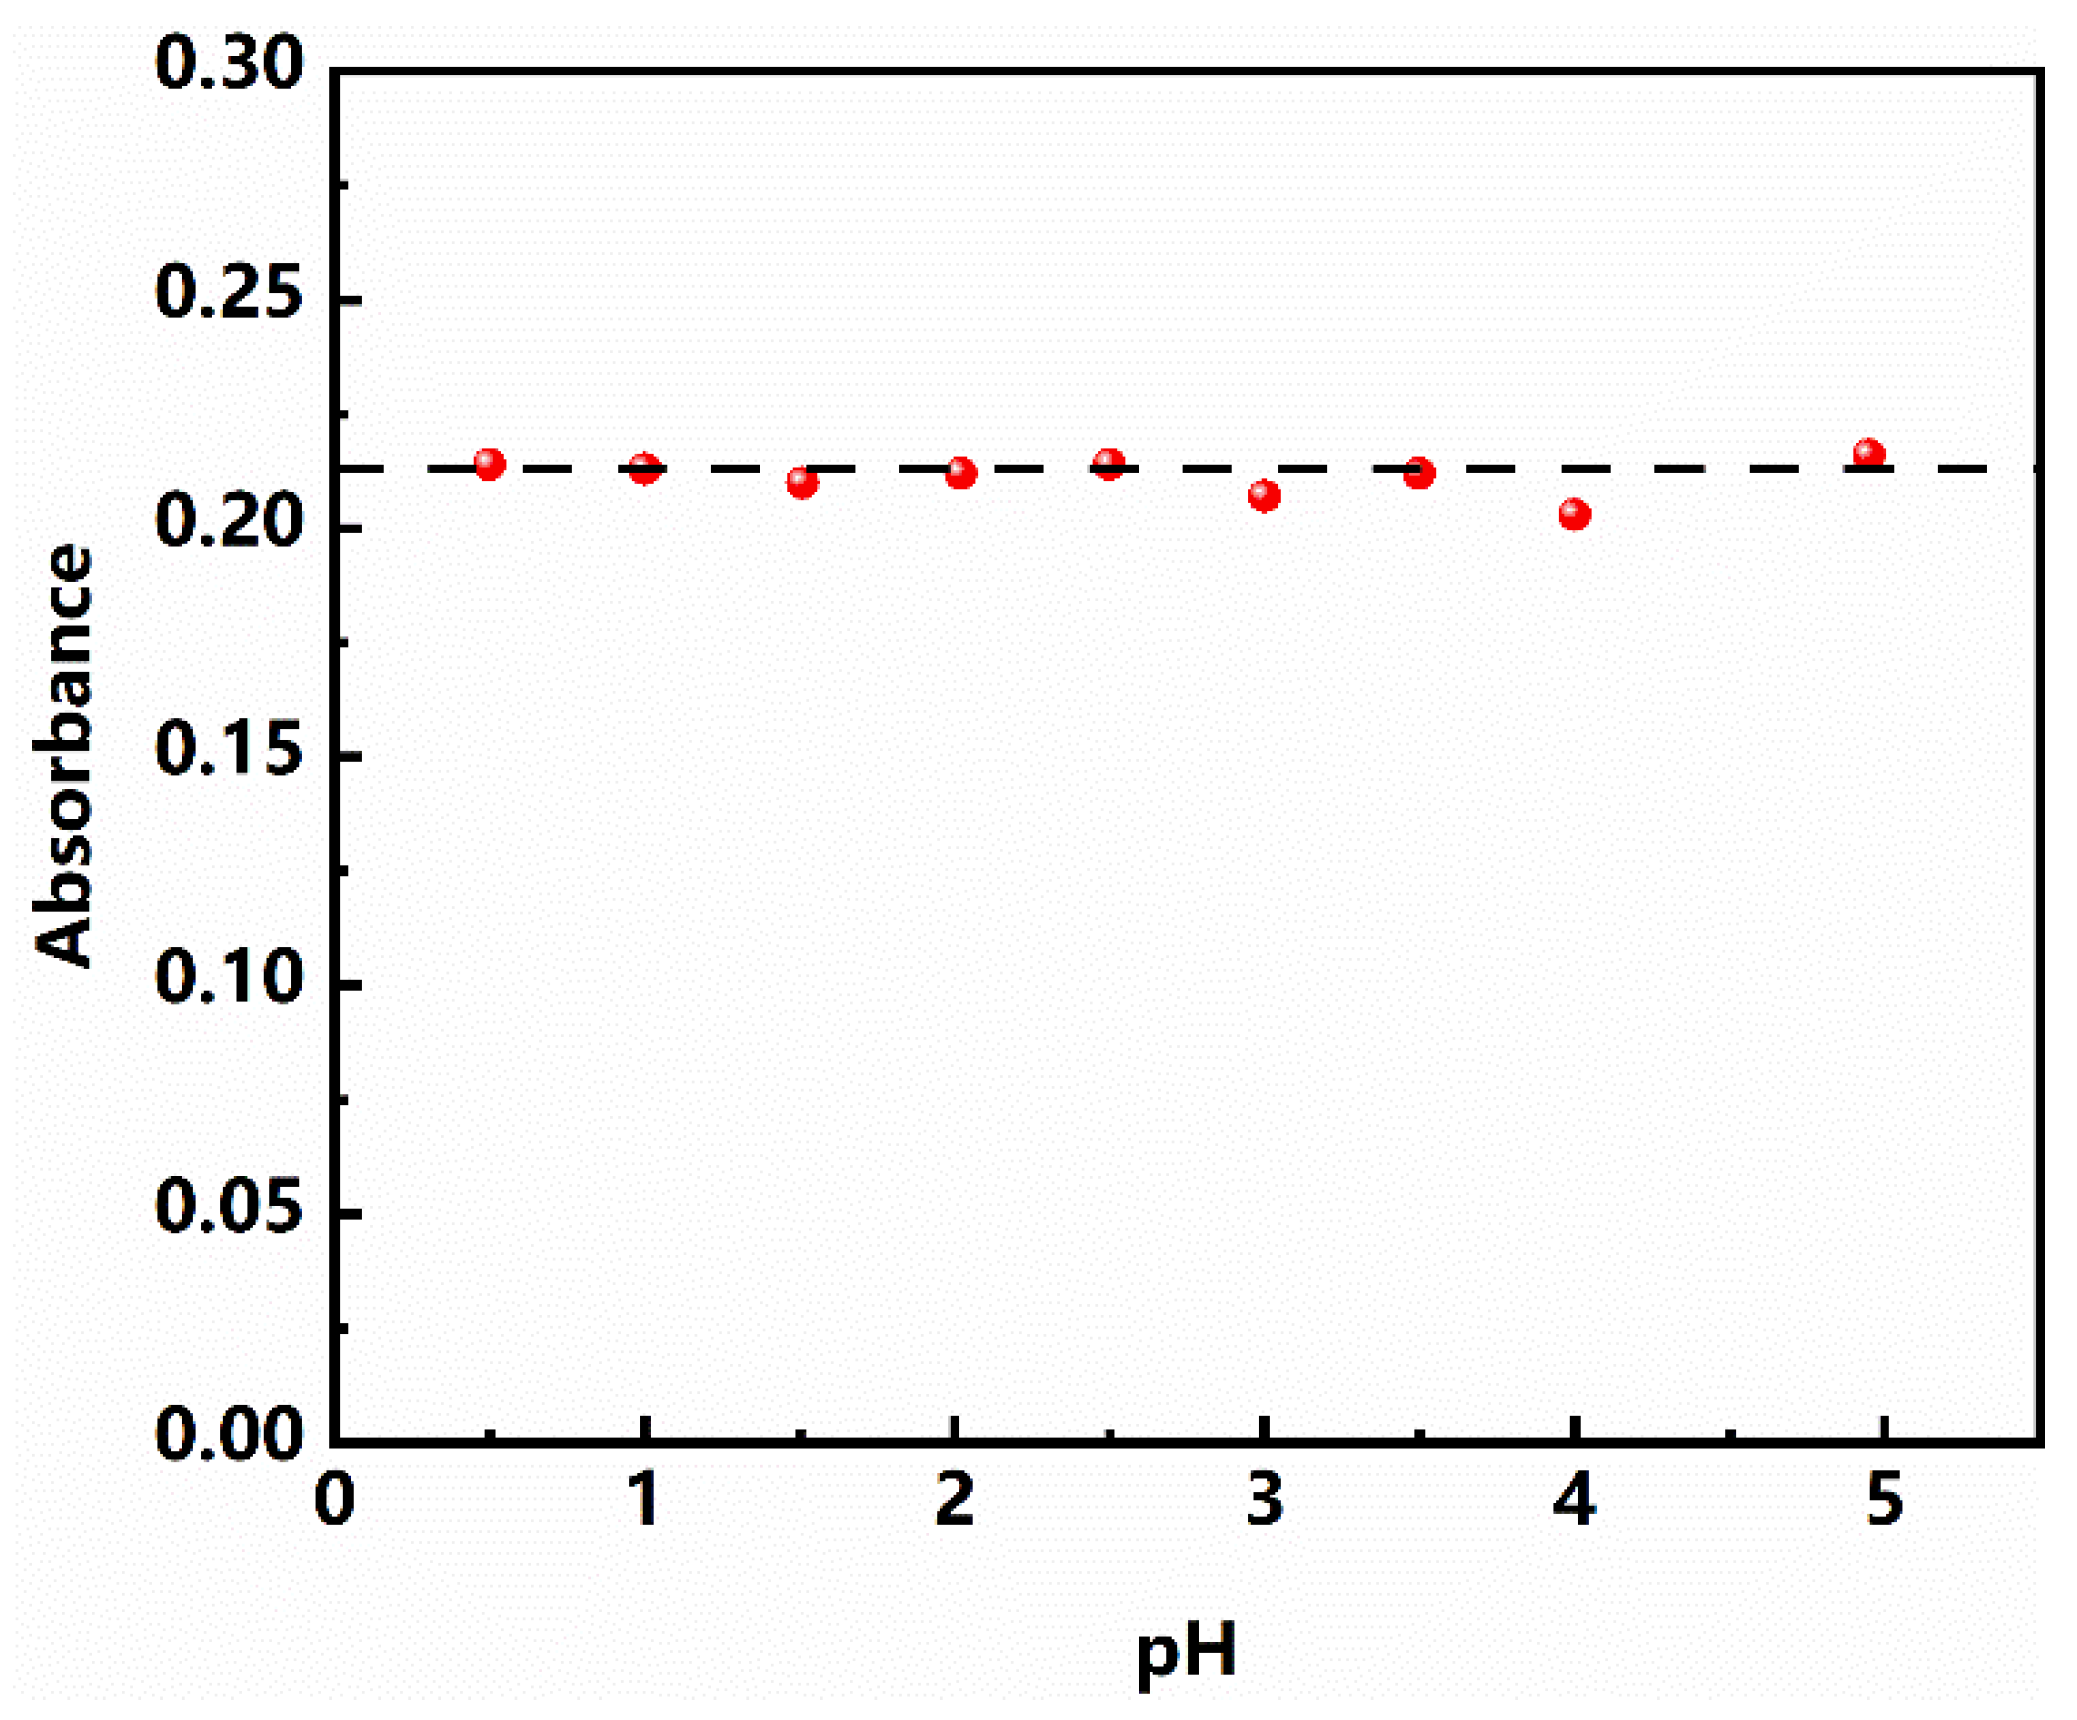
Before the determination of pectin content, the technique of “acid extraction and alcohol precipitation” is usually used to extract pectin [26,27]. Different extraction methods will lead to different degrees of acidification of the solution [28]. Therefore, the relationship between pH and absorbance in solution was investigated. The initial pH of the solution was 4.95, and hydrochloric acid was added to adjust the solution to different pH values, as shown in Figure 7. It can be seen that the absorbance of the reaction system does not change significantly under different pH conditions, which indicates that the change of pH does not affect the determination of pectin content.
3.4. Establishment of Working Curve
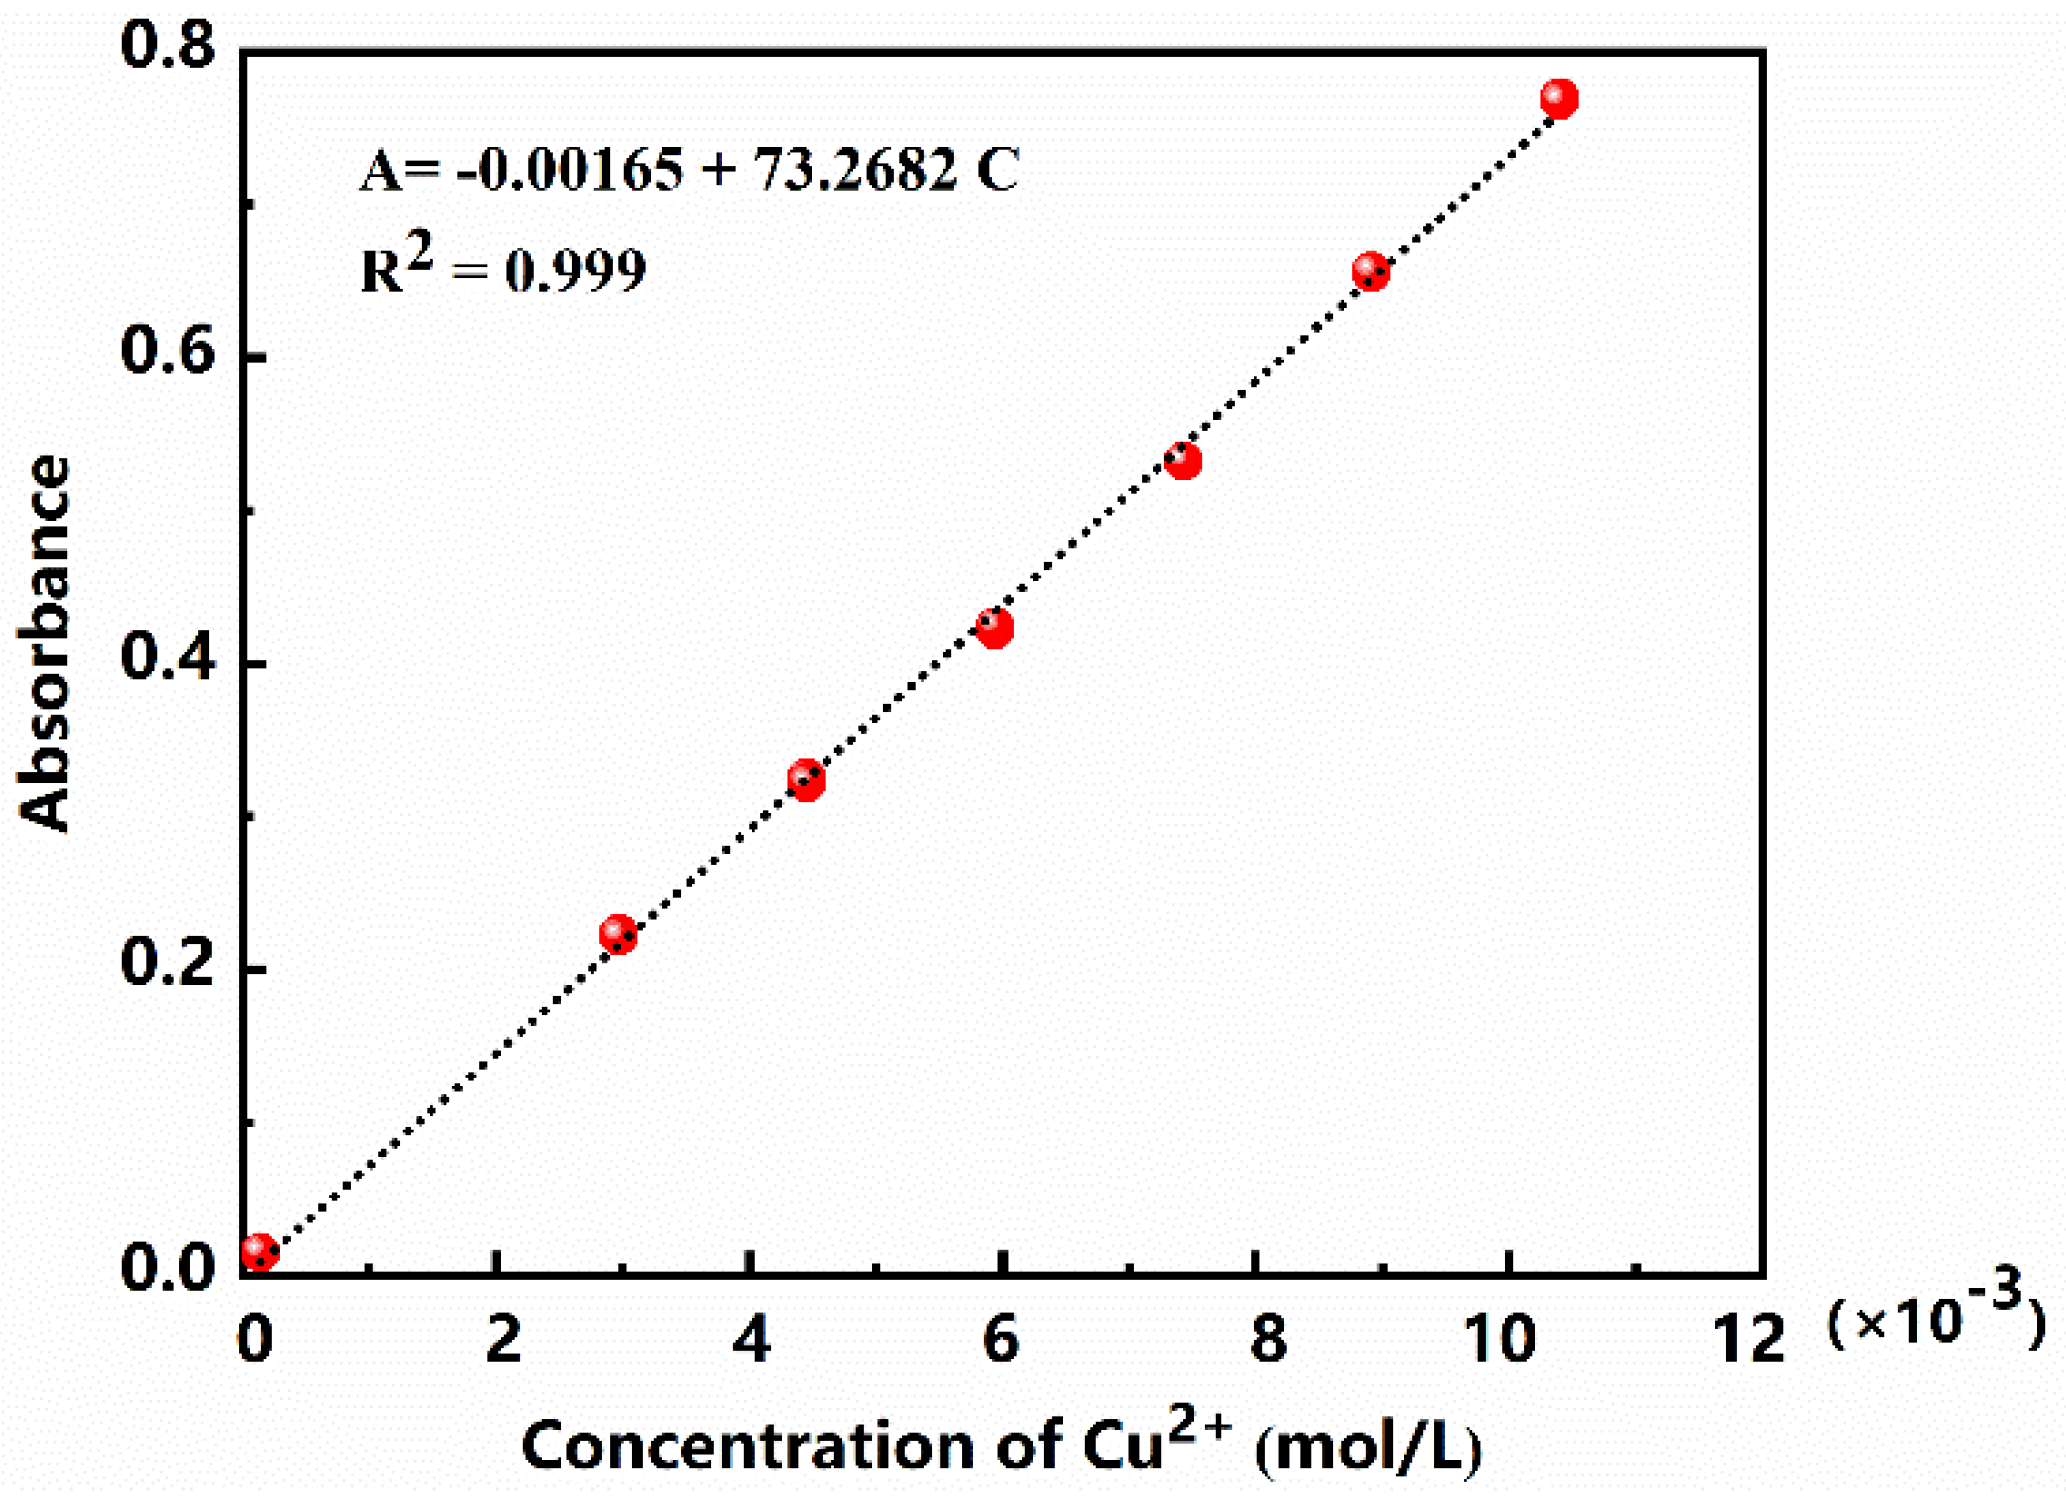
The working curve of the relationship between concentration of Cu2+ and the absorbance at 712 nm was measured and established in accordance with 2.2.3 steps. Results are shown in Figure 8. The equation of the working curve can be expressed as:
i.e.,
where C is the concentration of Cu2+ in the system (in mol/L), while A represents the absorbance of the solution at 712 nm. The limit of quantitation (LOQ) is generally evaluated by the following Equation (6) [29]. The calculated value of LOQ is 0.706 mmol by using the method that the paper referred, which is equivalent to the pectin content of 0.385 g/L.
A = −0.00165 (±0.00534) + 73.2682 (±0.778) × C, (R2 = 0.999)
A = a(Δa) + s(Δs) × C
LOQ = (a + 10|Δa|)/s
3.5. Interference
In order to explore the influence of other components in the filtrate system, four portions of filtrate in Section 2.2.1 steps were taken and different concentrations of CuCl2 standard solution were added, respectively. The Cu2+ concentration was determined according to Section 3.4 steps, and the recovery rate [9] was calculated. As is shown in Table 2, the recovery rate of the experimental samples ranged from 96.04% to 98.39%, suggesting that other components in the filtrate system have little influence on the results. That is to say, the method has good accuracy and meets the requirements of determination.
3.6. Method Calibration and Evaluation
In order to verify the accuracy and precision of this method, the repeatability of the method was analyzed, its relative standard deviation (RSD) in five measurements is 2.09%, indicating that the method has good repeatability and high precision.
Four kinds of different pectin content samples were used to verify the feasibility and reliability of this method and the results are shown in Table 3. It can be seen that the pectin content measured by this method was closed to the gravimetric method. The RSD are less than 3%, indicating that this method is reliable for pectin content determination.
3.7. Universality of the Method
In order to validate the universality of the method, copper ion colorimetry method and gravimetric method were used, respectively, to determine pectin content of several different plant sources. The bark of paper mulberry, sisal, and wikstroemia were chosen as raw materials. Results are shown in Table 4, where it can be seen that for different plant materials, copper ion colorimetry method had insignificant differences compared with the gravimetric method. The RSD between them is within 5.00% and decreased with the increase of pectin content. In conclusion, the copper ion colorimetry method has the characteristics of universality, and it can be widely used in the determination of pectin content of plant raw materials.
4. Conclusions
This paper presents a novel method for the determination of pectin content. The content of pectin was determined by UV-vis spectrophotometer after stabilization of 30 s at room temperature. Results showed that the method has a considerable measurement precision and accuracy (RSD = 2.09%). Compared with gravimetric method, the RSD of pectin content measured by them is less than 3%. In conclusion, the method is simple, accurate and repeatable. It can be widely used in the determination of pectin content, which provides a new idea for the determination of pectin content and the application of pectin.
Author Contributions
F.W.: validation, formal analysis, data curation, writing—original draft. C.D.: data curation, writing—review and editing. J.C.: formal analysis, writing—review and editing. L.S.: investigation, writing—review and editing. H.L.: conceptualization, writing—review and editing, funding acquisition. All authors have read and agreed to the published version of the manuscript.
Funding
This research was funded by Science and Technology Basic Resources Investigation Program of China (2019FY100900).
Institutional Review Board Statement
Not applicable.
Informed Consent Statement
Not applicable.
Data Availability Statement
Not applicable.
Conflicts of Interest
The authors declare no conflict of interest.
References
- Chaiwarit, T.; Masavang, S.; Mahe, J.; Sommano, S.; Jantrawut, P. Mango (cv. Nam Dokmai) peel as a source of pectin and its potential use as a film-forming polymer. Food Hydrocoll. 2019, 102, 105611. [Google Scholar] [CrossRef]
- Dranca, F.; Oroian, M. Extraction, purification and characterization of pectin from alternative sources with potential technological applications. Food Res. Int. 2018, 113, 327–350. [Google Scholar] [CrossRef]
- Wang, R.-S.; Li, Y.; Shuai, X.-X.; Liang, R.-H.; Chen, J.; Liu, C.-M. Pectin/activated carbon-based porous microsphere for Pb2+ adsorption: Characterization and adsorption behaviour. Polymers 2021, 13, 2453. [Google Scholar] [CrossRef]
- Hari, K.D.; Garcia, C.V.; Shin, G.-H.; Kim, J.-T. Improvement of the UV barrier and antibacterial properties of crosslinked pectin/zinc oxide bionanocomposite films. Polymers 2021, 13, 2403. [Google Scholar] [CrossRef]
- Xie, M.; Li, J.; Nie, S. Research and Application progress of pectin. Chin. J. Food Sci. 2013, 13, 1–14. [Google Scholar]
- Dordevic, D.; Jancikova, S.; Capikova, J.; Tremlova, B.; Kushkevych, I. Chemical and sensory properties of fruit jams affected by bamboo fiber fortification. Biointerface Res. Appl. Chem. 2020, 10, 5247–5251. [Google Scholar] [CrossRef]
- Badaro, A.T.; Garcia-Martin, J.F.; Lopez-Barrera, M.D.C.; Barbin, D.F.; Alvarez-Mateos, P. Determination of pectin content in orange peels by near infrared hyperspectral imaging. Food Chem. 2020, 323, 126861. [Google Scholar] [CrossRef]
- Zhang, X.; Liu, C.; Yang, L. Research status of pectin content determination method. Appl. Chem. 2015, 4, 729–731. [Google Scholar]
- Dong, D.; Zhang, X.; Yao, X.; Huang, Y.; Lin, C. Determination of sisal pectin content by carbazole colorimetric method. Food Res. Dev. 2010, 31, 138–140. [Google Scholar]
- Buranaosot, J.; Soonthornchareonnon, N.; Chaidedgumjorn, A.; Hosoyama, S.; Toida, T. Determination of galacturonic acid from pomelo pectin in term of galactose by HPAEC with fluorescence detection. Carbohydr. Polym. 2010, 81, 461–465. [Google Scholar] [CrossRef]
- Coetzee, B.; Schols, H.A.; Wolfaardt, F. Determination of pectin content of eucalyptus wood. Holzforschung 2011, 65, 327–331. [Google Scholar] [CrossRef] [Green Version]
- Kumar, V.; Nagar, S. Studies on Tinospora cordifolia monosugars and correlation analysis of uronic acids by spectrophotometric methods and GLC. Carbohydr. Polym. 2014, 99, 291–296. [Google Scholar] [CrossRef]
- Xuan, Z. Extraction of Pomelo Peel Pectin and Preparation and Properties of Its Composite; DongHua University: Shanghai, China, 2019. [Google Scholar]
- Garna, H.; Emaga, T.H.; Robert, C.; Paquot, M. New method for the purification of electrically charged polysaccharides. Food Hydrocoll. 2011, 25, 1219–1226. [Google Scholar] [CrossRef]
- Paper Raw Materials—Determination of Pectin Content; GB/T 10742-2008; General Administration of Quality Supervision, Inspection and Quarantine of the People’s Republic of China Standardization Administration of China: Beijing, China, 2008; p. 8.
- Xiaoxia, L. Extraction and Characterization of Pectic Polysaccharides from Okra Flower. Master’s Thesis, Zhejiang University, Hangzhou, China, 2014. [Google Scholar]
- Liew, S.Q.; Ngoh, G.C.; Yusoff, R.; Teoh, W.H. Sequential ultrasound-microwave assisted acid extraction (UMAE) of pectin from pomelo peels. Int. J. Biol. Macromol. 2016, 93, 426–435. [Google Scholar] [CrossRef]
- He, T.; Xu, X.; Yang, J.; Zhang, B. Determination of calcium content in crude oil by spectrophotometric method. J. East China Univ. Sci. 2010, 36, 406–410. [Google Scholar] [CrossRef]
- Zhao, H.L.; Cheng, X.; Chang, J. Spectrophotometric determination of the Ca Ion content in steel slag by using chlorophosphonazo as the spectral chromogenic reagent. Adv. Mater. Res. 2011, 306–307, 989–993. [Google Scholar] [CrossRef]
- Tian, X.; Tang, X. Determination of calcium in calcium preparations. Technol. Dev. Chem. Ind. 2011, 40, 19–21. [Google Scholar]
- Chai, X.S.; Zhang, D.C.; Hou, Q.X.; Yoon, S.H. Spectrophotometric determination of reducing aldehyde groups in bleached chemical pulps. J. Ind. Eng. Chem. 2007, 13, 597–601. [Google Scholar]
- Carré, M.H.; Haynes, D. The estimation of pectin as calcium pectate and the application of this method to the determination of the soluble pectin in apples. Biochem. J. 1922, 16, 60–69. [Google Scholar] [CrossRef] [Green Version]
- Guofu, W.; Zhenming, C.; Rong, G.; Huiying, T. Study on pretreatment method of pectin raw material (lemon peel). Food Ind. Sci. Technol. 2006, 2, 78–79. [Google Scholar]
- Long, J.; Gong, H.; Zhang, D.Z.; Liu, M.R.; Li, H.L. Determination of carboxyl groups in pulp via ultraviolet spectrophotometry. Bioresources 2018, 13, 2670–2677. [Google Scholar] [CrossRef]
- Mau, A.; Noirbent, G.; Dietlin, C.; Graff, B.; Gigmes, D.; Dumur, F.; Lalevée, J. Panchromatic copper complexes for visible light photopolymerization. Photochem 2021, 1, 167–189. [Google Scholar] [CrossRef]
- Begum, R.; Aziz, M.G.; Uddin, M.B.; Yusof, Y.A. Characterization of jackfruit (artocarpus heterophyllus) waste pectin as influenced by various extraction conditions. Agric. Agric. Sci. Procedia 2014, 2, 244–251. [Google Scholar] [CrossRef] [Green Version]
- Chan, S.Y.; Choo, W.S. Effect of extraction conditions on the yield and chemical properties of pectin from cocoa husks. Food Chem. 2013, 141, 3752–3758. [Google Scholar] [CrossRef]
- Adetunji, L.R.; Valérie-Orsat, A.A.; Raghavan, V. Advances in the pectin production process using novel extraction techniques: A review. Food Hydrocoll. 2017, 62, 239–250. [Google Scholar] [CrossRef]
- Gonzalez, A.G.; Herrador, M.A. A practical guide to analytical method validation, including measurement uncertainty and accuracy profiles. TrAC Trends Anal. Chem. 2007, 26, 227–238. [Google Scholar] [CrossRef]
Figure 1.
FT-IR spectra of different pectin types.

Figure 2.
Absorption spectra for Cu2+ in water and in buffer solution.

Figure 3.
Mechanism of pectin content determination by copper ion colorimetry.

Figure 4.
Absorption spectra of Cu2+ with different concentrations in buffer solution.

Figure 5.
Effect of reaction time on the absorbance.

Figure 6.
Effect of temperature on the absorbance.

Figure 7.
Effect of pH on the absorbance.

Figure 8.
Working curve of Cu2+.


Table 1.
DE of different pectin types.
| Samples | DE (%) |
|---|---|
| Commercial | 40.35 |
| Sisal | 57.37 |
| Bark of paper mulberry | 44.06 |
| Wikstroemia | 35.81 |
Table 2.
Recovery rate of Cu2+.
| Samples | Original Measurements (µmol) | Addition(µmol) | Measurements After Addition(µmol) | Recovery Rate(%) |
|---|---|---|---|---|
| 1 | 44.2 | 14.9 | 58.7 | 97.22 |
| 2 | 41.9 | 22.3 | 63.3 | 96.04 |
| 3 | 42.0 | 44.7 | 86.0 | 98.39 |
| 4 | 37.3 | 29.8 | 66.2 | 97.22 |
Table 3.
Comparison of copper ion colorimetry method and gravimetric method.
| Samples | Gravimetric Method (g) | Copper Ion Colorimetry Method (g) | RSD (%) |
|---|---|---|---|
| 1 | 0.6233 | 0.6463 | 2.60 |
| 2 | 0.9613 | 0.9763 | 1.10 |
| 3 | 4.6193 | 4.6102 | 0.14 |
| 4 | 4.9617 | 4.9399 | 0.31 |
Table 4.
Comparison of copper ion colorimetry method and gravimetric method for different pectin types.
Table 4.
Comparison of copper ion colorimetry method and gravimetric method for different pectin types.
| Samples | Gravimetric Method (g) | Copper Ion Colorimetry Method (g) | RSD (%) |
|---|---|---|---|
| Bark of paper mulberry-1 | 1.1204 | 1.0679 | 3.40 |
| Bark of paper mulberry-2 | 1.3354 | 1.4033 | 3.51 |
| Sisal-1 | 0.4920 | 0.4590 | 4.90 |
| Sisal-2 | 0.5528 | 0.5278 | 3.28 |
| Wikstroemia-1 | 2.4874 | 2.5103 | 0.65 |
| Wikstroemia-2 | 3.7498 | 3.7156 | 0.65 |
Publisher’s Note: MDPI stays neutral with regard to jurisdictional claims in published maps and institutional affiliations. |
© 2021 by the authors. Licensee MDPI, Basel, Switzerland. This article is an open access article distributed under the terms and conditions of the Creative Commons Attribution (CC BY) license (https://creativecommons.org/licenses/by/4.0/).
Share and Cite
MDPI and ACS Style
Wang, F.; Du, C.; Chen, J.; Shi, L.; Li, H. A New Method for Determination of Pectin Content Using Spectrophotometry. Polymers 2021, 13, 2847. https://doi.org/10.3390/polym13172847
AMA Style
Wang F, Du C, Chen J, Shi L, Li H. A New Method for Determination of Pectin Content Using Spectrophotometry. Polymers. 2021; 13(17):2847. https://doi.org/10.3390/polym13172847
Chicago/Turabian StyleWang, Furong, Chao Du, Junjun Chen, Lisheng Shi, and Hailong Li. 2021. "A New Method for Determination of Pectin Content Using Spectrophotometry" Polymers 13, no. 17: 2847. https://doi.org/10.3390/polym13172847
Note that from the first issue of 2016, this journal uses article numbers instead of page numbers. See further details here.