Synthesis and Research of Rare Earth Nanocrystal Luminescent Properties for Security Labels Using the Electrohydrodynamic Printing Technique

 ,
,
Abstract
:1. Introduction
2. Experimental
2.1. Material
2.2. Synthesis of YVO4:Eu3+ Nanoparticles
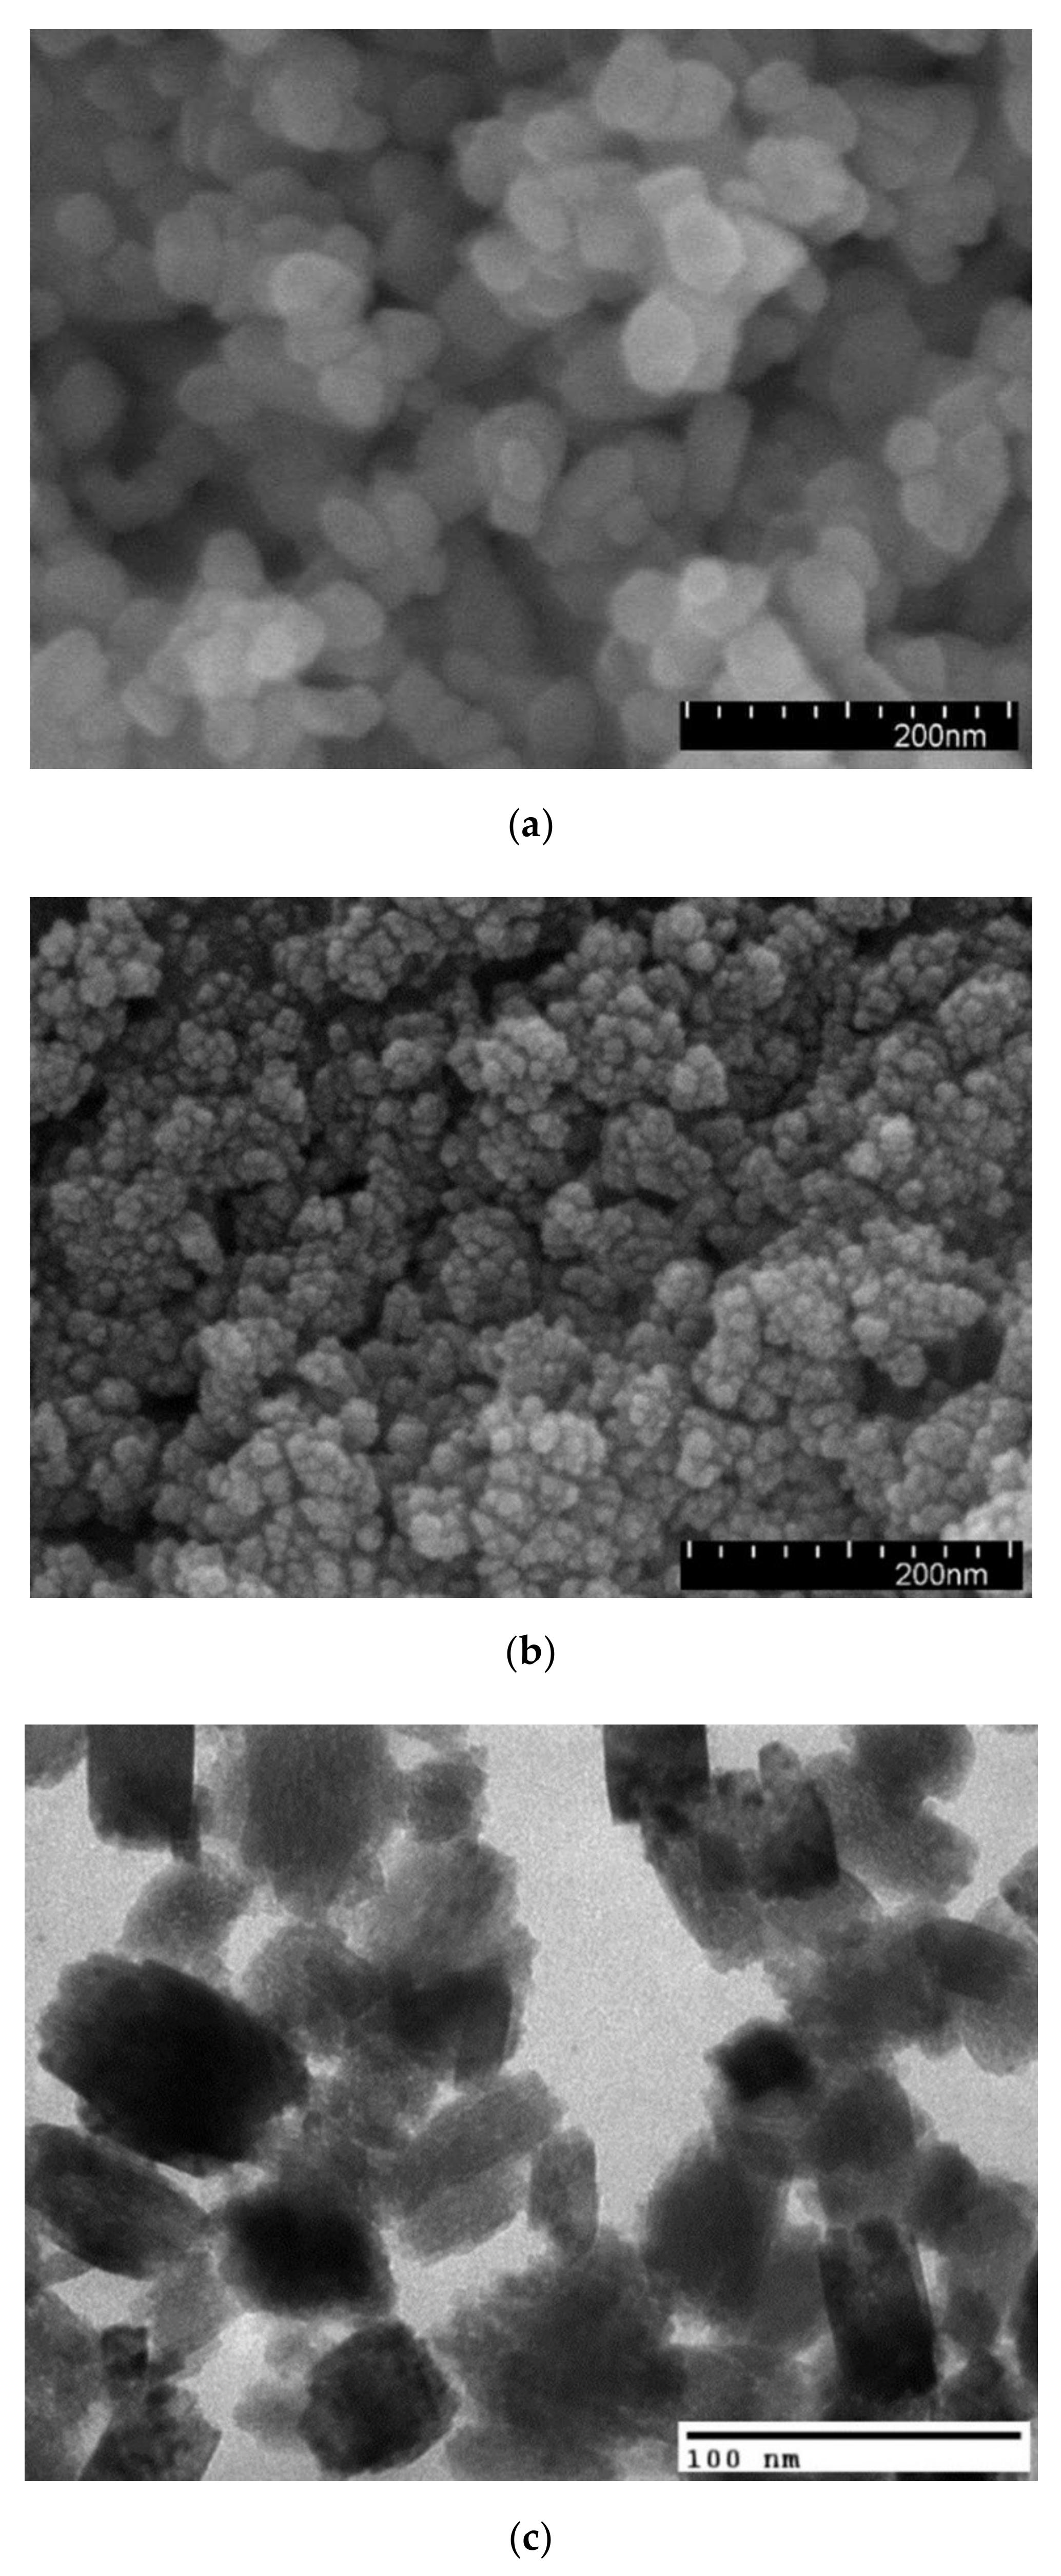
- The sonochemical method: The mixture was ultrasonicated in 10 min, at a frequency of 20 kHz (Ultrasonic Liquid Processors VCX 750) made by Sonics & Materials (Newtown, CT, USA).
- The hydrothermal method: The mixture was poured in Teflon sealed tightly and placed in the autoclave oven at 200 °C for one hour.
2.3. Preparation of Security Inkjet Ink
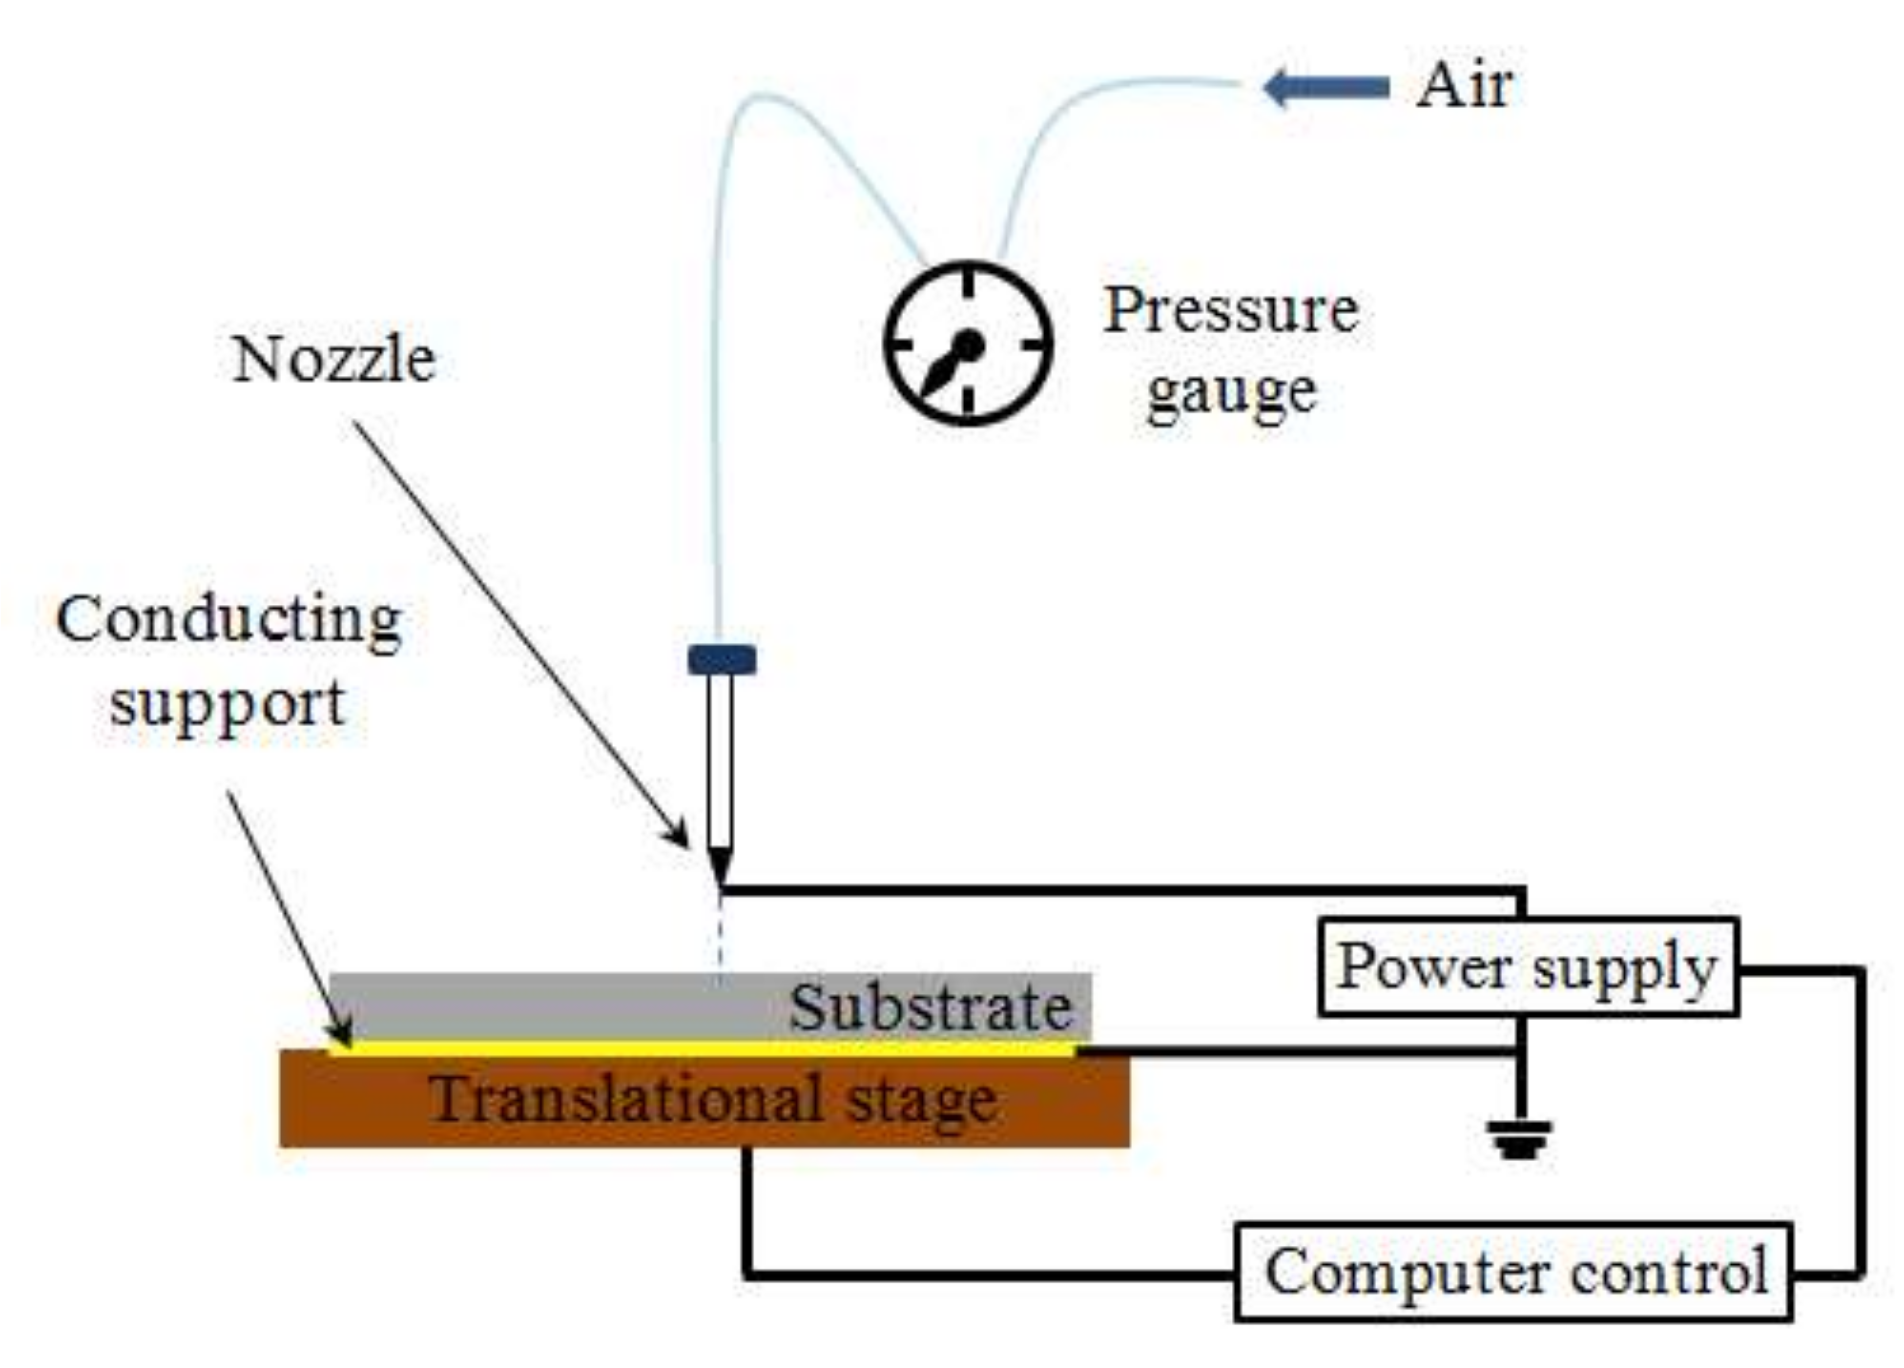
2.4. Security Printing
2.5. Characterization
3. Results and Discussion
4. Conclusions
Author Contributions
Funding
Acknowledgments
Conflicts of Interest
References
- Bidoki, M.S.; Lewis, M.D.; Clark, M. Ink-jet fabrication of electronic components. J. Micromech. Microeng. 2007, 17, 967–974. [Google Scholar] [CrossRef]
- Park, K.B.; Kim, D.; Jeong, S. Direct writing of copper conductive patterns by ink-jet printing. Thin Solid Film. 2007, 515, 7706–7711. [Google Scholar] [CrossRef]
- Apilux, A.; Ukita, Y.; Chikae, M.; Chailapakul, O.; Takamura, Y. Development of automated paper-based devices for sequential multistep sandwich enzyme-linked immunosorbent assays using inkjet printing. Lab Chip 2013, 13, 126–135. [Google Scholar] [CrossRef] [PubMed]
- Dang, M.C.; Dang, T.M.D.; Fribourg-Blanc, E. Inkjet printing technology and conductive inks synthesis for microfabrication techniques. Adv. Nat. Sci. 2013, 4, 15009–15016. [Google Scholar] [CrossRef]
- Meruga, M.J.; Cross, M.W.; May, S.P.; Luu, A.Q.; Crawford, A.G.; Kellar, J.J. Security printing of covert quick response codes using upconverting nanoparticle inks. Nanotechnology 2012, 23, 395201–395210. [Google Scholar] [CrossRef] [PubMed]
- Gupta, K.B.; Haranath, D.; Saini, S.; Singh, N.V.; Shanker, V. Synthesis and characterization of ultra-fine Y2O3: Eu3+ nanophosphors for luminescent security ink applications. Nanotechnology 2010, 21, 055607–055615. [Google Scholar] [CrossRef]
- Georgescu, S.; Cotoi, E.; Voiculescu, M.A.; Toma, O. Effects of particle size on the luminescence of YVO4:Eu nanocrystals. Rom. Rep. Phys. 2008, 60, 947–955. [Google Scholar]
- Shao, B.; Zhao, Q.; Guo, N.; Jia, Y.; Lv, W.; Jiao, M.; Lü, W.; You, H. Monodisperse YVO4:Eu3+ submicrocrystals: Controlled synthesis and luminescence properties. CrystEngComm 2013, 15, 5776–5783. [Google Scholar] [CrossRef]
- Bao, A.; Lai, H.; Yang, Y.; Liu, Z.; Tao, C.; Yang, H. Luminescent properties of YVO4:Eu/SiO2 core–shell composite particles. J. Nanopart. Res. 2010, 12, 635–643. [Google Scholar] [CrossRef]
- He, F.; Yang, P.; Niu, N.; Wang, W.; Gai, S.; Wang, D.; Lin, J. Hydrothermal synthesis and luminescent properties of YVO4: Ln3+ (Ln = Eu, Dy, and Sm) microspheres. J. Colloid Interface Sci. 2010, 343, 71–78. [Google Scholar] [CrossRef]
- Riwotzki, K.; Haase, M. Wet-chemical synthesis of doped colloidal nanoparticles: YVO4:Ln (Ln = Eu, Sm, Dy). J. Phys. Chem. B 1998, 102, 10129–10135. [Google Scholar] [CrossRef]
- Wang, H.H.; Odawara, O.; Wada, H. Facile and chemically pure preparation of YVO4:Eu3+ colloid with novel nanostructure via laser ablation in water. Sci. Rep. 2016, 6, 20507–20515. [Google Scholar] [CrossRef] [PubMed] [Green Version]
- Georgescu, S.; Cotoi, E.; Voiculescu, M.A.; Toma, O.; Matei, C. Reflectance spectra of YVO4: Eu3+ phosphors synthesized by direct precipitation. Rom. J. Phys. 2010, 55, 750–757. [Google Scholar]
- Zhang, Y.; Xu, J.; Cui, Q.; Yang, B. Eu3+-doped Bi4Si3O12 red phosphor for solid state lighting: Microwave synthesis, characterization, photoluminescence properties and thermal quenching mechanisms. Sci. Rep. 2017, 7, 42464–42476. [Google Scholar] [CrossRef] [Green Version]
- Qiao, Y.B.; Liu, X.F.; Zhang, Q.; Chen, D.P.; Wang, Y.W.; Ma, W.B. Synthesis and luminescence properties of YVO4:Eu nanocrystals grown in nanoporous glass. Mater. Lett. 2010, 64, 1306–1308. [Google Scholar]
- Zhang, S.; Liang, Y.; Gao, Y.X.; Liu, T.H. Hydrothermal synthesis and microstructural, optical properties characterization of YVO4 phosphor powder. Acta Phys. Pol. A 2014, 125, 105–110. [Google Scholar] [CrossRef]
- Kumar, Y.; Pal, M.; Herrera, M.; Mathew, X. Effect of Eu ion incorporation on the emission behavior of Y2O3 nanophosphors: A detailed study of structural and optical properties. Opt. Mater. 2016, 60, 159–168. [Google Scholar] [CrossRef]
- Young, S.C.; Young, D.H. Photoluminescence properties of YVO4:Eu nanophosphors prepared by the hydrothermal reaction. Bull. Korean Chem. Soc. 2010, 31, 2368–2370. [Google Scholar]
- Kumar, V.; Khan, F.A.; Chawla, S. Intense red-emitting multi-rare-earth doped nanoparticles of YVO4 for spectrum conversion towards improved energy harvesting by solar cells. J. Phys. D 2013, 46, 365101–365108. [Google Scholar] [CrossRef]
- Young, S.C.; Young, D.H. Preparation of transparent red-emitting YVO4:Eu nanophosphor suspensions. Bull. Korean Chem. Soc. 2011, 32, 335–337. [Google Scholar]
- Natacha, D.; Chrystel, A.; Franck, P.; David, P.; Bruno, V.; Karine, V.; Denis, A.; Clément, S. New synthesis strategies for luminescent YVO4:Eu and EuVO4 nanoparticles with H2O2 selective sensing properties. Chem. Mater. 2015, 27, 5198–5205. [Google Scholar]
- Li, H.Y.; Zang, F.G.; Ma, J. Synthesis and luminescence properties of YVO4:Eu3+ nanocrystals by a Sol-Gel method. Adv. Mater. Res. 2013, 634, 2268–2271. [Google Scholar] [CrossRef]
- Huignard, A.; Buissette, V.; Laurent, G.; Gacoin, T.; Boilot, P.J. Synthesis and characterizations of YVO4:Eu colloids. Chem. Mater. 2002, 14, 2264–2269. [Google Scholar] [CrossRef]
- Van Uitert, L.G. Characterization of energy transfer interactions between rare earth ions. J. Electrochem. Soc. 1967, 114, 1048–1053. [Google Scholar] [CrossRef]
- Struck, C.W.; Fonger, W.H. Quantum-mechanical treatment of Eu3+ 4f→4f and 4f? charge-transfer-state transitions in Y2O2S and La2O2S. J. Chem. Phys. 1976, 64, 1784–1790. [Google Scholar] [CrossRef]
- Nicholas, V.J. Origin of the luminescence in natural Zircon. Nature 1967, 215, 1476. [Google Scholar] [CrossRef]
- Dong, H.; Kuzmanoski, A.; Wehner, T.; Müller-Buschbaum, K.; Feldmann, C. Microwave-assisted polyol synthesis of water dispersible red-emitting Eu3+-modified carbon dots. Materials 2017, 10, 25. [Google Scholar] [CrossRef] [PubMed] [Green Version]
- Steudel, F.; Johnson, A.J.; Johnson, E.C.; Schweizer, S. Characterization of Luminescent Materials with Eu Mössbauer Spectroscopy. Materials 2018, 11, 828. [Google Scholar] [CrossRef] [Green Version]
- Blasse, G.; Grabmaier, B.C. Luminescent Materials; Springer: Berlin/Heidelberg, Germany, 1994. [Google Scholar]
- Schweizer, S.; Hobbs, L.W.; Secu, M.; Spaeth, J.M.; Edgar, A.; Williams, G.V.M. Photostimulated luminescence in Eu-doped fluorochlorozirconate glass ceramics. Appl. Phys. Lett. 2003, 83, 449. [Google Scholar] [CrossRef]
- Aitasalo, T.; Deren, P.; Hölsä, J.; Jungner, H.; Krupa, J.C.; Lastusaari, M.; Legendziewicz, J.; Niittykoski, J.; Strek, W. Persistent luminescence phenomena in materials doped with rare earth ions. J. Solid State Chem. 2003, 171, 114–122. [Google Scholar] [CrossRef]
- Ten Kate, O.M.; Vranken, T.; van der Kolk, E.; Jansen, A.P.; Hintzen, H.T. Optical properties of Eu2+/Eu3+ mixed valence, silicon nitride based materials. J. Solid State Chem. 2014, 213, 126–131. [Google Scholar] [CrossRef]
- Van Dijk, J.M.F.; Schuurmans, M.F.H. On the nonradiative and radiative decay rates and a modified exponential energy gap law for 4f–4f transitions in rare earth ions. J. Chem. Phys. 1983, 78, 5317. [Google Scholar] [CrossRef]
- Shionoya, S.; Yen, W.M.; Yamamoto, H. (Eds.) Phosphor Handbook; CRC Press: Boca Raton, FL, USA, 2006. [Google Scholar]
- Samanta, T.; Hazra, C.; Mahalingam, V. C-dot sensitized Eu3+ luminescence from Eu3+-doped LaF3-C dot nanocomposites. New J. Chem. 2016, 39, 106–109. [Google Scholar] [CrossRef]
- Kumar, A.; Rai, D.K.; Rai, S.B. Optical studies of Eu3+ ions doped in tellurite glass. Spectrochim. Acta Part A 2002, 58, 2115–2125. [Google Scholar] [CrossRef]
- Kemere, M.; Sperga, J.; Rogulis, U.; Krieke, G.; Grube, J. Luminescence properties of Eu, RE3+ (RE = Dy, Sm, Tb) co-doped oxyfluoride glasses and glass–ceramics. J. Lumin. 2017, 181, 25–30. [Google Scholar] [CrossRef]
- Moos, H.W. Spectroscopic relaxation processes of rare earth ions in crystals. J. Lumin. 1970, 1, 106–121. [Google Scholar] [CrossRef]
- Binnemans, K. Interpretation of europium(iii) spectra. Coord. Chem. Rev. 2015, 295, 1–45. [Google Scholar] [CrossRef] [Green Version]
- Zollfrank, C.; Scheel, H.; Brungs, S.; Greil, P. Europium(III) orthophosphates: Synthesis, characterization, and optical properties. Cryst. Growth Des. 2008, 8, 766–770. [Google Scholar] [CrossRef]
- Pu, Y.; Tang, K.; Zhu, C.D. Synthesis and luminescence properties of (Y, Gd)(P, V)O4:Eu3+, Bi3+ red nano-phosphors with enhanced photoluminescence by Bi3+, Gd3+ doping. Nano-Micro Lett. 2013, 5, 117–123. [Google Scholar] [CrossRef]
- Dybowska-Sarapuk, L.; Kielbasinski, K.; Arazna, A.; Futera, K.; Skalski, A.; Janczak, D.; Sloma, M.; Jakubowska, M. Efficient inkjet printing of graphene-based elements: Influence of dispersing agent on ink viscosity. Nanomaterials 2018, 8, 602. [Google Scholar] [CrossRef] [Green Version]
- Huang, L.; Huang, Y.; Liang, J.; Wan, X.; Chen, Y. Graphene-based conducting inks for direct inkjet printing of flexible conductive patterns and their applications in electric circuits and chemical sensors. Nano Res. 2011, 4, 675–684. [Google Scholar] [CrossRef]
- Cui, Z.; Han, Y.; Huang, Q.; Dong, J.; Zhu, Y. Electrohydrodynamic printing of silver nanowires for flexible and stretchable electronics. Nanoscale 2018, 10, 6806–6811. [Google Scholar] [CrossRef] [PubMed]
- Samuel, H.K.; Heuiseok, K.; Kyungtae, K.; Sang, H.L.; Kwan, H.C.; Jun, Y.H. Effect of meniscus damping ratio on drop-on-demand electrohydrodynamic jetting. Appl. Sci. 2018, 8, 164–172. [Google Scholar]


| YVO4:Eu3+ Powder (wt %) | Polyethylene Oxide (wt %) | Chloroform (wt %) | Deionized Water (wt %) | Ethyl Cellulose (wt %) | α-Terpinoel (wt %) | Isopropanol (wt %) | |
|---|---|---|---|---|---|---|---|
| Ink I | 8 | 49 | 23 | 20 | 0 | 0 | 0 |
| Ink II | 8 | 0 | 0 | 0 | 6 | 92 | 4 |
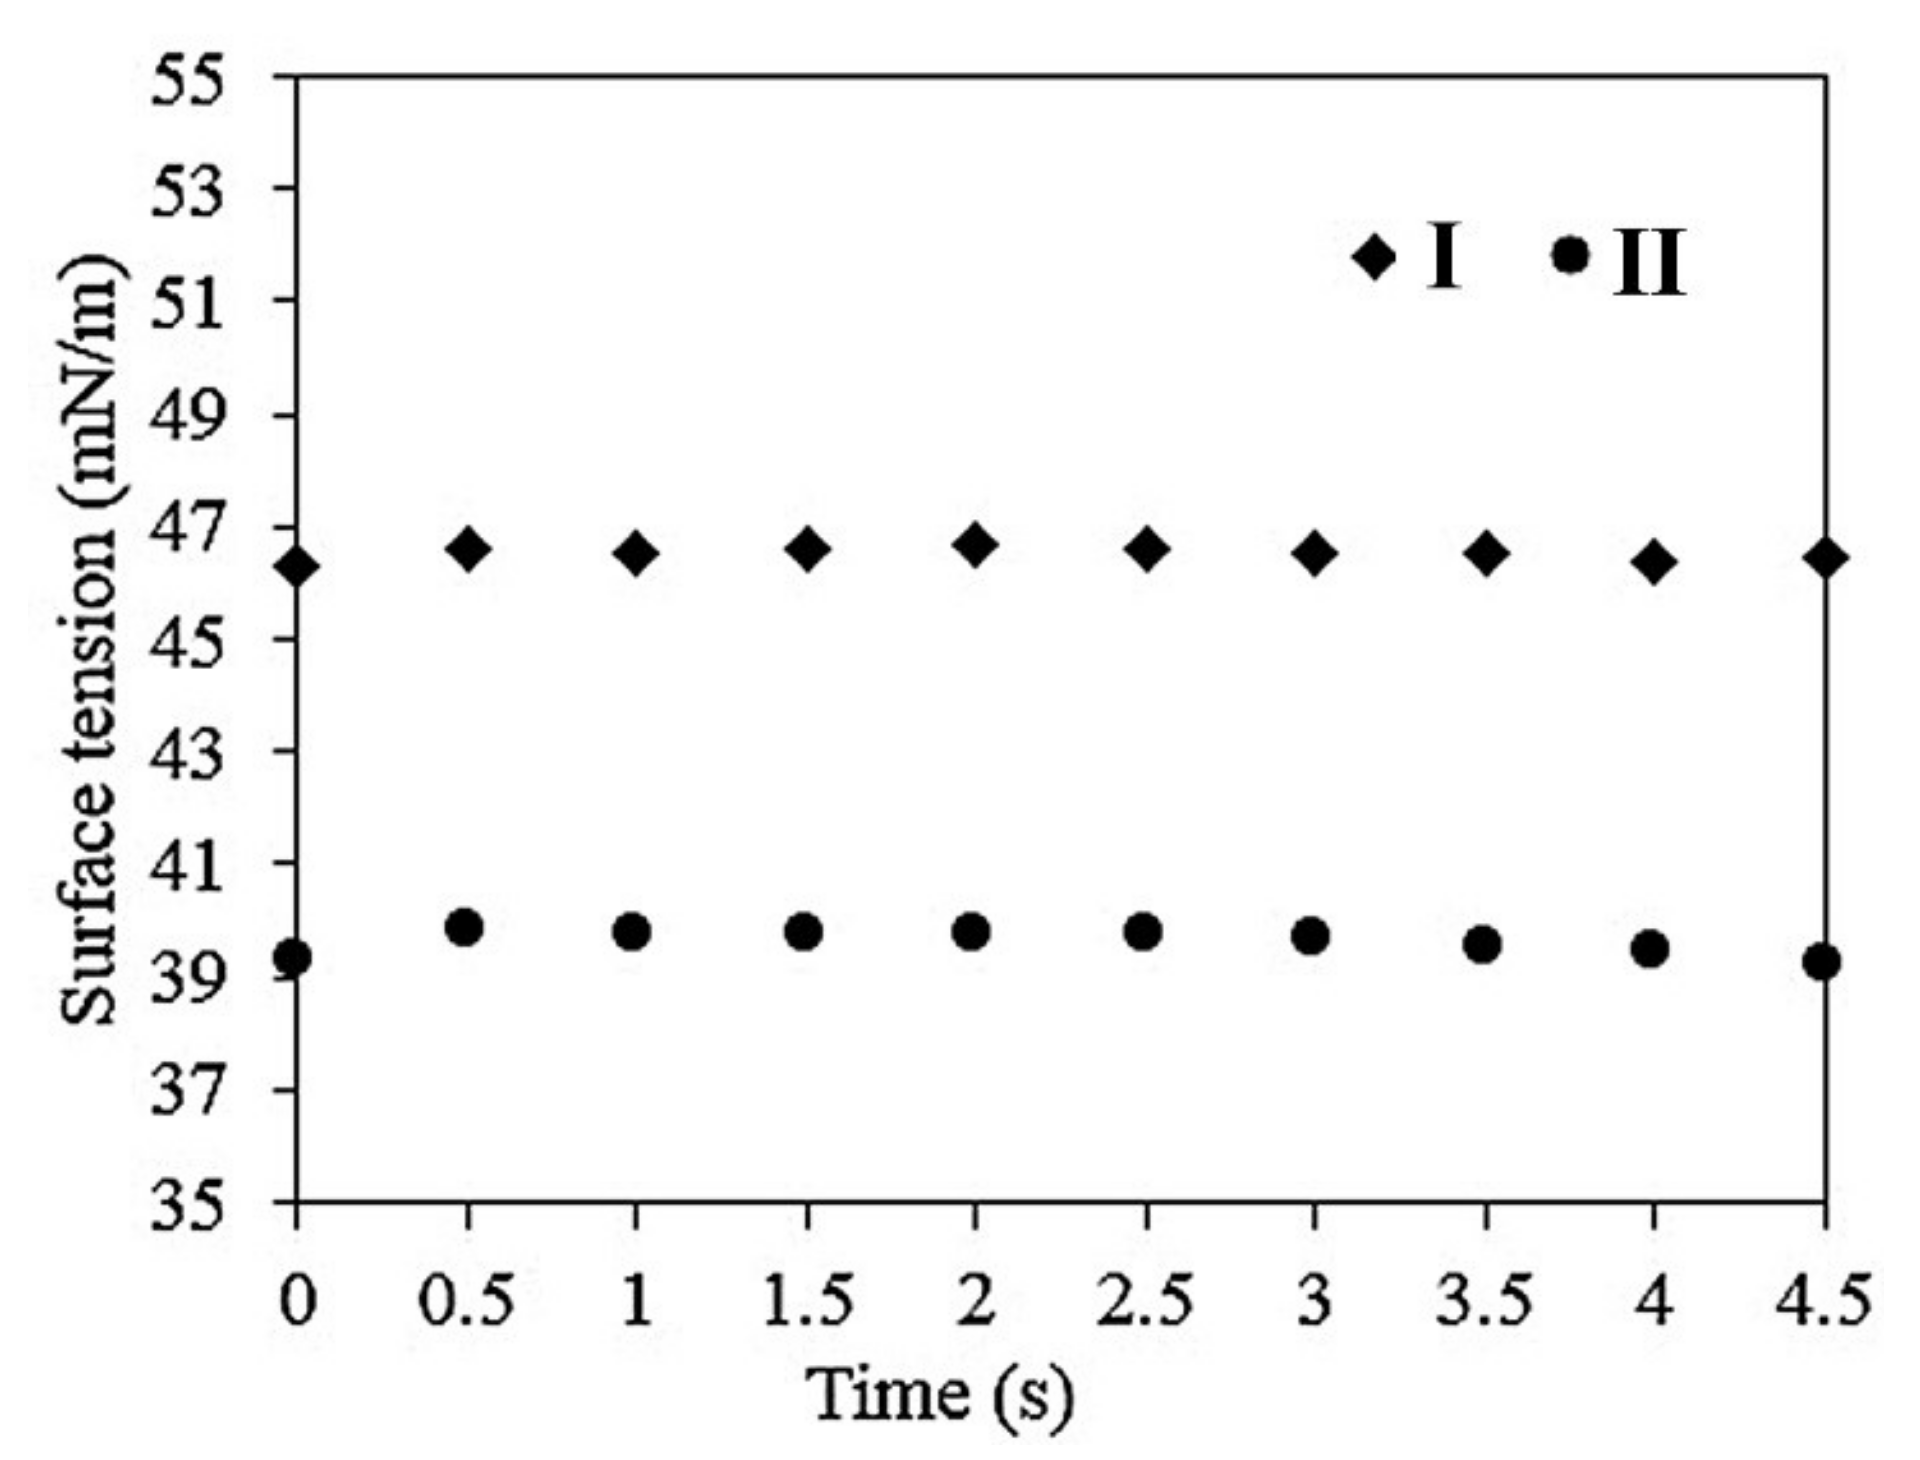
| Viscosity (cP) | Surface Tension (mN/m) | Density (g/cm3) | |
|---|---|---|---|
| Ink I | 119 | 46.3 | 1.15 |
| Ink II | 108 | 38.2 | 1.32 |
| Pressure (kPa) | DC Volt (V) | AC Volt (V) | Frequency (Hz) | Distance between Printhead and Substrate (µm) |
|---|---|---|---|---|
| 11–15 | 500–550 | 700–900 | 500 | 100–150 |
© 2020 by the authors. Licensee MDPI, Basel, Switzerland. This article is an open access article distributed under the terms and conditions of the Creative Commons Attribution (CC BY) license (http://creativecommons.org/licenses/by/4.0/).
Share and Cite
Trinh, C.D.; Doan, T.V.; Thi Pham, P.H.; Thi Dang, D.M.; Quan, P.V.; Dang, C.M. Synthesis and Research of Rare Earth Nanocrystal Luminescent Properties for Security Labels Using the Electrohydrodynamic Printing Technique. Processes 2020, 8, 253. https://doi.org/10.3390/pr8020253
Trinh CD, Doan TV, Thi Pham PH, Thi Dang DM, Quan PV, Dang CM. Synthesis and Research of Rare Earth Nanocrystal Luminescent Properties for Security Labels Using the Electrohydrodynamic Printing Technique. Processes. 2020; 8(2):253. https://doi.org/10.3390/pr8020253
Chicago/Turabian StyleTrinh, Chinh Dung, Thuan Van Doan, Phuong Hau Thi Pham, Dung My Thi Dang, Pham Van Quan, and Chien Mau Dang. 2020. "Synthesis and Research of Rare Earth Nanocrystal Luminescent Properties for Security Labels Using the Electrohydrodynamic Printing Technique" Processes 8, no. 2: 253. https://doi.org/10.3390/pr8020253