
Association between the Rankings of Top Bioinformatics and Medical Informatics Journals and the Scholarly Reputations of Chief Editors


Department of Computer Science, College of Sciences, Old Dominion University, 5115 Hampton Blvd, Norfolk, VA 23529, USA
Publications 2021, 9(3), 42; https://doi.org/10.3390/publications9030042
Submission received: 2 June 2021
/
Revised: 26 July 2021
/
Accepted: 6 September 2021
/
Published: 15 September 2021
Abstract
:The scientometric indices, such as the journal Impact Factor (IF) or SCImago Journal Rank (SJR), often play a determining role while choosing a journal for possible publication. The Editor-in-Chief (EiC), also known as a lead editor or chief editor, usually decides the outcomes (e.g., accept, reject) of the submitted manuscripts taking the reviewer’s feedback into account. This study investigates the associations between the EiC’s scholarly reputation (i.e., citation-level metrics) and the rankings of top Bioinformatics and Computational Biology (BCB) and Medical Informatics (MI) journals. I consider three scholarly indices (i.e., citation, h-index, and i-10 index) of the EiC and four scientometric indices (i.e., h5-index, h5-median, impact factor, and SJR) of various journals. To study the correlation between scientometric indices of the EiC and journal, I apply Spearman () and Kendall () correlation coefficients. Moreover, I employ machine learning (ML) models for the journal’s SJR and IF predictions leveraging the EiC’s scholarly reputation indices. The analysis reveals no correlation between the EiC’s scholarly achievement and the journal’s quantitative metrics. ML models yield high prediction errors for SJR and IF estimations, which suggests that the EiC’s scholarly indices are not good representations of the journal rankings.
1. Introduction
The various scientometric indices of journals have influences on the peer assessments of scholarly publications. Often, the preliminary judgment of the quality of a new article is assumed by the prestige of the journal where it is published [1]. The two main criteria for assessing a journal’s reputation are expert evaluation and scientometric analysis [2]. A comprehensive assessment by a domain expert can provide a tangible view of a journal’s quality; however, this kind of assessment is subjective in nature and could be biased by the expert’s own experiences. Besides, evaluating the journal quality on an individual basis is not a feasible option due to the high cost of investigations. Therefore, the quantitative evaluation of journals is a more dominant approach [3]. Various scientometric measures, such as the total citations, impact factor, h-index, and several other criteria can help to assess the quality of a journal qualitatively [4]. Although quantitative indicators, such as the journal’s IF or author h-index has various limitations [5,6,7,8,9], they have still been used for academic review, promotion, and tenure evaluations [8].
The journal editorial board represents a group of scholars with a high academic reputation [10]; they possess domain expertise and academic skills and have the scholarly understanding for providing decisions about the revision, acceptance, and rejection of submitted manuscripts [11]. The journal editorial team plays a vital role in building the reputation of journals by taking part in the editorial processes, such as evaluating the quality of the submitted manuscript, selecting appropriate reviewers, and deciding upon their final publication in the journal. Based on [12], the editor’s responsibilities include safeguarding against incompetent reviews, maintaining confidentiality and integrity in research, avoiding bias, providing guidelines to authors, addressing allegations of misconduct, publishing corrections, and retractions. The Editor-in-Chief (EiC) typically plays the leading role in final decision-making. Scholarly journals hope to designate academically distinguished scholars as editors who assist in developing the reputation of the journal.
Researchers investigated the relationship between scientometric measures of scientific journals and scholars involved in the editorial process [13,14,15]. However, they primarily considered the reputations of the entire editorial board. Since the editorial board could consist of editors/associated editors having different levels of scholarly accomplishments, it is difficult to discriminate the influence of the EiC’s reputation exclusively on the scientometric indices of various journals. Besides, so far, no study has investigated the association between the scholarly reputations of the EiC and the journal ranking in bioinformatics, computational biology, or medical informatics domains.
The objective of this work is to address the following research questions (RQ):
- RQ1: How the scholarly reputation of the EiC is reflected (i.e., whether any correlation exists) on the scientometric indices of Bioinformatics and Computational Biology (BCB) and Medical Informatics (MI) journals.
- RQ2: Does the research domain influence the correlation between the EiC’s scholarly reputation and the journal’s scientometric indices?
- RQ3: Can ML classifiers accurately predict the SCImago Journal Rank (SJR) and Impact Factor (IF) of top BCB and MI journals from the EiC’s scholarly reputation alone?
I investigate the correlation between the EiC’s scholarly reputations and various scientometric indices of top journals in the field of BCB and MI. The journals are selected based on Google Scholar (GS)1 ranking, which ranks publication venues based on their h5-index. As journal metrics, I analyze the h5-index, h5-median, impact factor, and SJR score. For the EiC’s reputation indices, I consider the total citations, h-index, and i-10 index. Three correlation measures, Spearman [16], Pearson [17,18], and Kendall () [19] are utilized to find the existence of any correlation. Besides, I train machine learning models to estimate the IF and SJR of journals. I do not observe any correlation between the journal ranking and the scholarly reputation of the EiC. Furthermore, I notice that both linear and non-linear regression models yield high prediction errors for estimating the IF and SJR of journals.
2. Related Work
A number of studies explored the relationship between various journal rating metrics and editorial characteristics [20,21]. Various characteristics of editorial boards, such as geography [22,23], gender [24,25], and institutional affiliation [21] have been considered to evaluate journal performance. Petersen et al. [26] conducted a large-scale study to investigate the relationship between the impact of journals and the characteristics of the editorial board.
Bedeian et al. [27] studied the scientific achievement of editorial board members via three measures, adjusted total articles, corrected quality index, and the group h-index score. Their research spanned six disciplines and inferred that journal editors should be appointed based on their scholarly records. Lowe and Van Fleet [28] used three measures, adjusted total articles, median-adjusted citation, and the median-corrected quality index to assess the scholarly achievement of the board members of nine accounting journals. They found that top accounting journals use different criteria in selecting editorial board members. Besides, their results revealed that the level of achievement of the editorial board members and the article’s impact factors were often inconsistent.
Zdeněk and Lososová [29] performed a study on agricultural economics and policy journals; they found that editorial board members publishing in their own journal had a negative correlation with the journal’s impact factor. The impact of the editorial board’s h-index on the journal impact factor has been studied by [30]. They observed that the median h-index of the anesthesia journal editorial teams correlated positively with the impact factors of corresponding journals.
Kay et al. [13] assessed the correlations between the h-indices of editorial board members and the journal impact factor in the top eight sports medicine journals. The gender, country of residence, degree, and faculty position of the editorial board members were identified using their respective scientific publication profiles. They retrieved the h-index and other bibliometric indicators of these editorial board members from Web of Science (WoS) and Google Scholar (GS) databases. They applied regression models to determine the ability of the editorial board member’s h-index to estimate their journal’s impact factor (IF). They found the h-indices of editorial board members of top sports medicine journals can predict the IF of their respective journals fairly well.
Asanafi et al. [14] analyzed the h-indices of editorial board members of various Radiology journals. The authors studied the hypothesis that editorial board members of highly impactful Radiology journals have higher h-indices. They examined 62 Radiology journals that had an IF of more than 1. They considered scientometric indices, such as the number of publications, total citations, citations per publication, and h-index for each editorial board member. Chi-square or Wilcoxon rank-sum tests were used to test for differences in bibliographic measures or demographics between groups. Their results indicate that the h-indices, total publications, and total and average citations of editorial boards of the journals having IF above the median are higher compared to the editorial board of the journals below the median. Mendonça et al. [31] examined the top six African Studies journals to find a positive relationship between editorial research performance and journal performance.
Valderrama et al. [32] employed an ordinal regression model to predict the journal ranking from various metrics. The authors used the h-index of the journal’s Editor-in-Chief, the percentage of papers published in the journal that received external funding, and the average number of papers published yearly as covariables, and two other factors concerning the scope and structure of the journal. Their model was applied to the field of Dentistry, Oral Surgery, and Medicine. They concluded that the above-mentioned covariables had some positive correlation with the journal impact factor.
In contrast to previous works, this study attempts to analyze the relationship between editorial scholarly reputations (i.e., EiC) and journal scientometric indices in the BCB and MI journals. Besides, existing works mostly considered the scholarly achievement of the entire editorial board, while this study investigates only the top label editorial position (i.e., EiC).
3. Journal and Editorial Data
3.1. Journal Selection
In this study, top journals from the BCB and MI research areas are investigated. The journals are selected based on the GS publication ranking, which ranks publications based on their h5-index2. Journals from two different domains are analyzed to ascertain any domain bias in the results. GS provides the top 20 publication venues of a research domain, which contains conference venues in addition to journals. The conference venues are excluded as they are not relevant to this study. Furthermore, for a few journals, I find no GS profile of the EiC; hence, I also omit them. The final dataset contains scientometric ranking indices (based on Clarivate Analytics and Web of Science reports published in 2020) of 13 BCB and 13 MI journals collected in April 2021. For one MI journal, the SJR information is not available in the Scimago website3; thus, it is excluded from the SJR prediction.
3.2. Scientometric Indices of the EiC and Journal
3.2.1. Scholarly Indices of EiC
To assess the scholarly reputation of the EiC, three scientometric indices are considered.
- Total citation: The citation is a reference to the source of information used in research. The total citation of a researcher refers to the number of times that his/her works have been quoted, paraphrased, or summarized by himself or other researchers.
- h-index: The h-index is an author-level metric that considers both the productivity and citation impact of a researcher’s publications. The h-index was originally proposed by Hirsch, who described it as a measure to quantify the research productivity of an individual researcher [33].
- i10-index: The i10-index is a simple measure introduced by GS to help gauge the productivity of a scholar. This index refers to the number of publications of a researcher with at least 10 citations.
When more than one scholar holds the EiC title of a journal, I take the average of their citations, h5 index, and i10 index values.
3.2.2. Journal Scientometric Indices
As journal scientometric indices, the following four metrics are considered:
- h5-index: The h5-index is the h-index for articles published in the last five complete years. It is the largest number, h, such that the h articles published in the last five years have at least h citations each.
- h5-median: The h5-median is calculated from the h5-index; it represents the median value of citations for an h number of citations.
- Impact factor (IF): The impact factor (IF) of a journal indicates the yearly average number of citations it received for each article published in the last two years. The journals with higher IF are often assumed to be more prestigious than the journals with lower IF in the same domain.
- SJR index: The SCImago Journal Rank (SJR) considers both the number of citations received by a journal and the importance or prestige of the journals from where the citations come. Furthermore, SJR restricts self-citations to count for no more than one-third of the citations [4].
3.3. Data Collection
The structure of the editorial board may vary among journals [29]. In some journals, I find that the leading position is referred to as Editor-in-Chief (EiC), while in others, the title of the highest-ranked editorial board member is Editor. In the first scenario, scholars in the next level of the hierarchy are called Editors; in the other case, it is the Associate Editors who are at the next level. Here, I denote the scholar at the topmost level of a journal as EiC. From the official website of each journal, I retrieve the name and affiliations of EiC.
The author search option of GS is used. However, it is not unusual to have several researchers with the same name. Therefore, I manually verify those researchers’ profiles to determine their affiliations and choose the researcher with the correct affiliation. Afterward, the scholarly indices of the EiC such as citation, h-index, and i10-index are collected. The h5-index and h5-median of the journals are retrieved from GS. The impact factors (IF) of the journals are collected from their official websites. The SJR information is obtained from the SCImago website. All the EiC scholarly metrics were collected in April 2021.
Table 1 provides the scientometric indices of various BCB and MI journals. The mean represents the average values of various indices, the median represents the middle number, and the standard deviation (STD) indicates the dispersion of the data relative to its mean. Table 2 shows the scientometric indices of the EiC of various BCB and MI journals.
4. Correlation Analysis
A correlation coefficient measures the extent to which two variables tend to change together. The coefficient describes both the strength and the direction of the relationship. I utilize two correlation metrics to compute the association between various EiCs’ scholarly metrics and the journal’s scientometric indices. I perform the correlation analysis in different research domains independently, as the span of IF and SJR of the top-ranked journals may vary across research domains.
4.1. Correlation Metrics
4.1.1. Spearman Rank-Order Correlation Coefficient
The Spearman rank-order correlation coefficient (Spearman’s ) is a non-parametric measure of the monotonicity of the relationship between two variables. It varies between −1 and +1, where +1 or −1 occurs when one of the variables is a perfect monotone function of the other, while 0 implies no correlation. Spearman’s can capture both linear and non-linear relationships.
Let the n (i.e., sample size) raw scores of two variables X and Y be and , respectively. The ranks of X and Y are represented by and , respectively. The following formula is used to calculate Spearman’s :
where = Spearman rank correlation, , and the difference between the ranks of each observation, n = number of observations.
4.1.2. Kendall Rank Correlation Coefficient
The Kendall rank correlation coefficient (often called Kendall’s coefficient) is a non-parametric measure of the correspondence between two rankings. A value close to 1 indicates strong agreement, whereas a value near −1 indicates strong disagreement. When the rankings are completely independent, Kendall’s shows a coefficient score of 0. Kendall’s coefficient is a non-parametric test, as it does not rely on any assumptions on the distributions of either variables or the joint distribution of both. Let , …, be a set of observations of the joint random variables X and Y, such that all the values of and are unique (ties are neglected for simplicity). Any pair of observations and , where i < j, are said to be concordant if the sort order of and agrees: otherwise they are said to be discordant.
The Kendall coefficient is defined as
where
is the binomial coefficient for the number of ways to choose two items from n items.
4.2. Scientometric Pairs for Correlation Analysis
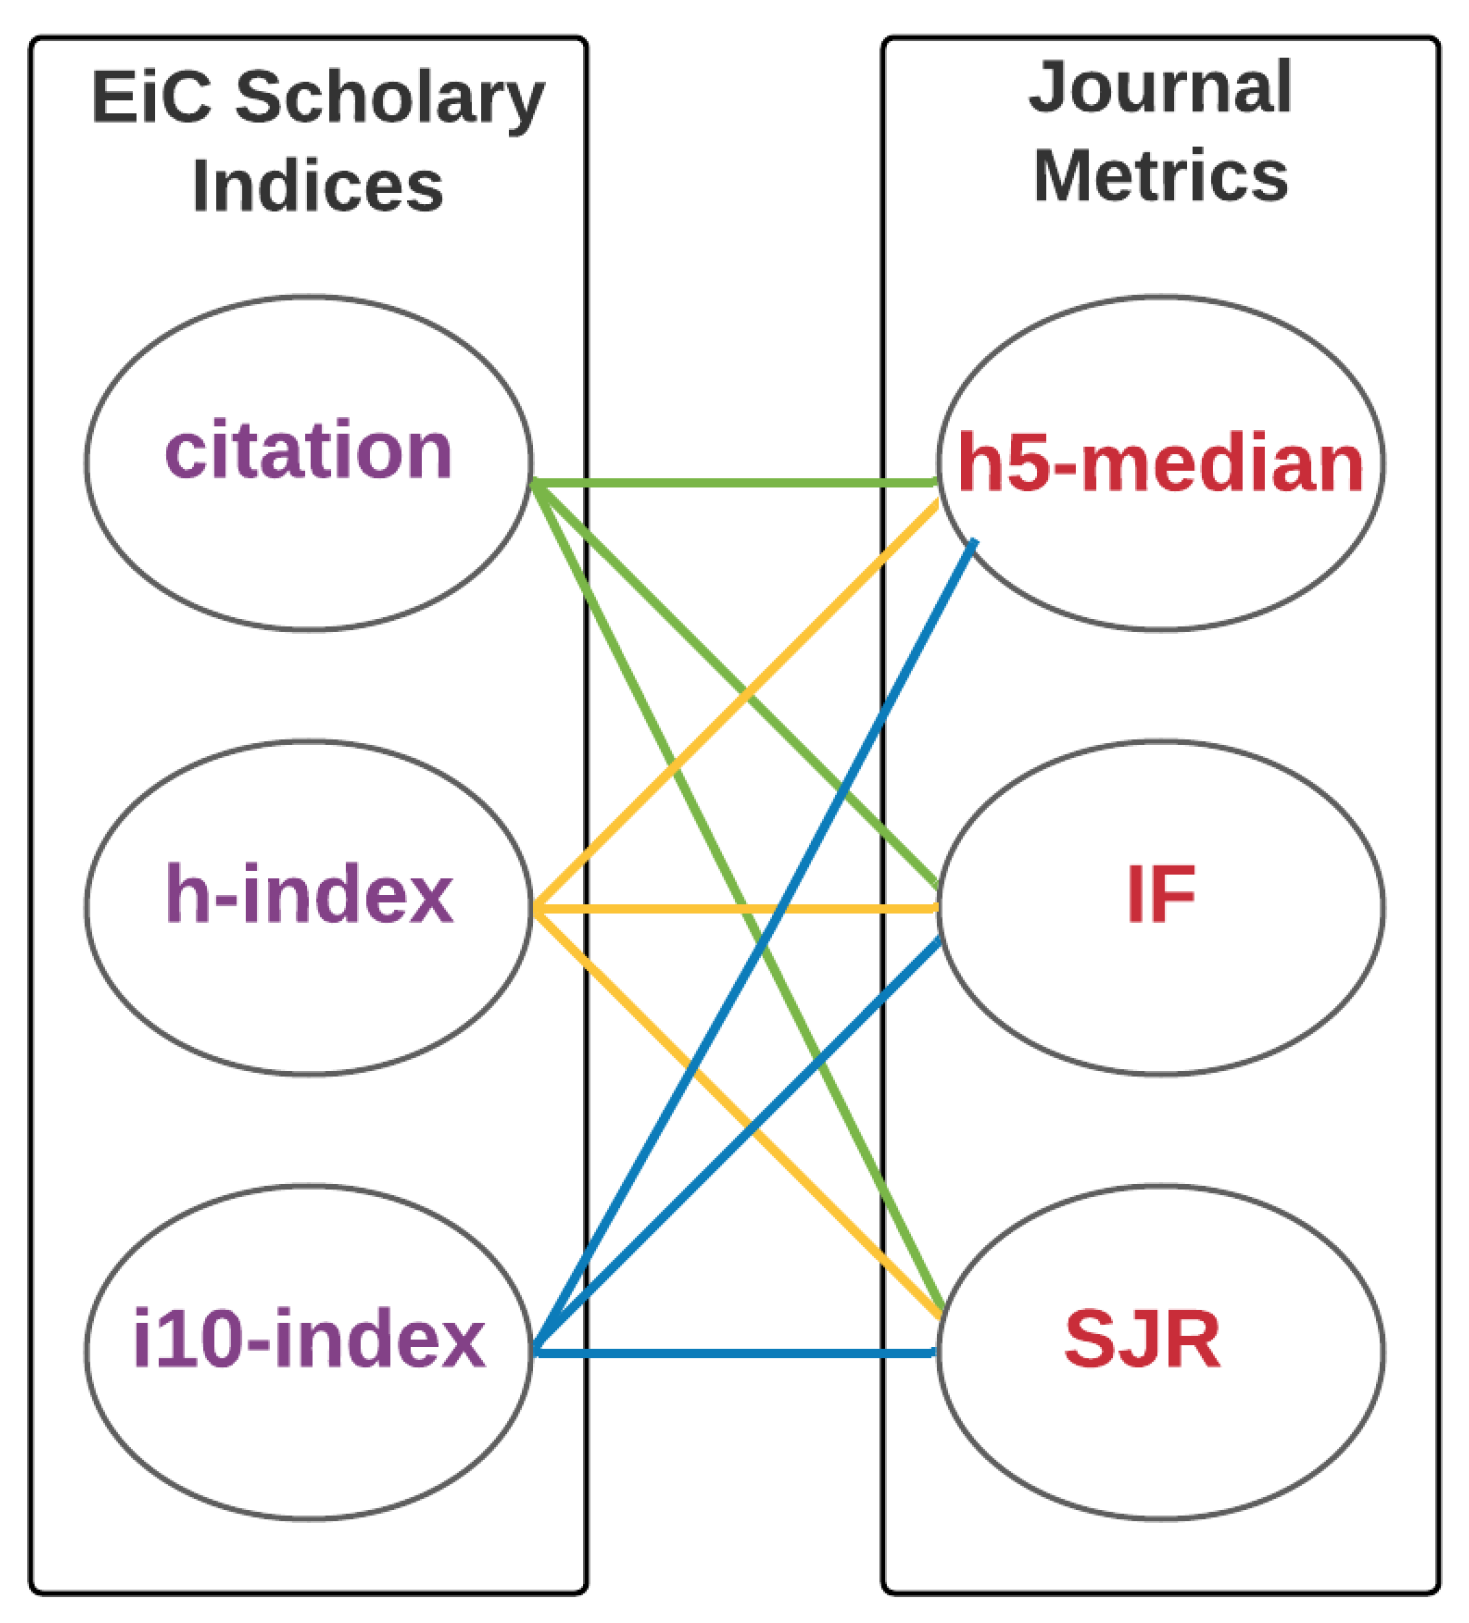
The following nine pairs are considered for correlation analysis, as shown in Figure 3.
- citation count of the EiC and journal IF
- citation count of the EiC and journal SJR
- citation count of the EiC and journal h5-median
- h-index of the EiC and journal IF
- h-index of the EiC and journal SJR
- h-index of the EiC and journal h5-median
- i10-index of the EiC and journal IF
- i10-index of the EiC and journal SJR
- i10-index of the EiC and journal h5-median
To each pair, I employ the two aforementioned correlation measures to identify any correlation.
5. Regression Analysis
Furthermore, to check whether the scholarly metrics of the EiC can be leveraged to estimate the SJR and IF of a journal, I employ several ML models. One or multiple EiC indices, such as citation, h-index, and i10 index, are utilized as input features for ML classifiers
5.1. Regression Models
The linear regression (LR) [34], support vector regression (SVR) [35], and gradient boosting regression (GBR) [36] are employed for predicting SJR and IF. The scikit-learn library [37] is utilized to train all the ML models. For all the ML models, the default parameter settings of the scikit-learn library are used. The leave-one-out cross-validation is applied, which splits data into training and testing sets in such a way that each sample is used as a test set once, while the remaining samples make the training set.
5.1.1. LR
In LR, the prediction y can be calculated from a linear combination of the input variables, . I use ordinary least squares (OLS) LR that try to fit a linear model with coefficients . The objective function of is to minimize , where is the target, is the coefficient, and is the predictor.
5.1.2. SVR
For SVR, in contrast to OLS LR, the objective function is to minimize the coefficients, that is the l2-norm of the coefficient vector, not the squared error.
5.1.3. GBR
GBR allows for the optimization of arbitrary differentiable loss functions. In each stage, a regression tree is fit on the negative gradient of the given loss function.
5.2. Evaluation Metrics
To evaluate the performance of various ML classifiers, I utilize Root Mean Squared Error (RMSE), Mean Absolute Error (MAE), and R-squared (denoted as ) error.
5.2.1. RMSE
The RMSE measures the differences between values predicted by a model and the observed values. It is calculated as the , where are predicted values and are observed values, and n is the number of observations.
5.2.2. MAE
The MAE computes the mean absolute error based on the below formula:
, where are predicted values, are observed values, and n is the number of observations.
5.2.3. R-Squared
, also known as the coefficient of determination, is a statistical measure of fit that refers to the proportion of the variation of a dependent variable explained by the independent variable(s) in a regression model [38]. Usually, the coefficient of determination ranges from 0 to 1; however, it is possible to get a negative value when a model cannot follow the pattern of the data. is only applicable for the linear model.
6. Results
As shown in Table 3 and Table 4, no pair of the scientometric indices of the EiC and journal reveal any correlation. Spearman shows the highest correlation coefficient between EiC’s citation and BCB journal’s IF, which is 0.38. However, a high p-value of 0.20 is observed, which indicates the low significance of the results. For MI journals, I find in many pairs, such as between citation and IF, h-index and IF, both Spearman and Kendall show negative correlation values.
For the prediction of SJR and IF (shown in Table 5 and Table 6), I find ML classifiers show high RMSE values in both datasets, irrespective of the input feature I leverage. In estimating the IF of the BCB journal, all the classifiers show RMSE values between 1.28 to 2.89, which is around 0.65 to 1.5 standard deviations away from the observed values. For the MI journal, the RMSE values range from 1.19 to 1.855. Furthermore, I observe negative values in both datasets that indicate poor-fitting between the model and data. Both linear (i.e., LR) and non-linear approaches (SVR with RBF kernel and GBR) fail to yield a predictive model for SJR and IF estimation.
7. Discussion
The results indicate that no correlation exists between the rankings of journals (based on IF, SJR, or h5-median) and EiC scholarly metrics (citations or h-index). To identify why the ranks of the journals and scholarly indices of the EiC do not align, it is essential to analyze various aspects. Three main constituents, the journal ranking indicator, EiC’s scholarly reputation indices, and the publisher’s criteria to choose EiC are scrutinized to ascertain whether the reasoning supports the observation.
7.1. Journal Ranking Indicator
Although scientometric indices, such as SJR and IF, provide quantitative measures of various journals, they are by no means the perfect indicators of the overall quality and reputation of the journals; the subjective evaluations by the field experts often provide a better assessment. Besides, there exists a discrepancy in the ranks provided by various scientometric indices such as SJR and IF. They differ in the sources of citations (i.e., scientific databases used), as well as from differentiation in the methodology of estimation of these indices [39], and thus rank journals differently. For example, the Journal of Mathematical Biology has an IF and SJR of 1.94 and 0.84, respectively. While the Journal of Biomedical Semantics has a lower IF of 1.58, its SJR is much higher, 1.16.
7.1.1. Publication Model
The open-access publication model has gained popularity in recent years [40]. As the open access journals are free for readers, often they are cited more than subscription-based journals [41,42]. Especially, researchers from developing countries, who often do not have access to subscription-based content, are inclined to cite open access content. Thus, the citation count, which is the main criteria of ranking, can be affected by the publication model.
7.1.2. Publication Type
The journal’s impact factor can be considerably affected by the types of articles it publishes. For example, the publication of review articles, which usually acquire more citations than research articles, or the publication of just a few very highly cited research can raise the IF substantially papers [43]. Journals may also attempt to decline the publication of articles that are unlikely to be cited, such as case reports in medical journals [44].
7.1.3. Other Attributes
7.2. Scholarly Indices of EiC
EiC scholarly indices, such as citation count, can also be affected by various factors.
7.2.1. Area of Research
EiC scholarly indices, such as citation count, can also be affected by the area of research, the same way as the journal citation count.
7.2.2. Topic of Research
Research articles on emerging or trending topics are often cited more than the topics which are already matured. Thus, the EiC who conducts research on those topics may accumulate a higher citation than others.
7.2.3. Affiliations and Venue of Publications
The country and university affiliations may affect the citation count. The authors from research-focused countries and who have affiliations with prestigious universities are often cited more. Moreover, publication in highly ranked venues often brings more citations.
7.2.4. Research Network
The citation count can also be affected the research network of an author. A large network of scholars conducting research on similar topics often yields more citations to all of them.
7.3. Publishers’ Criteria for Choosing EiC
In addition, the publishers also have some set of criteria to select an editor for a journal. The selection of the editor is based on what suits the journal best, and what is best for the community that the journal serves4. For example, if the fields of the journal are expanding, they usually employ an editor who can manage the growth. If the journal is no longer serving the needs of its community, it requires an editor who can implement and execute changes. Being a leading scientist is just one factor to become an editor. The most important criteria are to have excellent communication skills, a clear vision and commitment to the field, being a team person, and visibility and respect in the community.
In summary, the complexity, bias, and necessity associated with all of the above factors justify the non-existence of any positive correlation between the rankings of the top journals and scholarly metrics of the EiC. The results advocate the limitations of scientometric indices mentioned in the existing literature. The early-career researchers and researchers from underrepresented groups (e.g., female researchers in CS) or developing countries [47] should keep that in mind while selecting the journal for possible publication. The quality of the manuscript should be the topmost priority instead of pursuing IF or SJR. Moreover, research integrity and transparency should be maintained to keep the scientometric indices meaningful [48]. Some directions and suggestions to maintain scientific integrity in research have been provided in [48,49].
However, although there exists no positive correlation between the journals and the EiC’s scientometric indices, it is observed that the EiCs of the top-ranked journals are leading scholars in their respective fields. The citation counts of EiCs of the BCB journals range from around 4000 to 50,000, with a mean and median citation count of 14,480 and 10,815, respectively. For the MI journals, the mean and median citation counts are 5364 and 5093, respectively. The journals published from developing countries should consider that when appointing the EiC [50].
8. Summary and Conclusions
In this paper, I investigate the association between the scholarly reputation of the EiC and various citation metrics of top BCB and MI journals. The results reveal no correlations exist between the scholarly indices of the EiC and the journal scientometric indices, such as IF, h5-median, or SJR due to various reasons. Furthermore, using various EiC scholarly indices as input features, multiple ML classifiers are trained. It is found that ML classifiers show high prediction errors for estimating the SJR and IF of journals. The prediction results indicate that the scholarly reputation of the EiC alone is not a good estimator of the journal ranking. The future study will investigate journals from diverse domains and of varying quality (i.e., based on quartile rank).
Author Contributions
Conceptualization, S.S.; methodology, S.S.; software, S.S.; validation, S.S.; formal analysis, S.S.; investigation, S.S.; resources, S.S.; data curation, S.S.; writing—original draft preparation, S.S.; writing—review and editing, S.S.; visualization, S.S. The author has read and agreed to the published version of the manuscript.
Funding
This research received no external funding.
Institutional Review Board Statement
Not applicable.
Informed Consent Statement
Not applicable.
Data Availability Statement
The data used in this study are available at: https://github.com/sazzadcsedu/EiC-Journal-Correlation.git (accessed on 14 September 2021).
Conflicts of Interest
The authors declare no conflict of interest.
| 1 | https://scholar.google.com/citations?view_op=top_venues (accessed on 15 April 2021). |
| 2 | |
| 3 | https://www.scimagojr.com/journalrank.php (accessed on 18 April 2021). |
| 4 | https://www.elsevier.com/connect/how-do-publishers-choose-editors-and-how-do-they-work-together (accessed on 18 April 2021). |
References
- Mingers, J.; Yang, L. Evaluating journal quality: A review of journal citation indicators and ranking in business and management. Eur. J. Oper. Res. 2017, 257, 323–337. [Google Scholar] [CrossRef]
- Straub, D.; Anderson, C. Editor’s comments: Journal quality and citations: Common metrics and considerations about their use. MIS Q. 2010, 34, iii–xii. [Google Scholar] [CrossRef]
- Zhang, J.; Zhao, Y.; Wang, Y. A study on statistical methods used in six journals of library and information science. Online Inf. Rev. 2016, 40, 416–434. [Google Scholar] [CrossRef]
- Walters, W.H. Citation-based journal rankings: Key questions, metrics, and data sources. IEEE Access 2017, 5, 22036–22053. [Google Scholar] [CrossRef]
- Vuong, Q.H. The harsh world of publishing in emerging regions and implications for editors and publishers: The case of Vietnam. Learn. Publ. 2019, 32, 314–324. [Google Scholar] [CrossRef]
- Marks, M.S.; Marsh, M.; Schroer, T.A.; Stevens, T.H. Misuse of journal impact factors in scientific assessment. Traffic 2013, 14, 611–612. [Google Scholar] [CrossRef] [PubMed]
- Katritsis, D.G. Journal Impact Factor: Widely Used, Misused and Abused. Arrhyth. Electrophysiol. Rev. 2019, 8, 153. [Google Scholar] [CrossRef] [Green Version]
- McKiernan, E.C.; Schimanski, L.A.; Nieves, C.M.; Matthias, L.; Niles, M.T.; Alperin, J.P. Meta-research: Use of the journal impact factor in academic review, promotion, and tenure evaluations. Elife 2019, 8, e47338. [Google Scholar] [CrossRef]
- Tran, T.; Hoang, K.L.; La, V.P.; Ho, M.T.; Vuong, Q.H. Scrambling for higher metrics in the Journal Impact Factor bubble period: A real-world problem in science management and its implications. Probl. Perspect. Manag. 2020, 18, 48–56. [Google Scholar] [CrossRef] [Green Version]
- Zdeněk, R. Editorial board self-publishing rates in Czech economic journals. Sci. Eng. Ethics 2018, 24, 669–682. [Google Scholar] [CrossRef]
- Resnik, D.B.; Elmore, S.A. Ensuring the quality, fairness, and integrity of journal peer review: A possible role of editors. Sci. Eng. Ethics 2016, 22, 169–188. [Google Scholar] [CrossRef]
- Weller, A.C. Editorial Peer Review: Its Strengths and Weaknesses; Information Today, Inc.: Jersey, NJ, USA, 2001. [Google Scholar]
- Kay, J.; Memon, M.; de SA, D.; Simunovic, N.; Duong, A.; Karlsson, J.; Ayeni, O.R. The h-index of editorial board members correlates positively with the impact factor of sports medicine journals. Orthop. J. Sport. Med. 2017, 5, 2325967117694024. [Google Scholar] [CrossRef] [Green Version]
- Asnafi, S.; Gunderson, T.; McDonald, R.J.; Kallmes, D.F. Association of h-index of editorial board members and impact factor among radiology journals. Acad. Radiol. 2017, 24, 119–123. [Google Scholar] [CrossRef]
- Xie, Y.; Wu, Q.; Li, X. Editorial team scholarly index (ETSI): An alternative indicator for evaluating academic journal reputation. Scientometrics 2019, 120, 1333–1349. [Google Scholar] [CrossRef]
- Spearman, C. The Proof and Measurement of Association between Two Things; Appleton-Century-Crofts: New York, NY, USA, 1961. [Google Scholar]
- Benesty, J.; Chen, J.; Huang, Y.; Cohen, I. Pearson correlation coefficient. In Noise Reduction in Speech Processing; Springer: Berlin/Heidelberg, Germany, 2009; pp. 1–4. [Google Scholar]
- Sedgwick, P. Pearson’s correlation coefficient. BMJ 2012, 345, 1756–1833. [Google Scholar] [CrossRef] [Green Version]
- Kendall, M.G. A new measure of rank correlation. Biometrika 1938, 30, 81–93. [Google Scholar] [CrossRef]
- Mazov, N.; Gureev, V. The editorial boards of scientific journals as a subject of scientometric research: A literature review. Sci. Tech. Inf. Process. 2016, 43, 144–153. [Google Scholar] [CrossRef]
- Burgess, T.F.; Shaw, N.E. Editorial board membership of management and business journals: A social network analysis study of the Financial Times 40. Br. J. Manag. 2010, 21, 627–648. [Google Scholar] [CrossRef]
- Nisonger, T. The relationship between international editorial board composition and citation measures in political science, business, and genetics journals. Scientometrics 2002, 54, 257–268. [Google Scholar] [CrossRef] [Green Version]
- García-Carpintero, E.; Granadino, B.; Plaza, L. The representation of nationalities on the editorial boards of international journals and the promotion of the scientific output of the same countries. Scientometrics 2010, 84, 799–811. [Google Scholar] [CrossRef]
- Metz, I.; Harzing, A.W.; Zyphur, M.J. Of journal editors and editorial boards: Who are the trailblazers in increasing editorial board gender equality? Br. J. Manag. 2016, 27, 712–726. [Google Scholar] [CrossRef]
- Mauleón, E.; Hillán, L.; Moreno, L.; Gómez, I.; Bordons, M. Assessing gender balance among journal authors and editorial board members. Scientometrics 2013, 95, 87–114. [Google Scholar] [CrossRef] [Green Version]
- Petersen, J.; Hattke, F.; Vogel, R. Editorial governance and journal impact: A study of management and business journals. Scientometrics 2017, 112, 1593–1614. [Google Scholar] [CrossRef]
- Bedeian, A.G.; Van Fleet, D.D.; Hyman, H.H., III. Scientific Achievement and Editorial Board Membership; Sage Publications Sage CA: Los Angeles, CA, USA, 2009. [Google Scholar]
- Lowe, D.J.; Van Fleet, D.D. Scholarly achievement and accounting journal editorial board membership. J. Account. Educ. 2009, 27, 197–209. [Google Scholar] [CrossRef]
- Zdeněk, R.; Lososová, J. An analysis of editorial board members’ publication output in agricultural economics and policy journals. Scientometrics 2018, 117, 563–578. [Google Scholar] [CrossRef]
- Pagel, P.; Hudetz, J. An analysis of scholarly productivity in United States academic anaesthesiologists by citation bibliometrics. Anaesthesia 2011, 66, 873–878. [Google Scholar] [CrossRef]
- Mendonça, S.; Pereira, J.; Ferreira, M.E. Gatekeeping African studies: What does “editormetrics” indicate about journal governance? Scientometrics 2018, 117, 1513–1534. [Google Scholar] [CrossRef]
- Valderrama, P.; Escabias, M.; Jiménez-Contreras, E.; Rodríguez-Archilla, A.; Valderrama, M.J. Proposal of a stochastic model to determine the bibliometric variables influencing the quality of a journal: Application to the field of Dentistry. Scientometrics 2018, 115, 1087–1095. [Google Scholar] [CrossRef]
- Hirsch, J.E. An index to quantify an individual’s scientific research output. Proc. Natl. Acad. Sci. USA 2005, 102, 16569–16572. [Google Scholar] [CrossRef] [Green Version]
- Seber, G.A.; Lee, A.J. Linear Regression Analysis; John Wiley & Sons: Hoboken, NJ, USA, 2012; Volume 329. [Google Scholar]
- Drucker, H.; Burges, C.J.; Kaufman, L.; Smola, A.; Vapnik, V. Support vector regression machines. Adv. Neural Inf. Process. Syst. 1997, 9, 155–161. [Google Scholar]
- Friedman, J.H. Greedy function approximation: A gradient boosting machine. Ann. Stat. 2001, 29, 1189–1232. [Google Scholar] [CrossRef]
- Pedregosa, F.; Varoquaux, G.; Gramfort, A.; Michel, V.; Thirion, B.; Grisel, O.; Blondel, M.; Prettenhofer, P.; Weiss, R.; Dubourg, V.; et al. Scikit-learn: Machine Learning in Python. J. Mach. Learn. Res. 2011, 12, 2825–2830. [Google Scholar]
- Nagelkerke, N.J. A note on a general definition of the coefficient of determination. Biometrika 1991, 78, 691–692. [Google Scholar] [CrossRef]
- Falagas, M.E.; Kouranos, V.D.; Arencibia-Jorge, R.; Karageorgopoulos, D.E. Comparison of SCImago journal rank indicator with journal impact factor. FASEB J. 2008, 22, 2623–2628. [Google Scholar] [CrossRef] [PubMed]
- Laakso, M.; Welling, P.; Bukvova, H.; Nyman, L.; Björk, B.C.; Hedlund, T. The development of open access journal publishing from 1993 to 2009. PLoS ONE 2011, 6, e20961. [Google Scholar] [CrossRef]
- Lawrence, S. Free online availability substantially increases a paper’s impact. Nature 2001, 411, 521. [Google Scholar] [CrossRef]
- Norris, M.; Oppenheim, C.; Rowland, F. The citation advantage of open-access articles. J. Am. Soc. Inf. Sci. Technol. 2008, 59, 1963–1972. [Google Scholar] [CrossRef] [Green Version]
- PLoS Medicine Editors. The impact factor game. PLoS Med. 2006, 3, e291. [Google Scholar]
- Shanta, A.; Pradhan, A.; Sharma, S. Impact factor of a scientific journal: Is it a measure of quality of research? J. Med. Phys. Assoc. Med. Phys. India 2013, 38, 155. [Google Scholar] [CrossRef]
- Bornmann, L.; Daniel, H.D. What do citation counts measure? A review of studies on citing behavior. J. Doc. 2008, 64, 22–418. [Google Scholar] [CrossRef]
- Bornmann, L.; Marx, W.; Gasparyan, A.Y.; Kitas, G.D. Diversity, value and limitations of the journal impact factor and alternative metrics. Rheumatol. Int. 2012, 32, 1861–1867. [Google Scholar] [CrossRef] [PubMed]
- Vuong, Q.H. Breaking barriers in publishing demands a proactive attitude. Nat. Hum. Behav. 2019, 3, 1034. [Google Scholar] [CrossRef] [Green Version]
- Vuong, Q.H. Reform retractions to make them more transparent. Nature 2020, 582, 149. [Google Scholar] [CrossRef]
- da Silva, J.A.T.; Vuong, Q.H. The right to refuse unwanted citations: Rethinking the culture of science around the citation. Scientometrics 2021, 126, 5355–5360. [Google Scholar] [CrossRef] [PubMed]
- Vuong, Q.H. The (ir) rational consideration of the cost of science in transition economies. Nat. Hum. Behav. 2018, 2, 5. [Google Scholar] [CrossRef]
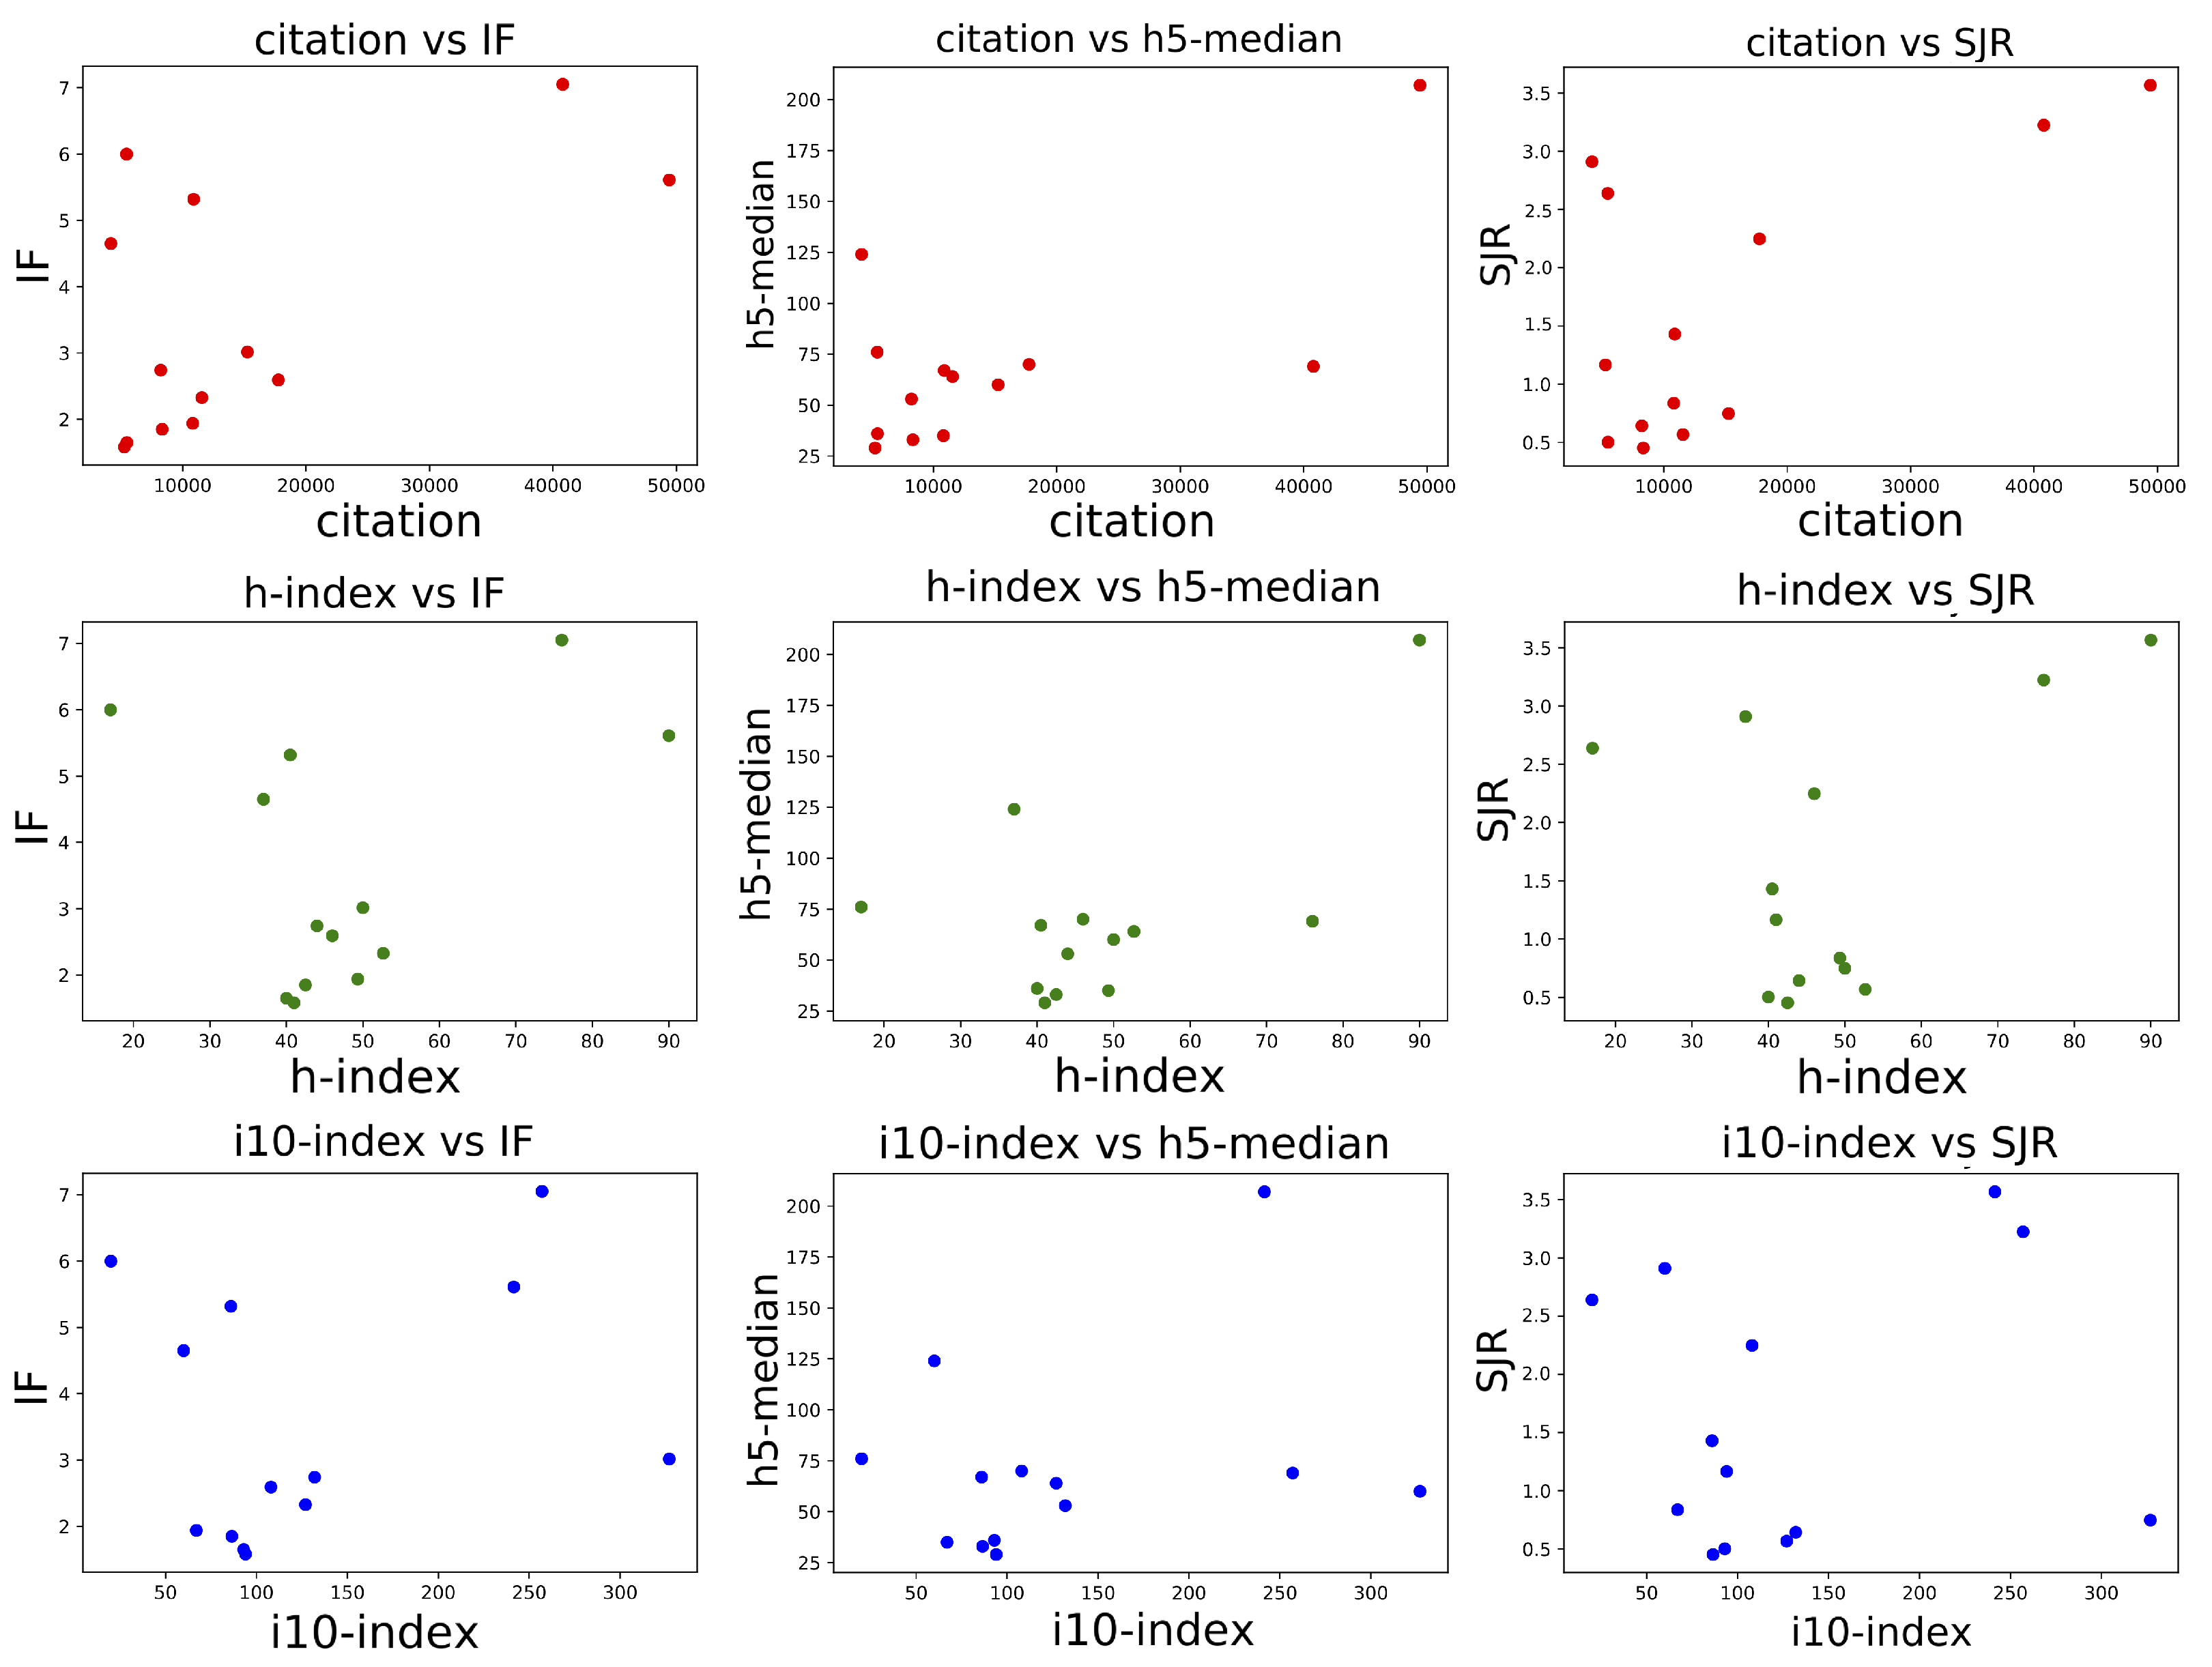
Figure 1.
Plots of the BCB journal’s SJR, IF, and h5-median against various scholarly metrics of EiC.
Figure 1.
Plots of the BCB journal’s SJR, IF, and h5-median against various scholarly metrics of EiC.

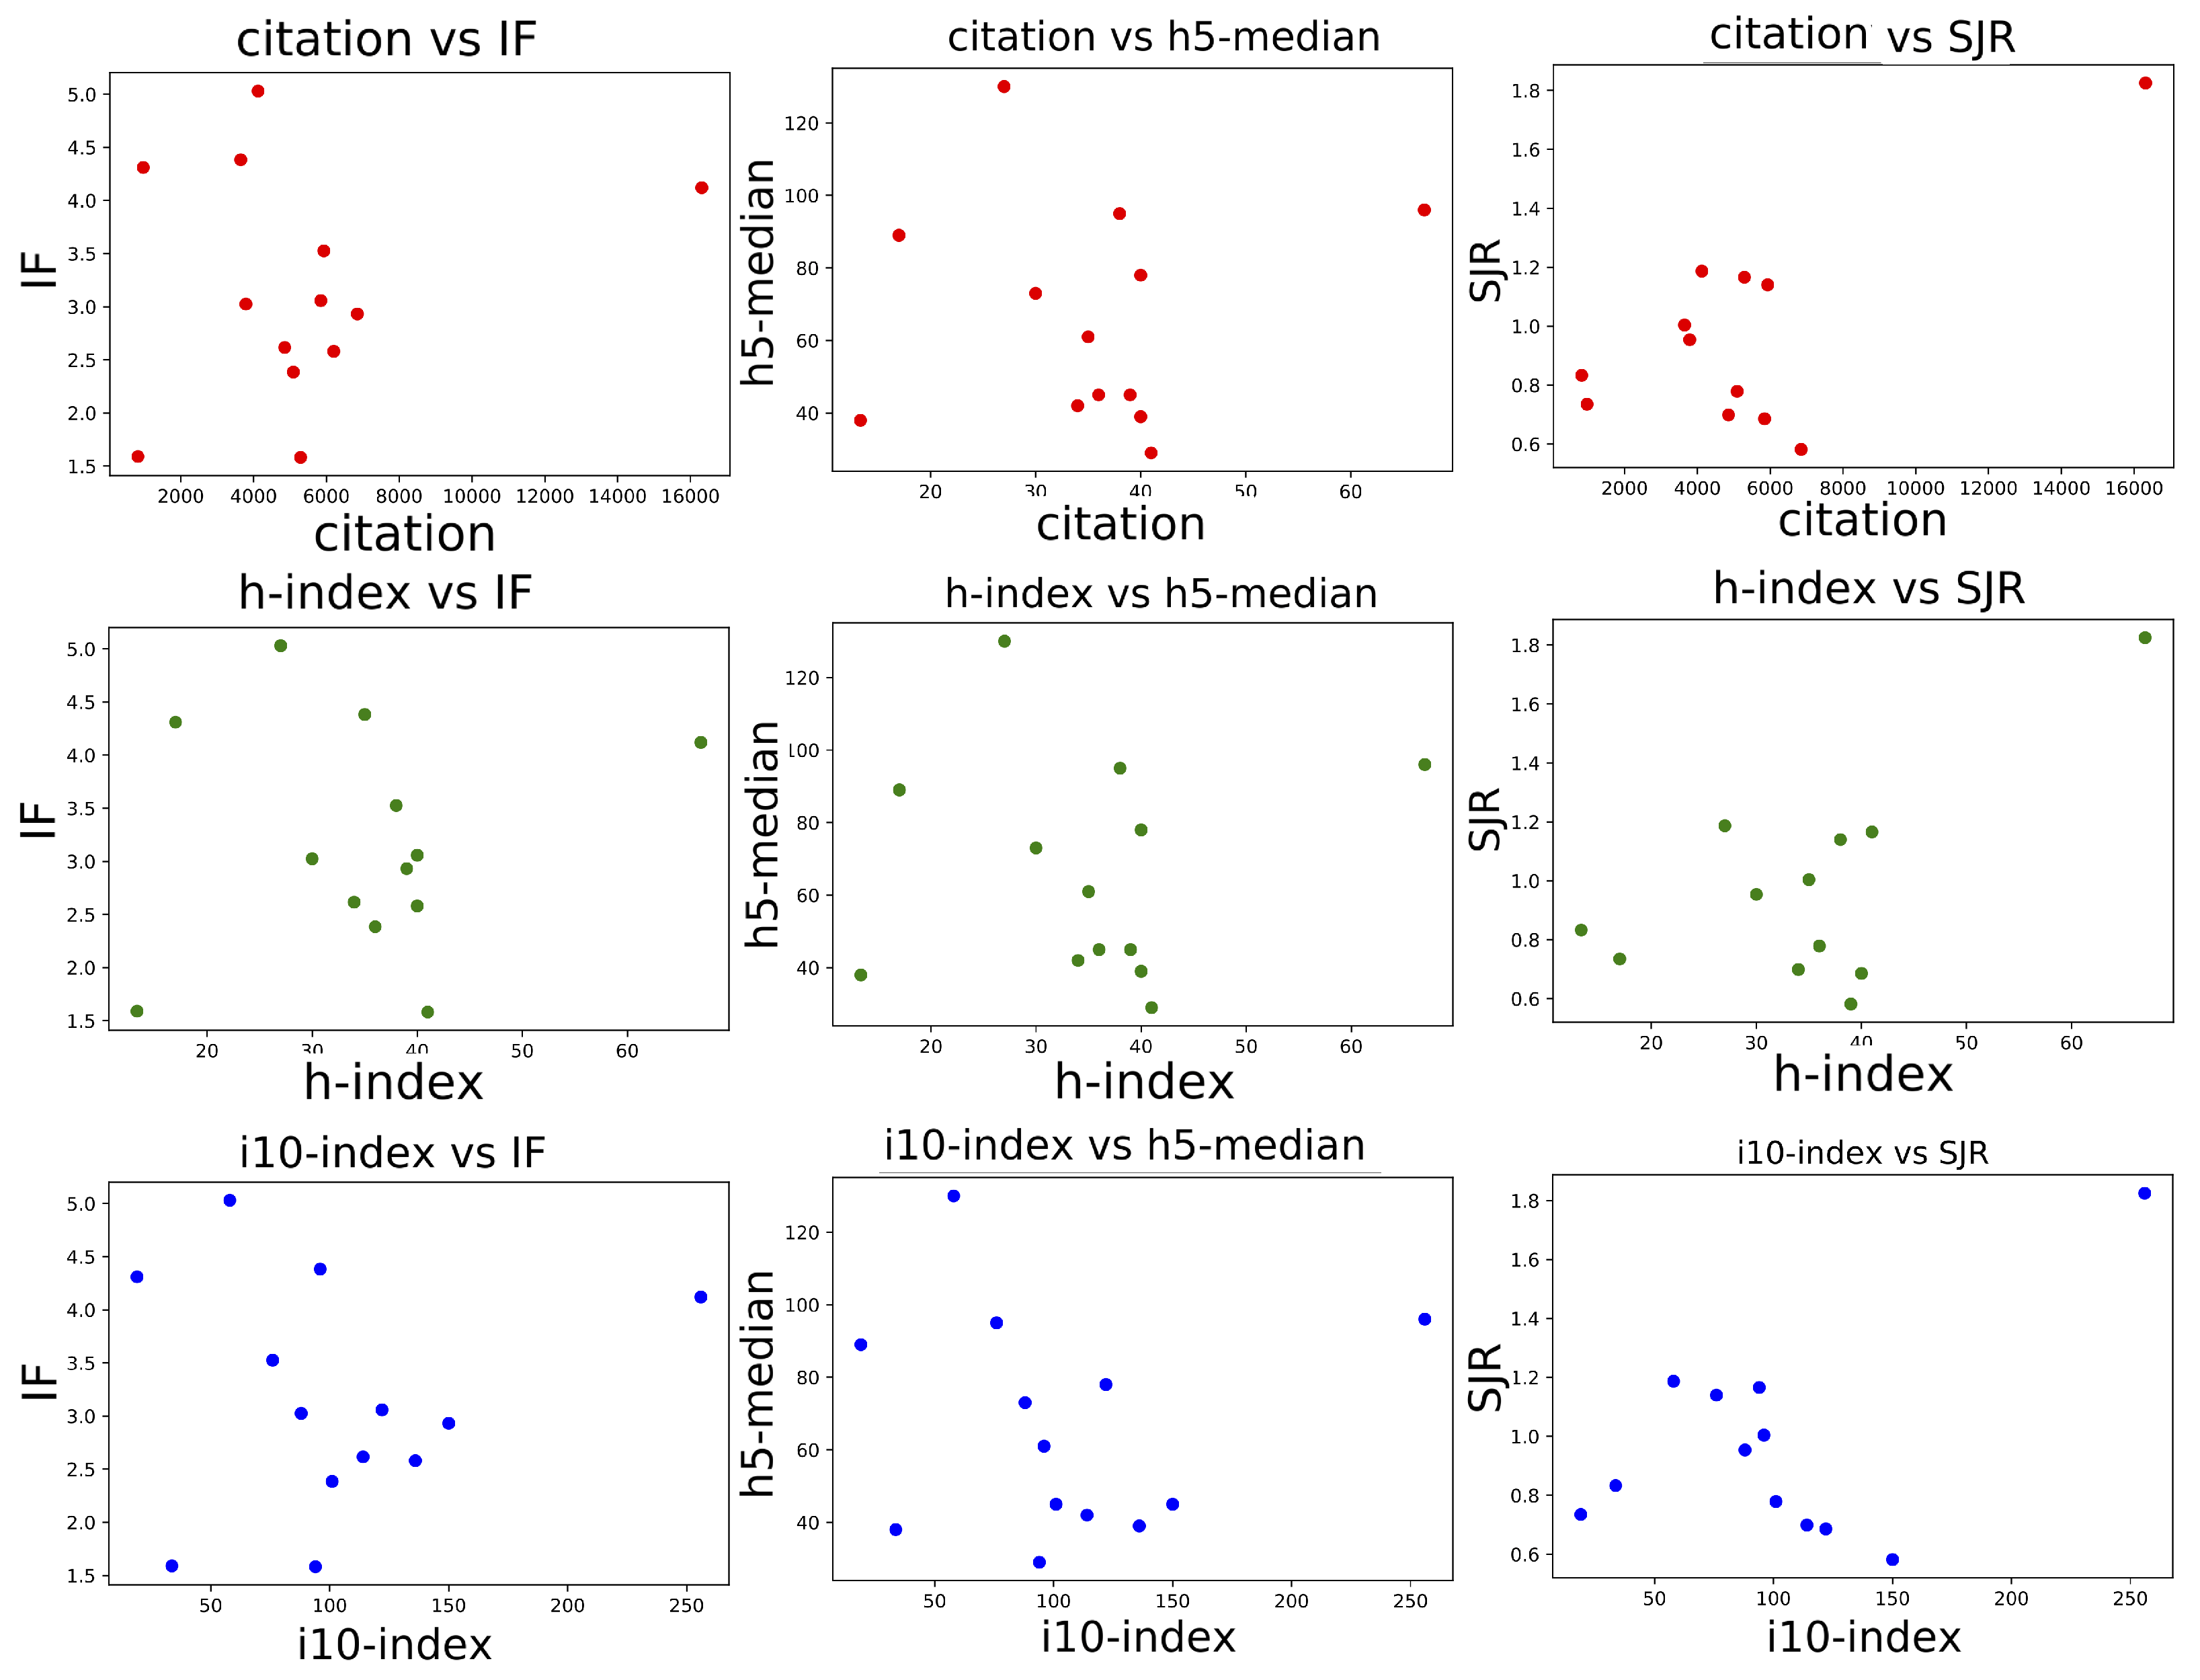
Figure 2.
Plots of MI journal’s SJR, IF, and h5-median against various scholarly metrics of EiC.

Figure 3.
Pairs of EiC and journal scientometric indices used for correlation analysis.


Table 1.
Various statistics of the scientometric indices of top BCB and MI journals.
| Domain | Measure | Journal Scientometric | |||
|---|---|---|---|---|---|
| Index | |||||
| h5-Index | h5-Median | SJR | IF | ||
| Mean | 45.85 | 71 | 1.61 | 3.67 | |
| BCB | Median | 41 | 64 | 1.17 | 2.80 |
| STD | 28.72 | 47.93 | 1.15 | 2.03 | |
| Mean | 46.76 | 66.15 | 0.94 | 3.16 | |
| MI | Median | 39 | 61 | 0.83 | 3.03 |
| STD | 21.51 | 30.17 | 0.348 | 1.07 |
Table 2.
Various statistics of the scholarly metrics of EiCs of top BCB and MI journals.
| Domain | Measure | Scholarly Index of the EiC | ||
|---|---|---|---|---|
| #Citations | h-Index | i10-Index | ||
| Mean | 14,880.57 | 48.15 | 130.69 | |
| BCB | Median | 10,815 | 44 | 94 |
| STD | 14,104.85 | 17.97 | 89.12 | |
| Mean | 5363.948 | 35.17 | 103.35 | |
| MI | Median | 5093 | 36 | 96 |
| STD | 3770.711 | 12.97 | 59.27 |
Table 3.
Correlation scores between various pairs of the EiC and journal-level metrics in BCB journals (p-values are shown inside parentheses).
Table 3.
Correlation scores between various pairs of the EiC and journal-level metrics in BCB journals (p-values are shown inside parentheses).
| Correlation | EiC Scholarly | Journal Metric | ||
|---|---|---|---|---|
| Measure | Metric | |||
| h5-Median | IF | SJR | ||
| citation | 0.32 (0.29) | 0.38 (0.20) | 0.26 (0.39) | |
| Spearman | h-index | 0.08 (0.79) | 0.16 (0.60) | 0.13 (0.67) |
| i10-index | 0.01 (0.97) | 0.13 (0.68) | 0.01 (0.97) | |
| citation | 0.28 (0.20) | 0.33 (0.13) | 0.20 (0.37) | |
| Kendall | h-index | 0.13 (0.59) | 0.13 (0.59) | 0.05 (0.86) |
| i10-index | 0.0 (1.05) | 0.102 (0.68) | 0.02 (0.95) |
Table 4.
Correlation between various pairs of the EiC and journal-level metrics in MI Journal (p-values are shown inside parentheses).
Table 4.
Correlation between various pairs of the EiC and journal-level metrics in MI Journal (p-values are shown inside parentheses).
| Correlation | EiC Scholarly | Journal Metric | ||
|---|---|---|---|---|
| Measure | Metric | |||
| h5-Median | IF | SJR | ||
| citation | 0.11 (0.73) | −0.06 (0.84) | 0.07 (0.83) | |
| Spearman | h-index | −0.07 (0.83) | −0.14 (0.67) | 0.15 (0.65) |
| i10-index | −0.11 (0.72) | −0.13 (0.68) | −0.20 (0.53) | |
| citation | 0.09 (0.67) | 0.0 (1.05) | 0.03 (0.95) | |
| Kendall | h-index | −0.08 (0.71) | −0.09 (0.74) | 0.12 (0.64) |
| i10-index | −0.12 (0.58) | −0.06 (0.84) | −0.21 (0.38) |
Table 5.
The performances of regression models for predicting SJR utilizing various input features ([1] = citation, [2] = h-index, [3] = i10-index).
Table 5.
The performances of regression models for predicting SJR utilizing various input features ([1] = citation, [2] = h-index, [3] = i10-index).
| Domain | Features | LR | SVR | GBR | ||||
|---|---|---|---|---|---|---|---|---|
| RMSE | MAE | RMSE | MAE | RMSE | MAE | |||
| [1,2] | 0.77 | 0.56 | 0.51 | 0.91 | 0.85 | 0.95 | 0.85 | |
| BCB | [1,3] | 1.08 | 0.84 | 0.04 | 0.91 | 0.85 | 1.04 | 0.92 |
| [2,3] | 1.47 | 1.30 | −0.79 | 1.19 | 1.03 | 0.99 | 0.95 | |
| [1,2,3] | 0.73 | 0.57 | 0.55 | 0.92 | 0.84 | 1.01 | 0.84 | |
| [1,2] | 0.45 | 0.33 | −0.95 | 0.40 | 0.29 | 0.42 | 0.33 | |
| [1,3] | 0.29 | 0.24 | 0.20 | 0.39 | 0.29 | 0.39 | 0.20 | |
| MI | [2,3] | 0.45 | 0.31 | −0.96 | 0.31 | 0.197 | 0.37 | 0.21 |
| [1,2,3] | 0.41 | 0.31 | −0.63 | 0.40 | 0.30 | 0.38 | 0.20 |
Table 6.
The performances of regression models for IF predictions utilizing various input features ([1] = citation, [2] = h-index, [3] = i10-index).
Table 6.
The performances of regression models for IF predictions utilizing various input features ([1] = citation, [2] = h-index, [3] = i10-index).
| Domain | Features | LR | SVR | GBR | ||||
|---|---|---|---|---|---|---|---|---|
| RMSE | MAE | RMSE | MAE | RMSE | MAE | |||
| [1,2] | 1.28 | 1.04 | 0.51 | 1.81 | 1.50 | 2.11 | 1.87 | |
| BCB | [1,3] | 2.05 | 1.93 | −0.27 | 1.81 | 1.50 | 2.07 | 1.77 |
| [2,3] | 2.89 | 2.50 | −1.51 | 1.97 | 1.63 | 2.00 | 1.57 | |
| [1,2,3] | 1.43 | 1.22 | 0.39 | 1.81 | 1.48 | 2.03 | 1.54 | |
| [1,2] | 1.48 | 1.20 | −1.09 | 1.24 | 1.022 | 1.56 | 1.36 | |
| MI | [1,3] | 1.19 | 1.00 | −0.35 | 1.24 | 1.02 | 1.58 | 1.38 |
| [2,3] | 1.45 | 1.19 | −1.00 | 1.12 | 0.91 | 1.86 | 1.71 | |
| [1,2,3] | 1.49 | 1.18 | −1.12 | 1.22 | 1.02 | 1.67 | 1.49 |
Publisher’s Note: MDPI stays neutral with regard to jurisdictional claims in published maps and institutional affiliations. |
© 2021 by the author. Licensee MDPI, Basel, Switzerland. This article is an open access article distributed under the terms and conditions of the Creative Commons Attribution (CC BY) license (https://creativecommons.org/licenses/by/4.0/).
Share and Cite
MDPI and ACS Style
Sazzed, S. Association between the Rankings of Top Bioinformatics and Medical Informatics Journals and the Scholarly Reputations of Chief Editors. Publications 2021, 9, 42. https://doi.org/10.3390/publications9030042
AMA Style
Sazzed S. Association between the Rankings of Top Bioinformatics and Medical Informatics Journals and the Scholarly Reputations of Chief Editors. Publications. 2021; 9(3):42. https://doi.org/10.3390/publications9030042
Chicago/Turabian StyleSazzed, Salim. 2021. "Association between the Rankings of Top Bioinformatics and Medical Informatics Journals and the Scholarly Reputations of Chief Editors" Publications 9, no. 3: 42. https://doi.org/10.3390/publications9030042
Note that from the first issue of 2016, this journal uses article numbers instead of page numbers. See further details here.