Article

Impact of Land Cover Change on Ecosystem Services in a Tropical Forested Landscape

1
Institute for Technology and Resources Management in the Tropics and Subtropics, TH Köln—University of Applied Sciences, Betzdorfer Straße 2, 50679 Cologne, Germany
2
College of Applied Sciences, Tribhuvan University, Kathmandu 44613, Nepal
3
The State Key Laboratory of Remote Sensing Science, Institute of Remote Sensing and Digital Earth, Chinese Academy of Sciences (CAS), No.20 Datun Road, Chaoyang District, Beijing 100101, China
4
Center for International Forestry Research (CIFOR), Jalan CIFOR, Situ Gede, Sindang Barang, Bogor 16115, Indonesia
5
School of Ecosystem and Forest Sciences, The University of Melbourne, Carlton, VIC 3010, Australia
6
Faculty of Humanities and Social Sciences, Mahendra Ratna Multiple Campus, Ilam 57300, Nepal
7
Ernst Moritz Arndt University Greifswald Institute of Botany and Landscape Ecology Soldmannstr, 15 D-17487 Greifswald, Germany
8
Institute for Agriculture and the Environment, University of Southern Queensland, West St, Darling Heights, QLD 4350, Australia
9
School of Business, La Trobe University, Melbourne 3072, Australia
10
Kathmandu Forestry College, Tribhuvan University, Kathmandu 44600, Nepal
*
Author to whom correspondence should be addressed.
Resources 2019, 8(1), 18; https://doi.org/10.3390/resources8010018
Submission received: 29 October 2018 / Revised: 23 December 2018 / Accepted: 9 January 2019 / Published: 13 January 2019

Abstract

:
Ecosystems provide a wide range of goods, services or ecosystem services (ES) to society. Estimating the impact of land use and land cover (LULC) changes on ES values (ESV) is an important tool to support decision making. This study used remote sensing and GIS tools to analyze LULC change and transitions from 2001 to 2016 and assess its impact on ESV in a tropical forested landscape in the southern plains of Nepal. The total ESV of the landscape for the year 2016 is estimated at USD 1264 million year−1. As forests are the dominant land cover class and have high ES value per hectare, they have the highest contribution in total ESV. However, as a result of LULC change (loss of forests, water bodies, and agricultural land), the total ESV of the landscape has declined by USD 11 million year−1. Major reductions come from the loss in values of climate regulation, water supply, provision of raw materials and food production. To halt the ongoing loss of ES and maintain the supply and balance of different ES in the landscape, it is important to properly monitor, manage and utilize ecosystems. We believe this study will inform policymakers, environmental managers, and the general public on the ongoing changes and contribute to developing effective land use policy in the region.

1. Introduction

Ecosystems provide a wide range of valuable goods and services that contribute to supporting nature and human well-being [1]. These goods and services that are commonly known as ecosystem services (ES) are categorized into provisioning (e.g., marketable goods), supporting (e.g., nutrient cycling), regulating (e.g., water and soil regulation), and cultural services (e.g., recreational and aesthetic values). These services maintain the ecological processes and functions and provide resources to support the life of all organisms. Depending upon the type and conditions, ecosystems deliver unique sets of services with varying quality and quantity. For instance, a forest ecosystem provides a different set of services than grassland or aquatic ecosystem [2], and an intact forest provides different ecosystem services to that of degraded forests [3]. The important contribution of recognizing ES is that it reframes the relationships between humans and nature to support biodiversity conservation, ecosystem management, and sustainable development [4].
Despite the incredible contribution of ES to support nature and human well-being, ecosystem services globally are experiencing continuous loss due to population growth, urbanization, and expansion of human settlements and agriculture [1]. As the provisioning of ES is directly related to the type of ecosystems, e.g., land use and land cover (LULC) type in a given area, changes in LULC can cause changes in ES [2,5,6]. Thus, unprecedented LULC changes in many parts of the world as a result of natural and anthropogenic activities have resulted in adverse impacts on biodiversity and ecosystems, thereby affecting their ability to provide ES [1,7]. Globally, LULC change has been identified as one of the significant drivers of ES loss [8,9]. Thus, understanding how LULC changes affect ecosystem service values is gaining momentum as a framework to communicate the values and benefits of appropriate land management to policymakers and land planners and managers [10].
Since the Millennium Ecosystem Assessment in 2005, ES research has gained momentum and the science and policy of valuing ES has experienced rapid growth. The Economics of Ecosystems and Biodiversity (TEEB) initiative (2010) and the founding of Intergovernmental Science-Policy Platform on Biodiversity and Ecosystem Services (IPBES) (2012) are prominent examples at the global scale. The economic valuation of ES is becoming a regular practice in ecological economics to improve the basis for political and planning decisions and create a more profound knowledge on the economic importance of ES. This includes, for instance, the assessment of opportunity costs of land degradation or restoration and developing policy tools and incentive mechanisms such as payments for ecosystem services (PES) [2,11]. However, monetary valuation of ES does not imply that they are the exchange values and that all ES cannot be commodified or exchanged in the market as a perfect substitute to other market commodities [8,12,13]. Thus, the valuation is instead an estimate of the benefits of ES to society expressed in units that work as a tool to help raise the awareness on ES importance [8].
The application of remote sensing and GIS tools to map land use and land cover changes have opened new areas for ecosystem service research. Further, methods to quantify ES has also progressed over the years, resulting in a wide range of available methods to value ES [14,15]. Although inconsistencies in the methods create a challenge to include robust values of ES in national accounts, policy making, and decision making, attempts to quantify ES values are ongoing and this contributes to improving our knowledge and experience in the science of ES valuation. In this study, we used remote sensing and geographic information techniques to determine land use and land cover of two different periods and associated ecosystem services values (ESV) with a benefit transfer method using global and local databases. Our study was conducted against the background of a rapidly changing landscape in the southern plains of Nepal; it is the first total economic valuation of ES in the region.
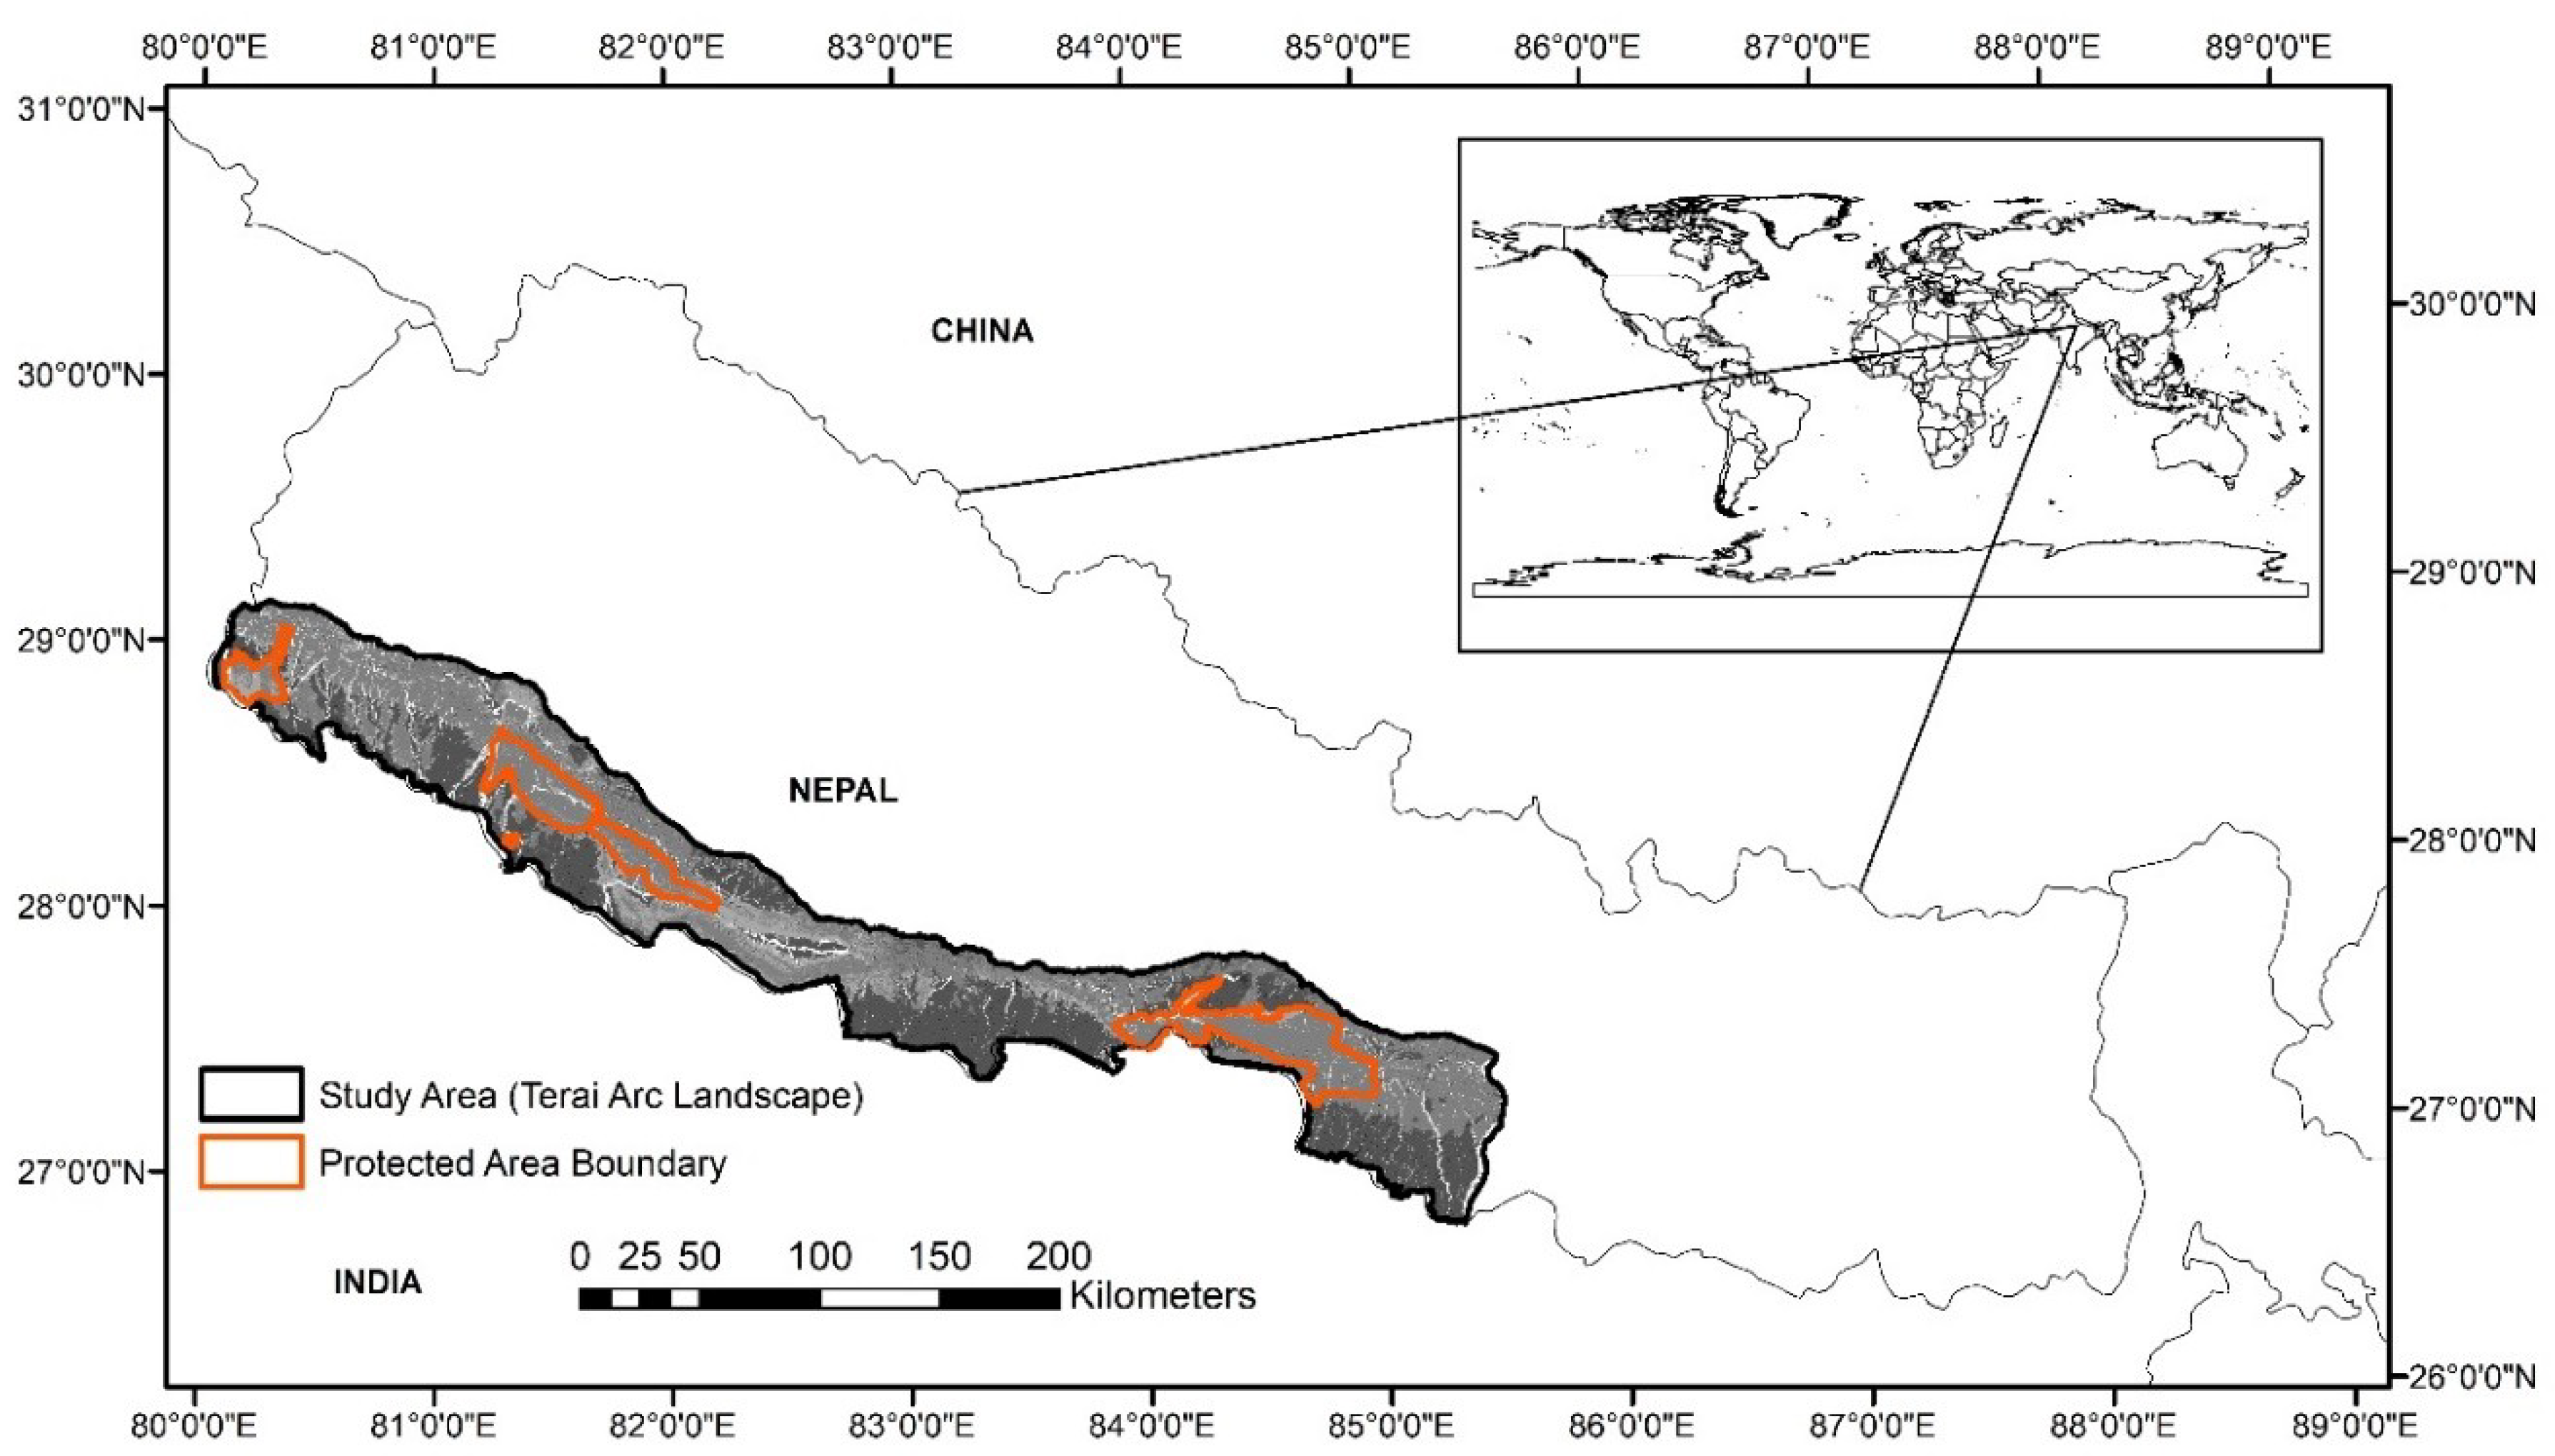
Although Nepal has significantly improved on biodiversity and ecosystem conservation, implementation of ecosystem services concept is limited in Nepal (e.g., only independent project-based PES schemes that focus mainly on water-related services). In recent years, the Government of Nepal has taken several steps towards broader application of ES concept. For instance, the recognition of the economic value of ES in the current national development plan and the preparation of a national policy on Payment of Ecosystem Services (PES). However, integration of the full range of ES into policy and planning for conservation and management of natural resources is still lacking, the result of which is significant loss and trade-offs in ES. This study aimed to analyze land use change, and its impact on ES in Terai Arc Landscape, a program implemented in 2001 to conserve biodiversity and ecosystems and support sustainable livelihoods in the southern plains of Nepal. The study output can be valuable knowledge to inform stakeholders about ES changes and provide a base for a fine scale local level estimation in the future.

2. Materials and Methods

2.1. Study Area

The Terai Arc Landscape (TAL) of lowland Nepal was selected as the study area (Figure 1) as it is a region of very high ecological importance that has experienced rapid LULC changes in the recent past and is exposed to ongoing land use pressure [16]. The landscape was introduced by the Government of Nepal in 2001 as the TAL program and is located in the southernmost part of Nepal. It stretches over 18 districts, within which six protected areas are located. TAL is also a region with high pressure from infrastructure development, population migration and urbanization. The climate of the TAL region ranges from tropical to sub-tropical with maximum daily temperature during the summer months of around 35 °C. The rainy season between June and September is characterized by heavy downpours and often results in severe flooding. TAL is among the most agriculturally productive areas of the country and is characterized by a mosaic of different land use dominated by agriculture and forests.
TAL also includes foothills of Siwalik range, which are important watersheds for maintaining the high agro-productivity of the Terai region. As such, it supports the highest human population densities and is thus among the most productive regions of Nepal. The natural forests in the area belong to Tropical and Subtropical Moist Broadleaf Forests (TSMF) biome. Shorea robusta Gaertner f., also known as sal is the dominant tree species. Other common tree species include Adina cordifolia (Roxb.) Brandis, Albizia spp., Anthocephalus chinensis Walp., Butea frondosa Willd., and Dillenia pentagyna Roxb. The six protected areas include five national parks as well as a conservation area. These national parks cover an area of 340,932 ha or about 13% of the landscape and are reinforced with adjacent buffer zones that cover 212,880 ha or about 8% of the landscape. Major cities such as Birendranagar, Bharatpur, Birgunj, Dhangadi, Sandikharka, and Tansen are located in the landscape. According to the 2011 census, more than 7.5 million people live in the TAL region, which is about 28% of the national population of 26.5 million [17]. Agriculture, employment, and remittance are the major sources of income for households. Many people depend upon natural resources for food, fodder, and fuel, and the region itself is a hub for tourism, land use and the resulting ES changes directly affects the people.

2.2. Land Use and Land Cover (LULC) Classification

We used freely available time series Landsat imagery for 2001 and 2016: maximum cloud-free Landsat 7 Enhanced Thematic Mapper (ETM+) for 2001 and Landsat 8 Operational Land Imager images (OLI) of 2016 from the United State Geological Survey (USGS) (https://earthexplorer.usgs.gov). In the study, altogether eight scenes (Path/Row:141/41, 142/41, 143/41 and 144/40) were used (Table 1).
All images were verified for geometric accuracy and processed, classified, and analyzed in ENVI environment [18]. We developed six LULC classes: agriculture, forests, shrublands, water bodies, urban (settlements and built-up) and barren lands (Table 2). A supervised approach, maximum likelihood algorithms, a widely used classification technique in remote sensing, was used for LULC classification [16]. High-resolution images from Google Earth (http://earth.google.com) and ground-truth Global Positioning System data during field visits in 2016 were used for collecting training samples for the classification. Furthermore, a topographic map developed by survey department of in the scale of 1:25,000 was used for the verification of our result. The LULC accuracy assessment was verified using random sampling points and at minimum 50 (altogether 300 sample point from each class for all tile) sample point were sampled per LULC class per tile. The overall classification accuracy for 2001 and 2016 were measured as 86% to 88%, respectively.
ES have been classified in a number of ways [19]. Among the most widely used are those of the Millennium Ecosystem Assessment (MEA), the Economics of Ecosystems & Biodiversity (TEEB) classification, and the Common International Classification for Ecosystem Services (CICES), proposed by the European Environment Agency [20]. In this study, we used the classification proposed by the MEA using categories of provisioning, regulating, cultural, and supporting services (Table 3).

2.3. Estimation of Value of Ecosystem Services and Changes in Value Due to Land Use and Land Cover Changes

There are various direct and indirect methods to value ecosystem services, each with strengths and weaknesses, precision and accuracy, and time and resource requirements [21,22]. In this study, benefit transfer method was used to extrapolate the ecosystem services values to the landscape. Benefit transfer is a process in which the existing values and other information from the original study are used to estimate ESVs of other similar location in the absence of site-specific valuation data [2,23]. We used the method because it is highly cost-effective [24]. We used two types of ecosystem service value (ESV) coefficients for the LULC types. The first was global ecosystem coefficients adopted from Costanza et al., where the authors proposed and employed 17 types of ESV for 16 biomes [2]. Each of the six LULC types of our study was then compared with the representative biomes of Costanza et al. For the second type of coefficients, the values from the Economics of Ecosystems and Biodiversity (TEEB) valuation database were used [25]. The database contains original values compiled from local studies across the world. We only considered values from LULC types from tropical areas similar to our geographical setting (Indo-Malayan biogeographical realm) to ensure the applicability of transferred data from the TEEB database. To facilitate the estimation process of ESV changes, all value coefficients were converted to 1994 USD per hectare per year using inflation factor to consider the time effect of value (Table 4 and Table 5). The approach of directly using the global value coefficients with a combination of modified values have been applied by several studies [5,23,26,27,28].
The LULC data of the two reference years were prepared, and the corresponding area in hectare was calculated in a GIS environment. The value coefficients were assigned to each LULC type on the basis of the global values used by Costanza [2] and the modified coefficients from TEEB (Table 4 and Table 5). We then multiplied each LULC class (in hectare) to its corresponding value coefficients to calculate the total ecosystem services value (ESV) for each particular LULC class. Finally, the values for the LULC class for each year were summed to estimate the total ESV of the landscape for each year.
ESV i =   ( A k i × VC k )
where ESVi is the total estimated ecosystem service value of the ith year, Aki is the area (ha) of LULC class k of ith year and VCk is the value coefficient for LULC class k (expressed in USD ha−1 year−1).
In addition, we also estimated the values of each ecosystem services within the landscape by using the following equation (Equation (2)).
ESV f =   ( A k i × VC f k )
where ESVf is the estimated ecosystem service value of function f, Aki is the area (ha) of LULC class k of ith year and VCfk is the value coefficient of function f for LULC class k.
Finally, the changes in the ESV were calculated as the differences in the estimated values in each reference year. The percentage changes were calculated using the following equation:
Percentage   ESV   change = ESV ( Final   year ) ESV ( Initial   year ) ESV ( Final   year ) × 100
Positive values of the percentage change indicate an increase in the total amount of values, whereas negative values imply a decrease in the values.

3. Results

3.1. Land Use and Land Cover Change Analysis

In 2016, the dominant LULC types in TAL were forests (44%) and agriculture (35%) (Figure 2). We can see the LULC in the landscape changed substantially between 2001 and 2016 (Table 6) and there were several transitions between the LULC types (Table 7). There was a significant increase in the urban areas of 26,226 ha, all of which was converted from agricultural lands. Agriculture was also converted to forests (29,300 ha) and shrublands (20,200 ha). In other areas, forests (19,400 ha), shrublands (37,700 ha), and barren lands (15,600 ha) were also converted to agriculture. Accordingly, the highest net loss was experienced by agricultural land (loss of 29,247 ha). Although forests gained cover in some areas, considerable degradation and deforestation occurred in others, resulting in a net loss of 8740 ha of forests. The loss could be due to a range of factors including agricultural expansion, overgrazing, over-harvesting of forest products, forest fires, invasion by alien plant species, landslides and floods, and infrastructure development [29,30].
Additionally, we found that the coverage of water bodies decreased by 2015 ha. The rivers and streams transverse the southern plains and flow with full discharge during the monsoon, thereby depositing silt, sand and other sediments along the banks, which could have resulted in detection of no water in these areas. Thus, the loss in the area of water bodies as seen between 2001 and 2016 in our study may not reflect a permanent decline in water resources.

3.2. Estimation of Ecosystem Services Values and Changes

The total value of ES in TAL was estimated at USD 1264 million year−1 in 2016. As the majority of TAL is covered with forests that deliver high ES values per hectare (USD 871 ha−1 year−1), we found that, in 2016, the forests in TAL delivered the highest ES value of USD 996 million year−1, i.e. 78.8% of the total ES value of the landscape (Table 8). The water ecosystems, which cover only 1% of the area, had the second largest contribution of USD 102 million year−1, accounting for 8% of the total value. In 2016, agriculture land occupied 35% of the total land and contributed USD 85 million year−1. Similarly, shrubland ecosystem that includes shrubs and grasslands contributed USD 81 million year−1. TAL is an important area for biodiversity conservation and provides habitat services for many species, however we did not have valuation data for habitat services. In addition, we did not have valuation data for barren lands that may have water conservation and carbon storage values. Thus, we believe that the value of total ES in TAL is almost certainly an underestimate.
However, the land use change during the 15 years resulted in the net loss of USD 11 million year−1 worth of ES. The highest value losses were from forests (USD 8 million year−1), followed by water bodies (USD 5 million year−1) and agriculture (USD 3 million year−1). On the other hand, there was a gain in ESV of USD 4 million year−1 from the increase in shrublands (Table 8). Furthermore, assessing the impact of LULC changes on each ecosystem services showed varying levels of ESV losses. The results show that LULC changes have diverse effects on each of the different ecosystem services; that is, while some ecosystem service increased marginally (e.g., gas regulation and waste treatment), all others decreased (Table 9). In the observed period (2001–2016), the greatest ESV loss was from water supply (USD 4 million year−1), followed by raw materials (USD 3 million year−1) and climate regulation (USD 2 million year−1). Only waste treatment and gas regulation increased marginally (see percentage change, as the values in Table 9 are rounded).

4. Discussion

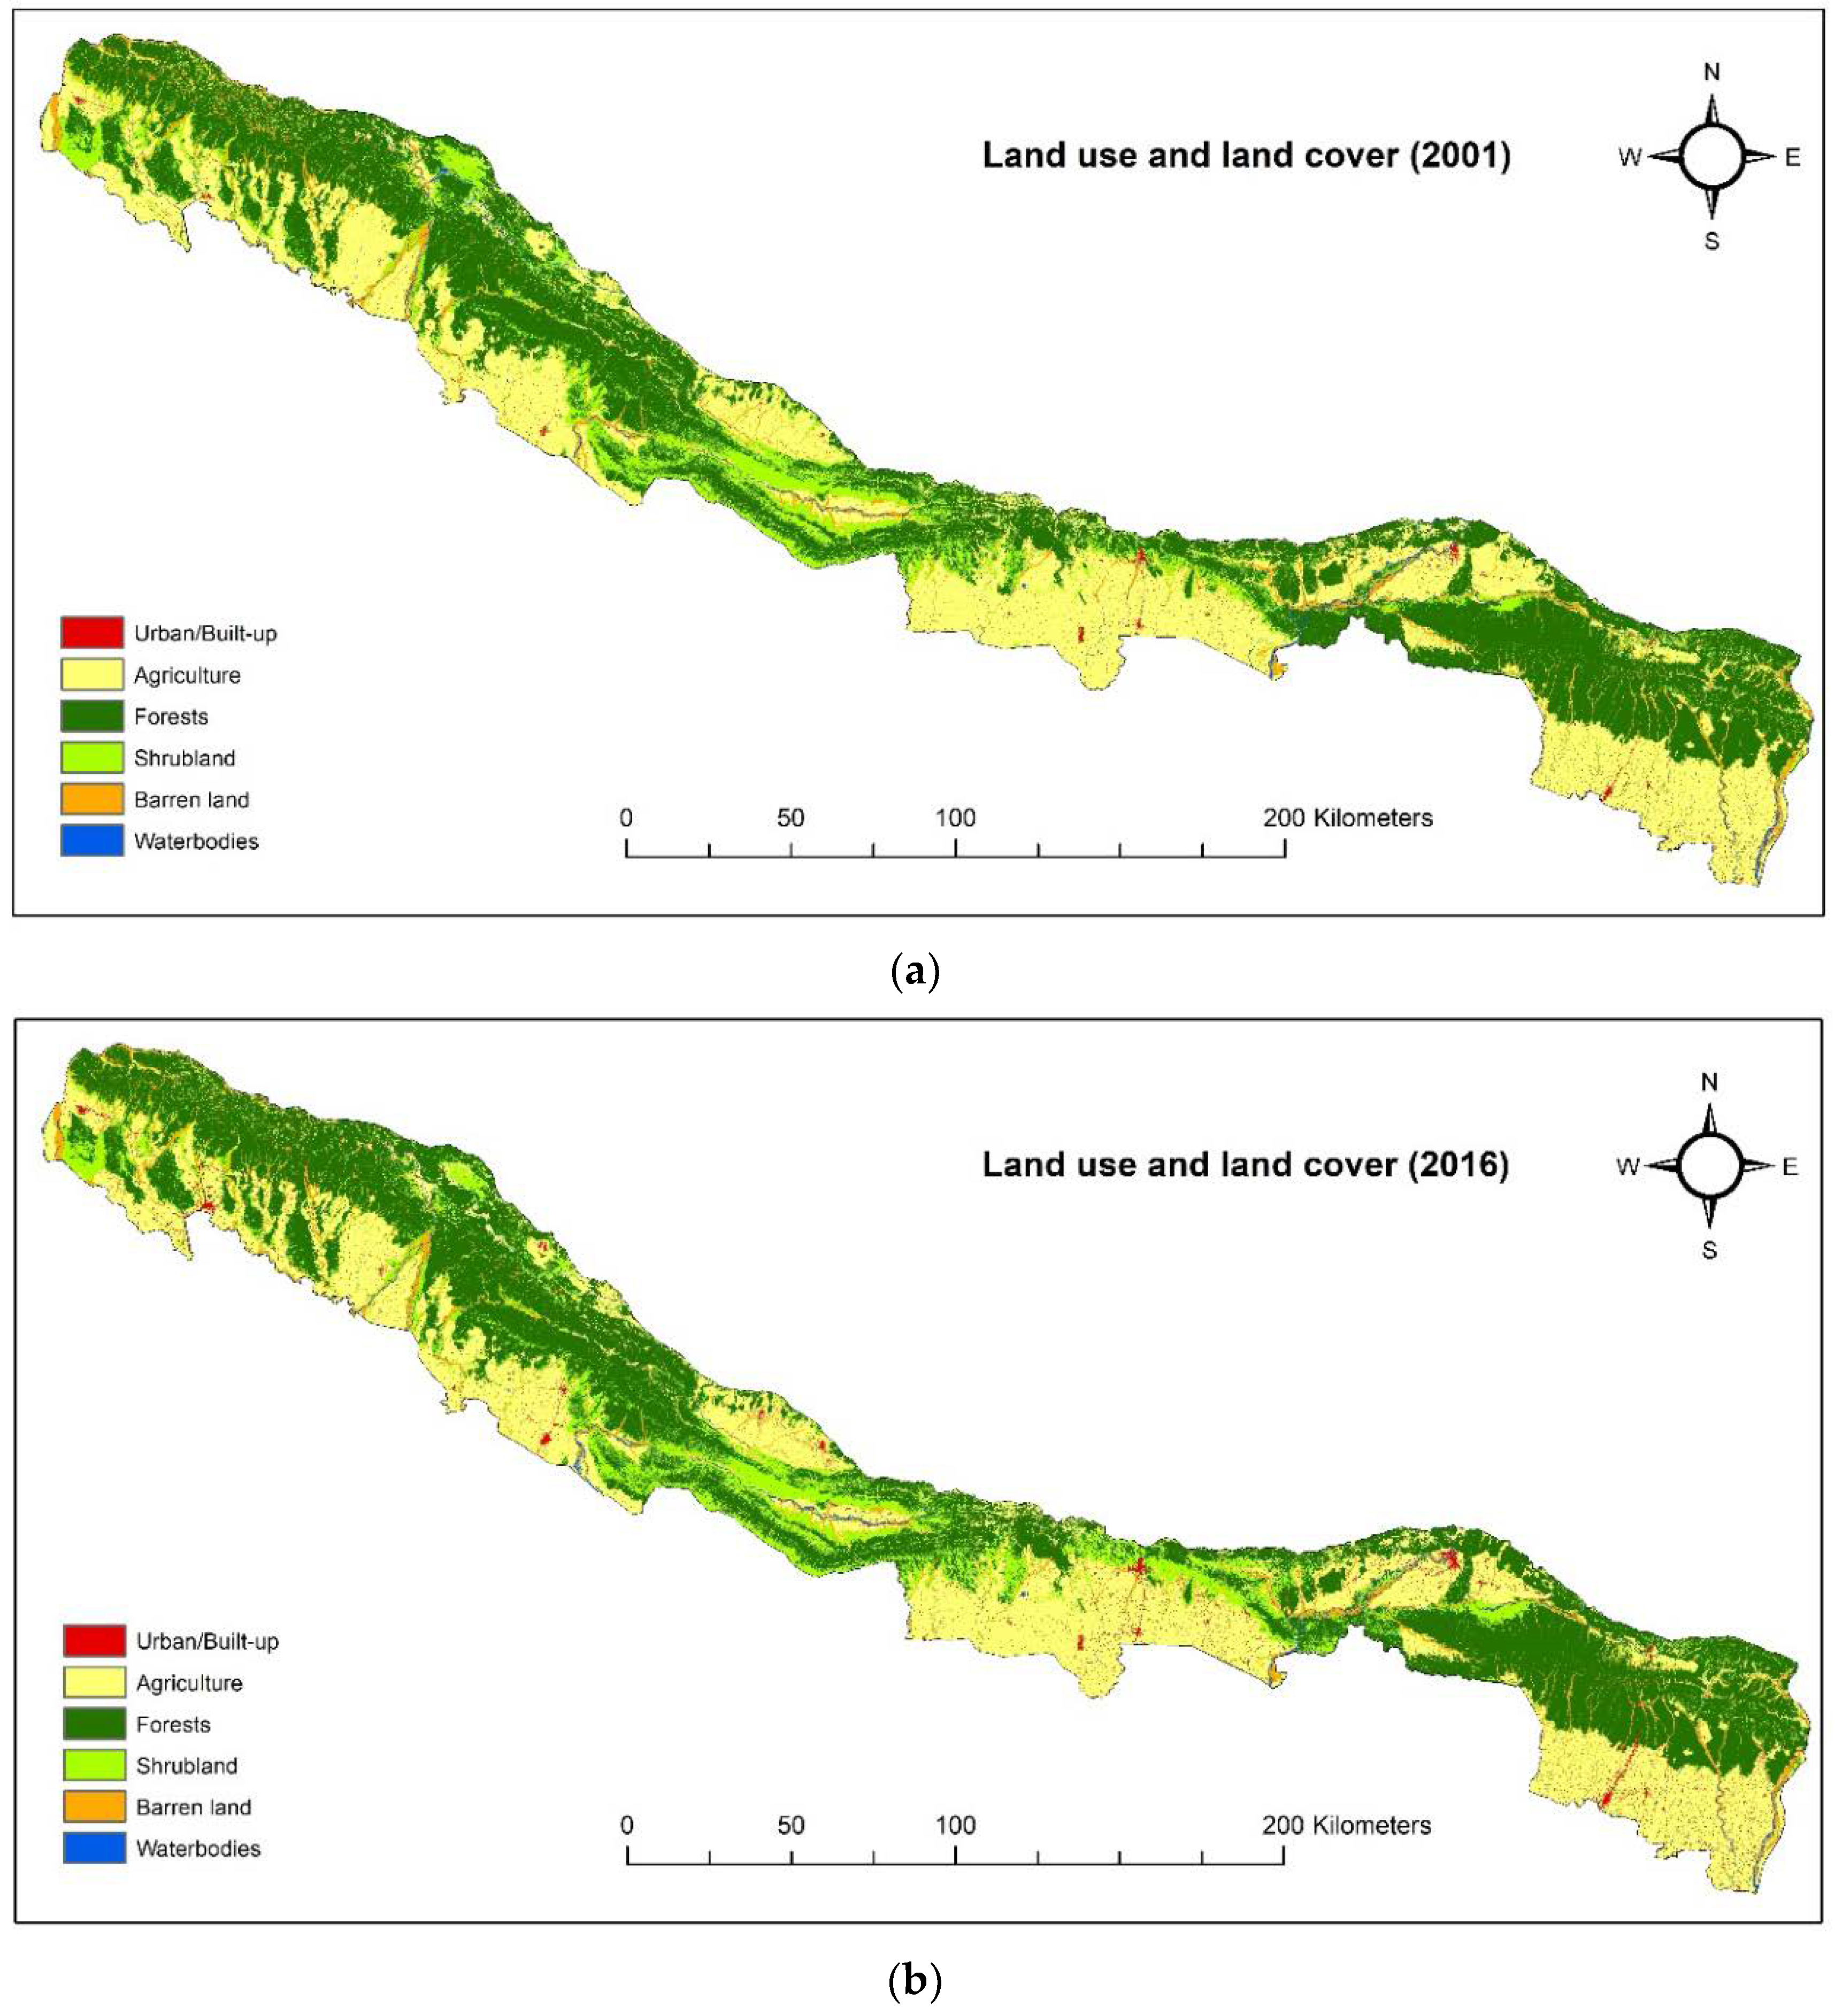
In this study, we observed the loss of forests, agricultural lands, and water bodies, and a corresponding increase in shrublands and urban areas between 2001 and 2016. The loss of forests and agricultural land in the plains of Nepal conformed with several local and global land change studies [16,31,32]. We found that LULC change in TAL was dynamic and non-linear, meaning that the conversions did not follow similar patterns. The spatial patterns of change showed that, while the formerly cultivated lands were converted to urban areas, the forests in the fringes of the new urban areas were converted to agricultural lands. This implies that rapid urbanization in the landscape caused not only loss of agricultural lands but also a compounding effect on the intact forests due to feedbacks from food insecurity and agricultural incursions. Although TAL program may have contributed in slowing the rate of deforestation and degradation of the tropical forests in the region, forests continue to be converted to shrublands and cultivated lands. Along with anthropogenic factors such as forest encroachment, livestock grazing, and illegal logging, natural factors such as forest fires, droughts, and invasive species continue to threaten natural ecosystems [30] and may have contributed to forest loss and degradation and depletion of water resources in the region.
Forests, the dominant land cover (44% area of TAL), provide a wide variety and high value of ES (USD 871 million ha−1 year−1). However, the total ES values of forests declined between 2001 and 2016, primarily due to forest loss. The decline in ES primarily due to forest loss is consistent with the findings of other studies. In China, the loss of forests was the major contributor to the decline in ES values during the period 1988–2006 [28]. Similarly, the loss of natural forests in Ethiopia has resulted in the decline of values from several ecosystem services [26,33]. The water bodies in the landscape provide a wide range of goods and services that are important for maintaining ecosystems and supporting local income generation. In terms of ES values, the waterbodies provide the highest ES values per ha (USD 2699 million ha−1 year−1). As the ES values decreased substantially due to loss of water resources, their conservation and management can play an important role in conserving and enhancing ES in the region. The Terai region of Nepal is also the food basket of the country and the conversion of prime agricultural lands to urban areas in TAL region can have both local and national implications on food security and socio-economic well-being. As rapid population growth continues in the landscape (that will create higher ES demand), the government should promote effective utilization and management of land to supply and balance ES in the landscape to support the well-being of both nature and people.
As we used simple, less data-intensive methods, there are some limitations of this study. First is the accuracy of land use classification. Although classification accuracies of 86% for 2001 and 88% for 2016 were achieved (which are considered high accuracy in classification techniques), there may still be some minor miscalculations that could have affected the ESV changes. Second is the use of the benefit transfer method that assumes values are constant over the type of ecosystems. However, in reality, most ecosystems are different, and the service beneficiary population vary greatly. In addition, the reliability of the benefit transfer method was not checked. Other similar studies check reliability by computing the Coefficient of Sensitivity (CS) using the standard economic concept of elasticity and adjust the Value Coefficients (VC) by ±50% [26,28,33]. This method considers the values of CS (greater than 1 and less than 1) to determine if the estimated ES value is elastic (greater than 1) or inelastic (less than 1) with respect to that coefficient. However, the same results were acquired while adjusting VC to ±25%. Therefore, as the estimation is independent of the ±50% change and always gives values less than 1, this method does not adequately address the reliability, but rather suggests that the coefficients are robust [34]. Hence, we did not use this method for the reliability check. Thus, the results should be taken as an initial crude estimate. We suggest that another robust method should be applied to generate precise and accurate values.
Nevertheless, our study added to the dimension of local level estimation of ESV by utilizing freely available Landsat images and valuation data from TEEB database that resembled local geographical settings, rather than relying only on global values from Costanza, which could otherwise underestimate or overestimate the economic values of the services. Although similar techniques have generated local values for other regions of the world, e.g., in Africa, studies of this kind are scarce in Asia. Thus, the output of our study will help the local level estimation for other data scarce regions of the world, particularly in the tropical countries of Asia. The estimation of ESV using readily and freely available remote sensing and value data is important in developing countries such as Nepal where historical land use data are not available, and ground data collection is expensive and time-consuming. This valuation will also set a stage for, and facilitate further detailed analysis for precise and accurate information by utilizing extensive data and techniques in the future. The quantitative evaluation of total and individual ESV changes as shown in this study can provide an important avenue for effective land use management decisions for sustaining land resources and optimizing the delivery of important ecosystem services.

5. Conclusions

The estimation of ESV based on LULC changes from different periods is an important indicator of how much services have changed on spatial and temporal scales in the landscape. Our study shows the shifts in the ES values of total and individual ecosystem services in response to LULC changes. We found that the expansion of urban and shrublands at the expense of agricultural lands, forests and water ecosystems during the period of 2001–2016 reduced the total ESV by USD 11 million. As forests represent by far the most significant contributor to ESV and water bodies as high ESV per ha, shifting the current LULC changes by protecting forests and preserving water resources is essential to prevent further loss of ESV. Besides, the loss of agricultural lands shows a growing threat to food security in the rapidly populating landscape. Thus, it is vital to maintaining an appropriate proportion of LULC in a landscape to provide optimal ecosystem services. The valuation of ecosystem services in this study is an attempt to communicate the benefits of ecosystems to both the national stakeholders and the broad audience and open up avenues for further detailed analysis. There are various detailed direct and indirect methods to generate higher accuracy and precision of values but they require time and resources. As our study is a first initial crude estimate based on a simple benefit transfer method, we recommend such a detailed analysis in the future. In addition, the results could be extended by developing future scenarios that consider the population growth and urbanization trend in the landscape and assess their impacts on ES. In addition, analysis of land change before TAL was established could also be useful to assess the effectiveness of the TAL program in ES provision. The management of agricultural lands, forests, and water resources are closely linked and require innovative policy solutions. As our study compared values from different ecosystems, we believe our study will serve as important knowledge for future research and policy formulation in Nepal. We also see that there are many prospects for the government to facilitate Payment for Ecosystem Services (PES) as a strategy to protect ecosystems and improve local livelihoods in the landscape.

Author Contributions

Conceptualization, R.S. and B.R.; methodology, R.S.; software, R.S. and B.R.; validation, R.S., B.R. and H.B.; formal analysis, R.S.; writing—original draft preparation, R.S.; and writing—review and editing, R.S, B.R., H.B., U.N., K.P., S.S., A.A.A., S.R. (Sushila Rijal), S.R. (Surendra Ranpal), R.P.A., and P.K.

Funding

This research received no external funding.

Acknowledgments

We acknowledge the CGIAR research program on Forests Trees and Agroforestry for making this article available to all by sponsoring CIFOR’s payment of the journal’s Open Access fee. We would also like to thank two anonymous reviewers for their comments which helped us to improve the manuscript.

Conflicts of Interest

The authors declare no conflict of interest.

References

  1. MEA. Ecosystems and Human Well-Being: A Framework for Assessment; Island Press: Washington, DC, USA, 2005; Volume 1. [Google Scholar]
  2. Costanza, R.; d’Arge, R.; De Groot, R.; Farber, S.; Grasso, M.; Hannon, B.; Limburg, K.; Naeem, S.; O’neill, R.V.; Paruelo, J. The value of the world’s ecosystem services and natural capital. Nature 1997, 387, 253. [Google Scholar] [CrossRef]
  3. Celentano, D.; Rousseau, G.X.; Engel, V.L.; Zelarayán, M.; Oliveira, E.C.; Araujo, A.C.M.; de Moura, E.G. Degradation of riparian forest affects soil properties and ecosystem services provision in eastern amazon of brazil. Land Degrad. Dev. 2017, 28, 482–493. [Google Scholar] [CrossRef]
  4. Díaz, S.; Demissew, S.; Carabias, J.; Joly, C.; Lonsdale, M.; Ash, N.; Larigauderie, A.; Adhikari, J.R.; Arico, S.; Báldi, A. The IPBES Conceptual Framework—Connecting nature and people. Curr. Opin. Environ. Sustain. 2015, 14, 1–16. [Google Scholar] [CrossRef]
  5. Kreuter, U.P.; Harris, H.G.; Matlock, M.D.; Lacey, R.E. Change in ecosystem service values in the San Antonio area, Texas. Ecol. Econ. 2001, 39, 333–346. [Google Scholar] [CrossRef]
  6. Polasky, S.; Nelson, E.; Pennington, D.; Johnson, K.A. The Impact of Land-Use Change on Ecosystem Services, Biodiversity and Returns to Landowners: A Case Study in the State of Minnesota. Environ. Resour. Econ. 2010, 48, 219–242. [Google Scholar] [CrossRef]
  7. Alcamo, J.; Van Vuuren, D.; Cramer, W.; Alder, J.; Bennett, E.; Carpenter, S.; Christensen, V.; Foley, J.; Maerker, M.; Masui, T. Changes in ecosystem services and their drivers across the scenarios. In Ecosystems and Human Well-Being; Island Press: Washington, DC, USA, 2005; Volume 2, pp. 297–373. [Google Scholar]
  8. Costanza, R.; de Groot, R.; Sutton, P.; Van der Ploeg, S.; Anderson, S.J.; Kubiszewski, I.; Farber, S.; Turner, R.K. Changes in the global value of ecosystem services. Glob. Environ. Chang. 2014, 26, 152–158. [Google Scholar] [CrossRef]
  9. Kubiszewski, I.; Costanza, R.; Anderson, S.; Sutton, P. The future value of ecosystem services: Global scenarios and national implications. Ecosyst. Serv. 2017, 26, 289–301. [Google Scholar] [CrossRef]
  10. Iverson, L.; Echeverria, C.; Nahuelhual, L.; Luque, S. Ecosystem services in changing landscapes: An introduction. Landsc. Ecol. 2014, 29, 181–186. [Google Scholar] [CrossRef]
  11. De Groot, R.; Brander, L.; Van Der Ploeg, S.; Costanza, R.; Bernard, F.; Braat, L.; Christie, M.; Crossman, N.; Ghermandi, A.; Hein, L. Global estimates of the value of ecosystems and their services in monetary units. Ecosyst. Serv. 2012, 1, 50–61. [Google Scholar] [CrossRef] [Green Version]
  12. Costanza, R.; Quatrini, S.; Øystese, S. Response to George Monbiot: The Valuation of Nature and Ecosystem Services is not Privatization. Climate Home News. 2012. Available online: http://www.climatechangenews.com/2012/08/15/response-to-monbiot-valuation-is-not-privatization/ (accessed on 12 August 2018).
  13. Costanza, R. Nature: Ecosystems without commodifying them. Nature 2006, 443, 749. [Google Scholar] [CrossRef] [PubMed]
  14. Bastian, O.; Grunewald, K.; Syrbe, R.-U. Space and time aspects of ecosystem services, using the example of the EU Water Framework Directive. Int. J. Biodivers. Sci. Ecosyst. Serv. Manag. 2012, 8, 5–16. [Google Scholar] [CrossRef] [Green Version]
  15. Turner, K.G.; Anderson, S.; Gonzales-Chang, M.; Costanza, R.; Courville, S.; Dalgaard, T.; Dominati, E.; Kubiszewski, I.; Ogilvy, S.; Porfirio, L. A review of methods, data, and models to assess changes in the value of ecosystem services from land degradation and restoration. Ecol. Model. 2016, 319, 190–207. [Google Scholar] [CrossRef]
  16. Rimal, B.; Zhang, L.; Stork, N.; Sloan, S.; Rijal, S. Urban Expansion Occurred at the Expense of Agricultural Lands in the Tarai Region of Nepal from 1989 to 2016. Sustainability 2018, 10, 1341. [Google Scholar] [CrossRef]
  17. CBS. National Population and Housing Census (National Report); National Planning Commission Secretariat, Government of Nepal: Kathmandu, Nepal, 2011.
  18. Rimal, B.; Zhang, L.; Keshtkar, H.; Haack, B.N.; Rijal, S.; Zhang, P. Land Use/Land Cover Dynamics and Modeling of Urban Land Expansion by the Integration of Cellular Automata and Markov Chain. ISPRS Int. J. Geo-Inf. 2018, 7, 154. [Google Scholar] [CrossRef]
  19. La Notte, A.; D’Amato, D.; Mäkinen, H.; Paracchini, M.L.; Liquete, C.; Egoh, B.; Geneletti, D.; Crossman, N.D. Ecosystem services classification: A systems ecology perspective of the cascade framework. Ecol. Indic. 2017, 74, 392–402. [Google Scholar] [CrossRef] [PubMed]
  20. Maes, J.; Teller, A.; Erhard, M.; Liquete, C.; Braat, L.; Berry, P.; Egoh, B.; Puydarrieux, P.; Fiorina, C.; Santos, F. Mapping and Assessment of Ecosystems and their Services. Anal. Framew. Ecosyst. Assess. Act. 2013, 5, 1–58. [Google Scholar]
  21. De Groot, R.S.; Wilson, M.A.; Boumans, R.M. A typology for the classification, description and valuation of ecosystem functions, goods and services. Ecol. Econ. 2002, 41, 393–408. [Google Scholar] [CrossRef] [Green Version]
  22. Farber, S.; Costanza, R.; Childers, D.L.; Erickson, J.; Gross, K.; Grove, M.; Hopkinson, C.S.; Kahn, J.; Pincetl, S.; Troy, A. Linking ecology and economics for ecosystem management. AIBS Bull. 2006, 56, 121–133. [Google Scholar] [CrossRef]
  23. Kubiszewski, I.; Costanza, R.; Dorji, L.; Thoennes, P.; Tshering, K. An initial estimate of the value of ecosystem services in Bhutan. Ecosyst. Serv. 2013, 3, e11–e21. [Google Scholar] [CrossRef]
  24. Navrud, S.; Ready, R. Lessons learned for environmental value transfer. In Environmental Value Transfer: Issues and Methods; Springer: Berlin/Heidelberg, Germany, 2007; pp. 283–290. [Google Scholar]
  25. Van der Ploeg, S.; De Groot, R.; Wang, Y. The TEEB Valuation Database: Overview of Structure, Data and Results; Foundation for Sustainable Development: Wageningen, The Netherlands, 2010. [Google Scholar]
  26. Kindu, M.; Schneider, T.; Teketay, D.; Knoke, T. Changes of ecosystem service values in response to land use/land cover dynamics in Munessa–Shashemene landscape of the Ethiopian highlands. Sci. Total Environ. 2016, 547, 137–147. [Google Scholar] [CrossRef] [PubMed]
  27. Gashaw, T.; Tulu, T.; Argaw, M.; Worqlul, A.W.; Tolessa, T.; Kindu, M. Estimating the impacts of land use/land cover changes on Ecosystem Service Values: The case of the Andassa watershed in the Upper Blue Nile basin of Ethiopia. Ecosyst. Serv. 2018, 31, 219–228. [Google Scholar] [CrossRef]
  28. Hu, H.; Liu, W.; Cao, M. Impact of land use and land cover changes on ecosystem services in Menglun, Xishuangbanna, Southwest China. Environ. Monit. Assess. 2008, 146, 147–156. [Google Scholar] [CrossRef] [PubMed]
  29. Sharma, R.; Rimal, B.; Stork, N.; Baral, H.; Dhakal, M. Spatial Assessment of the Potential Impact of Infrastructure Development on Biodiversity Conservation in Lowland Nepal. ISPRS Int. J. Geo-Inf. 2018, 7, 365. [Google Scholar] [CrossRef]
  30. Ministry of Forests and Soil Conservation. Strategy and Action Plan 2015–2025, Terai Arc Landscape, Nepal; Ministry of Forests and Soil Conservation, Singha Durbar: Kathmandu, Nepal, 2015.
  31. Thapa, A.; Shah, K.B.; Pokheral, C.P.; Paudel, R.; Adhikari, D.; Bhattarai, P.; Cruz, N.J.; Aryal, A. Combined land cover changes and habitat occupancy to understand corridor status of Laljhadi-Mohana wildlife corridor, Nepal. Eur. J. Wildl. Res. 2017, 63, 83. [Google Scholar] [CrossRef]
  32. Hansen, M.C.; Potapov, P.V.; Moore, R.; Hancher, M.; Turubanova, S.; Tyukavina, A.; Thau, D.; Stehman, S.; Goetz, S.; Loveland, T.R. High-resolution global maps of 21st-century forest cover change. Science 2013, 342, 850–853. [Google Scholar] [CrossRef] [PubMed]
  33. Tolessa, T.; Senbeta, F.; Kidane, M. The impact of land use/land cover change on ecosystem services in the central highlands of Ethiopia. Ecosyst. Serv. 2017, 23, 47–54. [Google Scholar] [CrossRef]
  34. Aschonitis, V.; Gaglio, M.; Castaldelli, G.; Fano, E. Criticism on elasticity-sensitivity coefficient for assessing the robustness and sensitivity of ecosystem services values. Ecosyst. Serv. 2016, 20, 66–68. [Google Scholar] [CrossRef] [Green Version]
Figure 1. Map of Study Area (Terai Arc Landscape) in Southern Nepal.
Resources 08 00018 g001
Figure 2. LULC for 2000 (a) and 2016 (b) of Terai Arc Landscape, Nepal.
Resources 08 00018 g002
Table 1. Landsat image path/row details and dates.
Path/Row2001 (ETM+)2016 (OLI)
141/4124 October25 October
142/4131 October22 March
143/4125 December23 October
144/403 March14 April
Table 2. Land use and land cover (LULC) classification scheme in the Terai Arc Landscape Southern Nepal.
SnLand CoverDescription
1.ForestsLand dominated by trees (Evergreen broadleaf forest, deciduous forest)
2.ShrublandsBushes, grasslands, shrub cover and degraded forests
3.AgricultureLand under cultivation of agricultural crops
4.UrbanUrban and rural settlements, commercial areas, and built-up
5.Water BodiesRivers, wetlands, and lakes
6.BarrenRocks, sands, barren land
Table 3. Description of the various types of ES (adapted from Costanza el al. 1997 [2]).
SnEcosystem ServicesDescription
Provisioning
1.Food ProductionFood products derived from plants, animals, and microbes
2.Raw materialsMaterials such as timber, fuelwoods, hemp, dung, fibers
3.Genetic resourcesGenes and genetic information
4.Water supplyProvision of water by watersheds, reservoirs and aquifers
Regulating
5.Climate regulationSequester and store carbon or emit carbon that affects temperature
6.Gas regulationRegulate atmospheric chemical composition
7.Disturbance regulationControl hazards such as floods and landslides
8.Waste treatmentFilter and decompose organic wastes
9.Erosion controlSoil retention by preventing soil loss by wind or runoff
10.PollinationReproduction in plants by transportation of pollen
11.Water regulationRegulate hydrological flows
12.Biological controlControl populations of pest and disease vector
Cultural
13.CulturalAesthetic, educational, and scientific opportunities.
14.RecreationProvide recreational activities
Supporting
15.Nutrient cyclingStore, cycle, process, and acquisition of nutrients
16.Soil formationFormation of organic and inorganic soil
17.Habitat/refugiaProvide habitat for different resident and migrating plants and animals
Table 4. LULC Classes, equivalent biome type from Costanza et al. [2], and corresponding ESV.
SnLULC ClassEquivalent Biome TypeTotal Ecosystem Service Value (ESV) (in USD/ha/year.)
Costanza et al. (1997)Modified
1.ForestsTropical Forests2007871
2.ShrublandGrass/rangelands232244
3.AgricultureCropland9292
4.WaterbodiesWater84982699
5.Urban Urban00
6.BarrenIce/Rock00
Table 5. The annual value coefficients for ecosystem services (in USD ha−1 year−1).
SnEcosystem Service TypesAgricultureForestsShrublandWaterbodiesUrban and BarrenTotal
Provisioning
1.Food Production54 *76750-178
2.Raw materials-315---315
3.Genetic resources-41 *---41
4.Water supply-8-1872-1880
Regulating
5.Climate regulation-245---245
6.Gas regulation--7 *--7
7.Disturbance regulation-5 *---5
8.Waste treatment-87 *8781-255
9.Erosion control-8629 *--115
10.Pollination14 *3325--72
11.Water regulation-173 *378-398
12.Biological control24 *-23--47
Cultural
13.Cultural-2 *---2
14.Recreation-12318-321
Supporting
15.Nutrient cycling-14---14
16.Soil formation-10 *1--11
17.Habitat/refugia-----
Sum of ES for LULC928712442699
Abbreviations: * values from Costanza et al., 1997 [2], all other values from TEEB Database. TEEB stands for The Economics of Ecosystems and Biodiversity, while LULC stands for Land Use and Land Cover.
Table 6. Land use and land cover (LULC) in 2001 and 2016 in Terai Arc Landscape, Nepal.
SnLULCArea (ha) 2001%Area (ha) 2016%Change (ha) 2001–2016% Change
1.Urban20,503146,729226,226127
2.Agriculture956,98337927,73635−29,247−3
3.Forests1,151,910441,143,17044−8740−0.7
4.Shrublands312,18012330,2881318,1086
5.Barren134,1865129,8515−4335−3
6.Waterbodies39,821237,8061−2015−5
Table 7. Transition in LULC between 2001 and 2016 in Terai Arc Landscape, Nepal (in ha).
LULCUrbanAgriForestsShrublandBarren
Agriculture26,226-29,30020,20013,200
Forests-19,400-59,800-
Shrubland 22,30037,700--
Barren-15,600---
Waterbodies----2015
Table 8. Ecosystem service values estimated for each LULC class and the changes in the respective years in Terai Arc Landscape, Nepal (in USD).
LULCESV (in Million USD per Year)ESV Change (in Million USD per Year)
200120162001–2016
Agriculture8885−3
Forest1003996−8
Shrubland76814
Water107102−5
Total12751264−11
Table 9. The estimated annual value of ecosystem services (ESV in million USD per year).
SnEcosystem Services20012016ChangePercent Change
1.Climate regulation282280−2−2.14
2.Gas regulation2200.13
3.Disturbance regulation660−0.04
4.Water regulation3634−1−0.86
5.Water supply8479−4−3.84
6.Erosion control1081080−0.23
7.Soil formation12120−0.07
8.Nutrient cycling16160−0.12
9.Waste treatment13113110.65
10.Pollination59590−0.25
11.Biological control30300−0.29
12.Habitat0000.00
13.Food Production8382−1−0.53
14.Raw materials363360−3−2.75
15.Genetic resources47470−0.36
16.Recreation1414−1−0.61
17.Cultural220−0.02
Total12751262 −0.89

