Historical, Current, and Future Energy Demand from Global Copper Production and Its Impact on Climate Change


Institute for Industrial Ecology, Pforzheim University, Tiefenbronner Str. 65, 75175 Pforzheim, Germany
*
Author to whom correspondence should be addressed.
Resources 2020, 9(4), 44; https://doi.org/10.3390/resources9040044
Submission received: 3 March 2020
/
Revised: 8 April 2020
/
Accepted: 9 April 2020
/
Published: 16 April 2020
Abstract
:Copper has always played an important role in human development. Demand for copper is going to rise, which makes its future supply a key issue for society. However, the oft-discussed declining ore grade and, therefore, the assumed enormous increase in energy demand and global warming potential could lead to a supply constraint. To develop suitable strategies to ensure copper availability, it is important to better understand the relationship between energy and ore grade and also its development. Therefore, in this paper we describe the development of the cumulative energy demand of copper production over the last eight decades and give an outlook into the future using a holistic process-based modelling approach. We also discuss how technological progress has thus far been able to offset the decreasing ore grade. However, if geological factors are becoming less favorable, technological improvements such as renewable energies are vital to keep this trend going.
1. Introduction
Copper has always been an indispensable part of our development, and the demand for copper increased continuously throughout the 20th century. A growing population, improving living standards and the expansion of copper-intensive technologies such as energy transition will continue to drive this trend forward [1]. According to Elshkaki et al. [2] a doubling of copper demand until 2050 is likely, and some studies even expect a five to eightfold increase if CO2 neutrality is to be achieved [3]. Securing the copper supply is therefore a major issue for our society to enable a sustainable future [4].
Despite increasing recycling, primary resources will still be necessary to meet demand in the foreseeable future [2]. In addition, copper is a base metal; its ores often contain other elements such as gold, silver, molybdenum, cobalt, and selenium [5], which makes copper mines an important source for these by-products [6,7]. However, the amount of primary copper is limited and the quality, i.e., the ore grade of the resources, varies. The largest proportion is rocks with minimal concentrations [8,9] which are worthless to us, at least under current conditions. Therefore, geological accumulations of metals in deposits are of high importance. However, historical data show a decline in the ore grade of the mined material [10,11]. There are many reasons for this: for example, the enormous increase in demand and thus a change in the type of deposit mined as well as the development of the technologies used for extraction and production [12,13]. While this trend does not indicate a purely geological shortage, it is often interpreted as an indication that the availability of raw materials is limited. This is based on the assumption that the energy costs of extracting metals are inversely proportional to the ore content, and therefore follow a 1/x curve [14].
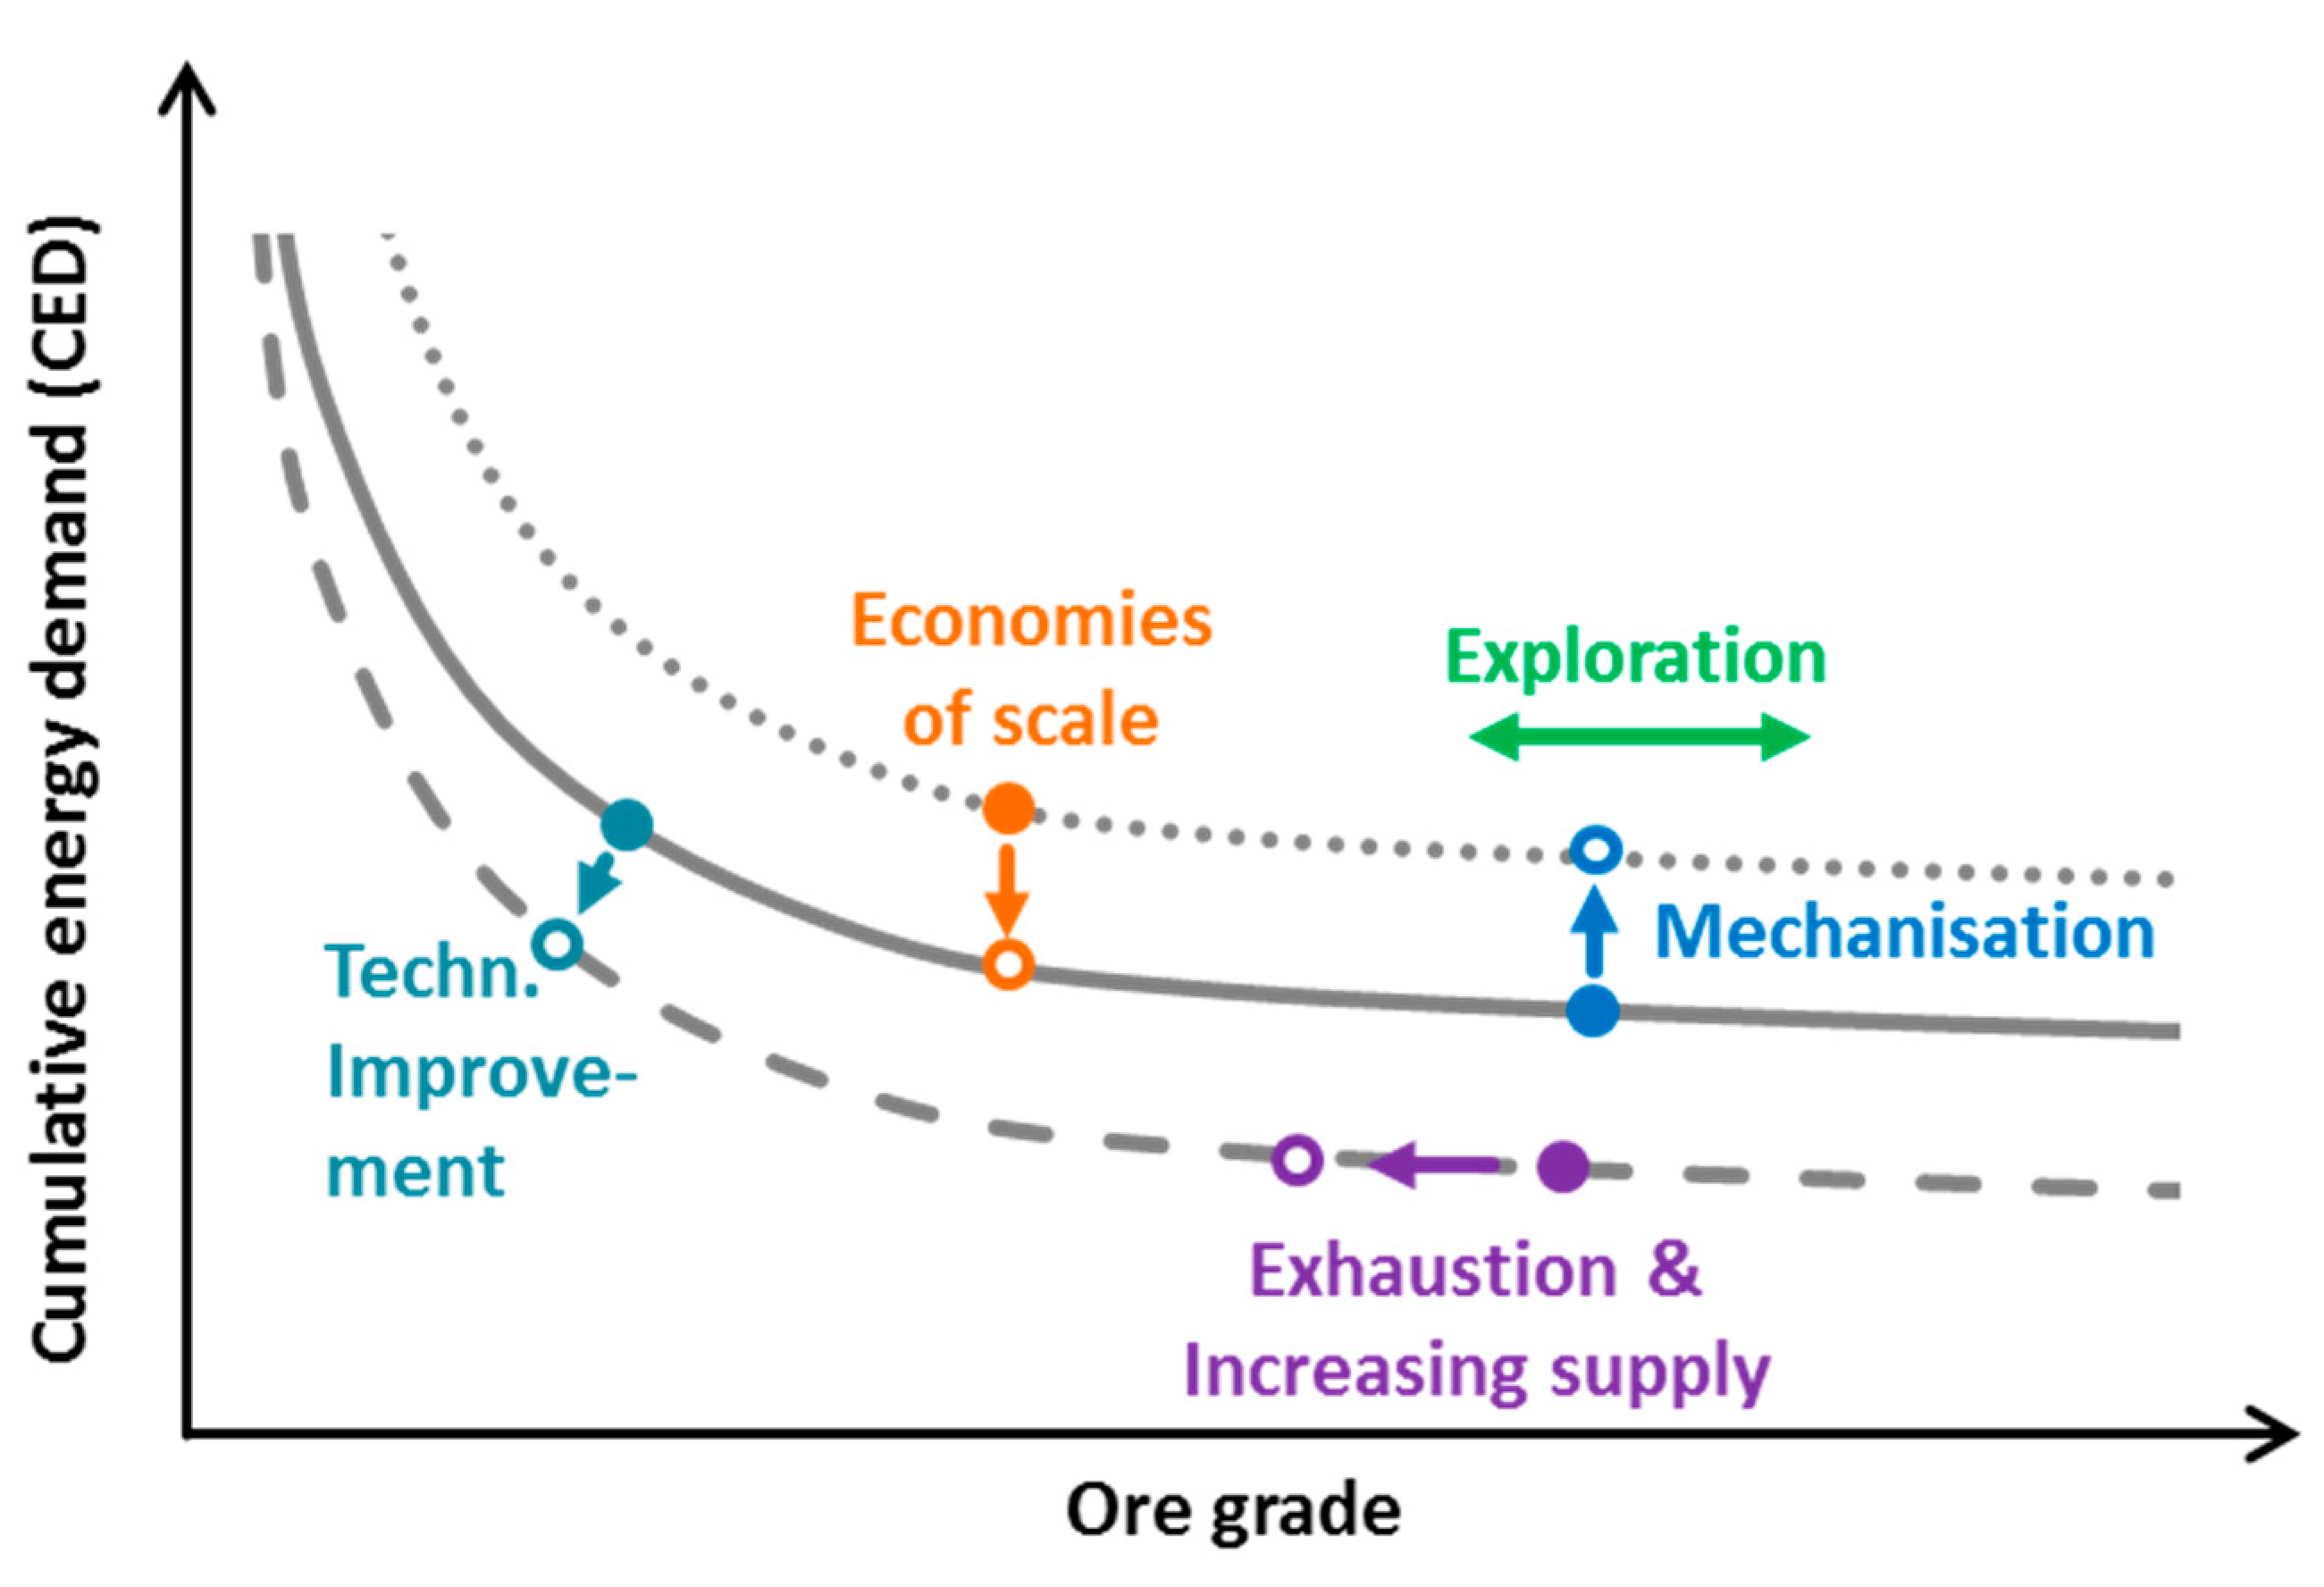
Northey et al. [15], as well as Calvo et al. [16], use data from sustainability and other company reports to assess the relationship between energy consumption and ore grade. They both confirm the negative influence of the ore grade on the energy demand. Koppelaar and Koppelaar [17] also investigated the energy demand of copper production based on report data, and came to a similar result. Besides the ore grade they also consider other influencing factors, such as the extraction method and mine depth, but neglect some important parameters, such as the stripping ratio (SR), i.e., the amount of waste per tonne of ore. In addition, approaches based on data from company reports take no other auxiliary and operating materials like sulphuric acid into consideration, which also contribute remarkably to the environmental impacts [18]. Approaches based on a process-based material flow model offer a more holistic approach. The first works date back to the 1970s [19,20,21], but the approach is also used in more recent publications [22,23,24]. These studies again confirm a disproportionate increase in energy demand with decreasing ore content. However, what is neglected is a temporal view. Thus far, only a change in the geological factors is assumed, but other developments also have an influence, e.g., technological improvement led to a shift of the curve itself (see Figure 1).
In this paper, we show the development of the cumulative energy demand (CED) of primary copper production and its effects on climate change using a holistic process-based modelling approach. For each of the three periods considered—the 1930s, 1970s, and 2010s—the model was adjusted accordingly to represent the global average of primary copper production (from extraction of raw materials to finished copper cathode at refinery) at that time. Therefore, time-specific mining and processing technologies, metallurgy, and parameters have been researched and included in the model. The three time periods were chosen to be able to include all major technological improvements and hence, to show the long-term trend. Adapting technologies and parameters also allows possible future developments to be assessed.
With the approach used we are able to provide a better understanding of the past and future development of the cumulative energy requirement of metal production and its main influencing factors. The work should be understood as an analysis of a long-term trend and the influence of possible future developments. Of course, the energy consumption of specific mines can differ substantially.
2. Materials and Methods
This section describes the materials and methods used. Here, we refer to the CED. However, the calculation of the global warming potential (GWP) and also other indicators follows the same methodology.
2.1. Model of Global Copper Production
2.1.1. Total Copper Production
For the three time periods considered, primary copper production was modelled in a generic model using a holistic process-based modelling approach (from raw material extraction to finished copper cathode at refinery) [19,25,26]. This means that in addition to the direct inputs of energy and other materials, such as chemicals (foreground system), the effort required for their production was also included (background system). For this purpose, the material and energy flows modelled in the foreground system are evaluated with factors calculated in the background system to determine the total effort. Background data was mostly taken from databases and other literature, except electricity generation. We refer to this in more detail in the data section of this paragraph. Before the foreground system is explained we want to state some important assumptions made. Only ongoing operations are included. Exploration and development are not taken into account, nor is the infrastructure (facilities, trucks, etc.) as they are assumed to be negligible compared to the operation of the mine. Further, it is assumed, that the whole process chain takes place nearby. Therefore, no transport of intermediate products was included.
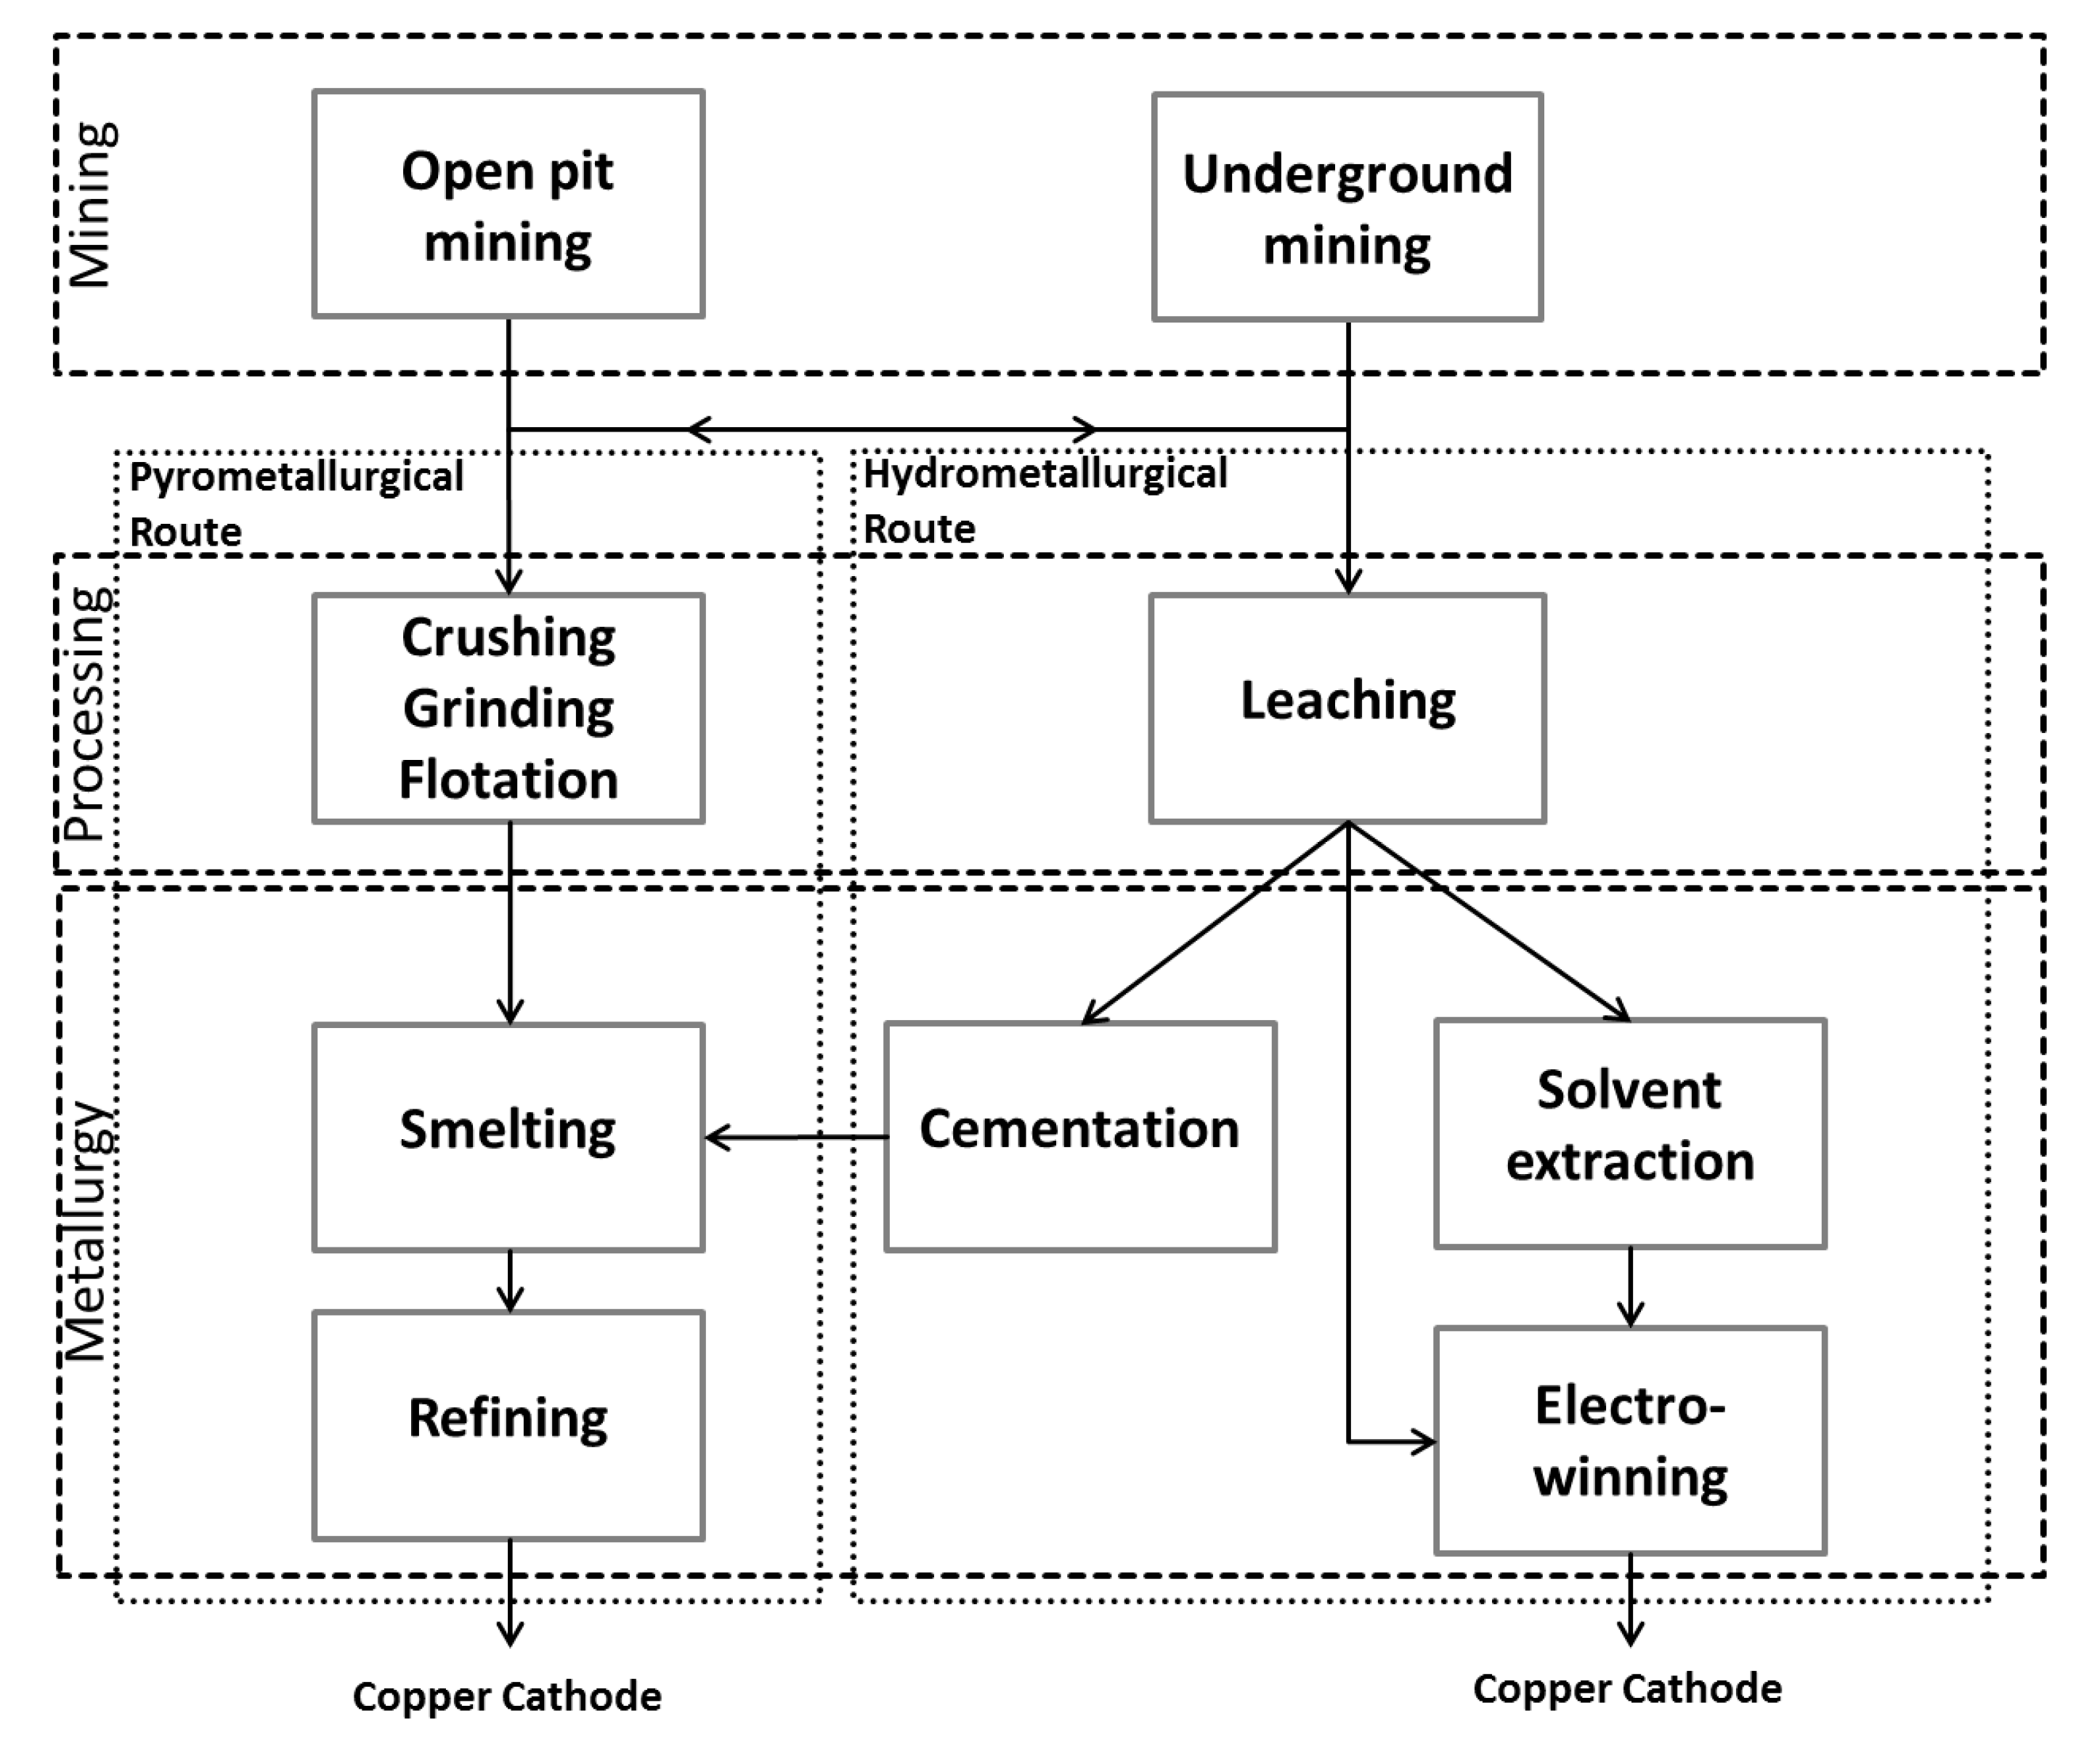
Copper production can be divided into the three main process steps, which are mining, processing, and metallurgy. Each process step can be done using different methods (see Figure 2). In the first step the ore is mined in open pit (OP) or underground (UG) mines. Afterwards, the ore is treated by the pyro- or hydrometallurgical route. Which route is taken, depends mainly on the type of ore. Sulphide ores are treated by pyrometallurgy via crushing, grinding, and flotation (CGF) to produce a concentrate which is subsequently smelted and refined. Oxide ores are leached and afterwards treated by solvent extraction (SX) and electrowinning (EW). In the 1930s and 1970s there were alternative processes, namely cementation and subsequent smelting or direct EW.
The methods used for mining, processing, and metallurgy themselves and their contribution to global copper production changed with time. Therefore, the total CED of copper production per tonne of copper in a given year y is:
where = CED of copper production by a given route k in MJ-eq per tonne Cu in that year; = share of production of route k in% in that year.
The CED of a specific process route k in year y is:
where = CED of mining (OP or UG) in MJ-eq per tonne Cu; = CED of processing (CGF or leaching) in MJ-eq per tonne Cu; = CED of metallurgy (pyro or hydro) in MJ-eq per tonne Cu.
The assumed production shares are given in Table A1 in Appendix A.
2.1.2. Mining
The mining of copper ores takes place either open pit or underground through the process steps of drilling, blasting, loading (and hauling), crushing (in mine to facilitate transport) and transportation. Additionally, underground mines must be ventilated, which requires a considerable amount of energy. Transportation in surface mining is usually done by trucks and can be estimated from the depth of the mine and the maximum road gradient (10%) to be mastered [27]. In underground mining, vertical transport via a shaft is assumed. All process steps occur not only for the ore, but also for the overburden, which must also be removed. In underground mining, this proportion (Stripping ratio, SR) is negligible (a value of 0.1 tonne of overburden per tonne of ore is used here), in open pit mining, on the other hand, up to 10 tonnes of overburden or more can be produced per tonne of ore [28]. To determine the specific CED per tonne of copper, the CED per tonne of ore must be divided by the ore grade. There might be losses in the subsequent processing steps, which must be taken into account additionally (recovery rate).
Hence, for the calculation of the CED of mining per tonne of Cu in a given year y we use the following equation:
where = CED of drilling and blasting in MJ-eq per tonne ore; = CED of loading in MJ-eq per tonne ore; = CED of loading and hauling in MJ-eq per tonne ore; = CED of transportation in MJ-Eq per tonne ore and km; = Mine depth in km; = CED of crushing in MJ-eq per tonne ore; = Ore grade; = recovery rate of processing (CGF or leaching) in %; = recovery rate of metallurgy (pyro or hydro) in %.
We used this equation for the year 2010 and the future development. Because of the detail of the available data, Equation (3) has to be adjusted for the earlier years, e.g., it is not always possible to break down mining (and also the following processes) into individual process steps. For the 1930s the CED for mining and stripping was individually determined.
During mining, the ore can sometimes be diluted with overburden. In open pit mining, this dilution can reach up to approximately 5% [27,29], and in underground mining, it is usually between 5% and 15% [27] depending on the method used, but can also be up to 60% [30]. The extent to which this factor must be included depends on the definition of the ore grade. If one assumes the ore content of the reserves or resources, dilution must be included. This can be done by adjusting the ore grade. If, however, the mill head grade is used, which is often the basis for a discussion of the decreasing ore grades [12], dilution is already included. In this paper, we define the ore grade as the mill head grade, because it represents the average mined ore grade and is often referred to in publications.
2.1.3. Mineral Processing
The processes used for further processing depend mainly on the ore type. There are two types of ore—sulphide and oxide—the former of which is more common.
After mining, sulphide ore was crushed and ground. The degree of comminution depends on the specific properties of the ore and the subsequent processes, which serve to separate worthless and other undesirable substances from the metal. Froth flotation is the preferred process for copper. Chemicals collect the minerals that are distributed in a sludge solution and bring them to the surface, where they settle in foam that is skimmed off. These processes (CGF) produce a concentrate with a copper content of approximately 30%. The energy required for CGF is dominated by the degree of comminution. A metal-specific approximation was carried out via Bond’s Law (Bond Work Index for copper ore is 12.7 kwh/t) [31]. As in the mining step, recovery rates and the ore grade must be considered to calculate the CED per tonne of metal (see Equation (4)).
Oxide ores were treated by leaching, where the copper is recovered by dissolving the metal. Therefore, the ore is no longer ground but is usually crushed. Then, the metal is leached using acids by sprinkling them over the crushed rock. This process step produces a solution. In principle, leaching is part of hydrometallurgy. For reasons of modelling and comprehensibility, this process step is considered separately here. All steps occurred per tonne of ore. The following equation can be used to determine the CED of processing in a given year y:
where = CED of grinding in MJ-eq per tonne ore; = CED of flotation in MJ-eq per tonne ore; = CED of leaching in MJ-eq per tonne ore; = Recovery rate of CGF in%; = Recovery rate of leaching in%.
2.1.4. Metallurgy
The concentrate or solution produced by the previous process steps was brought to a purity of almost 100% by metallurgical processes. For concentrates, pyrometallurgy was used, in which the concentrate is melted and impurities such as sulphur are removed with oxygen. For further refinement, electrometallurgical processes were used. In the hydrometallurgical route, which was used for further processing of the solutions, the metal is extracted from the solution by SX and then further concentrated by EW. Alternative processes were used before the 1980s. Then, solutions with a high copper concentration were processed directly by electrometallurgy (direct EW). Solutions with a low concentration were cemented using ferrous scrap and then pyrometallurgically processed. The product of either the pyro- or hydrometallurgical process is a copper cathode.
The CED of metallurgy is calculated as follows:
where = CED of process step i in MJ-eq per tonne Cu; = recovery rate of process step j in %.
2.2. Data
2.2.1. Foreground System
To map the development of global copper production we focused on three time periods of approximately 10 years (1930s, 1970s, and 2010s). For all process steps we researched time-specific literature data. If possible, the assumed values have been validated by checking several sources. The contribution of each processing route to global copper production was also adjusted accordingly. The information used to obtain the production shares is provided in Appendix A (Table A1 and Table A2), along with all other data.
2.2.2. Background System
We also researched time-specific literature data for the CED of all input materials. This was not possible in all cases; therefore, current data or data from similar years were used, and if possible, these data were adjusted accordingly. The specific values used are provided in Appendix C. The generation of electricity is of particular importance. The CED and GWP of the time-specific electricity mixes are calculated on the basis of data from the International Energy Agency (IEA). For each country and year, the electricity mix was assessed using a simplified methodology. In the first step the amount of electricity produced by the different energy carriers, hydro, coal, gas, oil, nuclear, and others (assumed to be 100% renewable but of minor importance due to the small share) was calculated using the total production and the individual shares of the stated energy carriers. To calculate the CED of the electricity mix, the yearly production per energy carrier was then divided by the efficiency of each technology (see Appendix C, Table A5).
Having calculated the CED, standard carbon emission factors associated with the combustion of the respective energy carrier [32,33] were used to determine total carbon emissions. There were no values for renewable energy sources, therefore, data from ecoinvent V3.3 [34] were used to assess the potential emissions from these sources. Overall, it should be mentioned that their influence is small in comparison to fossil-based energy carriers. As the data from the IEA on the electricity mix were not complete for all years, the reference year (electricity mix) for the 1970s was 1973, and for the 2010s was the 2010 value. Next, the time- and country-specific CED and GWP, respectively, were weighted by the time-specific production share of each country for the process steps mining, smelting, and refining. The assumed production share refers to 90% of global production and can be found in Table A6. For the 1930s, only the USA and Chile (representing in total 65% of mine and 66% of smelter production) were considered.
2.3. Indicators
The CED was used as a central indicator, because it is the most suitable for illustrating the concentration problem [35]. This indicator includes only expenditures on the input side. In addition, effort can also be determined by the resulting environmental pollution. The emission of greenhouse gases which are responsible for global warming play a decisive role in the current political discussion and resulting objectives. The GWP is closely related to the CED, which is generally a good indicator for other environmental impacts [36]. Within the scope of this work, the GWP was therefore also used.
Other indicators also have a high relevance in mining. For example, mining and the subsequent processing generate enormous amounts of overburden and other residues that could have a negative impact on the environment. However, these effects can be limited or even avoided by adopting appropriate measures. Nevertheless, it is not possible to avoid the use of energy.
3. Results
3.1. Temporal Developments and Their Effects—1930s to 2010s
In the following section, the identified geological and technological changes from the 1930 till today and their influence on the CED are discussed.
3.1.1. Mining
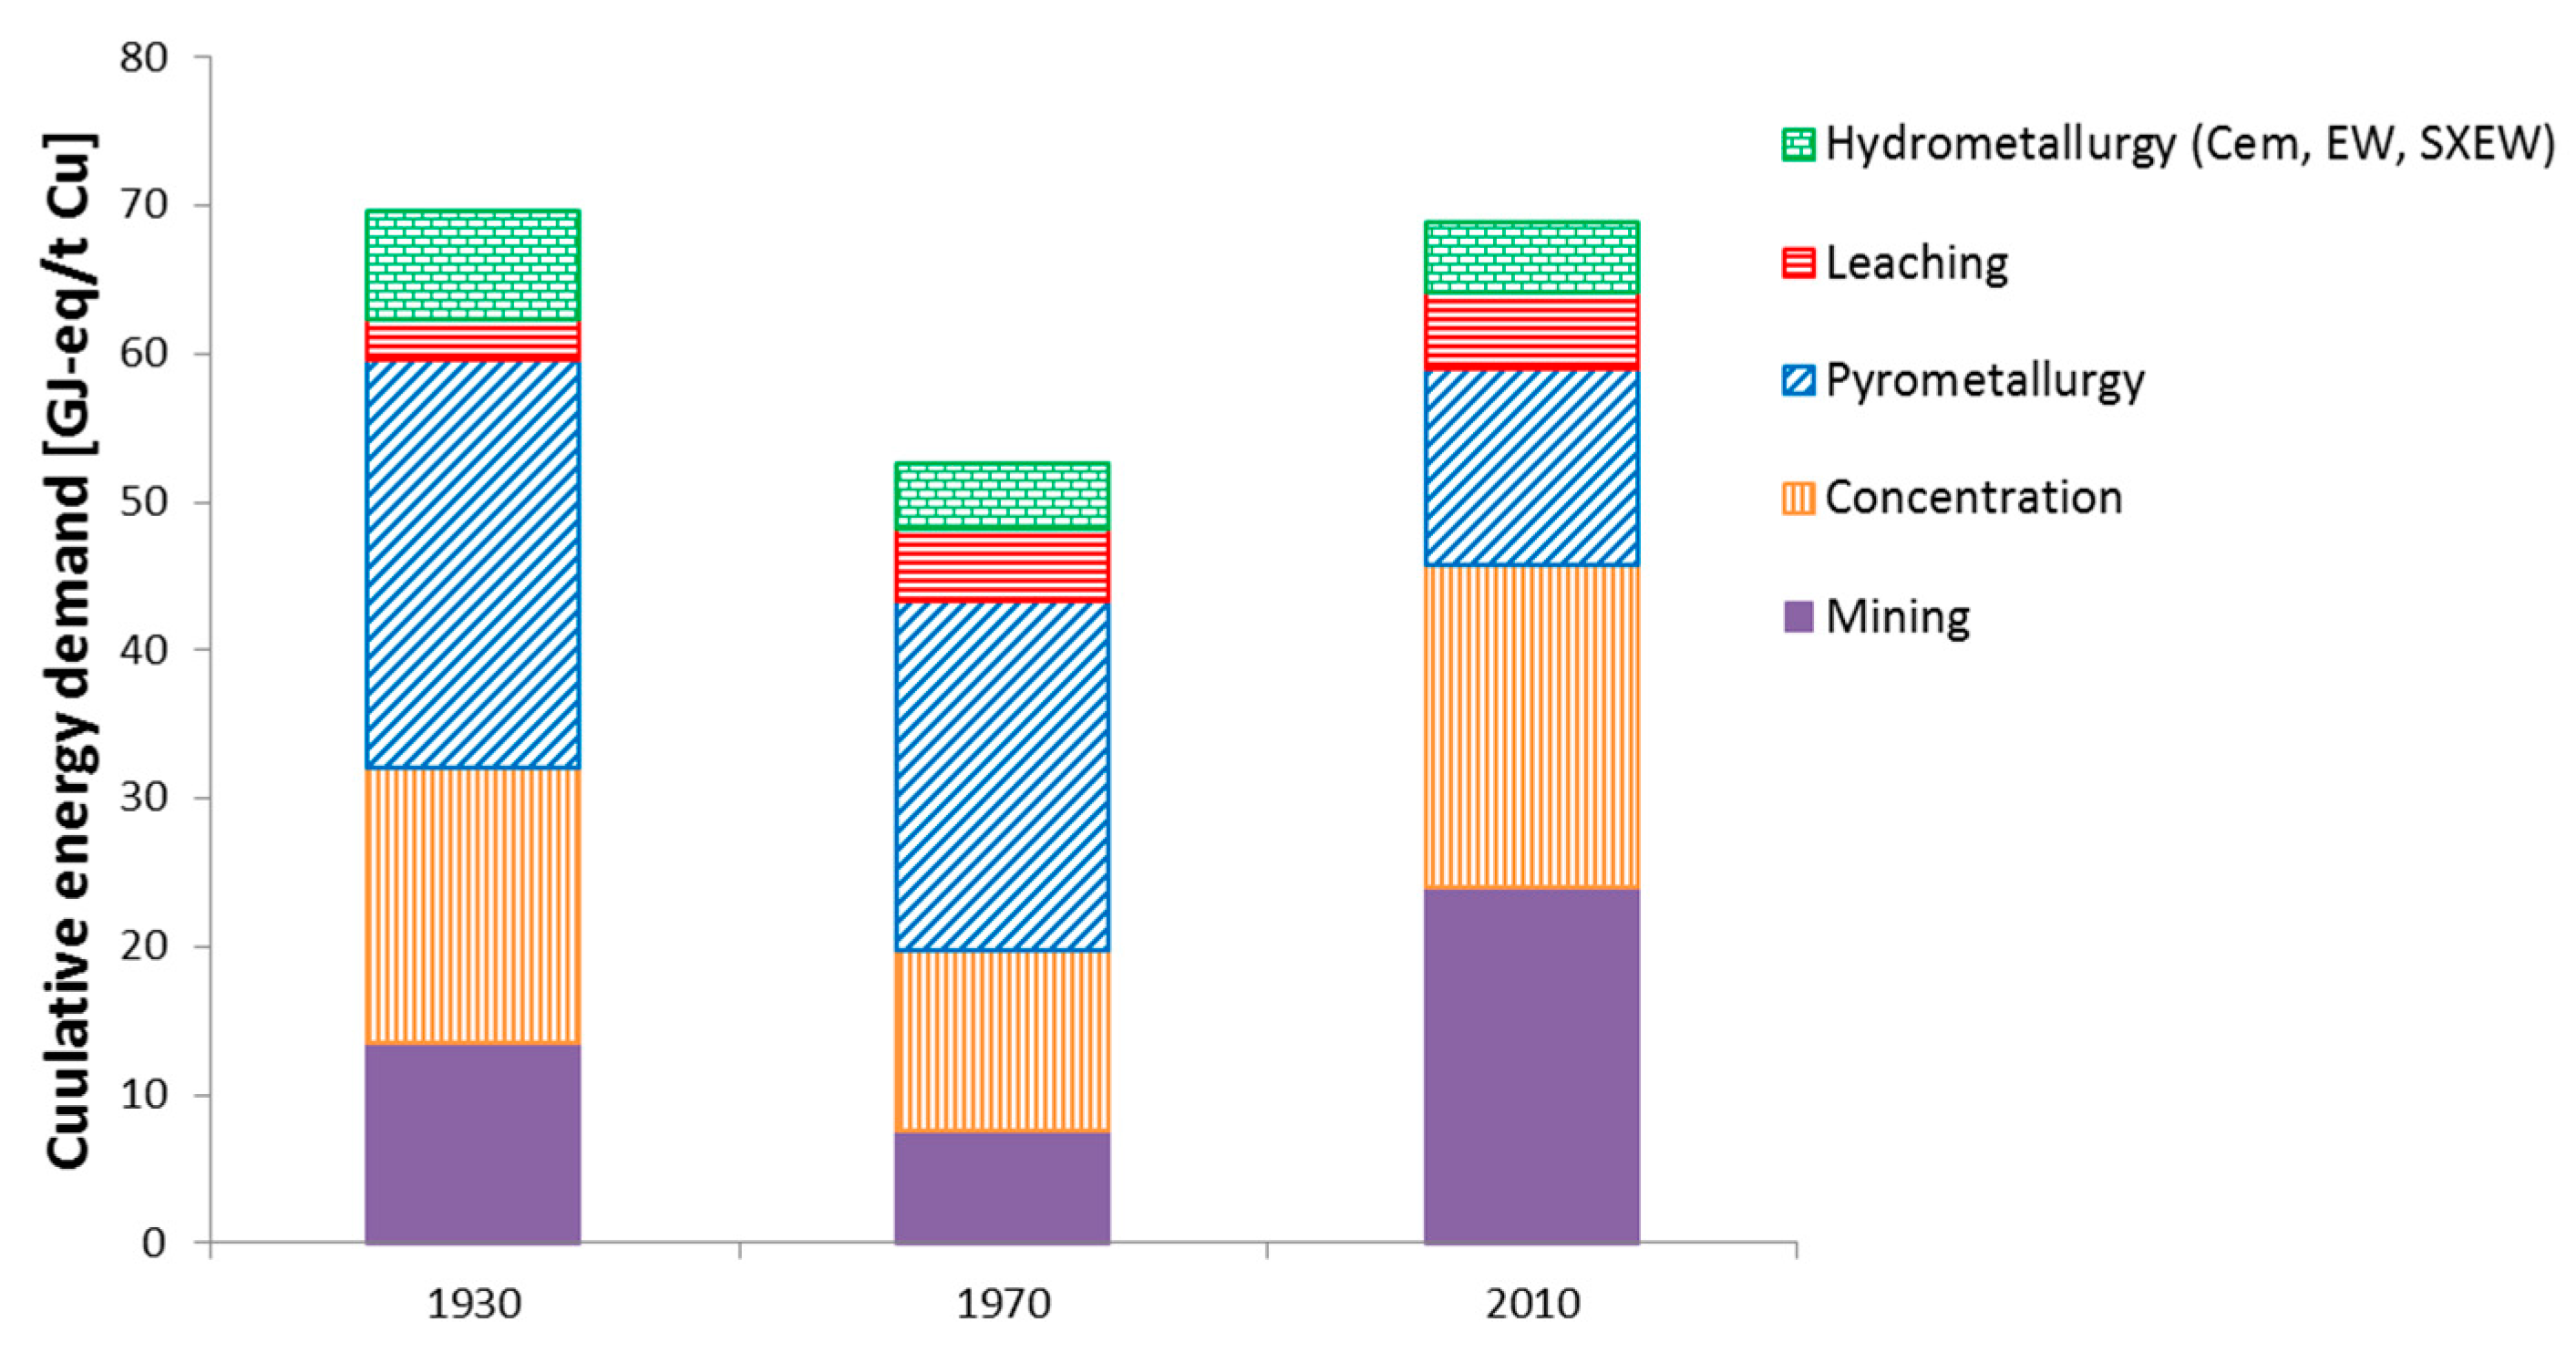
Starting in the 1930s, when electrification in mining had mostly been completed [37], underground mining was still very important. Based on the three main producing countries (USA, Chile, Congo), it is assumed that approximately 50% of copper was extracted from underground mines [37,38,39]. This changed significantly in the following decades. Since the 1970s, approximately 90% of copper ore has been taken from open pit mines [40,41,42]. Open pit mines are less energy intensive than underground mines [15], which together with the major improvements in electricity generation led to an overall reduction in the CED of mining of almost 60%, from 196 MJ-eq/t ore in the 1930s to 84 MJ-eq/t ore in the 1970s. For electricity supply, we take the national grid as a source. In fact, not all mines are connected to the grid, but there are little data available on the actual number (especially historical data). In the US there already was a trend to buy electricity in the 1920s, so that in 1929 over 50% of the equipment was driven by purchased electricity. Own production of electricity was whether by fuel, hydroelectric plants or steam plants [37]. However, the efficiency of electricity production has a remarkable influence on the results. If we assume that all electricity of mining in the 1930s is produced by a fossil based steam engine, which is a very pessimistic assumption, the CED of mining would be remarkably higher (271 MJ-eq/t ore) and the average CED of global copper production would rise by 17% to 82 MJ-eq/t Cu (including a change in the electricity supply for CGF). From the 1970s until now, neither the share of open pit mines nor the electricity supply changed significantly, but geological factors did. The depth of discovered deposits has been increasing since the 1940s [43], which together with the increasing size and the extended life time of mines due to the profitable mining of lower grade ores has led to an increase in the average mining depth and SR. Among other things, this contributed to a 62% increase in the CED of mining from 84 to 136 MJ/t ore.
3.1.2. Mineral Processing
After the ore has been extracted, it is physically or chemically processed. Sulphide ores are physically processed via CGF to a copper content of approximately 30%, which is then further treated by pyrometallurgy. Direct energy consumption in the CGF stage has changed slightly since the 1930s. However, because almost all of that energy is electricity, the improvement in electricity generation is remarkable and, together with other minor changes, led to an overall reduction in the CED of the CGF step from 327 MJ-eq/t ore in the 1930s to 162 MJ-eq/t ore in the 1970s. Today, the CED of CGF is 167 MJ-eq/t ore. Although the CED has remained almost constant since the 1970s (see Figure 3 and Table 1), the contribution of the individual materials has changed. Steel, which is used as a grinding medium, is now of minor importance to the CED compared to its role in the past, but the impact of water is slowly increasing. This might become an issue in the future, especially in arid areas such as Chile, where they increasingly use desalinated sea water that must be transported over long distances and is therefore energy-intensive in its production and distribution [44].
Oxide ores are leached and further processed via hydrometallurgical processes. Strictly speaking the leaching process is part of the hydrometallurgy, but is considered separately here. Today, heap leaching is the most important leaching method, although in the past, vat leaching also played an important role [45,46]. Regardless of the method used, the leaching agent, which is sulphuric acid, dominates the CED of the leaching process. Data on sulphuric acid consumption vary greatly, as the amount of acid consumed depends greatly on the ore. There are also plants that are acid-neutral [45]. Although the CED for leaching is highly sensitive to the amount of acid used, the overall result per tonne of copper cathode does not change significantly (max. change −8% for 1970), as hydrometallurgy only accounts for a minor part of total copper production. With the assumed values, the CED of leaching today is 112 MJ-eq/t of ore, which is less than half that in the 1930s/70s, mainly due to reductions in the amount of sulphuric acid used.
3.1.3. Metallurgy
Pyrometallurgy has always been the main processing route. In the 1930s and 1970s, the reverberatory furnace was the most widely used technology [45,46]. This technology did not undergo a great transformation throughout the years except that stricter environmental regulations, e.g., regarding the emission of SO2 [47], led to some adjustments. Overall, the CED of pyrometallurgy was relatively stable between the 1930s and 1970s. Great progress was then achieved towards the end of the 1970s/beginning of the 1980s through the introduction of the flash smelting process, which led to a significant reduction in the CED of approximately 40% from 28 (1970s) to 16 GJ/t Cu cathode (today) (see Figure 3). Flash smelting requires less fuel, but uses oxygen instead. Producing oxygen is also very energy intensive. However, despite the significant contribution of oxygen (approximately 20%) to the CED of pyrometallurgy, the reduction in fuel consumption is decisive.
Hydrometallurgy has changed greatly since the 1930s. After its invention in the 1970s, the SX process was able to assert itself, reaching a current share of 100% [48]. Prior to this, solutions were dependent on their copper concentration; either processed directly by electrometallurgy (high concentration) or cemented using ferrous scrap and then pyrometallurgically processed (low concentration). Electrolysis was the most important precipitation method in the 1930s [45], but in the subsequent decades, cementation gained influence [46]. The parameters assumed in this paper show that despite the increasing share of cementation, the CED of hydrometallurgy was reduced from the 1930s to the 1970s. One reason for this is the improvement of in copper concentration of the cement copper and the subsequent reduced effort in pyrometallurgical treatment as well as the lower CED of iron scrap and the electricity mix. However, a significant reduction in direct energy consumption could only be achieved by the invention of the SX as an alternative to cementation [49]. However, this development was also accompanied by a change to electricity as the major energy source, which is generally speaking relatively inefficient compared to the use of other energy sources when mainly based on fossil fuels.
3.1.4. Total Copper Production
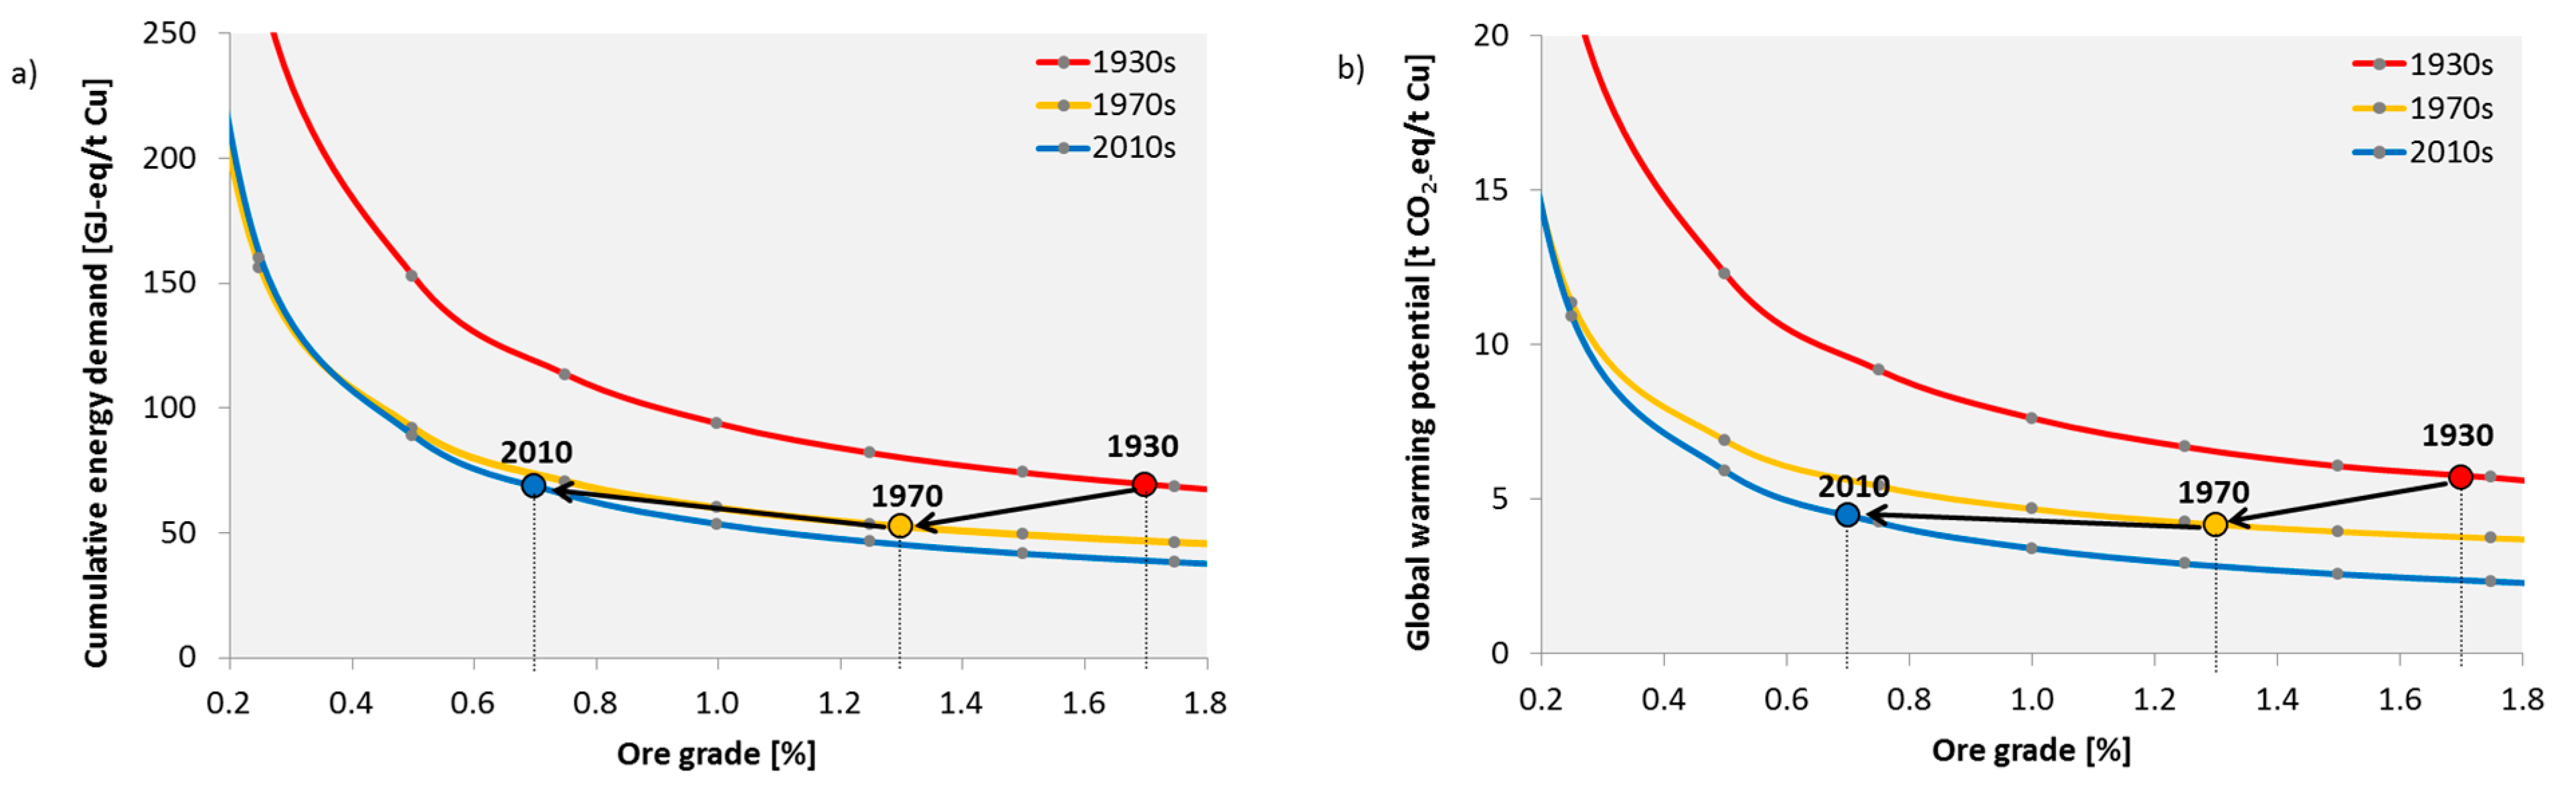
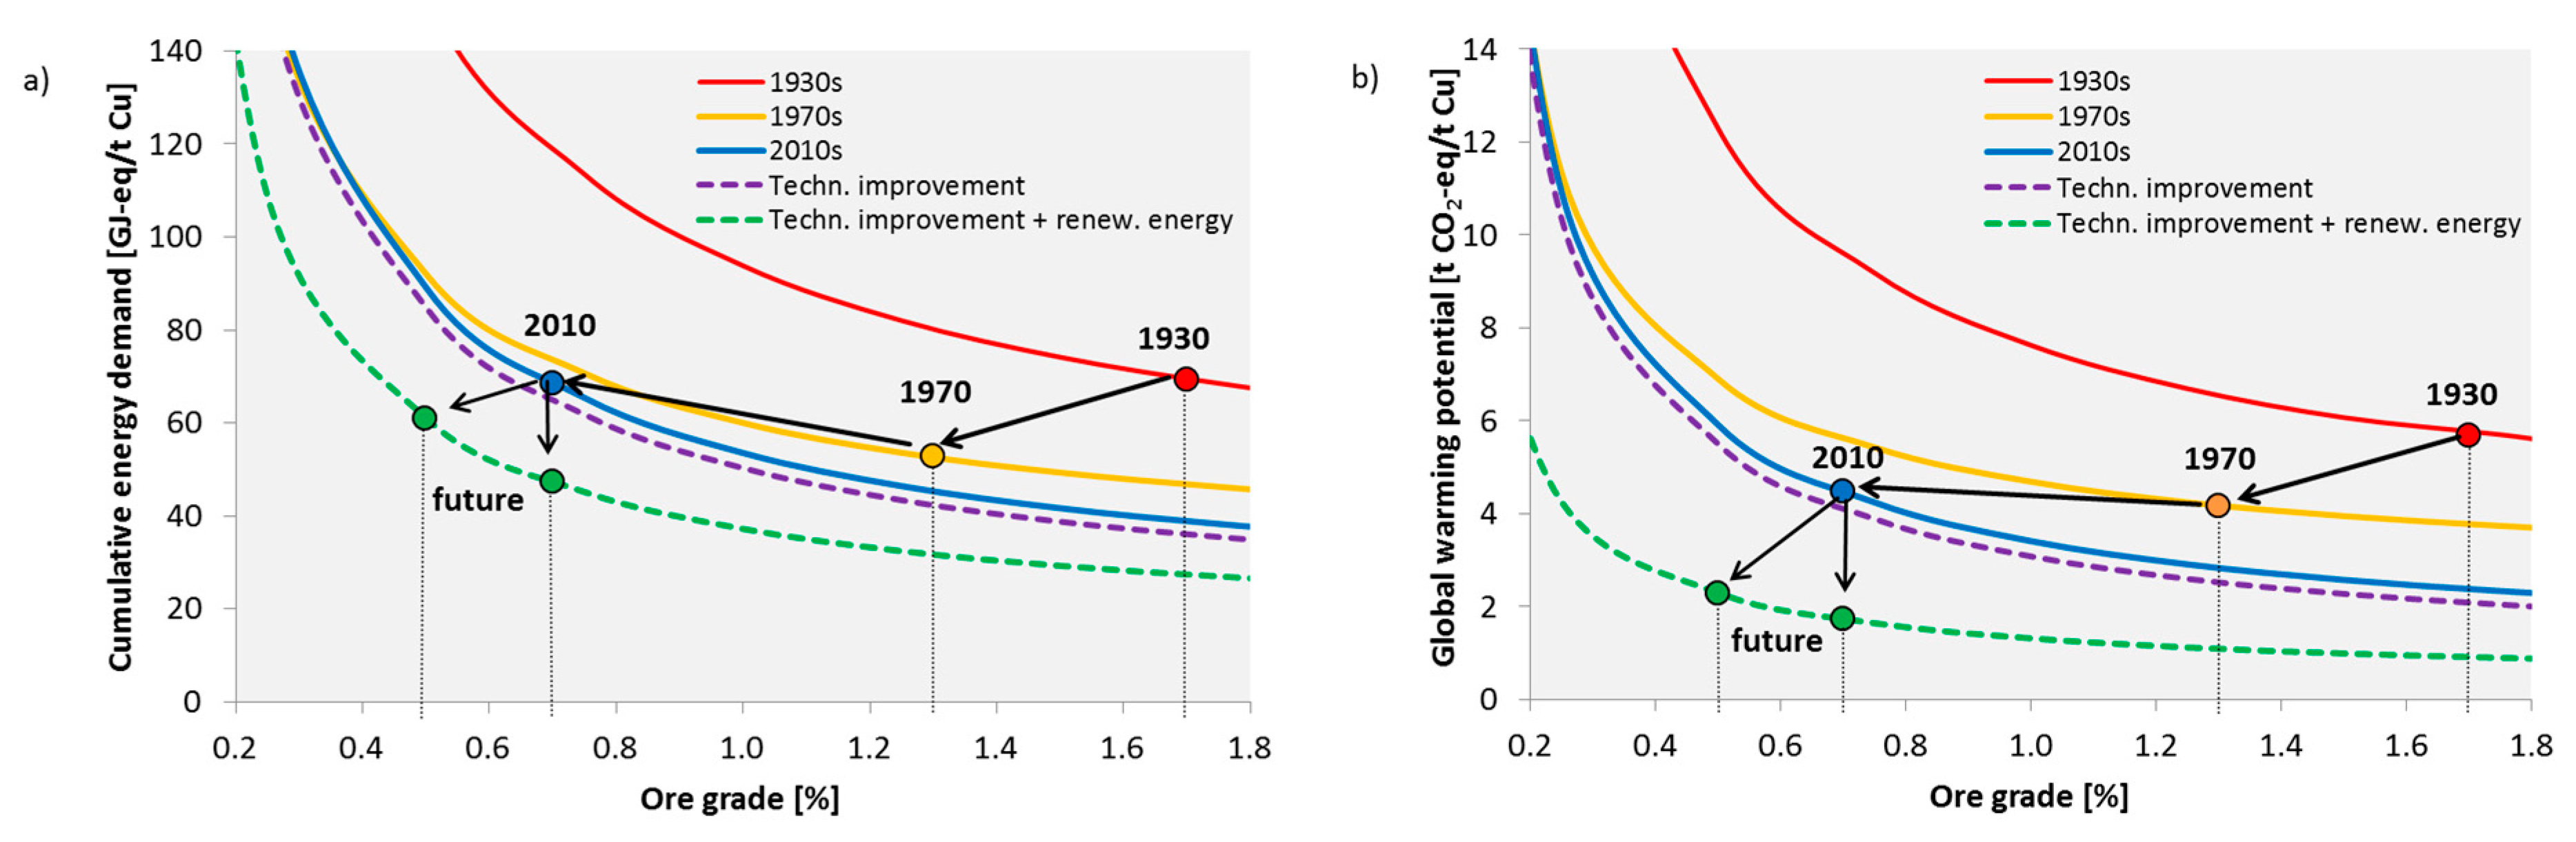
Figure 4a shows the ore grade-CED curves for the three time periods as determined by the modelling approach. The above described technological improvements and changes, led to a noticeable lowering of the curve from the 1930s to the 1970s. The main driver behind this was the shift to open pit mines and the improvement in electricity generation technologies. A further shift downwards was achieved from the 1970s until today. However, the difference is not that large because there were only minor technological improvements. Additionally, the influence of geological factors increased. This becomes apparent by the overlap of the 1970 and 2010 curves at an ore content of 0.32% (CED): at such a low ore content, production under today’s conditions is more energy-intensive than it would have been in the 1970s. Although the fixed contribution of metallurgy has been significantly reduced, the cost of mining and processing has increased, e.g., due to a greater depth and higher SR, which means that the CED of mining and CGF increases more quickly with a decreasing ore content. However, there are individual mines that can currently economically extract ore with even lower ore content, e.g., Boliden in Sweden [50].
The dots in Figure 4a represent the time-specific ore content and CED, respectively. Despite decreasing ore grade, the CED has been kept relatively constant over the years. From the 1930s to the 1970s, the average ore grade fell from approximately 1.7% to 1.3%, but the CED of copper could be reduced by 24% from 70 to 53 GJ-eq/t Cu cathode (see Table 1). Today, we have an average global ore grade of approximately 0.7%, and the CED of copper production has increased since the 1970s by 30% to almost 69 GJ-eq/t Cu cathode; however, the CED today is still at the same level it was in the 1930s, although the ore grade is now much lower. With regard to the GWP (Figure 4b), we were able to successfully reduce it from the 1930s to the 1970s from 5.7 to 4.2 t CO2-eq/t Cu cathode mainly by reducing the emissions from electricity production. Since the 1970s, there has been, as with the CED, a slight increase to 4.5 t CO2-eq.
3.2. Future Developments
The future availability of copper will also be determined by the energy costs of its production. If there is no technological progress, geological factors will be the main drivers of these costs. But in addition, the future development of geological parameters is not known. However, if, for example, the ore grade falls to 0.5%, the CED will rise nearly 30% to 89 GJ-eq/t Cu cathode in the absence of technological improvements. If the decrease in ore grade is accompanied by an increase in the average mine depth to 750 m and a higher SR of 3, the energy demand will reach approximately 97 GJ-eq/t Cu cathode. However, a decrease in ore grades in the absence of technological progress is unlikely because deposits with lower ore grades will not become more attractive. Even if rising demand is the driving force, it cannot be said with certainty that there will be mining of lower ore grades. There are still deposits with higher ore grades [12,51], although a decrease seems to be more likely since a higher demand offers potentials for economies of scale and further technological improvements [52,53].
However, there are some recent trends in copper production technology and we assess their potential impacts in the following. Here, we focus on the pyrometallurgical route because of its importance and the uncertainty regarding the future significance of hydrometallurgy [7,54,55].
For the base case we assume the shares of open pit and underground mining, the mining depth, SR and the share of hydro- and pyrometallurgy to stay constant.
3.2.1. Mining
Open pit mining will continue to play an important role in worldwide copper extraction; this is certainly the case for Chile, which is the main copper producer now and probably will be in the future [52,54]. Therefore, we do not assume a change in the contribution of open pit mining to global copper production. In open pit mining we only expect a shift to electrically powered devices for transport [56]. Conveyor belts are a technology already in use, and we assume the replacement of diesel-powered transport trucks. This leads, in addition to a change in the major type of energy used, to a small reduction in direct energy consumption. With regard to underground mining, electrification and automatization are important research areas and have already been partially implemented (e.g., Borden Mine Canada). Therefore, we assumed that underground mining will be performed exclusively by electric vehicles, which has a positive effect on the direct energy demand, especially of mine ventilation. The energy consumption of mine ventilation mainly depends on the airflow required. When the mining fleet consists of diesel-powered vehicles, the total airflow needed is primarily determined by the necessary dilution of exhaust gases to ensure a healthy and safe working environment. When electrical vehicles are used, the airflow is required to avoid heat stress [57]. Therefore, a depth-airflow relationship is included to give a crude estimation of the development of energy consumption (a more detailed description of this and all other assumptions regarding the future development can be found in Appendix B).
3.2.2. Mineral Processing
Regarding the process steps of CGF, which contribute significantly to the CED of copper production, direct electricity consumption can be reduced through the use of new grinding technologies. High pressure grinding rolls (HPGR) can save a remarkable amount of energy [24,58]; here we assume 20%. However, we also assume that the efficiency of the mill will decrease by 5 percentage points because of more complex ores [22]. Additionally, an increasing share of treated seawater will increase the cost of the water supply in Chile (same production share as in 2010 assumed) [44]. Another aspect that is not included due to missing data but might change in the future is the hardness of the ore and the required grinding size. Harder ore and a finer grinding size result in higher energy consumption. The effect of a different grinding size on the energy consumption of grinding can be calculated by Bond’s Law. In our case, halving the grind size would lead to an 8% increase in the total CED of copper production, a reduction of 90% in the grind size would lead to an increase of approximately 35%, with all other technological improvements included.
3.2.3. Metallurgy
For metallurgy, we suppose that the Outokumpu furnace, which is currently the most widely used technology, will become standard. Furthermore, it seems reasonable that a shift from oil to natural gas will occur and that electricity use will be reduced by 20% [59]. These changes lead to a reduction in the CED attributed to pyrometallurgy and refining of approximately 17% per tonne of copper, maintaining the 2010 energy mix.
3.2.4. Electricity Supply
The trends in mining show a shift from fossil fuels to electricity. This is critical, as electricity production, when based mainly on fossil fuels, is relatively inefficient. However, electricity supply is undergoing a great change at the moment, and the mining industry is aware of the importance of renewable energy sources [60]. The effect of a renewable energy supply in addition to the technological improvements can be seen in Figure 5 (green line). For this, we assumed 100% renewable energy in the mining and CGF stages (which includes a total shift to renewables for the hydrometallurgical route because this process always occurs at the mining location), which is a best case scenario. A more conservative estimate was made by keeping the 2010 electricity mix (purple line).
3.2.5. Total Copper Production
Figure 5 shows the results of the improvements in the mining, CGF, and metallurgy processes. When there is no change in the mining factors like depth, the share of production routes and the electricity supply, the improvements in technology lead to a reduction to 65 GJ/t copper cathode. When the ore grade further declines to 0.5%, the CED will rise to 85 GJ/t copper cathode. Therefore, if we want to keep the CED at a constant level, there must also be a change in the background system. When the mining industry introduces a renewable energy supply for the mining and mineral processing stage as well as for hydrometallurgy, this could further reduce the CED to 47 GJ/t copper cathode (at an ore grade of 0.7%), which is a major improvement. By doing so, it would be possible to lower the CED of copper even if the ore grade decreases to 0.5% (61 GJ-eq/t copper cathode).
For the GWP, the case is similar. However, the introduction of a renewable energy supply would bring an even greater benefit than it does for the CED.
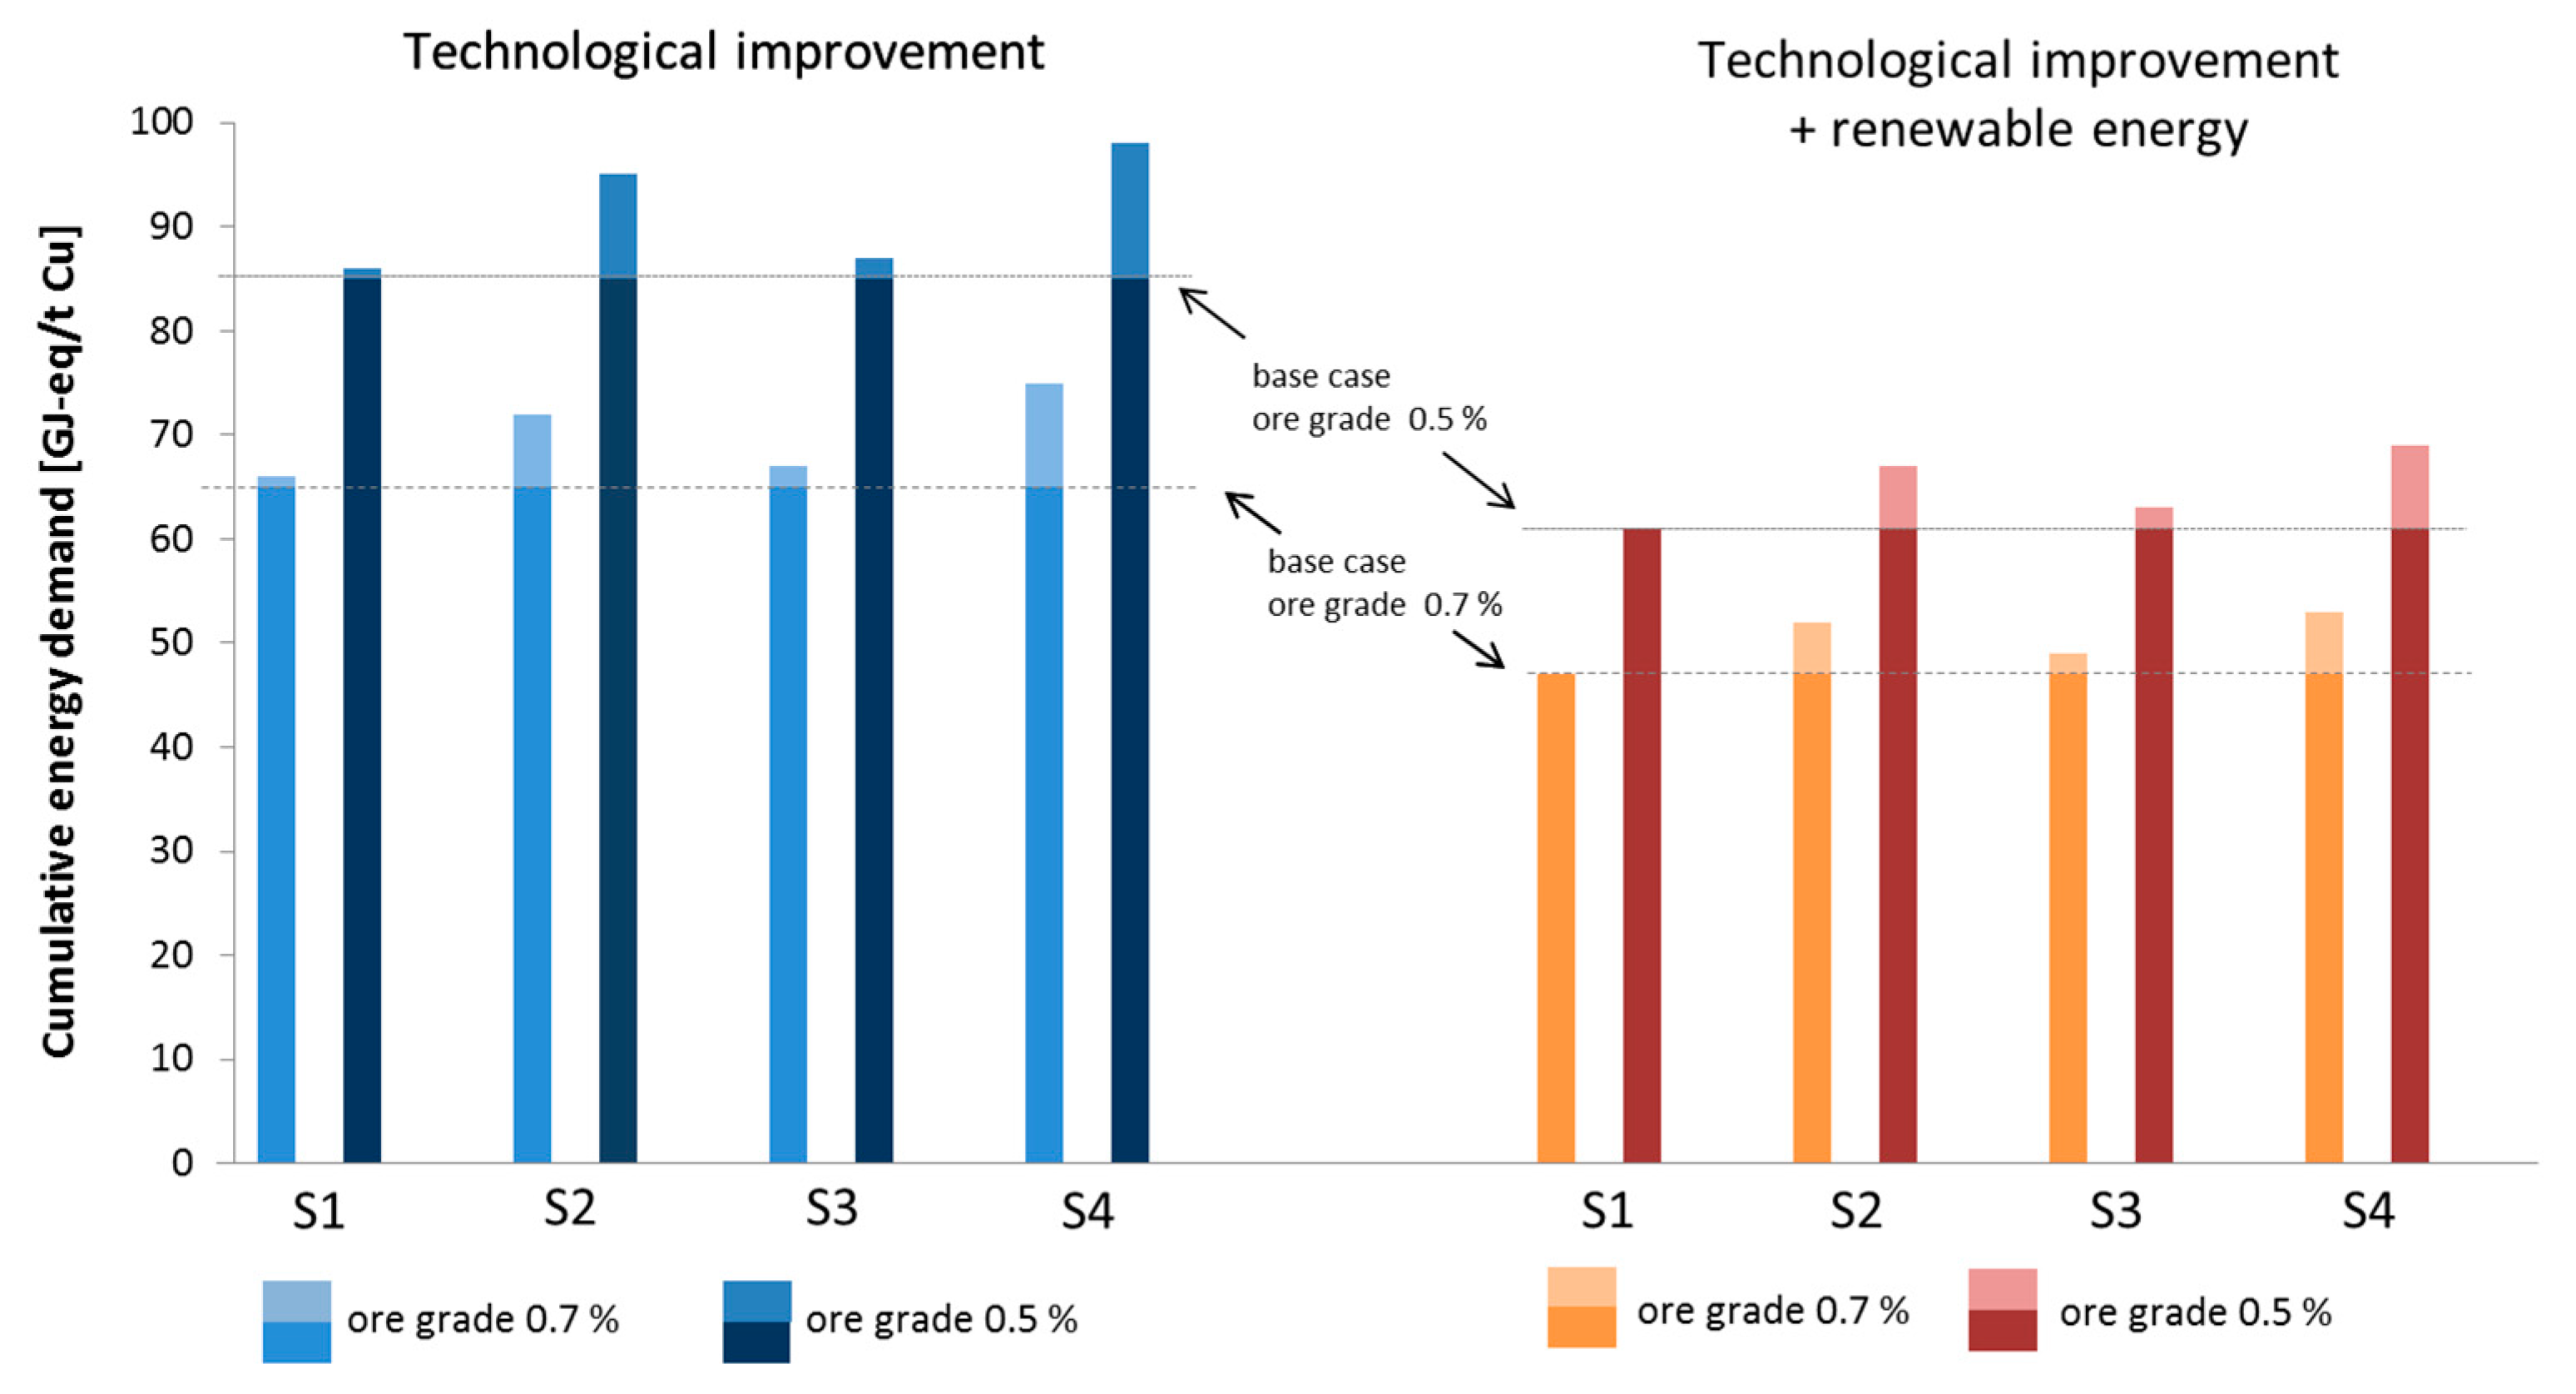
So far we have assumed the production shares and mining conditions like the depth to stay constant. To assess a possible change of these factors we created four scenarios:
- S1: share of open pit mining decreases to 80%
- S2: average depth increases to 750m and average SR to 3
- S3: share of hydrometallurgy rises to 30%
- S4: S1 + S2 + S3
The results for the future CED of the scenarios are shown in Figure 6.
Compared to the base case, scenario 4, which is a combination of the others, leads to an increase of 15% when maintaining the 2010s electricity mix and 13% when assuming the 100% renewable energy supply. The highest influence results from an increasing depth and SR. All other changes only have a minor impact on the overall CED.
4. Discussion
There are some aspects of the modelling and assumptions made that require further discussion.
4.1. Methodology and Data
The results presented here give an estimation of the development of the CED and GWP of average global primary copper production. By using a holistic process-based modelling approach we are able to include all material streams and the energetic effort of their production which gives additional information compared to approaches that are solely based on report data. The consumption of sulphuric acid, for example, has a remarkable influence on the CED of copper cathodes produced by hydrometallurgy. Further, we took the time-specific technology mix and average time-specific parameters like the ore grade to show the development of the CED on the long term. Our modelling approach was consistent over the regarded time span, and therefore allowed a comparison of the results and a discussion of the influence of technological improvements in the long term. This has not been taken into account by other authors. However, our results for the 1970s and 2010s were in line with the results determined by others like Chapman [19] or the Copper Alliance [18]. For the 1930s there is no data available that allow a comparison.
The CED and GWP of individual mines may differ substantially from the average due to individual geological conditions (ore grade, hardness of the ore, by-products…), state of technology, remoteness of the mine, and so on. This also becomes obvious by analysing report data from mining companies [15,17]. Nevertheless, the industry average is a good indicator for the overall impacts [52], particularly regarding a long-term trend.
When talking about specific mines, underground mines may have a greater range of total energy consumption than open pit mines due to site specific energy requirements for ventilation and cooling [61,62]. There are also different underground mining methods that might have an influence and are neglected here. Therefore, underground mining, and especially ventilation and cooling strategies, are an important field for further research. They could provide a solution to the obvious disadvantages of open pit mining, such as a change to the landscape [7]. But, under today’s conditions, or if only the technology of mining, CGF, and metallurgy is optimized, more underground mining will lead to a higher effort. However, if there is also a change in the electricity system, more underground mining could help to reduce the environmental impacts.
Of course, transportation of intermediate products also has a noticeable effect on the results, especially if the concentrate is transported over long distances. A concentrate has a copper content of approximately 30%. Therefore, about 70% of the transported material is mainly worthless tailings. Where the concentrate is produced and where the concentrate is smelted depends mainly on market contracts. To determine an average value for the different time periods is difficult and rather increases data uncertainty than adding valuable information. However, more reliable information on the whole supply chain would be of great interest.
As already discussed within the results, we assumed electricity to be from national grids. However, many of the biggest mines in Chile, like Escondida, Antamina, Chuquicamata, Radomiro Tomic and Los Pelambres, which make a big contributions to annual copper production (together about 16% in 2013), are connected to the national grid [63,64,65,66]. By the 1930s big mining regions like Katanga and Bingham Canyon were supplied by hydroelectric power plants [39,67,68,69]. The electricity mix of the national grids of Chile and the US reflects this quite well as hydro power made an important contribution to the national electricity generation in the 1930s; the rest was from fossil fuels. Hence, the national grid is a good approximation for the average production, especially as there is no more information available on a global level. The future scenario with a 100% renewable energy mix for mining and beneficiation, as well as for hydrometallurgy, is a best case scenario. Of course, not all mines will have a 100% renewable energy production in the foreseeable future. This scenario reveals the potential reductions that are possible by introducing renewable energies and, therefore, highlights their importance. A more conservative estimate regarding electricity supply is also given by maintaining the 2010s electricity mix. The truth of future electricity supply lies somewhere in the middle.
The data used is mainly data from the literature and subject to some uncertainties. This uncertainty increases the further you go back in time. Wherever possible, we crosschecked the data used with other literature sources to ensure that the data represents common technology. However, for the background system we sometimes had to estimate the CED and GWP of materials for the 1930s based on other years. As energy contributes most to the CED of total copper production, the influence of these estimations on the overall result is small.
With regard to the future development of hydrometallurgy, we did not assume major changes because we could not identify reliable information about its future development. In general, hydrometallurgy is more energy intensive than pyrometallurgy; only by the use of renewable energy sources can it become comparable to pyrometallurgy in terms of its CED.
Besides the CED and GWP there are other important environmental problems, such as SO2 emissions, that we have not addressed because of the scope of the current work, which does not mean that they are less relevant. Before measures are implemented, all possible impacts should be taken into account.
4.2. By-Products
Further, it must be kept in mind that metal production is often not a one product system, e.g., gold, silver, molybdenum, cobalt, nickel, zinc, lead, and sulphuric acid are important by-products of copper production that have not been taken into account so far.
In life cycle assessment (LCA) there are different ways to deal with by-products, namely system expansion and allocation based on physical or economic principles [70]. For metal production, an economic allocation, or a combination of economic and physical allocation, is commonly used. For sulphuric acid the case is different. In the past, sulphur dioxide was emitted to the air causing huge environmental pollution. The introduction of new environmental regulations forced the mining industry to reduce the emission of sulphur dioxide. Therefore, the production of sulfuric acid is driven by environmental regulations. In such a case system expansion is commonly used.
To the authors’ knowledge, there is no reliable data on the quantity of by-products of copper production at a global level—neither for the past nor for today. Nevertheless, there is data for the US which will be used here to give an indication of the influence of by-products. Additionally, we researched global by-production for the year 2010, which gives a rough approximation (see Appendix D, Table A7). The allocation factors determined are given in Table 2.
Regarding physical allocation, almost all burdens are attributed to copper, since the amount of by-products is relatively small. Using an economic allocation, the influence of the by-products was higher and the share of the total effort that is allocated to copper decreases with time, with a remarkable decrease since the 1970s, which was mainly driven by increasing molybdenum and gold prices. Also, sulphuric acid production, and hence the value given to copper production, has increased. A comparison of the US and global values in 2010 shows, that the effort allocated to copper is even smaller on the global level.
However, it would be of great interest to have more accurate data on global by-products to better understand global supply chains and the influence of actions regarding one metal on others. The global supply chain might offer more potential for a further reduction in the energetic effort that can only be assessed if a global overview of all sources and routes would be available and all by-products could be included.
5. Conclusions
With the holistic process-based modelling approach, we are able to show that the CED and GWP could be kept at a relatively constant level to date, which is in line with the constant copper price over the last several decades. This contradicts the assumption that the supply of primary resources is restricted because of extreme increases in the energetic effort—this has not been the case so far. The values stated here should be understood as a rough long term trend. It was quite difficult to make this approximation due to the data available—for the past but also for today. Hence, we want to emphasise the importance of a good and transparent documentation of the energy consumption and related data of mining activities to facilitate future research.
Additionally, we can show that there is still potential to lower the energetic effort required for global copper production. The implementation of these potential improvements is up to the mine operators and the politicians, who must set the right incentives. This becomes even more important, as secondary resources are not yet available in sufficient quantities [1] and are also associated with an energetic and environmental effort [71]; their advantageousness should not be assumed. If we take the appropriate measures, we will be able to continue this trend of a stable or even declining CED and GWP, respectively, even if ore grades decline further. The most important action required to achieve this is to introduce renewable energies in all process stages [60]. Therefore, mining companies should have a special focus on their electricity supply. The electricity supply might not always be in the hands of the mine operators. For example, when the mine is connected to the national grid, further development depends on the region or country. But if mining companies have the choice they should use renewable energies. Specific improvements in mining and processing technology are also of high significance, but in the absence of renewable technologies producing an increasing share of electricity, it will be challenging to offset a possible lower deposit quality, especially if there is a trend towards electrification. Electrification is an important issue in underground mining, which might gain importance as mines get deeper. Further research is needed to determine whether it will be able help to lower the environmental impacts of mining. Furthermore, we want to emphasize that as copper demand rises [1,3], total emissions will, of course, increase. Here, we only focus on specific emissions.
Author Contributions
Conceptualization, M.S.; Data curation, N.R.; Funding acquisition, M.S.; Investigation, N.R.; Supervision, M.S.; Writing—original draft, N.R.; Writing—review & editing, M.S. All authors have read and agreed to the published version of the manuscript.
Funding
This research was funded by the Ministry of Environment, Climate Protection, and the Energy Sector of Baden-Württemberg (Germany) within the NEXUS project (grant number [L7516001]).
Conflicts of Interest
The authors declare no conflict of interest.
Appendix A. Foreground System
Table A1 presents the time-specific parameters included in the model and Table A2 gives the time-specific material and energy consumption of the individual process steps.

Table A1.
Time-specific parameters. OP = open pit; UG = underground; SX = solvent extraction; EW = electrowinning; CGF = crushing, grinding, and flotation.
Table A1.
Time-specific parameters. OP = open pit; UG = underground; SX = solvent extraction; EW = electrowinning; CGF = crushing, grinding, and flotation.
| Parameter | 1930 | Source | 1970 | Source | 2010 | Source |
|---|---|---|---|---|---|---|
| Share OP mining | 50% | Estimation based on [37,39,72]1 | 90% | Estimation based on [40,41] | 90% | [73] |
| Share UG mining | 50% | 10% | 10% | |||
| Share pyrometallurgy | 85% | [45] | 85% | [46] | 80% | [48,51] |
| Share hydrometallurgy | 15% | 15% | 20% | |||
| Share SX-EW | - | Estimation based on [45] | - | [46] | 100% | [48] |
| Share direct EW | 75% | 60% | - | |||
| Share cementation | 25% | 40% | - | |||
| Ore grade = Mill head grade | 1.7% | [11]; corrected for recovery rate of 85% | 1.3% | [11]; corrected for recovery rate of 85% | 0.7% | [11,74] |
| Stripping ratio | OP 1.1 | [68,75] | OP 1.9 | [20,21]; average | OP 2.5 | [28] |
| UG n.a. | UG 0.1 | [20] | UG 0.1 | |||
| Depth | OP 250 m UG n.a. | Estimation | n.a. | OP/UG: 500 m | [76] | |
| Recovery rate CGF | 90% | [67,77] | 88% | [21] | 90% | [24,48] |
| Recovery rate leaching | 70% | Estimation based on other years | 75% | [46] | 70% | [18,48] |
| Smelting technology | Reverb | [45] | Reverb | [20,46] | Mix, mainly Flash | [48,78] |
| Recovery rate smelting | 98% | [79] | 98% | [46] | 97% | [48]; only for previous steps |
| Recovery rate refining | 100% | Estimation | 99% | [19] | 100% | Estimation |
| Recovery rate cementation | 95% | Estimation based on 1970 | 95% | [46] | - | |
| Recovery rate SX | - | - | 90% | [48] | ||
| Recovery rate EW | 100% | Estimation | 100% | Estimation | 100% | Estimation |
1 Share of OP and UG mining in the 30s: In the USA (>50% of world mine production), the share of OP to UG was about 50:50 [37]; for Chile (second most important copper producer) a ratio of OP to OG of 50:50 was assumed, based on the production figures of the most important mines Chuquicamata (OP) [72] and El Teniente (UG) [38]. In the Congo, which was the third most important copper producer, OP mining dominated [39].
Table A2.
Time-specific foreground data.
| Note: All Data Refer to Metric Tons | 2010 | 1970 | 1930 | |||||||||
|---|---|---|---|---|---|---|---|---|---|---|---|---|
| Process Step | Input | Value | Source | Remark | Value | Source | Remark | Value | Source | Remark | ||
| Mining | Reference [19]: Original document probably in long tons, no conversion was made, as the associated error (<2%) is negligible | Reference [68]: Original document assumed to be in short tons; Bingham Canyon was already 450 m deep, to adjust values to 250 m it is assumed that 30% are depth related | ||||||||||
| OP | Mining | Electricity (kWh/t ore) | 1.0 | [24,31] | Crushing in mine | 0.9 | [19] | 0.9 | [68] | |||
| Stripping | Electricity (kWh/t overburden) | - | - | - | - | 0.7 | [68] | Assumed density 2 t/m3 | ||||
| Mining | Diesel (MJ/t ore) | 15.7 | [80,81] | Calculated; Drilling (2 MJ) + Loading (CAT 6090 FS; 7.3 MJ) + Transport (CAT 795F AC; 1.3 MJ + 0.5 MJ× km) | 10.8 | [19] | For more detailed information see original source | - | ||||
| Stripping | Coal (kg/t overburden) | - | - | - | - | - | 1.4 | [68] | Assumed density 2 t/m3 | |||
| Mining | Explosives (kg/t ore) | 0.3 | [82] | Powder factor medium, assumed density 2 t/m3 | 0.1 | [19] | 0.1 | [68] | ||||
| Stripping | Explosives (kg/t overburden) | - | - | - | - | 0.1 | [68] | Assumed density 2 t/m3 | ||||
| UG | Mining | Electricity (kWh/t ore) | 25.0 | [24,62,83] | Own calculation; Ventilation (20 kWh) + Crushing (1 kWh) + Hoisting (0.008 kWh/m·depth in m) | 15.0 | [20,47] | Total, mining and stripping | 20.4 | [75] | Total, mining and stripping; mean value from 100 and 200 tons production | |
| Mining | Diesel (MJ/t ore) | 17.2 | [80,83,84,85] | Own calculation; Drilling (11.5 MJ), Hauling + Loading (5.7 MJ) | 21.8 | [20,47] | Total, mining and stripping | - | ||||
| Mining | Nat Gas (MJ/t ore) | - | 13.4 | [20,47] | Total, mining and stripping | - | ||||||
| Mining | Explosives (kg/t ore) | 0.4 | [83] | 0.7 | [20] | 0.7 | [75] | Total, mining and stripping; mean value from 100 and 200 tons production | ||||
| Stripping | Explosives (kg/t overburden) | - | 0.7 | Estimation based on [20] | - | |||||||
| CGF | ||||||||||||
| Crushing | Electricity (kWh/t ore milled) | 12.4 | WI: [31] | Own calculation; 150,000 to 400 μm and 400 to 100 μm (Bonds law); WI 12.7 | 15.0 | [19,20] | 3.9 | [67] | ||||
| Grinding | Electricity (kWh/t ore milled) | 8.3 | [67] | |||||||||
| Flotation | Electricity (kWh/t ore milled) | 4.0 | [24] | Incl. regrinding and tailings disposal | 5.4 | [67] | ||||||
| Dewatering | Electricity (kWh/t ore milled) | - | 0.2 | [67] | ||||||||
| Water Supply + Research | Electricity (kWh/t ore milled) | - | - | 0.6 | [67] | |||||||
| CFG | Water (m3/t ore milled) | 0.6 | [44] | Approximation | 2.8 | [19] | 4.0 | [77] | Average from two mines | |||
| Crushing & Grinding | Steel (kg/t ore milled) | 0.7 | [24] | 1.0 | [20,46] | 0.7 | [67] | |||||
| Flotation | Lime (kg/t ore milled) | 1.0 | [48] | Approximation | 1.8 | [19,20] | 1.9 | [67] | ||||
| Flotation | Chemicals (kg/t ore milled) | 0.1 | [48] | Approximation; Collector: Xanthate 30 g Frother: MIBC 100 g | 0.05 | [19,20] | 0.1 | [67] | ||||
| Leaching VAT, EW | ||||||||||||
| VAT Leaching | Electricity (kWh/t ore) | - | 6.8 | Own calculation based on [24] | Leaching, crushing, grinding from 150,000 to 10,000 μm (Bonds law); WI 12.7 | 6.8 | Estimation based on 1970 | |||||
| VAT Leaching | Water (m3/t ore) | - | 0.2 | Estimation based on other years | 0.3 | [86] | ||||||
| VAT Leaching | H2SO4 (kg/t ore) | - | 30.0 | [46] | 12.3 | [86] | Concentration of H2SO4 adjusted (100% acid) | |||||
| EW | Electricity (kWh/t Cu) | - | 2400 | [20] | Value per t Cu cathode | 2430 | Estimation based on [45] | Value per t Cu cathode | ||||
| Leaching heap, cementation or SX-EW | For pyrometallurgy values stated below are adjusted according to copper concentration of input (90%) | |||||||||||
| Heap Leaching | Electricity (kWh/t ore) | 3.0 | [24] | Leaching, crushing | 5.9 | Own calculation based on [24] | Leaching, primary and secondary crushing | 5.9 | Estimation based on 1970 | |||
| Heap Leaching | Water (m3/t ore) | 0.1 | [44] | Approximation | 0.2 | Estimation based on other years | 0.3 | Estimation based on VAT Leaching | ||||
| Heap Leaching | H2SO4 (kg/t ore) | 13.0 | [18] | Average | 42.5 | [87] | Average, assumed recovery rate 70% | 24.7 | Estimation based on VAT Leaching | Double VAT Leaching [86]; solution from cementation not recoverable [88] | ||
| Cementation | Electricity (kWh/t Cu) | - | 5.6 | [21] | 90% Cu in cement copper [89] | 6.7 | Estimation based on 1970 | 75% Cu in cement copper [86] | ||||
| Cementation | Steel Scrap (t/t Cu) | - | 1.8 | [46] | 2.0 | [86] | ||||||
| SX | Electricity (kWh/t Cu) | 1000 | [24] | - | - | |||||||
| SX | Steam (kg/t Cu) | 0.2 | [90] | - | - | |||||||
| EW | Electricity (kWh/t Cu) | 2000 | [18,49] | Value per t Cu cathode | - | - | ||||||
| Pyrometallurgy | ||||||||||||
| Smelting & Converting | Pulv. Coal (MJ/t Cu) | - | 21,771 | [46] | 18,833 | [91] | Adjusted: concentration (32% Cu in conc.) and moisture of 10%; incl. heat recovery | |||||
| Electricity (kWh/t Cu) | 500 | [78] | Mix | - | 300 | Estimation based on [19] | Air blower | |||||
| Fuel Oil (MJ/t Cu) | 4175 | [78] | Mix | - | - | |||||||
| Oxygen (kg/t Cu) | 909 | [78] | Mix | - | - | |||||||
| Silica Flux (kg/t Cu) | 350 | [78] | Mix | 1140 | [92] | n.a. | Negligible | |||||
| Limestone (kg/t Cu) | 180 | [78] | Mix | 140 | [92] | n.a. | Negligible | |||||
| Scrap (kg/t Cu) | 110 | [78] | Mix | - | ||||||||
| Fire Refining | Nat. Gas (MJ/t Cu) | - | 1884 | [46] | 2678 | [45] | Incl. heat recovery | |||||
| Elect. Refining | Electricity (kWh/t Cu) | 400 | [24,93] | 300 | [46] | 401 | [45] | Maximum | ||||
| Gas Treatment | Water (m3/t Cu) | 0.5 | [78] | Mix | - | |||||||
Appendix B. Future Developments
As described, for the prognosis we adjusted the 2010s model. Regarding technology we made the following assumptions:
- OP mining: change to conveyor instead of diesel driven trucks
- ○
- Energy demand conveyor: 0.0025kWh/t·m vertical lift [94]
- ○
- Total energy demand OP mining:
- ▪
- Electricity: 2.3 kWh/ton ore or overburden
- ▪
- Diesel: 9.3 MJ Diesel/ton ore or overburden
- ▪
- Explosives: 2010 value
- UG mining: shift to fully electric vehicles
- ○
- Energy demand drilling: 70% of corresponding diesel equipment [61]
- ○
- Energy demand hauling: 0.5 kWh/ton ore or overburden [84]
- ○
- Energy demand transport: 2010 value (shaft)
- ○
- Ventilation: regulation of the temperature is the determining factor for ventilation in electrically operated mines. The temperature rises with increasing depth, and therefore also the required air flow. The extent to which the air flow rises cannot be clearly determined from literature sources [57,61]. In the work of Koksis and Hardcastle [57] the air flow increases by 3% per 100 m with an increase in mine depth from 240 m to 900 m. Halim u. Kerai [61] assume an airflow increase by 15% per 100 m (from 600 m to 1000 m) plus air cooling. In this work an increase of 10% per 100 m is assumed. An additional cooling effort is not included in this work as this is usually the case at a depth that is not reached by copper mines. This leads to the following function to determine the electricity needed for ventilation:
- ○
- Total energy demand UG mining:
- ▪
- Electricity: 19.4 kWh/t ore or overburden
- ▪
- Explosives: 2010 value
- Beneficiation: 20% reduction of grinding energy [58]
- ○
- Total material flows smelting:
- ▪
- Nat. Gas: 2707 MJ/t Cu
- ▪
- Electricity: 400 kWh/t Cu
- ▪
- Oxygen: 1170 kg/t Cu
- ▪
- Silica Flux: 309 kg/t Cu
- ▪
- Limestone: 146 kg/t Cu
- ▪
- Scrap: 112 kg/t Cu
- ▪
- Water: 570 kg/t Cu (for Gas treatment)
Appendix C. Background System
Table A3 and Table A4 give the time-specific CED and GWP of the materials used in the foreground system. Table A5 and Table A6 present the efficiencies and country mix used for the assessment of electricity generation.
Table A3.
Time-specific CED background data.
| CED | 1930 | 1970 | 2010 | ||||||
|---|---|---|---|---|---|---|---|---|---|
| Material | Value | Source | Remark | Value | Source | Remark | Value | Source | Remark |
| Explosive (MJ-eq/kg) | 49.9 | [21] | Highest literature value for 1970 as approx. | 35.5 | [19] | 22.7 | Own calculation based on ecoinvent datasets | 95% fuel oil, 5% nitric acid | |
| Steel (MJ-eq/kg) | 63.0 | [95] | 1950 value | 40.0 | [95] | 22 | ecoinvent v3.3, market for steel, unalloyed (GLO) | According to [95]: 18 MJ-eq/kg | |
| Steel scrap (MJ-eq/kg) | 31.2 | Own calculation based on development of CED of steel | 19.8 | [21] | - | - | |||
| Copper scrap (MJ-eq/kg) | - | - | 0.6 | ecoinvent v3.3, market for copper scrap, sorted, pressed (GLO) | |||||
| Diesel (MJ-eq/MJ) | - | 1.5 | ecoinvent v3.3 diesel, burned in building machine (GLO) | 2010 value | 1.5 | ecoinvent v3.3, diesel, burned in building machine (GLO) | |||
| Lime(stone) (MJ-eq/kg) | - | - | 0.04 | ecoinvent v3.3, limestone production, crushed, washed (RoW) | |||||
| Lime (MJ-eq/kg) | 4.8 | [19] Appendix 15 | 1970 value as approximation | 4.8 | [19] Appendix 15 | 7.1 | ecoinvent v3.3, market for quicklime, milled, packed (GLO) | ||
| Chemicals (MJ-eq/kg) | 19.8 | [19] | 1970 value as approximation | 19.8 | [19] | 66.3 | Own calculation | Mixture of 23% frother (MIBC) and 77% collector (Xanthate) | |
| Collector Xanthate (MJ-eq/kg) | - | - | 54.1 | Own calculation based on [96] | |||||
| Frother MIBC (MJ-eq/kg) | - | - | 107 | [97] | |||||
| Oxygen (MJ-eq/kg) | - | - | 3.4 | Based on ecoinvent v3.3, air separation, cryogenic (RER) | Electricity consumption in dataset adjusted according to [98] | ||||
| Silica (MJ-eq/kg) | - | 0.4 | [21,99] | Production + crushing | 0.6 | ecoinvent v3.3, market for silica sand (GLO) | |||
| Water, desalinated (MJ-eq/m3)1 | - | - | 38.0 | Own calculation based on [44,54] | Only for production share of Chile (36%) | ||||
| Sulfuric acid (MJ-eq/kg) | 8.7 | Calculation based on 1970 to 2010 | Main contribution from sulphur | 7.6 | [100] | 6.7 | ecoinvent v3.3, market for sulfuric acid (GLO) | ||
| Steam (MJ-eq/kg) | - | - | 2.8 | ecoinvent v3.3, market for steam, chemical industry (GLO) | |||||
| Nat. Gas (MJ-eq/MJ) | 1.1 | Estimation based on [101] | Average | 1.1 | Estimation based on [101] | Average | 1.1 | ecoinvent v3.3, market group for natural gas, high pressure (GLO) | Assumed heating value: 11.4 kWh/m3 |
| Fuel Oil (MJ-eq/kg) | - | - | 56.4 | ecoinvent v3.3, market for heavy fuel oil (RoW) | |||||
| Coal (MJ-eq/MJ) | 1.0 | [102] | 1.0 | [102] | - | ||||
| Electricity Mining (MJ-eq/kWh) | 14.4 | Calculation, see 2.2.2 | 7.0 | Calculation, see 2.2.2 | 7.7 | Calculation, see 2.2.2 | |||
| Electricity Smelting (MJ-eq/kWh) | 14.4 | Calculation, see 2.2.2 | 7.2 | Calculation, see 2.2.2 | 8.4 | Calculation, see 2.2.2 | |||
| Electricity Refining (MJ-eq/kWh) | 14.4 | Calculation, see 2.2.2 | 8.0 | Calculation, see 2.2.2 | 8.4 | Calculation, see 2.2.2 | |||
1 CED for water in prognosis is 72 MJ-eq/m3 (only techn. improvement) and 29 MJ-eq/m3 (for techn. improvement + renew, when the future electricity mix of Chile is assumed). The calculation is based on the developments stated in reference [44].
Table A4.
Time-specific GWP background data.
| GWP | 1930 | 1970 | 2010 | ||||||
|---|---|---|---|---|---|---|---|---|---|
| Material | Value | Source | Remark | Value | Source | Remark | Value | Source | Remark |
| Explosive (kg CO2/kg) | 6.4 | Estimation based on CED | 4.6 | Estimation based on CED | 2.9 | Calculation | |||
| Steel (kg CO2/kg) | 4.9 | [95] | 1950 value | 3.8 | [95] | 2.0 | ecoinvent v3.3, market for steel, unalloyed (GLO) | ||
| Steel Scrap (kg CO2/kg) | 1.7 | Estimation based on CED steel and steel scrap | 1.3 | Estimation based on CED steel and steel scrap | - | - | |||
| Copper Scrap (kg CO2/kg) | - | - | 0.03 | ecoinvent v3.3, market for copper scrap, sorted, pressed (GLO) | |||||
| Diesel (kg CO2/MJ) | - | 0.1 | ecoinvent v3.3 diesel, burned in building machine (GLO) | 2010 value assumed | 0.1 | ecoinvent v3.3 diesel, burned in building machine (GLO) | |||
| Lime(stone) (kg CO2/kg) | - | - | 3 × 10⁻³ | ecoinvent v3.3, limestone production, crushed, washed (RoW) | |||||
| Lime (kg CO2/kg) | 0.8 | Estimation based on CED | 1970 value | 0.8 | Estimation based on CED | 1.2 | ecoinvent v3.3, market for quicklime, milled, packed (GLO) | ||
| Chemicals (kg CO2/kg) | 0.26 | Estimation based on CED | 1970 value | 0.26 | Estimation based on CED | 0.87 | Calculation | ||
| Xanthate (kg CO2/kg) | - | 1.6 | Calculation based on [96] | ||||||
| Frother (kg CO2/kg) | - | - | 3.2 | [97] | |||||
| Oxygen (kg CO2/kg) | - | - | −0.2 | Based on ecoinvent v3.3, air separation, cryogenic (RER) | Electricity consumption adjusted according to [98] | ||||
| Silica (kg CO2/kg) | - | 0.03 | Estimation based on CED | 0.05 | ecoinvent v3.3, market for silica sand (GLO) | ||||
| Water, tap (kg CO2/kg)1 | 1.7 × 10⁻⁴ | Estimation based on 1970 | 1.7 × 10⁻⁴ | Estimation based on CED | 5.7 × 10⁻⁴ | ecoinvent v3.3, market group for tap water (GLO) | |||
| Water, desalinated (t CO2/m3)1 | - | - | 2.5 | own calculation based on [44] | |||||
| Sulfuric acid (kg CO2/kg) | 0.20 | Estimation based on CED | 0.18 | Estimation based on CED | 0.16 | ecoinvent v 3.3 market for sulfuric acid (GLO) | |||
| Steam (kg CO2/kg) | - | - | 0.2 | ecoinvent v3.3, market for steam, chemical industry (GLO) | |||||
| Nat. Gas (kg CO2/MJ) | 0.06 | [32] | Standard emission factor | 0.06 | [32] | Standard emission factor | 0.06 | ecoinvent v3.3, market group for natural gas, high pressure (GLO), [32] | Production + combustion |
| Fuel Oil (kg CO2/MJ) | - | - | 0.09 | ecoinvent v3.3, market for heavy fuel oil (RoW), [32] | Production + combustion | ||||
| Coal (kg CO2/MJ) | 0.1 | [32] | Standard emission factor | 0.1 | [32] | Standard emission factor | - | ||
| Electricity Mining (kg CO2/kWh) | 1.2 | Calculation, see 2.2.2 | 0.5 | Calculation, see 2.2.2 | 0.5 | Calculation, see 2.2.2 | |||
| Electricity Smelting (kg CO2/kWh) | 1.2 | Calculation, see 2.2.2 | 0.5 | Calculation, see 2.2.2 | 0.6 | Calculation, see 2.2.2 | |||
| Electricity Refining (kg CO2/kWh) | 1.2 | Calculation, see 2.2.2 | 0.6 | Calculation, see 2.2.2 | 0.6 | Calculation, see 2.2.2 | |||
1 GWP for water in prognosis is 0.005 CO2-eq/m3 (only techn. improvement) and 0.0004 CO2-eq /m3 (for techn. improvement + renew, when the future electricity mix of Chile is assumed). The calculation is based on the developments stated in reference [44].
Table A5.
Efficiency of electricity generation.
| Energy Carrier | Efficiency1 | Source |
|---|---|---|
| Hydro | 90% | [103] |
| Coal | 33% | [104] |
| Natural Gas | 42% | [104] |
| Oil/Petr. | 31% | [104] |
| Nuclear | 33% | [104] |
| Others (Renewables) | 94% | [103] |
Table A6.
Time-specific country mix for electricity generation.
| 1930s | 1970s | 2010s | ||||
|---|---|---|---|---|---|---|
| Mining | ||||||
| USA | 74% | USA | 30% | Chile | 40% | |
| Chile | 26% | Chile | 13% | Peru | 9% | |
| Zambia | 13% | China | 9% | |||
| Canada | 12% | USA | 8% | |||
| USSR | 11% | Indonesia | 6% | |||
| Congo | 7% | Australia | 6% | |||
| Peru | 4% | Russia | 5% | |||
| South Africa | 3% | Zambia | 5% | |||
| Australia | 3% | Canada | 4% | |||
| Philippines | 3% | Poland | 3% | |||
| Congo | 3% | |||||
| Smelting | ||||||
| USA | 78% | USA | 27% | China | 23% | |
| Chile | 22% | Japan | 13% | Chile | 13% | |
| Zambia | 12% | Japan | 12% | |||
| Chile | 12% | India | 5% | |||
| ZSSR | 10% | USA | 5% | |||
| Canada | 9% | Russia | 5% | |||
| Congo | 7% | North Korea | 5% | |||
| Peru | 3% | Zambia | 4% | |||
| South Africa | 2% | Poland | 4% | |||
| Yugoslavia | 2% | Australia | 3% | |||
| China | 2% | Germany | 3% | |||
| Kazakhstan | 3% | |||||
| Canada | 3% | |||||
| Peru | 3% | |||||
| Iran | 2% | |||||
| Indonesia | 2% | |||||
| Bulgaria | 2% | |||||
| Spain | 2% | |||||
| Refining | ||||||
| n.a., same shares as smelting assumed | USA | 25% | Chile | 23% | ||
| Japan | 13% | China | 21% | |||
| USSR | 10% | Japan | 9% | |||
| Zambia | 9% | USA | 7% | |||
| Canada | 8% | Russia | 5% | |||
| Chile | 8% | India | 5% | |||
| Germany, West | 7% | Zambia | 4% | |||
| Belgium | 6% | South Korea | 3% | |||
| Zaire | 4% | Poland | 3% | |||
| Australia | 2% | Australia | 3% | |||
| Spain | 2% | Peru | 3% | |||
| China | 2% | Germany | 2% | |||
| Poland | 2% | Kazakhstan | 2% | |||
| Yugoslavia | 2% | Canada | 2% | |||
| Indonesia | 2% | |||||
| Mexico | 2% | |||||
| Spain | 2% | |||||
| Congo | 2% | |||||
Production shares are taken from United States Geological Survey and Bureau of Mines [107].
For the prognosis we assumed 100% renewable energy for the mining and beneficiation stage as well as for hydrometallurgy. The assumed efficiency is 94% (see Table A5) with a GWP of 1.6 × 10⁻⁵ (GWP based on electricity production, wind, 1-3 MW turbine, onshore (RoW)).
When compared to other data sources that state emissions of electricity production for the year 2010 the here determined GWP is in the same range. The CED on the other hand is on the lower bound. This might be due to the assumed generation mix. We made no detailed differentiation of technologies used in different countries and also assumed a standard technology for each energy carrier. Nevertheless, the aim of this work was to compare different time spans, therefore a consistent methodology was necessary.
Appendix D. Allocation
As there is little data available on global co-production, especially for the past, stated allocation factors for the 1930s, 1970s and 2010s are based on the average US production. Regarding global production, an estimation of current production is provided. An overview of the researched production volumes is given in Table A7.
Prices were taken from [108]. Both production volumes as well as prices are averages (1930s: 1925–1935; 1970s: 1965–1975; 2010s: 2005–2015).
Table A7.
Annual production volumes of copper and its by-products.
| US Production | Copper (Kt) | By-Products | |||||||
| Gold (t) | Silver (t) | Molybdenum (t) | Zinc (t) | Lead (t) | Nickel (t) | Sulfuric Acid (Kt) | |||
| 1930 | 793 | 8 | 320 | 0 | 1202 | 2748 | 300 | 0 | |
| 1970 | 1478 | 18 | 703 | 14 | 41,584 | 11,212 | 1594 | 747 | |
| 2010 | 1106 | 12 | 162 | 33 | 6055 | 0 | 0 | 2033 | |
| World Production | Copper (Kt) | By-Products | |||||||
| Gold (t) | Silver (t) | Molybdenum (t) | Cobalt (t) | Zink (Kt) | Lead (t) | Nickel (t) | Sulfuric Acid (Kt) | ||
| 2010 | 15,927 | 263 | 4615 | 139,447 | 55,785 | 1437 | 26,335 | 993,182 | 35,040 |
U.S.: Production data for the 1930s is taken from reference [37], except for Ni which is from reference [107]. Reference [107] is also the main source for the 1970s and 2010s. Where no by-product data was stated, assumptions on the share of total production have been made based on other years. In the 1970s we assumed that 30% of molybdenum production [109] was from copper ores. For the 2010s we assumed that approximately 56% of annual Mo production [110,111], 5% of annual Au production [112]; 15% of annual Ag production [113] and 5% (based on 1970s) of annual Zn production are a by-product of copper mining.
References
- Van der Voet, E.; van Oers, L.; Verboon, M.; Kuipers, K. Environmental Implications of Future Demand Scenarios for Metals: Methodology and Application to the Case of Seven Major Metals. J. Ind. Ecol. 2018, 13, 141–155. [Google Scholar] [CrossRef] [Green Version]
- Elshkaki, A.; Graedel, T.E.; Ciacci, L.; Reck, B.K. Resource Demand Scenarios for the Major Metals. Environ. Sci. Technol. 2018, 52, 2491–2497. [Google Scholar] [CrossRef] [PubMed]
- Purr, K.; Günther, J.; Lehmann, H.; Nuss, P. Wege in Eine Ressourcenschonende Treibhausgasneutralität. RESCUE—Studie; Umweltbundesamt: Dessau-Roßlau, Germany, 2019.
- Ali, S.H.; Giurco, D.; Arndt, N.; Nickless, E.; Brown, G.; Demetriades, A.; Durrheim, R.; Enriquez, M.A.; Kinnaird, J.; Littleboy, A.; et al. Mineral supply for sustainable development requires resource governance. Nature 2017, 543, 367–372. [Google Scholar] [CrossRef] [PubMed]
- Reuter, M.A.; Heiskanen, K.; Boin, U.; van Schaik, A.; Verhoef, E.; Yang, Y.; Gorgalli, G. The Metrics of Material and Metal Ecology; Elsevier Science: Amsterdam, The Netherlands, 2005; ISBN 9780444511379. [Google Scholar]
- Kavlak, G.; Graedel, T.E. Global anthropogenic selenium cycles for 1940–2010. Resour. Conserv. Recycl. 2013, 73, 17–22. [Google Scholar] [CrossRef]
- Arndt, N.T.; Fontboté, L.; Hedenquist, J.W.; Kesler, S.E.; Thompson, J.F.H.; Wood, D.G. Future Global Mineral Resources. Geochem. Perspect. 2017, 6, 1–171. [Google Scholar] [CrossRef] [Green Version]
- Skinner, B.J. Second Iron Age ahead? Am. Sci. 1976, 64, 258–269. [Google Scholar]
- Lasky, S.G. How tonnage and grade relations help predict ore reserves. Eng. Min. J. 1950, 151, 81–85. [Google Scholar]
- Mudd, G.M. The Sustainability of Mining in Australia: Key Production Trends and Environmental Implications; Research Report No RP5; Department of Civil Engineering, Monash University and Mineral Policy Institute: Melbourne, Australia, 2009. [Google Scholar]
- Crowson, P. Some observations on copper yields and ore grades. Resour. Policy 2012, 37, 59–72. [Google Scholar] [CrossRef]
- Rötzer, N.; Schmidt, M. Decreasing Metal Ore Grades—Is the Fear of Resource Depletion Justified? Resources 2018, 7, 88. [Google Scholar] [CrossRef] [Green Version]
- Northey, S.A.; Mudd, G.M.; Werner, T.T. Unresolved Complexity in Assessments of Mineral Resource Depletion and Availability. Nat. Resour. Res. 2018, 27, 241–255. [Google Scholar] [CrossRef]
- Bardi, U. The mineral question: How energy and technology will determine the future of mining. Front. Energy Res. 2013, 1, 9. [Google Scholar] [CrossRef] [Green Version]
- Northey, S.; Haque, N.; Mudd, G. Using sustainability reporting to assess the environmental footprint of copper mining. J. Clean. Prod. 2013, 40, 118–128. [Google Scholar] [CrossRef]
- Calvo, G.; Mudd, G.M.; Valero, A.; Valero, A. Decreasing ore grades in global metallic mining: A theoretical issue or a global reality? Resources 2016, 5, 36. [Google Scholar] [CrossRef] [Green Version]
- Koppelaar, R.H.E.M.; Koppelaar, H. The Ore Grade and Depth Influence on Copper Energy Inputs. Biophys. Econ. Resour. Qual. 2016, 1, 11. [Google Scholar] [CrossRef] [Green Version]
- ICA. Copper Cathode Life Cycle Assessment; International Copper Association (ICA): Washington, DC, USA, 2017. [Google Scholar]
- Chapman, P.F. The Energy Costs of Producing Copper and Aluminium from Primary Sources; Report No. ERG 001; Open University, Energy Research Group: Milton Keynes, UK, 1973. [Google Scholar]
- Gaines, L.L. Energy and Materials Flows in the Copper Industry; ANL/CNSV-11; Argonne National Laboratory: Argonne, IL, USA, 1980.
- Pitt, C.H.; Wadsworth, M.E. An Assessment of Energy Requirements in Proven and New Copper Processes. Final Report; DOE/CS/40132; Department of Metallurgy and Metallurgical Engineering, University of Utah: Salt Lake City, UT, USA, 1980. [Google Scholar]
- Norgate, T.; Jahanshahi, S. Low grade ores—Smelt, leach or concentrate? Miner. Eng. 2010, 23, 65–73. [Google Scholar] [CrossRef]
- Norgate, T.; Haque, N. Using life cycle assessment to evaluate some environmental impacts of gold production. J. Clean. Prod. 2012, 29–30, 53–63. [Google Scholar] [CrossRef]
- Marsden, J.O. Energy efficiency and copper hydrometallurgy. In Hydrometallurgy 2008: Proceedings of the Sixth International Symposium; Young, C.A., Taylor, P.R., Anderson, C.G., Choi, Y., Eds.; Society for Mining, Metallurgy, and Exploration: Littleton, CO, USA, 2008; pp. 29–40. [Google Scholar]
- Möller, A. Grundlagen Stoffstrombasierter Betrieblicher Umweltinformationssysteme; Projekt: Bochum, Germany, 2000; ISBN 978-3-89733-052-8. [Google Scholar]
- Schmidt, M.; Möller, A.; Hedemann, J.; Müller-Bleischmidt, P. Environmental Material Flow Analysis by Network Approach. In Umweltinformatik ’97: Informatique Pour L’environnement ’97; Geiger, W., Jaeschke, A., Rentz, O., Eds.; Metropolis: Marburg, Germany, 1997; pp. 768–779. ISBN 978-3-89518-163-4. [Google Scholar]
- Camm, T.W. Simplified Cost Models for Prefeasibility Mineral Evaluations; Bureau of Mines Information Circular 9298; U.S. Department of the Interior, Bureau of Mines: Washington, DC, USA, 1991.
- Atlas Copco. Mining Methods in Underground Mining; Atlas Copco Rock Drills: Örebro, Switzerland, 2007. [Google Scholar]
- Ebrahimi, A. The Importance of Dilution Factor for Open Pit Mining Projects. Available online: https://www.srk.com.hk/files/File/papers/dilution_factor_openpit_a_ebrahimi.pdf (accessed on 25 June 2019).
- Hustrulid, W.A.; Bullock, R.C. Underground Mining Methods. Engineering Fundamentals and International Case Studies; Society for Mining, Metallurgy, and Exploration: Littleton, CO, USA, 2001; ISBN 978-0873351935. [Google Scholar]
- Fuerstenau, M.C.; Han, K.N. Principles of Mineral Processing; Society for Mining, Metallurgy and Exploration: Littleton, CO, USA, 2003; ISBN 0-87335-167-3. [Google Scholar]
- EIA. Annual Energy Review 2009; Energy Information Adminstration: Washington, DC, USA, 2010.
- IEA/OECD. CO2 Emissions from Fuel Combustion. Emissions de CO2 Dues à la Combustion D’énergie, 2009 ed.; OECD Publishing: Paris, France, 2009; ISBN 978-92-64-06102-6. [Google Scholar]
- Wernet, G.; Bauer, C.; Steubing, B.; Reinhard, J.; Moreno-Ruiz, E.; Weidema, B. The ecoinvent database version 3 (part I): overview and methodology. Int. J. Life Cycle Ass. 2016, 21, 1218–1230. [Google Scholar] [CrossRef]
- Chapman, P.F.; Roberts, F. Metal Resources and Energy; Butterworths: London, UK, 1983; ISBN 0-408-10801-0. [Google Scholar]
- Huijbregts, M.A.J.; Rombouts, L.J.A.; Hellweg, S.; Frischknecht, R.; Hendriks, A.J.; van de Meent, D.; Ragas, A.M.J.; Reijnders, L.; Struijs, J. Is Cumulative Fossil Energy Demand a Useful Indicator for the Environmental Performance of Products? Environ. Sci. Technol. 2006, 40, 641–648. [Google Scholar] [CrossRef] [Green Version]
- Leong, Y.S.; Erdreich, E.; Burrit, J.C.; Kiessling, O.E.; Nighman, C.E.; Heikes, G.C. Technology, Employment and Output Per Man in Copper Mining; Report No. E-12; Work Projects Administration in cooperation with Dept. of the Interior, Bureau of Mines: Philadelphia, PA, USA, 1940.
- Alvear Urrutia, J. Chile Nuestro Cobre. Chuquicamate, El Salvador, Potrerillos, El Teniente, Enami, Mantos Blancos y Andina; Editorial Lastra S.A.: Santiago, Chile, 1975. [Google Scholar]
- Birchard, R.E. Copper in the Katanga Region of the Belgian Congo. Econ. Geogr. 1940, 16, 429–436. [Google Scholar] [CrossRef]
- Schroeder, H.J.; Cole, J.W. Copper. In Minerals Yearbook: Metals, Minerals, and Fuels 1970; U.S. Bureau of Mines, Ed.; U.S. Bureau of Mines: Washington, DC, USA, 1970; pp. 467–500. [Google Scholar]
- Hearn, R.; Hoye, R. Copper Dump Leaching and Management Practices that Minimize the Potential for Environmental Releases; Final Report; U.S. Environmental Protection Agency (EPA): Cincinanati, OH, USA, 1989.
- Giurco, D.; Cooper, C. Mining and sustainability: Asking the right questions. Miner. Eng. 2012, 29, 3–12. [Google Scholar] [CrossRef] [Green Version]
- Randolph, M. Current trends in mining. In SME Mining Engineering Handbook, 3rd ed.; Darling, P., Ed.; Society for Mining, Metallurgy, and Exploration: Englewood, CO, USA, 2011; pp. 11–20. ISBN 978-0-87335-341-0. [Google Scholar]
- Montes Prunés, C.; Castillo Dintrans, E.; Cantallopts Araya, J. Hydrological Consumption in Copper Mining for 2014; Cochilco—Chilean Copper Commission: Santiago, Chile, 2015.
- Newton, J.; Wilson, C.L. Metallurgy of Copper; John Wiley and Sons Inc.: New York, NY, USA, 1942. [Google Scholar]
- Biswas, A.K.; Davenport, W.G. Extractive Metallurgy of Copper, 1st ed.; Pergamon: Oxford, UK; New York, NY, USA, 1976; ISBN 0080196586. [Google Scholar]
- Rosenkranz, R.R. Energy Consumption in Domestic Primary Copper Production; Information Circular 8698; U.S. Department of the Interior; Bureau of Mines: Washington, DC, USA, 1976.
- Schlesinger, M.E.; King, M.J.; Sole, K.C.; Davenport, W.G. Extractive Metallurgy of Copper; Elsevier: Amsterdam, The Netherlands, 2011; ISBN 978-0-08096789-9. [Google Scholar]
- Wilburn, D.R.; Goonan, T.G.; Bleiwas, D.I. Technological Advancement—A Factor in Increasing Resource Use; Open File Report 2001-197; Verstion1.03; 2001. Available online: https://pubs.er.usgs.gov/publication/ofr01197 (accessed on 21 December 2017).
- Boliden. Metals for a Sustainable Society; 2018 Annual and Sustainability Report; Boliden: Stockholm, Switzerland, 2019. [Google Scholar]
- Mudd, G.M.; Jowitt, S.M. Growing Global Copper Resources, Reserves and Production: Discovery Is Not the Only Control on Supply. Econ. Geol. 2018, 113, 1235–1267. [Google Scholar] [CrossRef]
- Northey, S.; Mohr, S.; Mudd, G.M.; Weng, Z.; Giurco, D. Modelling future copper ore grade decline based on a detailed assessment of copper resources and mining. Resour. Conserv. Recycl. 2014, 83, 190–201. [Google Scholar] [CrossRef]
- West, J. Decreasing metal ore grades: Are they really being driven by the depletion of high-grade deposits? J. Ind. Ecol. 2011, 15, 165–168. [Google Scholar] [CrossRef]
- Brantes Abarca, R.; Cantallopts Araya, J. Forecast for Electricity Consumption in the Copper Mining Industry. 2018-2029; Cochilco—Chilean Copper Commission: Santiago, Chile, 2018.
- Bertram, M.; Graedel, T.E.; Rechberger, H.; Spatari, S. The contemporary European copper cycle: Waste management subsystem. Ecol. Econ. 2002, 42, 43–57. [Google Scholar] [CrossRef]
- Jeswiet, J.; Archibald, J.; Thorley, U.; de Souza, E. Energy Use in Premanufacture (Mining). Procedia CIRP 2015, 29, 816–821. [Google Scholar] [CrossRef]
- Kocsis, C.K.; Hardcastle, S. Ventilation system operating cost comparison between a conventional and an automated underground metal mine. Min. Eng. 2003, 55, 30–37. [Google Scholar]
- Wang, C.; Nadolski, S.; Mejia, O.; Drozdiak, J.; Klein, B. Energy and Cost Comparisons of HPGR Based Circuits with the SABC Circuit Installed at the Huckleberry Mine. In Proceedings of the 45th Annual Canadian Mineral Processors Operators Conference, Ottawa, ON, USA, 22–24 January 2013; pp. 121–135. [Google Scholar]
- ESU; IFEU. New Energy Externalities Developments for Sustainability (NEEDS); Deliverable D15.1 “LCA of Background Processes”; Project No. 502687; 2008; Available online: http://www.needs-project.org/RS1a/RS1a%20D15.1%20LCA%20of%20background%20processes.pdf (accessed on 1 October 2019).
- Maennling, N.; Toledano, P. The Renewable Power of the Mine. Accelerating Renewable Energy Integration; Report; Columbia Center on Sustainable Investment (CCSI): New York, NY, USA, 2018. [Google Scholar]
- Halim, A.; Kerai, M. Ventilation Requirement for ‘Electric’ Underground Hard Rock Mines—A Conceptual Study. In Proceedings of the Australian Mine Ventilation Conference, Adelaide, Australia, 1–3 July 2013; pp. 215–220. [Google Scholar]
- Wallace, K.G. General operation characteristics and industry practices of mine ventilation systems. In Proceedings of the 7th International Mine Ventilation Congress, Krakow, Poland, 17–22 June 2001. [Google Scholar]
- BHP Billiton. Our Shared Values. Annual Report 2013; BHP Billiton: Melbourne, Australia, 2013. [Google Scholar]
- Antofagasta. Annual Report and Financial Statements 2013; Antofagasta: London, UK, 2014. [Google Scholar]
- Codelco. Energy and Climate Change: Codelco Website. Available online: https://www.codelco.com/energia-y-cambio-climatico/reporte2012/2013-04-17/153201.html;18.09.17 (accessed on 25 February 2020).
- Codelco. Annual Report 2013: Codelco Website. Available online: https://www.codelco.com/memoria2013/site/edic/base/port/inicio.html (accessed on 15 February 2020).
- Martin, H.C. The Arthur and Magna Concentrators of the Utah Copper Co.; U.S. Department of Commerce, Bureau of Mines: Washington, DC, USA, 1931.
- Soderberg, A. Mining Method and Costs at the Utah Copper Co., Bingham Canyon, Utah; Information Circular 6234; Department of Commerce, U.S. Bureau of Mines: Washington, DC, USA, 1930.
- Ross, C. Ecology and Power in the Age of Empire. Europe and the Transformation of the Tropical Word; Oxford University Press: Oxford, UK, 2017. [Google Scholar]
- Deutsches Institut für Normung e. V. (DIN). DIN EN ISO 14044: Environmental Management—Life Cycle Assessment—Requirements and Guidelines; Beuth Verlag: Berlin, Germany, 2018. [Google Scholar]
- Schäfer, P.; Schmidt, M. Discrete-point analysis of the energy demand of primary versus secondary metal production. Environ. Sci. Technol. 2020, 54, 507–516. [Google Scholar] [CrossRef] [PubMed]
- Finn, J.L. Tracing the Veins. Of Copper, Culture, and Community from Butte to Chuquicamata; University of California Press: Barkeley, CA, USA; Los Angeles, CA, USA, 1998. [Google Scholar]
- ECI. Processes. European Copper Institute, Copper Alliance. 2018. Available online: https://copperalliance.eu/about-copper/copper-and-its-alloys/processes/ (accessed on 18 January 2020).
- Amegroup. Declining Copper Ore Grades. Ame Research (February 2018). Available online: http://aus.amegroup.com/Website/FeatureArticleDetail.aspx?faId=437 (accessed on 17 December 2019).
- Jackson, C.F.; Hedges, J.H. Metal-Mining Practice; Bureau of Mines Bull. 419; U. S. Bureau of Mines: Washington, DC, USA, 1939.
- Harmsen, J.H.M.; Roes, A.L.; Patel, M.K. The impact of copper scarcity on the efficiency of 2050 global renewable energy scenarios. Energy 2013, 50, 62–73. [Google Scholar] [CrossRef]
- Tenney, J.B. Second Report on the Mineral Industries of Arizona; University of Arizona Bulletin VOL. 1 Nr. 1; University of Arizona: Tucson, AZ, USA, 1930. [Google Scholar]
- Goonan, T.G. Flows of Selected Materials Associated with World Copper Smelting; Open-File Report 2004-1395; U.S. Geological Survey: Reston, VA, USA, 2005.
- McDaniel, L. The Morenci Smelter of Phelps Dodge Corporation at Morenci, Arizona. Met. Trans. JOM 1949, 185, 1–14. [Google Scholar]
- Atlas Copco. Viper for the Copper King. Min. Constr. 2004, 3, 13–14. [Google Scholar]
- Caterpillar. Caterpillar Performance Handbook, 46th ed.; Caterpillar: Peoria, IL, USA, 2016. [Google Scholar]
- Dyno Nobel. Blasting and Explosives Quick Reference Guide 2010. Available online: https://www.leg.state.mn.us/docs/2015/other/150681/PFEISref_1/Dyno%20Nobel%202010.pdf (accessed on 21 November 2018).
- AusIMM. Cost Estimation Handbook, 2nd ed.; Australasian Institute of Mining and Metallurgy: Carlton, VIC, Australia, 2012; ISBN 192152278X. [Google Scholar]
- Salama, A.; Greberg, B.; Skawina, B.; Gustafson, A. Analyzing energy consumption and gas emissions of loading equipment in underground mining. CIM J. 2015, 6, 179–188. [Google Scholar] [CrossRef]
- Golder Associates. Pre-Feasibility Block Cave Mine Design—Mitschell Deposit; Golder Associates: Burnaby, UK, 2012. [Google Scholar]
- Bell, G.A. Leaching Practice and Costs at the New Cornelia Mines of the Calumet & Arizona Mining Co.; Ajo, Ariz. IC 6303; Department of Commerce; United States Bureau of Mines: Washington, DC, USA, 1930.
- Ahlness, J.K.; Pojar, M.G. Situ Copper Leaching in the United States. Case Histories of Operations; IC 8961; U.S. Department of the Interior; Bureau of Mines: Washington, DC, USA, 1983.
- McMahon, A.D. Copper. A Materials Survey; IC 8225, Department of the Interior; U.S. Department of the Interior; Bureau of Mines: Washington, DC, USA, 1964.
- Schlitt, W.J.; Richards, K.J. Chemical aspects of copper cementation. In Solution Mining Symposium 1974; Aplan, F.F., McKinney, W.A., Pernichele, A.D., Eds.; AIME: New York, NY, USA, 1974. [Google Scholar]
- Norgate, T.; Rankin, W.J. Life Cycle Assessment of Copper and Nickel Production. In Proceedings of the MINPREX 2000, Melbourne, Australia, 11–13 September 2000; pp. 133–138. [Google Scholar]
- Honeyman, P.D.I. Metallurgy of copper: Reverberatory tonnages reach 1500 per day; Waste-heat boiler installations improved. Min. Metall. 1939, 20, 19–20. [Google Scholar]
- Skovronek, H.S.; EPA. Environmental Considerations of Selected Energy Conserving Manufacturing Process Options. Volume XIV Primary Copper Industry; Industrial Environmental Research Laboratory, Office of Research and Development, U.S. Environmental Protection Agency: Cincinnati, OH, USA, 1976.
- MIM. Environmental Report; M.I.M. Holdings Ltd.: Brisbane, Australia, 1999. [Google Scholar]
- Kennedy, B.A. Surface Mining, 2nd ed.; Society for Mining, Metallurgy, and Exploration: Littleton, CO, USA, 1990; ISBN 0-87335-102-9. [Google Scholar]
- Yellishetty, M.; Ranjith, P.G.; Tharumarajah, A. Iron ore and steel production trends and material flows in the world: Is this really sustainable? Resour. Conserv. Recycl. 2010, 54, 1084–1094. [Google Scholar] [CrossRef]
- Kunene, M.C. Life Cycle Assessment of the Production of Xanthate Salts and of Their Application for ARD Mitigation. Master’s Thesis, University of Cape Town, Cape Town, South Africa, 2014. [Google Scholar]
- Wernet, G.; Papadokonstantakis, S.; Hellweg, S.; Hungerbuhler, K. Bridging data gaps in environmental assessments: Modeling impacts of fine and basic chemical production. Green Chem. 2009, 11, 1826–1831. [Google Scholar] [CrossRef]
- Coursol, P.; Mackey, J.P.; Dìaz, C.M. Energy Consumption in Copper Sulphide Smelting. Proc. Copp. 2010, 2, 649–668. [Google Scholar]
- Bravard, J.C.; Portal, C. Energy Expenditures Associated with the Production and Recycle of Metals; Technical Report ORNL-MIT-132; Oak Ridge Station, School of Chemical Engineering Practice, Massachusetts Institute of Technology: Cambridge, MA, USA, 1971. [Google Scholar]
- EPA. Environmental Considerations of Selected Energy Conserving Manufacturing Process Options. Volume XIV Primary Copper Industry; Environmental Protection Agency: Cincinnati, OH, USA, 1976.
- Guilford, M.C.; Hall, C.A.S.; O’Connor, P.; Cleveland, C.J. A New Long Term Assessment of Energy Return on Investment (EROI) for U.S. Oil and Gas Discovery and Production. Sustainability 2011, 3, 1866–1887. [Google Scholar] [CrossRef] [Green Version]
- Pelletier, N.; Ibarburu, M.; Xin, H. Comparison of the environmental footprint of the egg industry in the United States in 1960 and 2010. Poult. Sci. 2014, 93, 241–255. [Google Scholar] [CrossRef] [PubMed]
- Verein Deutscher Ingenieure (VDI). VDI 4600 Part I—Cumulative Energy Demand. Examples; (VDI 4600 Blatt 1); Beuth Verlag: Berlin, Germany, 2015. [Google Scholar]
- EIA. Table 8.1. Average Operating Heat Rate for Selected Energy Sources: 2008 through 2018. Available online: https://www.eia.gov/electricity/annual/html/epa_08_01.html (accessed on 15 January 2020).
- NCA. Steam-Electric Plant Factors. 1971 Edition; National Coal Association (NCA): Washington, DC, USA, 1972.
- Ayres, R.U.; Ayres, L.W.; Warr, B. Exergy, Power and Work in the Us Economy, 1900–1998; Working Paper; Center for Management of Environmental Resources (CMER): Fontainebleau, France, 2002.
- USGS; Bureau of Mines. Minerals Yearbook. Volume I.—Metals and Minerals. Years 1932–2015. Available online: https://www.usgs.gov/centers/nmic/minerals-yearbook-metals-and-minerals (accessed on 14 February 2020).
- Kelly, T.D.; Matos, G.R. Historical Statistics for Mineral and Material Commodities in the United States; U.S. Geological Survey Data Series 140. 2014. Available online: https://www.usgs.gov/centers/nmic/historical-statistics-mineral-and-material-commodities-united-states (accessed on 14 February 2020).
- Kuklis, A. Molybdenum. In Minerals Yearbook Metals, Minerals and Fuels 1972; U.S. Bureau of Mines, Ed.; U. S. Bureau of Mines: Washington, DC, USA, 1972. [Google Scholar]
- Polyak, D.E. Molybdenum. In 2007 Minerals Yearbook; USGS, Ed.; U.S. Department of the Interior; U.S. Geological Survey: Reston, VA, USA, 2010; pp. 50.1–50.12. [Google Scholar]
- Polyak, D.E. Molybdenum. In 2015 Minerals Yearbook; USGS, Ed.; U.S. Department of the Interior; U.S. Geological Survey: Reston, VA, USA, 2016; pp. 50.1–50.12. [Google Scholar]
- George, M.W. Gold. In 2015 Minerals Yearbook; USGS, Ed.; U.S. Department of the Interior; U.S. Geological Survey: Reston, VA, USA, 2016. [Google Scholar]
- Butterman, W.C.; Hillard, H.E. Silver; Mineral Commodity Profiles; U.S. Department of the Interior; U.S. Geological Survey: Reston, VA, USA, 2004.
- Sverdrup, H.U.; Olafsdottir, A.H.; Ragnarsdottir, K.V. On the long-term sustainability of copper, zinc and lead supply, using a system dynamics model. Resour. Conserv. Recycl. 2019, 4, 100007. [Google Scholar] [CrossRef]
Figure 1.
Schematic representation of the relationship between ore grade and cumulative energy demand (CED) and the influence of different events.
Figure 1.
Schematic representation of the relationship between ore grade and cumulative energy demand (CED) and the influence of different events.

Figure 2.
Process routes of primary copper production.

Figure 3.
Calculated contribution of the individual process steps to the average CED of global copper production.
Figure 3.
Calculated contribution of the individual process steps to the average CED of global copper production.

Figure 4.
Historic development of the relationship between cumulative energy demand (a), global warming potential (b) and ore grade for the global average of copper production. Points represent time-specific ore grades and CED or global warming potential (GWP), respectively.
Figure 4.
Historic development of the relationship between cumulative energy demand (a), global warming potential (b) and ore grade for the global average of copper production. Points represent time-specific ore grades and CED or global warming potential (GWP), respectively.

Figure 5.
Possible developments in the relationship between CED (a), GWP (b), and ore grade of the global average of copper production. Filled dots represent the CED or GWP at an ore grade of 0.5%, unfilled dots at 0.7%. Techn. improvement means the optimization of the copper production process only. Techn. improvement + renew. energy includes the use of renewable energies for mining, CGF, and hydrometallurgy. For the GWP of the renewable energy, wind power (best case scenario) was assumed.

Figure 6.
Cumulative energy demand of future scenarios. The bars represent the total CED of copper production. The lighter part of each bar is the additional energy demand of the given scenario compared to the base case.
Figure 6.
Cumulative energy demand of future scenarios. The bars represent the total CED of copper production. The lighter part of each bar is the additional energy demand of the given scenario compared to the base case.

| 1930 | 1970 | 2010 | |
|---|---|---|---|
| Ore grade in% | 1.7 | 1.3 | 0.7 |
| CED in GJ-eq/t Cu cathode | 70 | 53 | 69 |
| GWP in t CO2-eq/t Cu cathode | 5.7 | 4.2 | 4.5 |
Table 2.
Allocation factors and amount of sulphuric acid produced as by-product.
| Cu (Economic) | Cu (Physical) | Sulphuric Acid (t/t Cu) | ||
|---|---|---|---|---|
| 1930s | ||||
| US | Mining & processing | 0.94 | 0.99 | - |
| Metallurgy | 0.95 | 1 | ||
| 1970s | ||||
| US | Mining & processing | 0.91 | 0.96 | 0.5 |
| Metallurgy | 0.95 | 1 | ||
| 2010s | ||||
| US | Mining & processing | 0.80 | 0.97 | 1.8 |
| Metallurgy | 0.94 | 1 | ||
| World | Mining & processing | 0.72 | 0.86 | 2.2 |
| Metallurgy | 0.76 | 0.94 | ||
© 2020 by the authors. Licensee MDPI, Basel, Switzerland. This article is an open access article distributed under the terms and conditions of the Creative Commons Attribution (CC BY) license (http://creativecommons.org/licenses/by/4.0/).
Share and Cite
MDPI and ACS Style
Rötzer, N.; Schmidt, M. Historical, Current, and Future Energy Demand from Global Copper Production and Its Impact on Climate Change. Resources 2020, 9, 44. https://doi.org/10.3390/resources9040044
AMA Style
Rötzer N, Schmidt M. Historical, Current, and Future Energy Demand from Global Copper Production and Its Impact on Climate Change. Resources. 2020; 9(4):44. https://doi.org/10.3390/resources9040044
Chicago/Turabian StyleRötzer, Nadine, and Mario Schmidt. 2020. "Historical, Current, and Future Energy Demand from Global Copper Production and Its Impact on Climate Change" Resources 9, no. 4: 44. https://doi.org/10.3390/resources9040044
Note that from the first issue of 2016, this journal uses article numbers instead of page numbers. See further details here.