A Robotics Course during COVID-19: Lessons Learned and Best Practices for Online Teaching beyond the Pandemic


Computer Science and Electrical Engineering, Jacobs University Bremen, Campus Ring 1, 28759 Bremen, Germany
*
Author to whom correspondence should be addressed.
Robotics 2021, 10(1), 5; https://doi.org/10.3390/robotics10010005
Submission received: 30 November 2020
/
Revised: 26 December 2020
/
Accepted: 28 December 2020
/
Published: 30 December 2020
(This article belongs to the Special Issue Advances and Challenges in Educational Robotics)
Abstract
:The article describes observations from the online teaching of a robotics class during the COVID-19 pandemic caused by SARS-CoV-2, also known as the coronavirus. The changes in the course structure and in the provided material lead to an unexpected increase in the grade performance of the students. The article provides a description and an analysis of the effects and their possible causes. In addition to a grade-performance analysis, further data from a university-wide and from a course-specific survey are used. The analysis of the effects and their possible causes is furthermore discussed in relation to the educational research literature. Some evidence for the general findings is provided, which are of interest for online teaching or blended learning in general, respectively, for teaching in robotics and related areas. These include some evidence for the benefits of asynchronous online teaching and for the role of social interaction, which may happen in self-organized, smaller peer groups, even without the intervention of the instructor. The findings and the extensive pointers to the literature can also provide useful guidelines for instructors of robotics courses when considering the use of online or blended teaching in the future beyond the COVID-19 pandemic.
1. Introduction
The World Health Organization (WHO) declared the COVID-19 outbreak to be a global pandemic on 11 March 2020 [1]. This pandemic caused by SARS-CoV-2, also known as the coronavirus, had, respectively still has at the time of writing, a significant impact on higher education—with many aspects being expected to last beyond the pandemic itself [2,3,5]. Specifically, the pandemic triggered a global, massive switch to online education [6,7]. Furthermore, it is expected that COVID-19 has only accelerated a trend that is here to stay, i.e., that (elements of) online education will be the new normal in higher education [8].
Similar to other universities around the globe, Jacobs University Bremen also responded by a switch to online education as an emergency fallback measure. Among the 218 courses that were offered online in the Spring 2020 semester is a Robotics module, which is part of a Computer Science (CS) and of a Robotics and Intelligent Systems (RIS) undergraduate study program. There are indications—which are described in some detail in this article—that the online version of the course addressed some general student interests and needs. The article presents possible explanations for this observation including data and discussions with reference to the educational literature. It thus provides some guidelines for possible positive elements that can be taken into account for online education in robotics and related disciplines.
The article makes hence the following two main contributions. First, it provides indications in the spirit of evidence-based education [9,10] using proper data analyses, which can be further used in, e.g., meta-studies to identify general trends. Second, it provides some insights and guidelines that can be useful for instructors of robotics courses who are interested in using online or blended learning in the future beyond the COVID-19 pandemic.
The rest of this article is structured as follows. In Section 2, the content and the structure of the course are presented including information about face-to-face classes in previous years and the way the online version was taught in Spring 2020. An analysis of grade distributions from the previous three years and from 2020 is provided in Section 3. While core parameters remained constant, especially the instructor and the level of the exams, there was an (unexpected) increase in the grade performance for the course during the COVID-19 semester. To put the effect in relation to general observations about the online teaching at Jacobs University in that semester and to identify parameters for the further analysis, results from a student experience survey by Jacobs University are discussed in Section 4. A detailed analysis based on a survey among the students in the course and on the education literature is provided in Section 5. Section 6 concludes the article including a summary of the main findings.
2. The Content of the Robotics Course
The Robotics course that is the topic of this article is offered at Jacobs University Bremen as part of the “Robotics and Intelligent Systems (RIS)” BSc program, where it is a second year core course. Robotics can also be taken as a specialization course by third year students of the BSc program “Computer Science (CS)”. Last but not least, the course is an option as an elective in several study programs including “Electrical and Computer Engineering (ECE)”.
For the spring 2020 version of the course, fifty-eight students were registered, who were distributed over five different majors, as shown in Table 1. The course is a core course in RIS, but more CS than RIS students were registered due to the fact that CS is the larger major in absolute numbers.
The grading is 100% based on the final exam in the form of a 2 h written exam. Students have the option to just audit the course, i.e., to not receive a grade. Nevertheless, a grade for this course is a mandatory component especially for RIS students, as well as for CS students if it should count as the specialization course towards their CS degree.
The Robotics course has five ECTS, which are earned as part of the standard course design at Jacobs University. Classes take place in 28 sessions (depending on holidays, the number of sessions may also slightly vary for a course in some semesters) of 75 min each, i.e., a total of 35 h of in-class sessions. The in-class sessions are usually distributed into two 75 min slots per week over a period of 14 weeks in each semester. Given the five ECTS, it is hence expected that the students also engage in the usual amount of studying outside of the classroom in the order of 6 to 8 h per week. Furthermore, there is the exam preparation time after the classes end and the final exam takes place.
2.1. Syllabus
The course is structured into the following nine parts P1 to P9:
- P1 Introduction
- –
- definition of a robot
- –
- SciFi and reality
- –
- related concepts and fields throughout history
- –
- robotics beyond factory automation
- P2 Spatial representations and transforms
- –
- coordinate systems
- –
- spatial transformations
- –
- homogeneous matrices
- –
- frames of reference
- –
- properties of rotation matrices
- –
- Euler angles
- –
- quaternions
- –
- chaining transforms
- P3 Forward Kinematics (FK)
- –
- joints and links
- –
- kinematic chains
- –
- forward kinematics
- –
- Denavit–Hartenberg
- –
- work-space
- P4 Actuators
- –
- DC-motor: model and properties
- –
- H-bridge and Pulse-Width-Modulation (PWM)
- –
- gear wheels and gear train
- –
- gear types
- –
- planetary gear
- –
- harmonic gear
- –
- linear actuators
- –
- bearings
- –
- shaft-encoders
- –
- servos
- P5 Inverse Kinematics (IK)
- –
- analytical inverse kinematics
- –
- example six legged robot
- –
- arm- and hand-decoupling
- –
- numerical inverse kinematics
- –
- basic Newton–Raphson
- –
- Jacobian
- –
- pseudo-inverse
- –
- IK with Newton–Raphson
- –
- example simple planar robot-arm
- –
- IK with gradient descent
- P6 Locomotion
- –
- wheel models and properties
- –
- Ackermann drive
- –
- differential drive FK
- –
- tracks
- –
- differential drive IK
- –
- synchro drive
- –
- omnidirectional wheels
- –
- omnidirectional drive FK and IK
- P7 Localization
- –
- global (absolute) localization
- –
- triangulation and trilateration
- –
- least squares optimization
- –
- multilateration
- –
- ranging technologies
- –
- global navigation satellite systems (GNSS)
- –
- beacon-free localization
- –
- Multidimensional Scaling (MDS)
- –
- orientation sensors
- –
- relative orientation
- –
- dead reckoning
- P8 Probabilistic localization
- –
- localization error representation
- –
- error propagation
- –
- probabilistic differential drive odometry
- –
- Kalman Filter (KF)
- –
- Extended Kalman Filter (EKF)
- –
- Unscented Kalman Filter (UKF)
- –
- Particle Filter (PF)
- P9 Mapping
- –
- map representations in 2D and 3D
- –
- evidence grid
- –
- range sensors
- –
- Simultaneous Localization And Mapping (SLAM)
- –
- registration
- –
- loop closing
- –
- EKF-SLAM
- –
- PF-SLAM
- –
- pose-graph
The course is complemented by other modules like Control Systems, Automation, Computer Vision (CV), Artificial Intelligence (AI), or Machine Learning (ML) in the RIS, respectively CS BSc program, where additional topics are covered that can be considered to be canonical parts of a robotics education.
2.2. Spring 2020 Version during the COVID-19 Pandemic
Due to the COVID-19 pandemic, (almost) all teaching at Jacobs University was switched to online courses early in the Spring 2020 semester. More precisely, two-hundred ten out of 218 courses were offered online in Spring 2020; the other eight were mainly excursions that got postponed. Overall, the switch was very rapid and thorough, i.e., the semester ended in time as originally scheduled.
For the robotics module in Spring 2020 at Jacobs University, an asynchronous online teaching mode was chosen. The teaching material consisted of slides (PDF), as well as videos (mp4), which were provided via a course website. The videos present the slides with a voice-over plus a recorded virtual laser-pointer; in some occasions, animations are also included. The material covers the lectures and the solutions to the homework exercises that form the basis of the final exam at the end of the course.
Table 2 and Table 3 provide an overview of the number of slides and of the duration of the videos for the lectures and for the homework exercises for the different course parts. Note that the students are frequently encouraged to stop the videos and to engage in paper and pencil work on their own to reproduce the derivation of presented methods and their application to specific problems. This holds especially for the provided solutions to the homework exercises, where the expected time to interact with the slides/video material is about six to seven times the duration of each video when properly doing all calculations step-by-step, e.g., when performing extensive linear algebra calculations. This is also—though to a much lesser extent—the case for the lecture part. Furthermore, in the face-to-face version of the course, some time is spent by the instructor at the white-board to interactively engage with the students in a more detailed, step-by-step derivation of some methods, as well as their application. Hence, the presentation time of the slides in face-to-face instruction, as well as the pure duration of the lecture videos does not correspond 1:1 to the class time according to the five ECTS.
The upload of the course material, i.e., of the slides and of the videos, was done as early as possible, i.e., ahead of the scheduled lecture slot. At the beginning of the course, i.e., in the transition phase to online teaching due to COVID-19, this was just few days ahead of the schedule. However, the lead time between the release of the material until the official lecture slot increased to 10 to 14 days towards the end of the semester. The intention was to give the students more flexibility in the decision when to study the material. In addition to the slides and videos, a course forum was provided on Moodle [11,12], where students were encouraged to ask questions and to engage in discussions with the instructor, as well as among each other. Furthermore, Microsoft Teams [13] support was provided for each course at Jacobs University, where also the option for (synchronous) QA sessions in the lectures slots was offered for the robotics course.
3. Analysis of Grade Distributions
The analysis of grade distributions can be a useful tool for studying learning effects [14], but it also has its limitations [15,16,17,18]. There are several aspects why an analysis of grades can provide here some insights. Most importantly, some of the most critical variables are constant in our case [18,19,20], namely: the instructor and the course syllabus did not change over the period of analysis from 2017 to 2020. Additional tests via, e.g., concept inventories were hence not used.
For the analysis, the grades in terms of the exact percentages that each student achieves in each exam were used. They are represented as a normalized proportion [0,1] from worst to best possible. A one-way Analysis Of Variance (ANOVA) of grades by year showed a significant main effect for the exam year, namely , i.e., there is a pronounced F-value for the critical value , effect degrees of freedom (year 2020 tested against years 2017–2019, ), and error degrees of freedom ( participants). This effect came from the improved average performance in 2020 compared to previous years, as illustrated in the box-plot in Figure 1. Therefore, there was a strong shift toward higher grades in 2020 with online teaching compared to the face-to-face teaching in previous years. Moreover, achievement levels below 60% were statistical outliers for 2020.
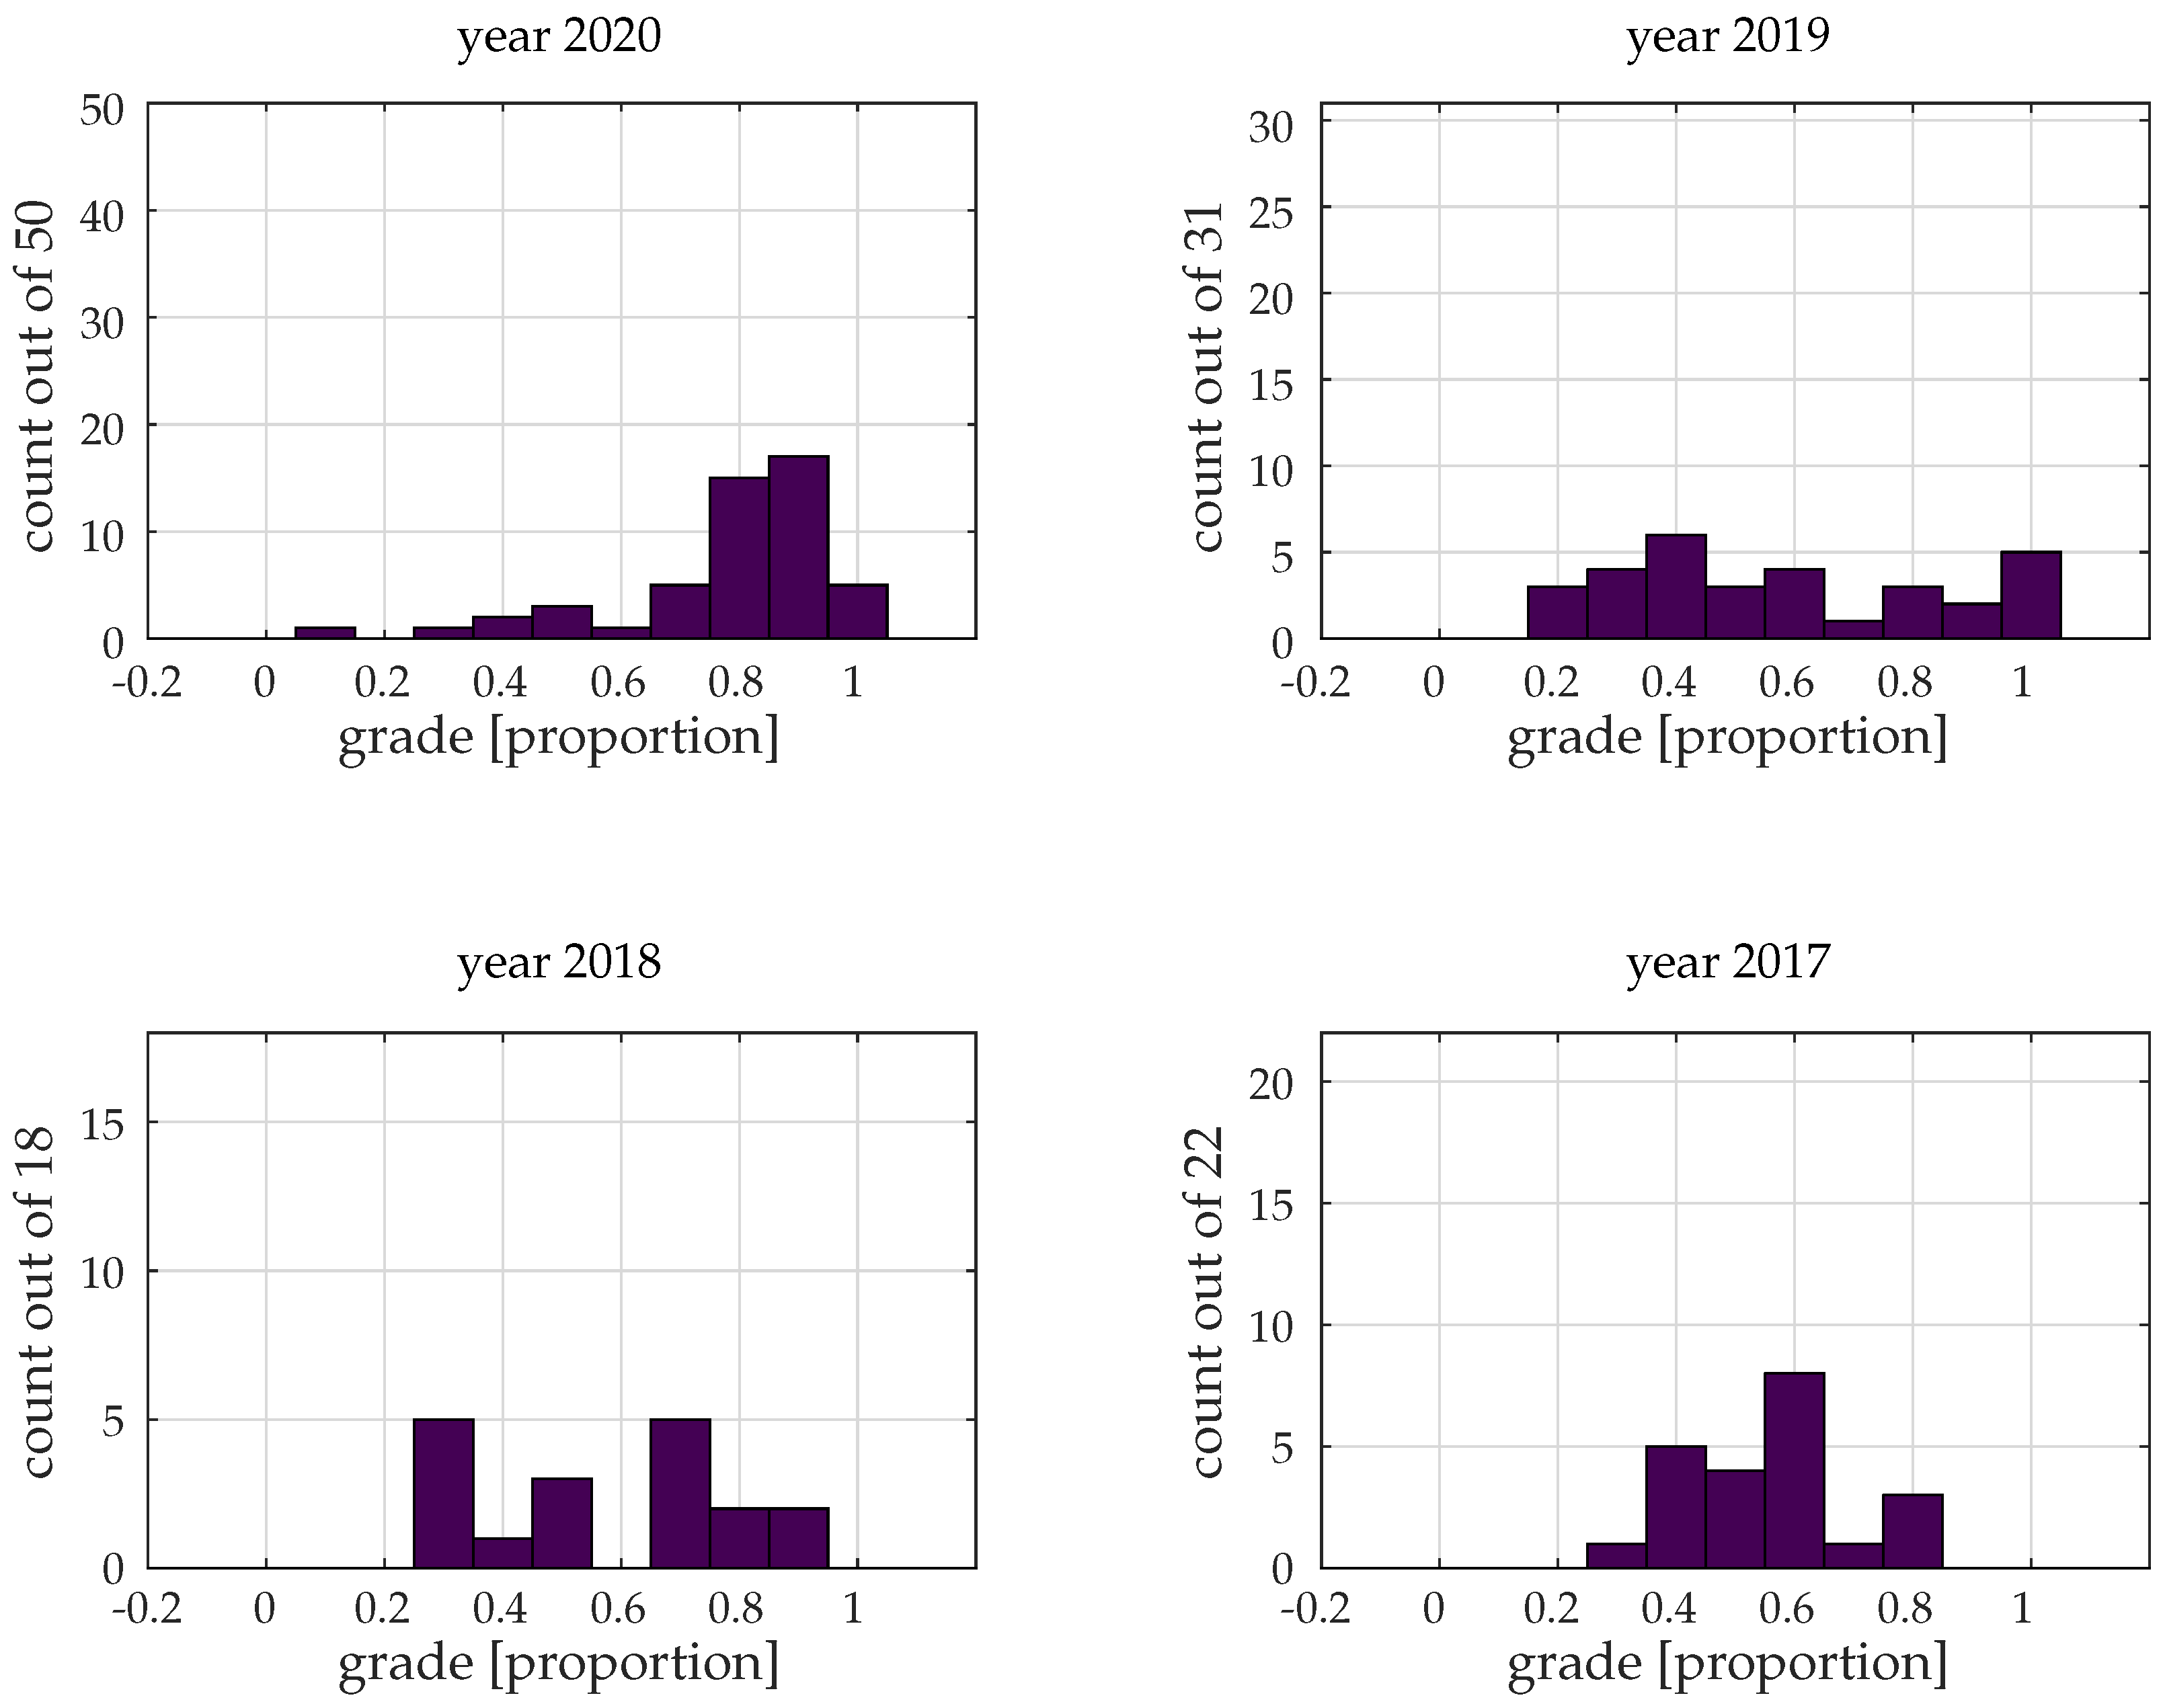
The shift to a stronger grade performance in 2020 is also supported by the analysis of the frequencies of grades (Figure 2). For each year, the y-axes extends to the number of students who took the exam, i.e., the frequency distribution of grades within a year is shown. It also permits a normalized comparison of frequency patterns between the years. It can be seen that in 2020, the relative number of students who achieved a grade of 80% or more is clearly higher than in previous years. Furthermore, the cluster of frequencies of high grades for 2020 also supports the observation that there is an overall better student performance compared to previous years.
It has been observed in an exhaustive study of nearly 500,000 courses taken by over 40,000 college students that the grade performance of students tends to be lower in online versions of courses compared to face-to-face teaching [21]. It is hence surprising—especially given the constraints of the swift transition to online teaching under COVID-19—that an increase in the grade performance for the online version of the Robotics course can be observed. A discussion of the possible reasons and effects is provided in the following sections.
4. Student Experience Survey by Jacobs University
Jacobs University conducts Student Experience Surveys (SESs) as part of its quality management. The SES at the end of the 2020 spring semester covers also aspects of online teaching. The according responses are hence of interest for this article. The survey features 138 questions grouped into 27 categories including academic aspects like the characteristics of students’ studies or the curricula of majors, as well as aspects of, e.g., campus life, housing, community values, equal opportunity, or discrimination.
Given the exhaustiveness of the survey, the overall response rate of Jacobs Students is about 55% (very good). This holds especially in view of the fact that online surveys tend to get lower response rates than paper surveys [22,23] and that the time needed for responding has a negative effect on the response rate [24,25]. However, it also needs to be noted that among CS and RIS students, who are the main interest for this article, the response rate in the Jacobs SES was only about 36%, i.e., substantially lower than for all students at Jacobs University.
The students were given the following two questions SES-1 and SES-2, as well as two lists of statements shown in Table 4 to which they could respond by agreeing (tick mark) or not:
- SES-1: Which elements of online teaching were beneficial for your learning success?
- SES-2: Which elements of online teaching were detrimental for your learning success?
In addition to the statements themselves, the percentages of agreement for each of the statements are also shown in Table 4, i.e., the ratio of tick marks for agreement with each statement in the two lists over the number of responders is used to calculate the agreement percentages. The following first observations can be made. Among the beneficial elements, SES-1.1 “flexible schedule” and SES-1.4 “no need to move” received the highest percentages of agreement. This is a bit surprising for the second element, i.e., SES-1.4 “no need to move”, as Jacobs is a small campus university. There are hence very short distances between the colleges and the lecture halls. Agreement with this element might hence be even stronger at institutions where students do not live on campus in very close vicinity of the class rooms.
Among the detrimental elements, element SES2.4 “difficult to keep focused in online meetings” received the highest amount of agreement. This aspect is of interest in the context of synchronous versus asynchronous online teaching, which is also discussed in more detail below in Section 5. However, also, several other elements received high scores. This includes especially social interaction aspects (SES-2.9 and SES-2.10).
The Jacobs SES also surveyed the students’ perception of the effectiveness of online teaching and the interest of students to have more online courses in the future. More precisely, the following two statements were made:
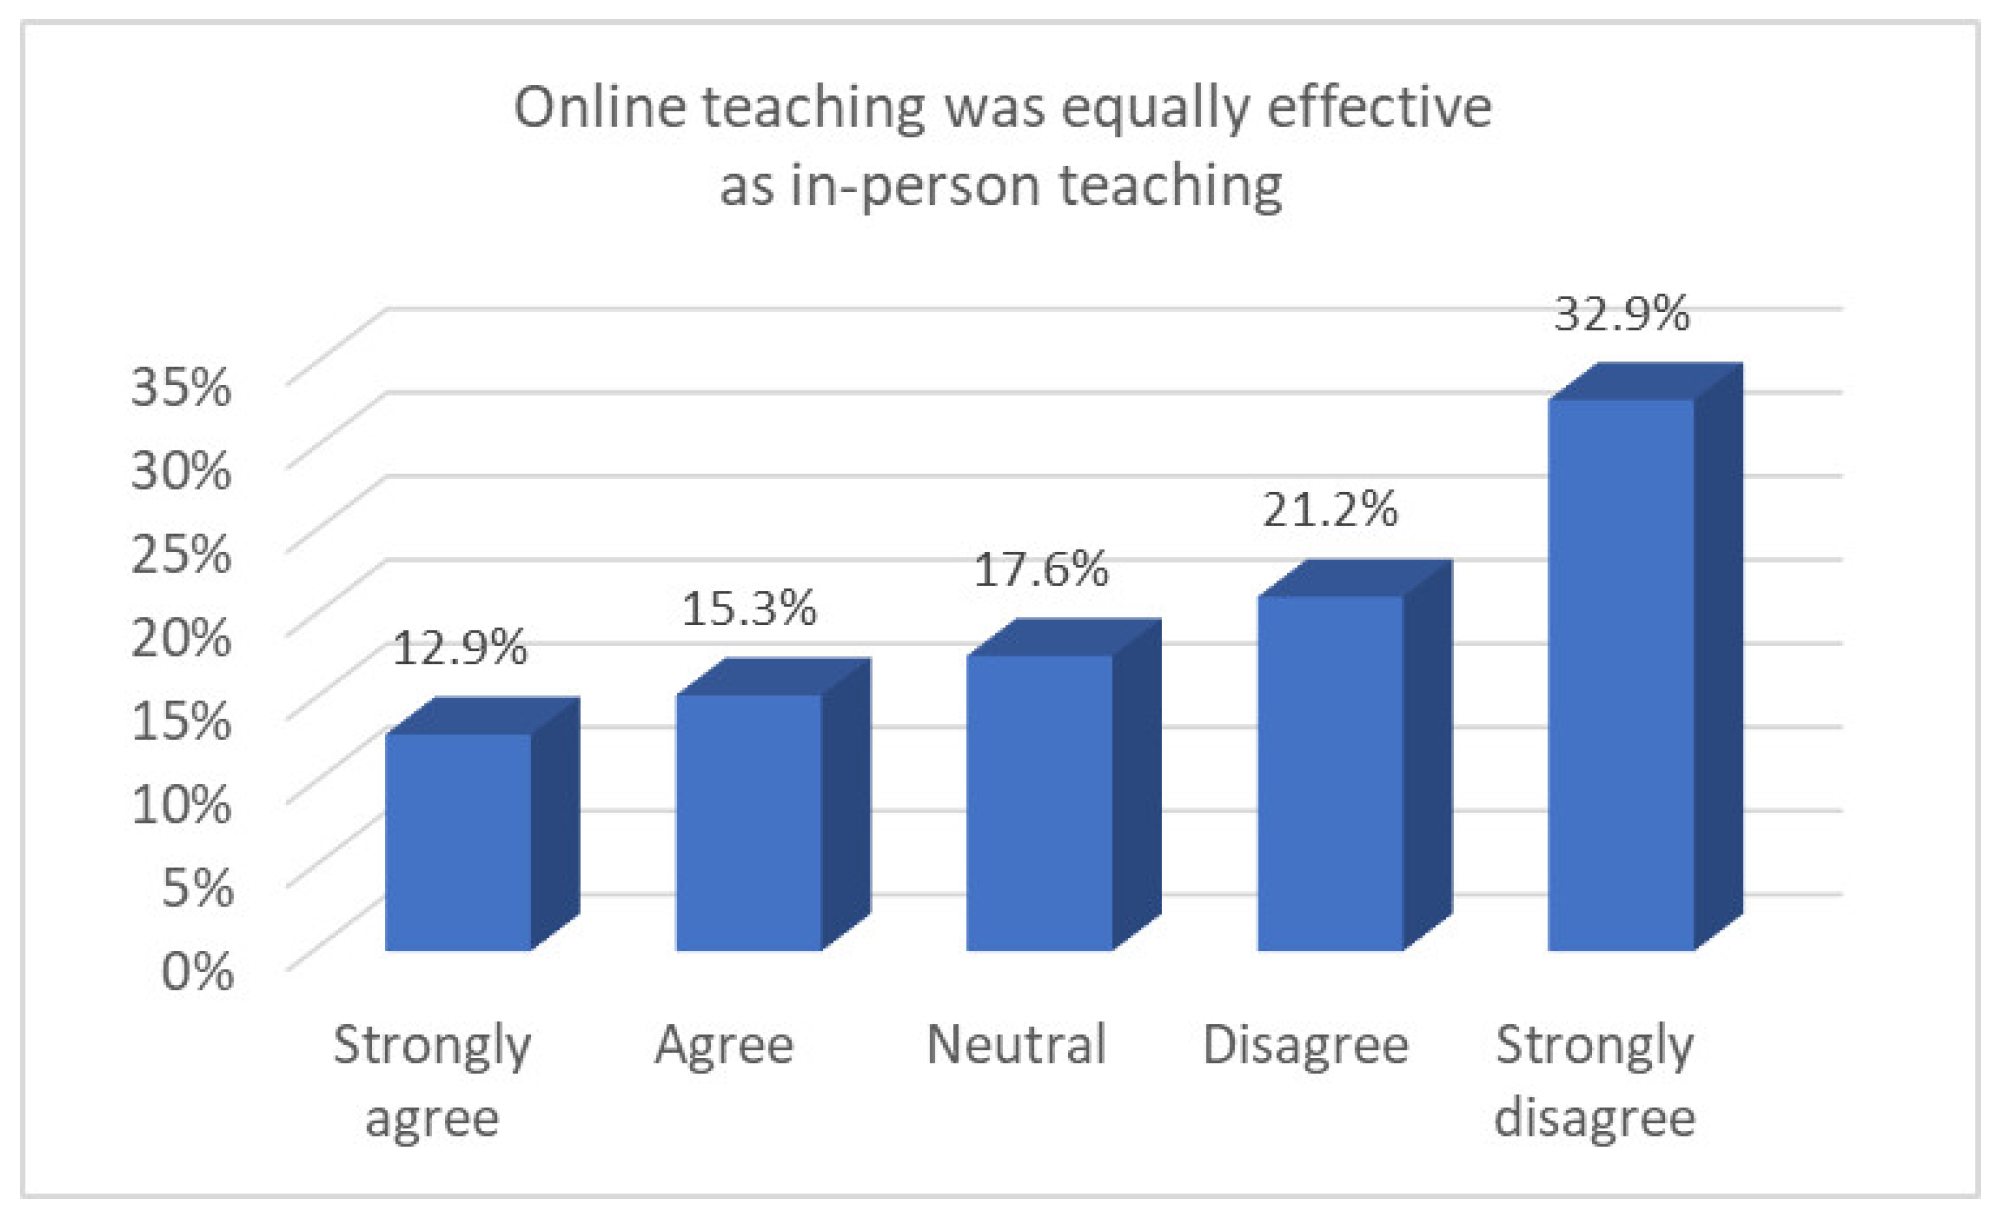
- SES-3: Online teaching was equally effective as in-person teaching.
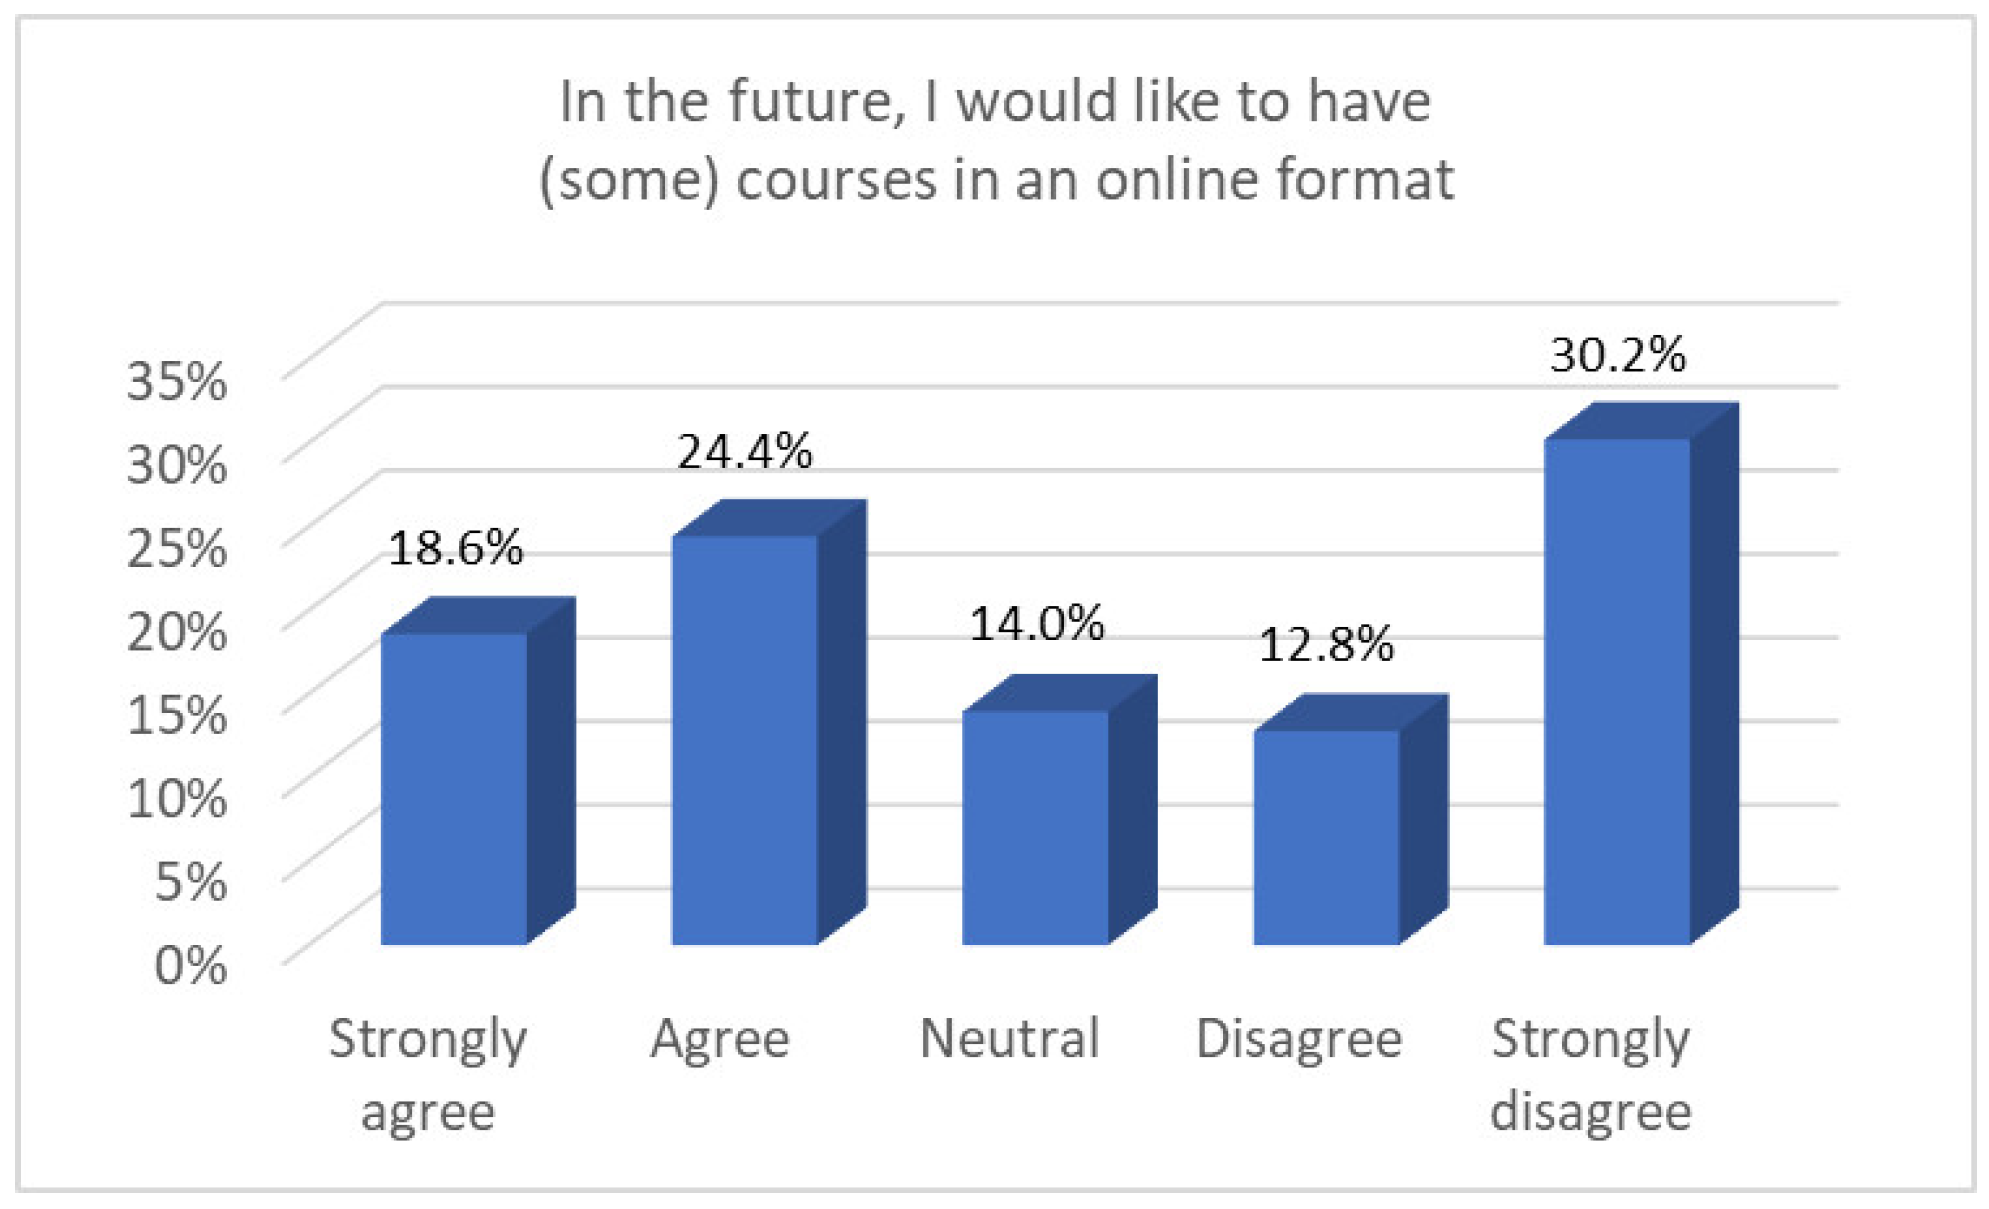
- SES-4: In the future, I would like to have (some) courses in an online format.
For each of the statements, the students could respond on a five-point Likert scale with the following five options:
- 1—strongly agree
- 2—agree
- 3—neutral
- 4—disagree
- 5—strongly disagree
Figure 3 and Figure 4 show the distribution of answers for CS and RIS students. With respect to effectiveness (SES-3), it can be observed that there is on average a slight disagreement with a mean of = 3.5, i.e., in between “3—neutral” and “4—disagree”. This is in line with the responses of all students of Jacobs University as their mean response is also = 3.5. With respect to the interest in online courses in the future (SES-4), the average tends towards “neutral” with a mean of = 3.1 for CS and RIS students, respectively = 3.2 for all Jacobs students.
The transition to online teaching at Jacobs University had to be done in an abrupt, ad-hoc fashion due to the COVID-19 pandemic. Furthermore, it involved a wide range of different courses in a wide range of academic disciplines. In addition, the level of experience with digital means of instruction varied substantially among instructors, and the majority had no to few previous exposures to this form of instruction. Given these circumstances, the above values should be seen as referring to “online teaching—as offered in the Spring 2020 semester as an emergency measure”. The on-average only slight disagreement with respect to the effectiveness of online teaching compared to in-person teaching may hence be seen as a relatively positive outcome; respectively, the above values should at least not necessarily be seen to be representative for online teaching per se.
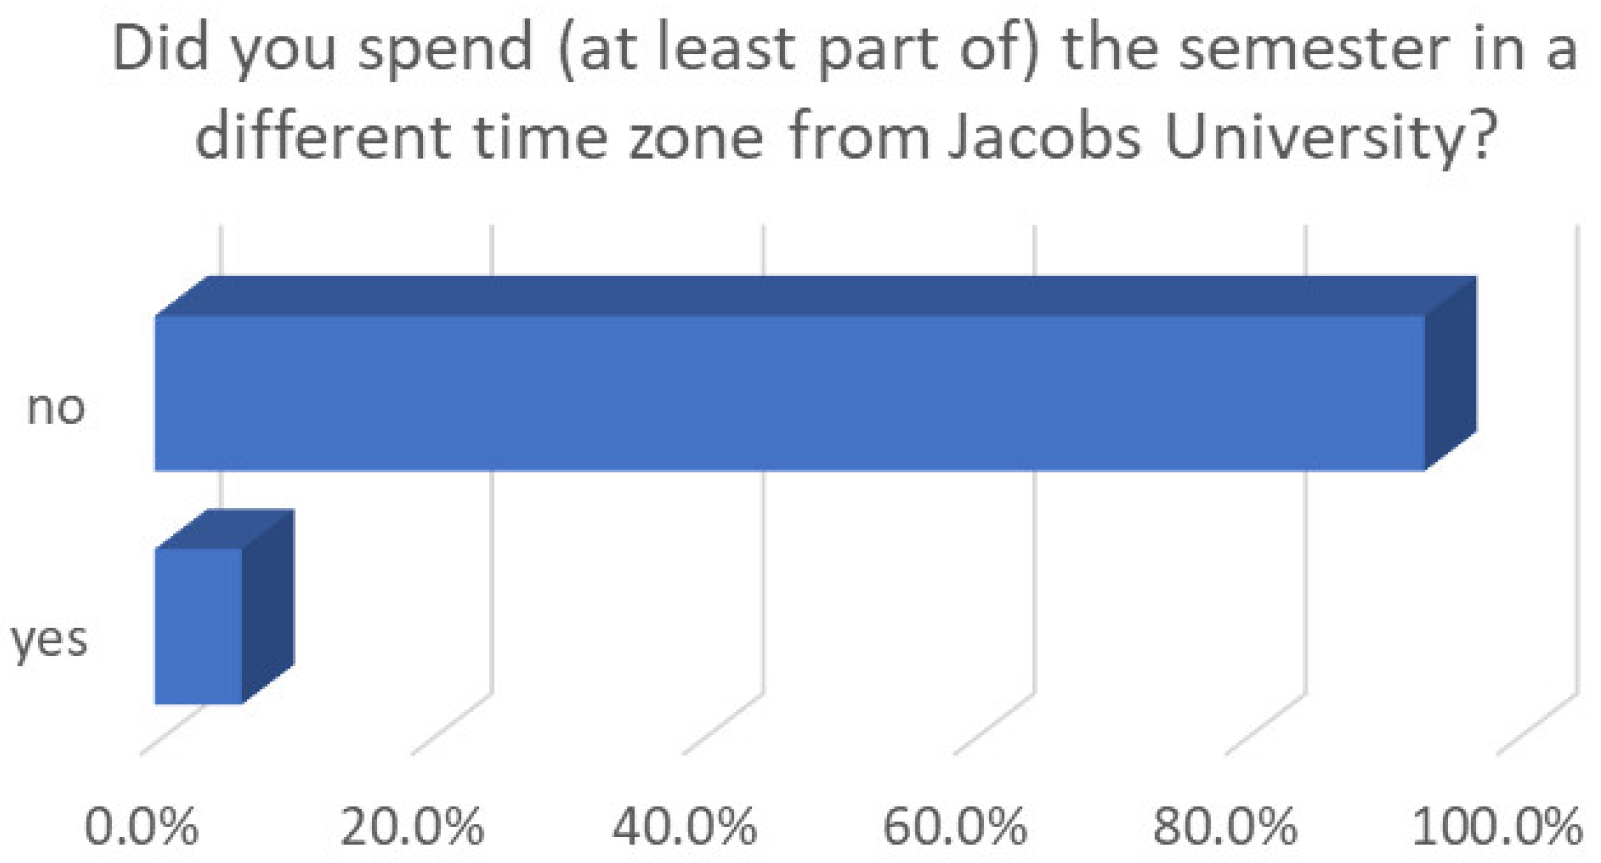
During the COVID-19 pandemic, the majority of Jacobs students stayed on campus. This also had an effect on the time zone the students were located in during the semester (Figure 5). This may be a factor with respect to asynchronous versus synchronous online teaching. According to the students’ self-report in the SES, only 6.4% answered the question “Did you spent (at least part of) the semester in a different time zone from Jacobs University?” with yes. The vast majority of 93.6% answered with no.
5. Students’ Perception in Course-Specific Self-Reporting
For a more detailed analysis of the course-specific effects, a survey among the students of the Robotics course was used, i.e., an informal Student Evaluation of Teaching (SET) was conducted. Google Forms was used for this survey. The students were invited via two emails (a first invitation and a reminder 10 days later), as well as through a post in the course forum. The invitation occurred after the final exam.
5.1. Response Rate
The response rate was very good. More precisely, forty-three students filled out the survey, i.e., 74% of the participants. This very high rate is surprising, especially in comparison to the usual response rates of the official course evaluations at Jacobs University and as it was conducted as an online survey [22,23]. It is hence worth considering different hypotheses for this observation.
There is evidence that there can be a correspondence between higher response rates and lower SET scores [26]. Given the very high scores of the course compared to other forms of instruction (Section 5.2), this hypothesis seems here unlikely. Another factor is simply the time it takes to respond to the survey [24,25]. As the survey is short, especially in comparison to, for example, the Jacobs SES (Section 4), this may be a factor. However, it is unlikely that it is the only one [22,23]. Factors like the distribution of age, gender, and social or cultural background can be excluded in comparison to the RIS and CS response rate in the SES, where similar student populations lead to only 36%.
However, student engagement is also considered to be an important element to boost response rates [25], i.e., whether the students perceive a benefit in participating or not. The invitations to participate in the survey included the following statement by the instructor: “I want to find out if and to which extent I provide some online elements (videos, homework solutions, etc.) also in the future for the robotics course as well as for other courses that I teach”. One hypothesis—given also the high approval rates in comparison to other forms of instruction (Section 5.2)—is hence that there is an intrinsic motivation of the students to encourage online teaching or at least a blended learning version of the course in the future.
5.2. Comparison to Other Forms of Instruction
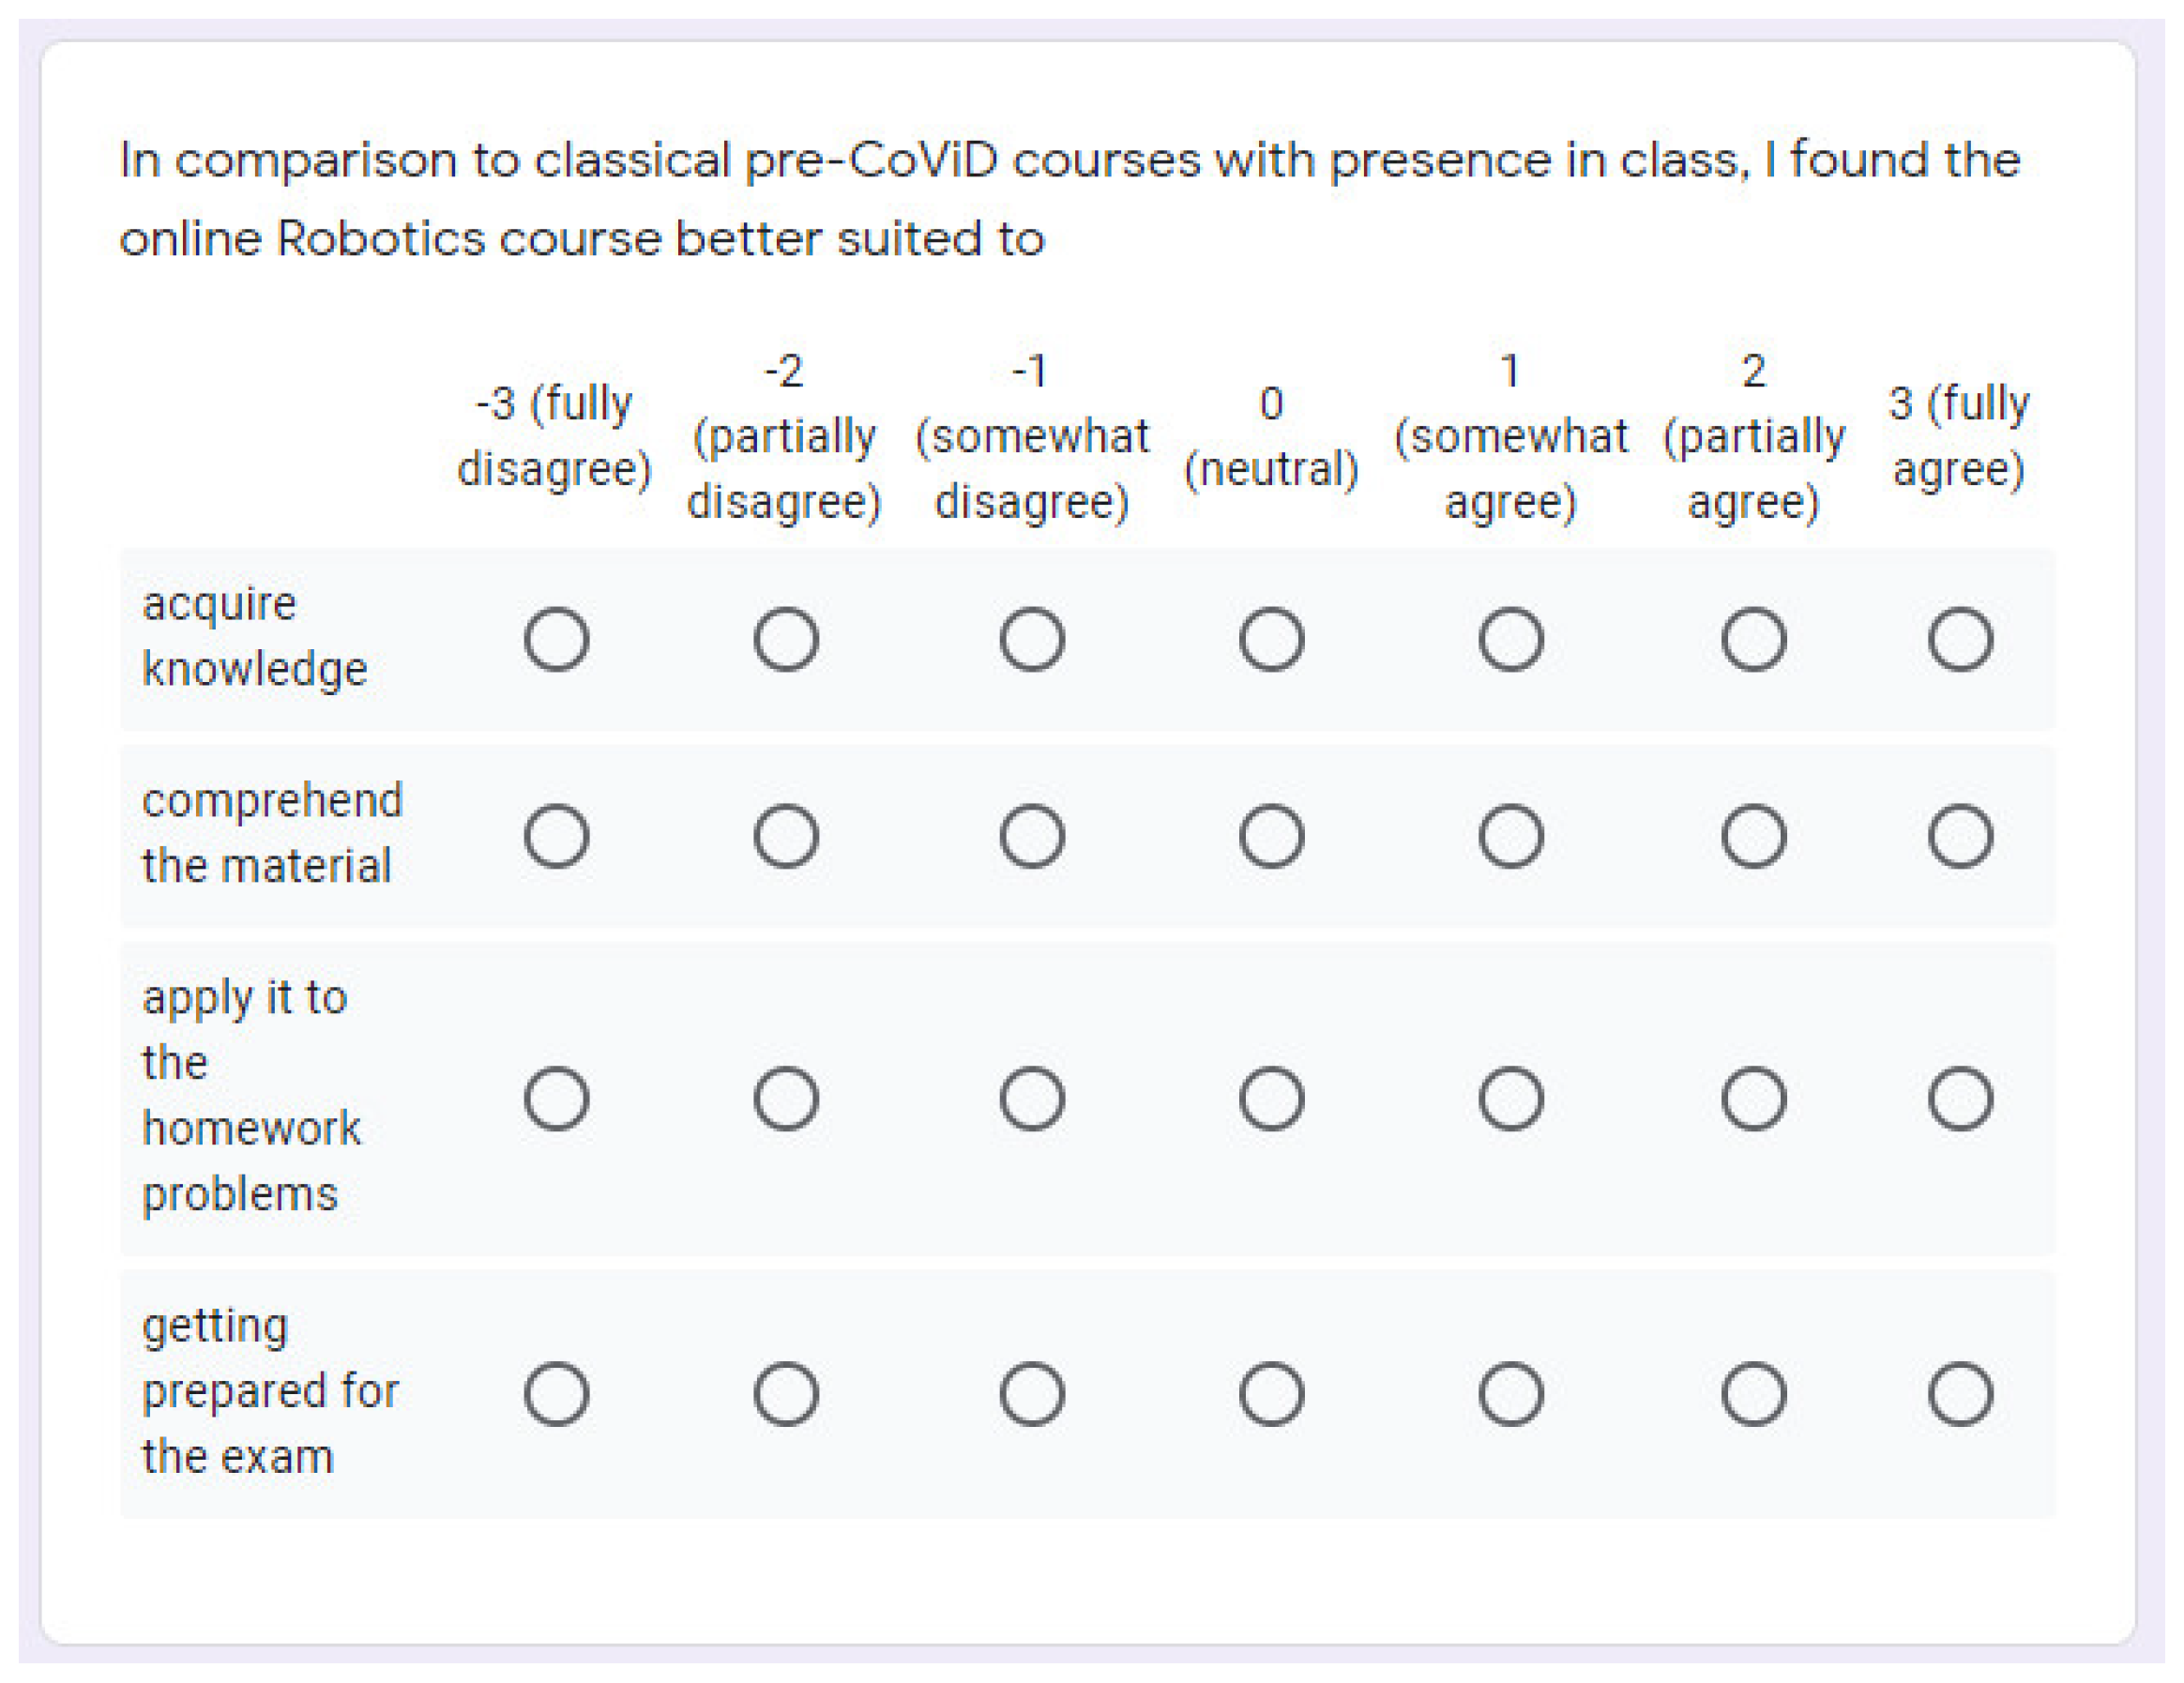
In the first part of the survey, the students’ perception of the course in comparison to other forms of instruction was polled. To this end, three multiple choice grids were used. One of the following three statements Q1.1 to Q1.3 was combined in each of them with the four sub-statements SQ-1.1 to SQ-1.4 (columns) and a −3 to +3 Likert scale (rows) to assess the agreement with each full statement, i.e., Q-1.X combined with SQ-1.Y:
- Q-1.1: In comparison to classical pre-COVID courses with presence in class, I found the online Robotics course better suited to
- Q-1.2: In comparison to synchronous online courses last semester (i.e., the course took place in the scheduled slot and it was streamed) during COVID, I found the asynchronous Robotics course (i.e., pre-recorded material provided for self-study) better suited to
- Q-1.3: In comparison to recorded classical lectures last semester (i.e., the course took place in the scheduled slot and it was recorded) during COVID, I found the asynchronous Robotics course better suited to
- SQ-1.1: acquire knowledge
- SQ-1.2: comprehend the material
- SQ-1.3: apply it to the homework problems
- SQ-1.4: getting prepared for the exam
As mentioned, a Likert scale was used where the following information was provided in addition to the numerical values:
- −3 (fully disagree)
- −2 (partially disagree)
- −1 (somewhat disagree)
- 0 (neutral)
- +1 (somewhat agree)
- +2 (partially agree)
- +3 (fully agree)
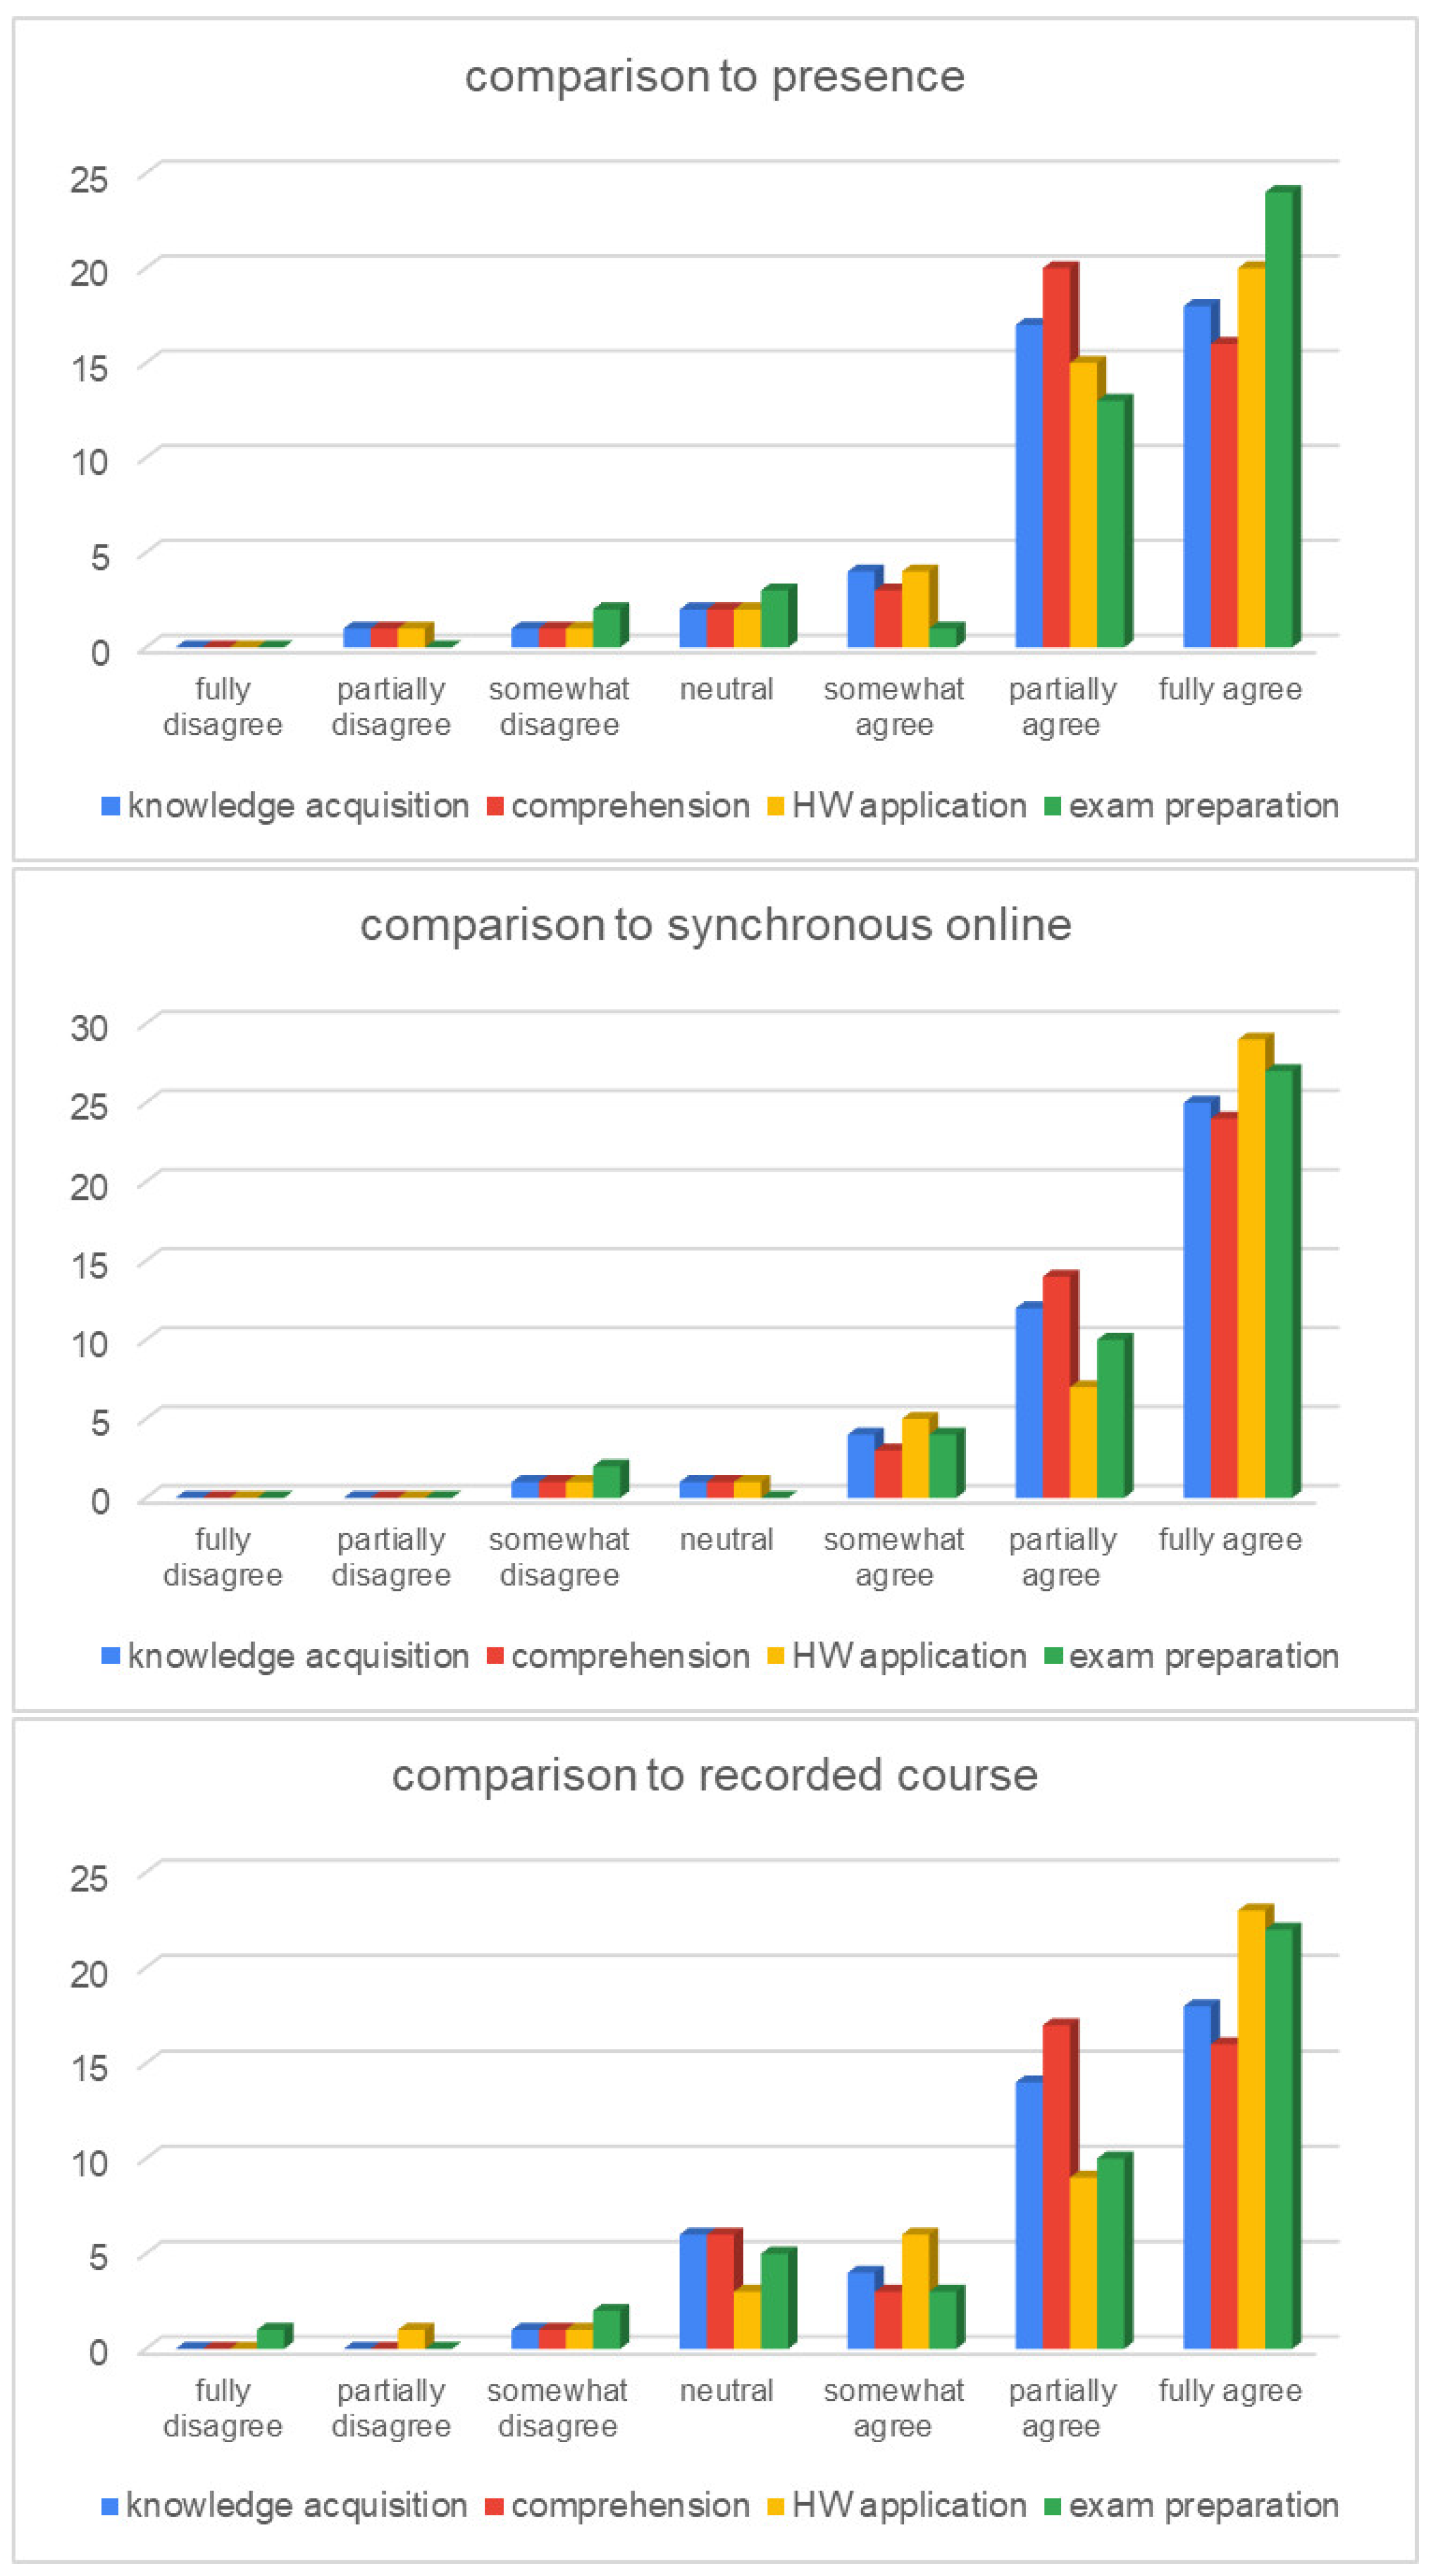
Figure 6 shows the according Google Forms question for Q-1.1. The results for this part of the survey are summarized in Table 5 and Figure 7. It can be observed that the asynchronous-online version of the Robotics course taught in Spring 2020 received very high scores, i.e., there were very high levels of agreement with respect to a perceived better suitability to achieve the objectives SQ-1.1 to SQ-1.4. This includes the comparison with face-to-face teaching, i.e., with presence in class. This is especially interesting in comparison to the Jacobs Student Experience Survey (SES) (Section 4), where no strong indicators for high ratings of online courses can be observed.
It has been reported in the literature that approval rates of courses tend to correlate with grades [27]. This has especially received some attention in the context of discussions on grade inflation [15,17,28,29]. However, this effect may be smaller or even non-existent for natural sciences, where there is evidence that students evaluate all “outlier courses” lower, i.e., they also rate courses with very high average grades with lower scores [30]. Nonetheless, the better performance with respect to grades (Section 3) is a possible factor for the high approval rates. The more interesting question is of course which factors may have contributed to the increase in the grade performance.
The responses (Table 5 and Figure 7) provide a bit of an indication in this respect. Though all levels of agreement are high, this is highest for all objectives SQ-1.Y in combination with Q-1.2, i.e., the suitability of the asynchronous online version to achieve the objectives is considered highest in comparison to a purely streamed online course where no recording is available. This is in line with the main benefit of online courses reported in the Jacobs SES (Section 4, SES-1.1), as well as further results presented below (Section 5.4).
5.3. Amount of Usage of Different Forms of Study Material
The second part of the survey deals with the question about which material is used how much. Concretely, the following question is posed:
- Q-2: I used for my studies…(please roughly specify how many percent of your study time)
For the different forms of study material, the following sub-statements were given in a multiple choice grid (column) to form a complete statement in combination with Q-2:
- SQ-2.1: Lecture slides (PDFs)
- SQ-2.2: Lecture slides with voice-over, pointer, etc. (videos)
- SQ-2.3: Homework slides (PDFs)
- SQ-2.4: Homework slides with voice-over, pointer, etc. (videos)
- SQ-2.5: A study group and/or other contacts with fellow students (in-person meeting, social media, etc.)
- SQ-2.6: The course forum on Moodle
- SQ-2.7: Textbook(s)
- SQ-2.8: External material from the Web (Wikipedia, YouTube, etc.)
For the rough self-assessment of the use of the different forms of study material, the following time brackets are provided. The brackets were chosen such that they capture significantly different amounts of time within a reasonable number of choices within the multiple choice grid (rows):
- Time Bracket TB-2.1: 0%
- TB-2.2: 1–5%
- TB-2.3: 5–10%
- TB-2.4: 10–20%
- TB-2.5: 20–30%
- TB-2.6: 30–40%
- TB-2.7: 40–50%
- TB-2.8: 50–75%
- TB-2.9: 75–100%
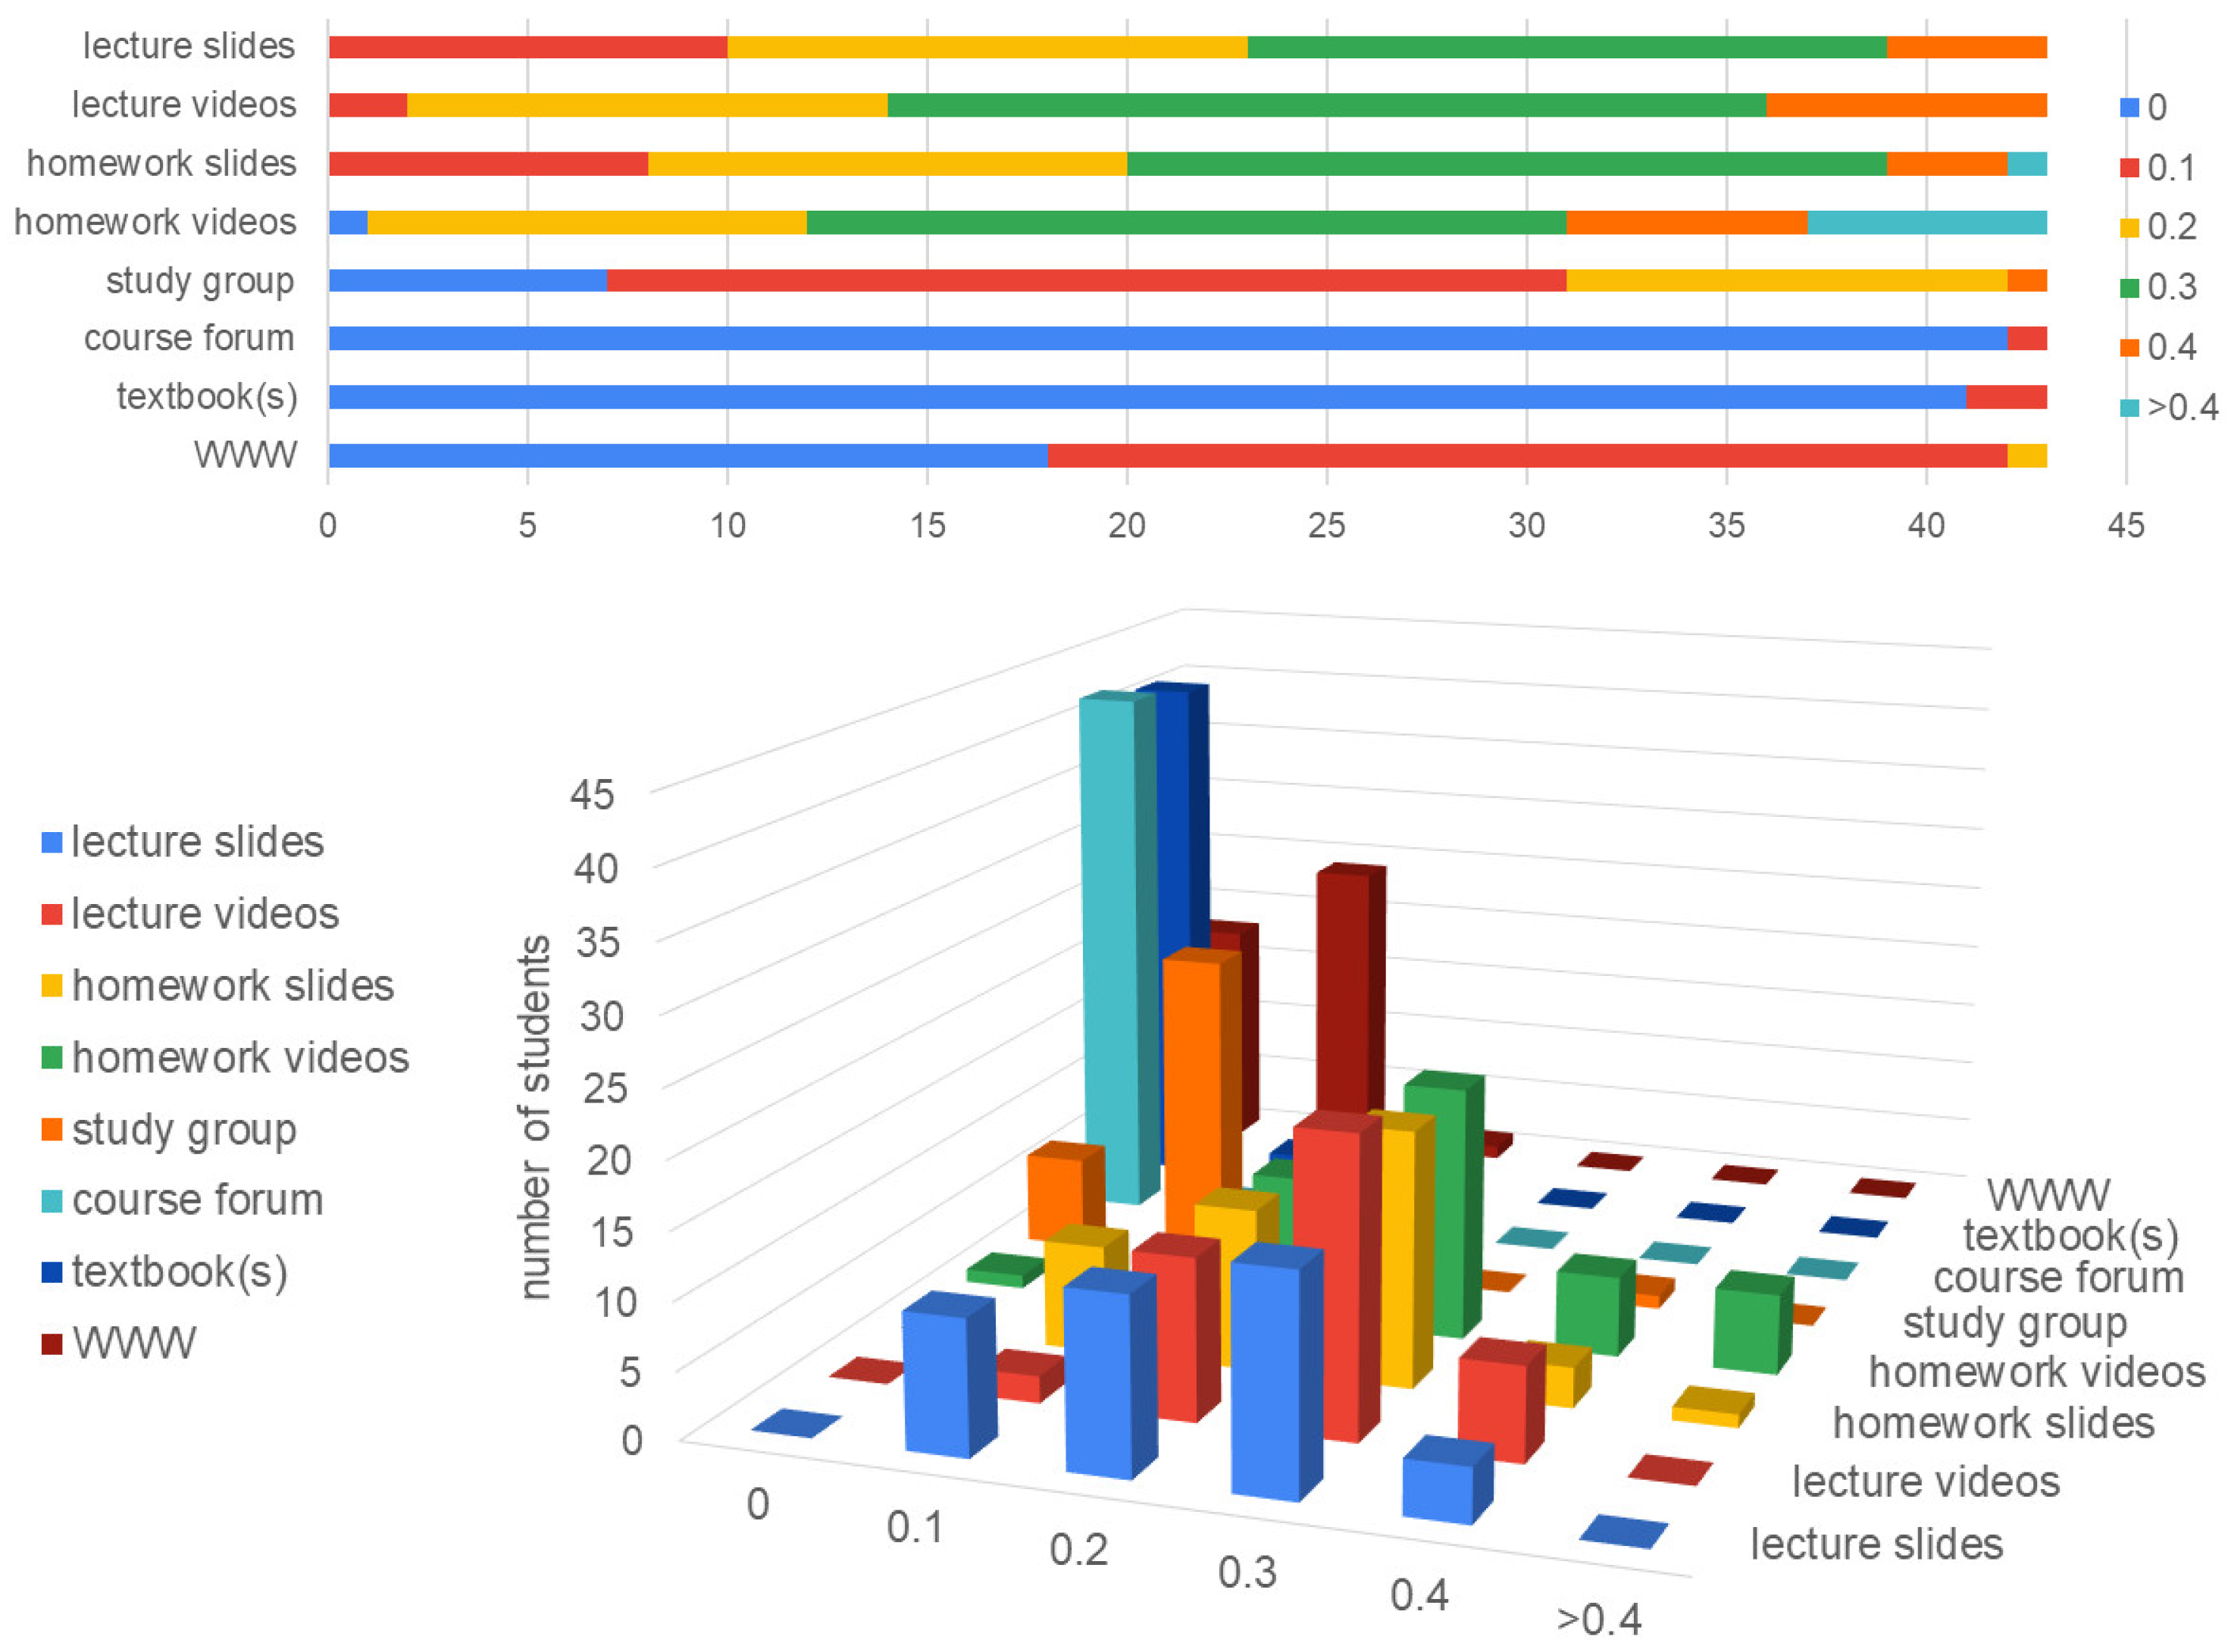
The results are summarized in Table 6 and Figure 8. Note that the different forms of material can be combined, e.g., lecture slides may be used in combination with watching a video explaining a homework solution. The values provided for this overview are hence normalized to compare the relative amounts of usage. The results are discussed in more detail below.
5.3.1. Slides/PDFs and Videos
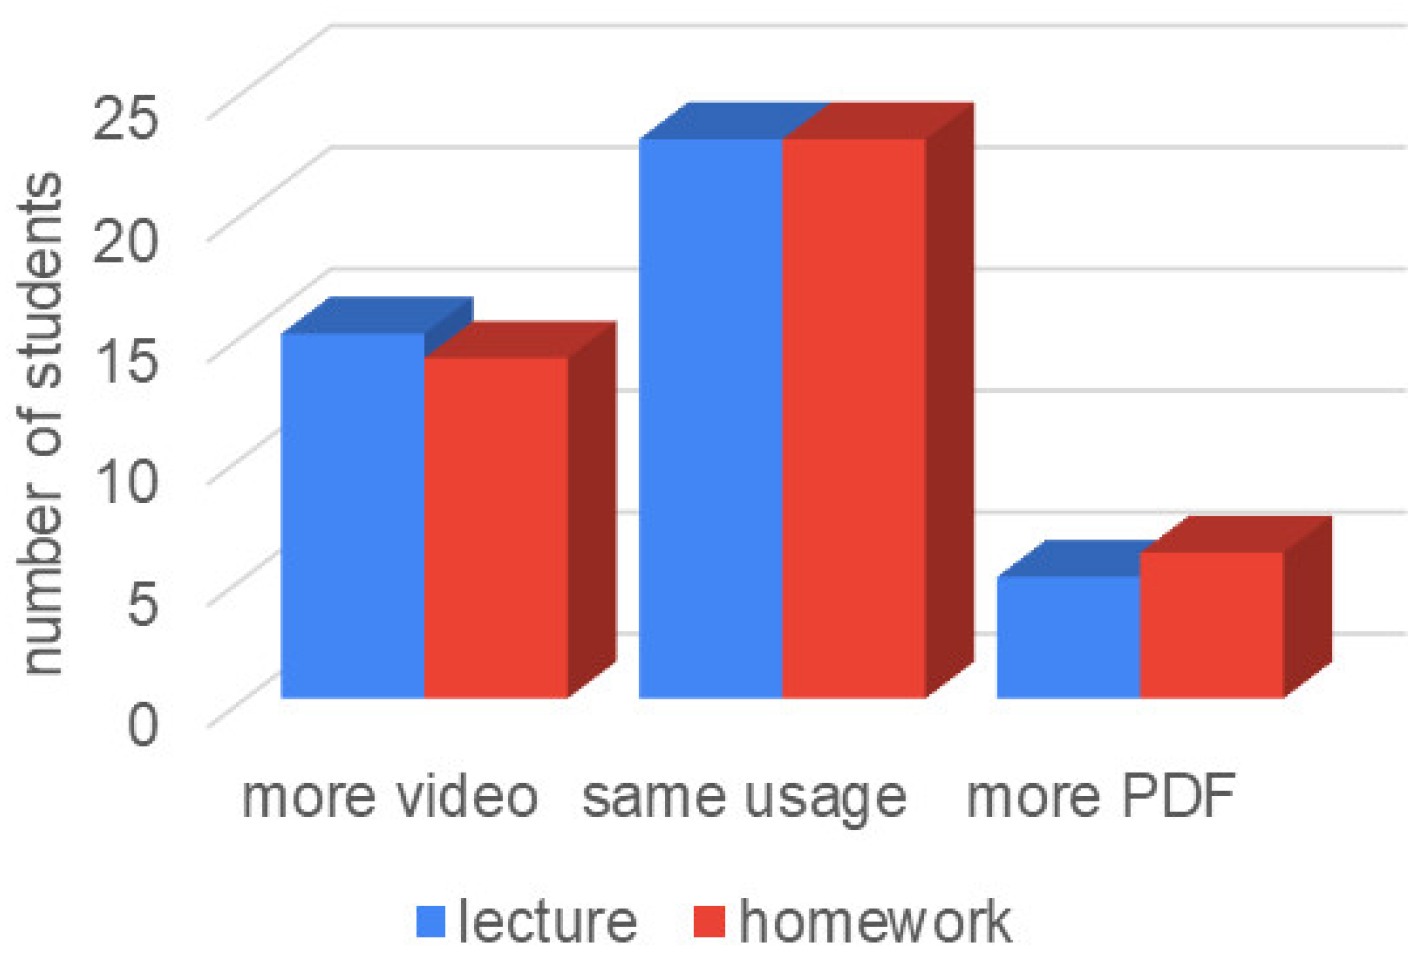
The lecture material in the form of slides and videos played by far the most important role in the study time of the students (Table 6, Figure 8). Specifically, the video material had high amounts of usage; particularly when considering that it can of course also be combined with the use of, e.g., print-outs of the PDF. The videos tended to have higher amounts of usage than the PDF for both lecture material, as well as for the solutions to the homework exercises (Table 7 and Figure 9).
This is in line with the general observations of an increasing trend among learners to use video material, e.g., in form of YouTube tutorials [31,32]. In a survey conducted in 2018 by The Harris Poll for the publisher Pearson, YouTube even ranked first for learning preferences in generation-Z (members of generation-Z are born in 1996 or after) [33]. Though as discussed in more detail below (Section 5.3.4), external resources from the WWW including YouTube were hardly used at all among the students in this course. The provided video material hence seems to have not only been significantly used, but it also seems to be self-sufficient for studying for the course.
5.3.2. Interaction among Students and with the Instructor
One factor that can very positively influence online learning is the interaction of the participants, respectively social presence [34]. Hence, a course forum was provided on Moodle and online meetings were scheduled using Microsoft Teams to allow for interactions including a sense of awareness of the presence of another, i.e., including elements of the expression of emotion, open communication, and group cohesion [35].
It is interesting to note that the course forum on Moodle was hardly used at all, though it was encouraged by the course instructor. The few questions posed in the forum dealt with general administrative questions, especially regarding the final exam. In line with the objective observation of activities in the forum by the instructor, a single student reported a minimal amount of study time (TB-2.1: 0–5%) spent in the forum (SQ-2.6). All other students reported that they spent no study time there.
Furthermore, Jacobs University provided the option for online meetings via Microsoft Teams for every course. Two online QA sessions on Teams were offered in regular course slots to give students the opportunity to ask questions and to discuss with the instructor. The two meetings were scheduled at the beginning of the online teaching phase and at the end of it, i.e., the end of the classes before the exam preparation phase started. Furthermore, the option to schedule additional meetings was also offered in the course forum and via email to the course mailing-list. However, similar to the use of the Moodle course forum, the response to the Teams online meetings was very limited, and the questions posed during the online meetings also mainly dealt with general administrative aspects, especially regarding the final exam. Fore example, there were multiple questions whether there would be an easier version due to the COVID-19 pandemic.
A possible explanation is that there is a strong tendency in recent years for students to prefer discussions in small, familiar peer groups. Figure 10 shows the histogram of the time brackets related to studying in a group, respectively in contact with other students. Only seven students, i.e., about 16%, reported that they were not part of a study group or were not in contact with other students (SQ-2.5). The vast majority, 36 students, i.e., about 84%, reported that they spent on average 14.9% (14.9% is non-normalized, i.e., this number is based on the average of the means of the reported time brackets; other forms of study material, e.g., videos or PDFs, may hence be also used during this time) of their study time in contact with their fellow students. Due to the circumstances related to the COVID-19 pandemic, the vast majority of this contact must have been self-organized and digital (the aspect of how much contact was digital or not was not surveyed as violations of the COVID-19 regulations and guidelines may not be honestly reported), i.e., using social media and messengers (Facebook, WhatsApp, etc.).
Though often stressed in the public media and common narratives, the importance and benefits of the (social) presence of the instructor and of interactions with the students in (online) teaching may be overestimated. The most important factor is social presence among the students themselves, which the instructor may facilitate with digital technology [35]. However, currently, students do have a myriad of options for digital social interactions among themselves through, e.g., social media, without the need for the help of the instructor for providing that infrastructure or for promoting its usage. In contrast, a high involvement of the instructor in online interactions—even by just moderating—can lead to a reduction in the students’ engagement [36]. Furthermore, small group sizes for the interactions are preferred by the students, and they are also more effective [36,37,38].
5.3.3. Use of Textbooks
Five textbooks [39,40,41,42,43] were listed as possible study material in the slides of the first part “P1 Introduction”. They are available in the library on campus, as well as in digital form as e-books (Jacobs University Bremen provides exhaustive access to the digital libraries of publishers and of professional organizations like, e.g., the IEEE for students and staff). However, the reported use of textbooks by the students was negligible. Only a single student reported a very minor use of textbooks; none of the other 42 participants in the survey used textbooks. A theoretical explanation is the limited access to the physical library during the COVID-19 pandemic; though this is only partially valid as there are also digital e-books available for the students.
The more likely explanation is that this observation is in line with a general trend in recent years. It was for example reported in [33] that textbooks rank behind YouTube, group activities, and apps or games for learning preferences in generation-Z. A strong trend in that direction was also already perceived before [31,32].
5.3.4. External Material from the WWW
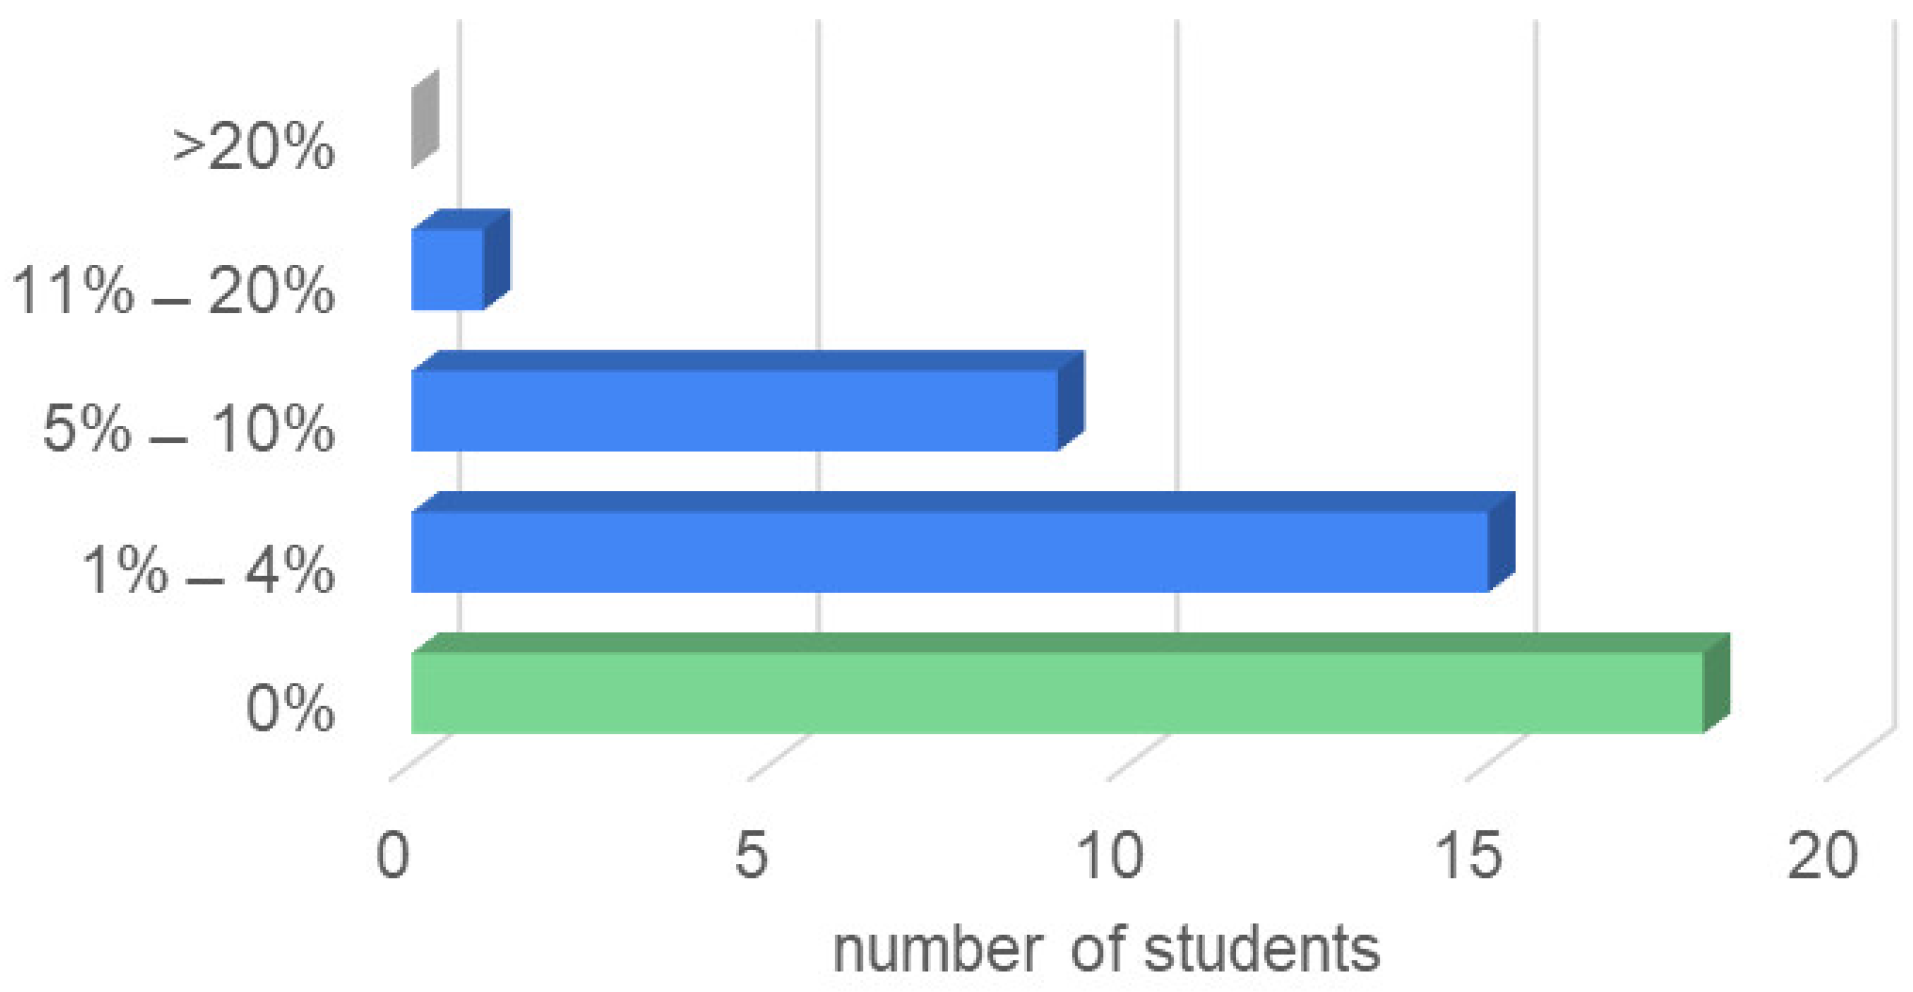
External material from the web (Wikipedia, YouTube, etc.) also played a relatively minor role. Figure 11 shows the distribution of the use of this material. Eighteen students reported not having used the WWW at all, and the average of 2.97% study time spent on the web was strongly influenced by a single outlier who reported a use of 17%. These amounts are to be expected; they can even be considered to be very small amounts of use of WWW-based resources [31,32,44,45].
This indicates that the provided course material seems to be self-sufficient, i.e., there is no evidence for a strong use of other material like textbooks (Section 5.3.3) and the—meanwhile most prominent—use of WWW-resources like Wikipedia or especially YouTube.
5.4. The Timing of Self-Studies
For the rough self-assessment of the timing with which the students conducted their studies, the following question was combined with the time brackets used already in the context of Q-2:
- Q-3: I studied the material without a fixed schedule, i.e., whenever it fitted my other courses and other activities… (please roughly specify how often in terms of approximate percentages)
As mentioned, the already presented time brackets were also provided in the multiple choice grid for Q-3:
- TB-3.1: 0%
- TB-3.2: 1–5%
- TB-3.3: 5–10%
- TB-3.4: 10–20%
- TB-3.5: 20–30%
- TB-3.6: 30–40%
- TB-3.7: 40–50%
- TB-3.8: 50–75%
- TB-3.9: 75–100%
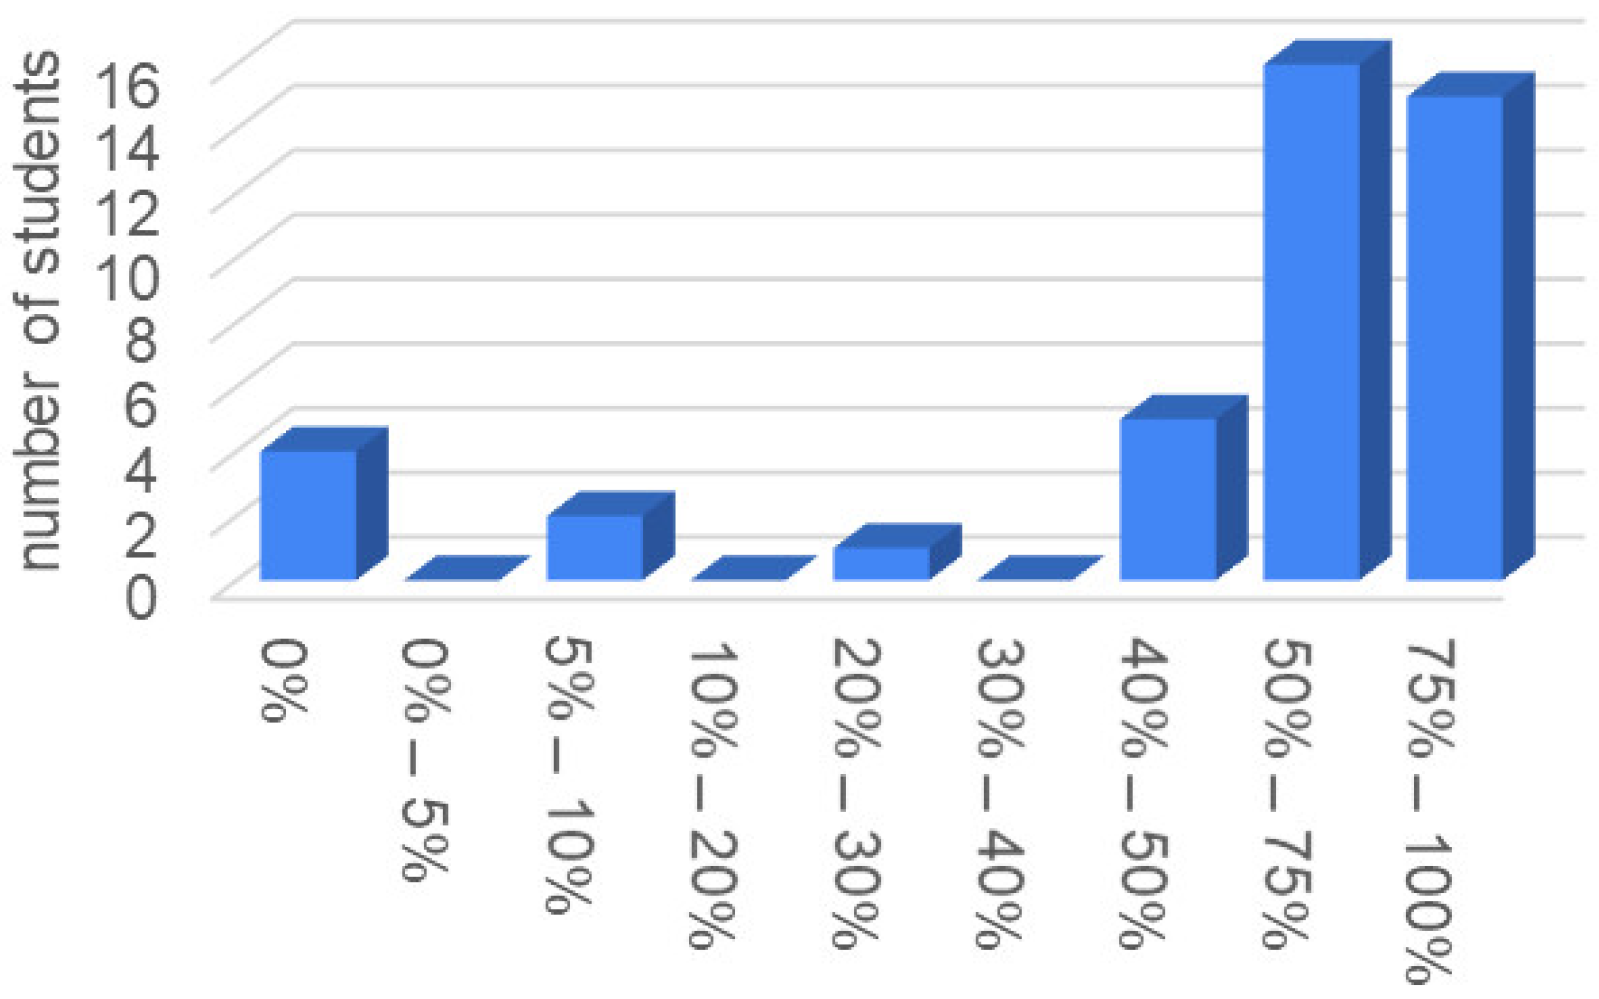
The results are shown in Figure 12. It can be seen that a substantial number of students studied the material for a substantial amount of time without a fixed schedule. More precisely, thirty-one students, i.e., 72% of students in the course, studied 50% to 100% of their time without a fixed schedule. Only 12 students, i.e., 28%, reported predominantly using a fixed schedule—though six students of those, i.e., 14% of the students in the course, still studied 20% to 50% of their time without a fixed schedule.
5.5. The Role of Reminder Emails
Due to the lack of interaction with the students during the class period (see also Section 5.3.2), it was unclear to the instructor during that period if and to what extent the students studied on their own as needed for the completion of the course. Hence, reminder emails were sent every two weeks, which listed the material the students were expected to have studied and understood up to that moment. There is some general evidence that course-related emails can have positive effects; though it is not fully evident how pronounced the effect is, respectively which factors contribute to it [46,47].
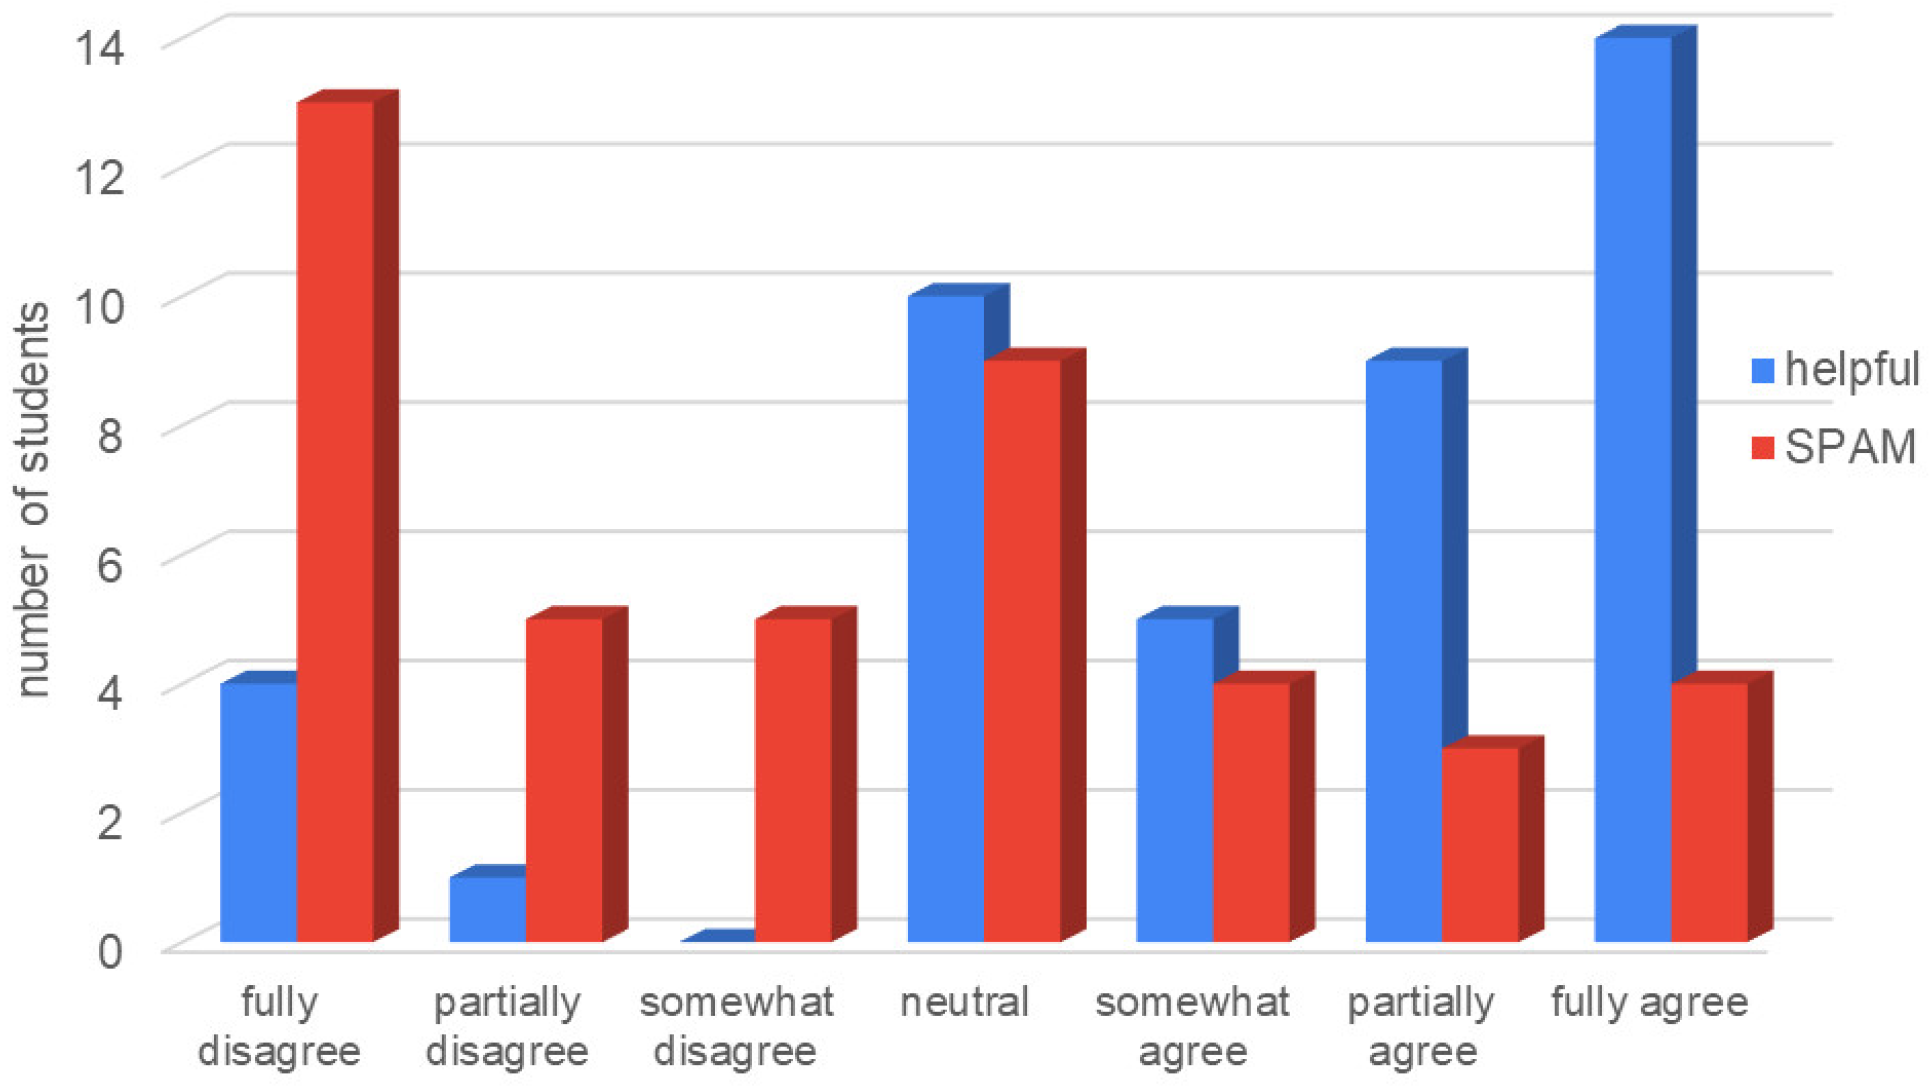
To test for the way the students perceived the emails, the following statement Q-4 was combined with the two sub-statements SQ-4.1 and SQ-4.2 (columns) and a −3 to +3 Likert scale (rows) in a multiple-choice grid to assess the agreement with each full statement, i.e., Q-4 combined with SQ-4.X:
- Q-4: The reminder emails that mentioned what was to be studied up to that moment were…
- SQ-4.1: helpful to keep track of the course material
- SQ-4.2: just further spam in my mailbox as I got already too many emails regarding courses
Figure 13 shows the distribution of the responses. For SQ-4.1, the mean was = 1.19 (with a standard deviation of = 1.85), i.e., there was a clear tendency to consider the emails as being helpful. For SQ-4.2, the mean was = −0.74 (with a standard deviation of = 1.99), i.e., there was a slight disagreement with seeing reminders emails as spam.
It can be concluded that even simple emails that remind the students of the expectations with respect to their studies can already be helpful. However, it also should be taken into account that too frequent emails may be considered spam and that they are likely ignored in that case.
5.6. Personal Situation Due to COVID-19
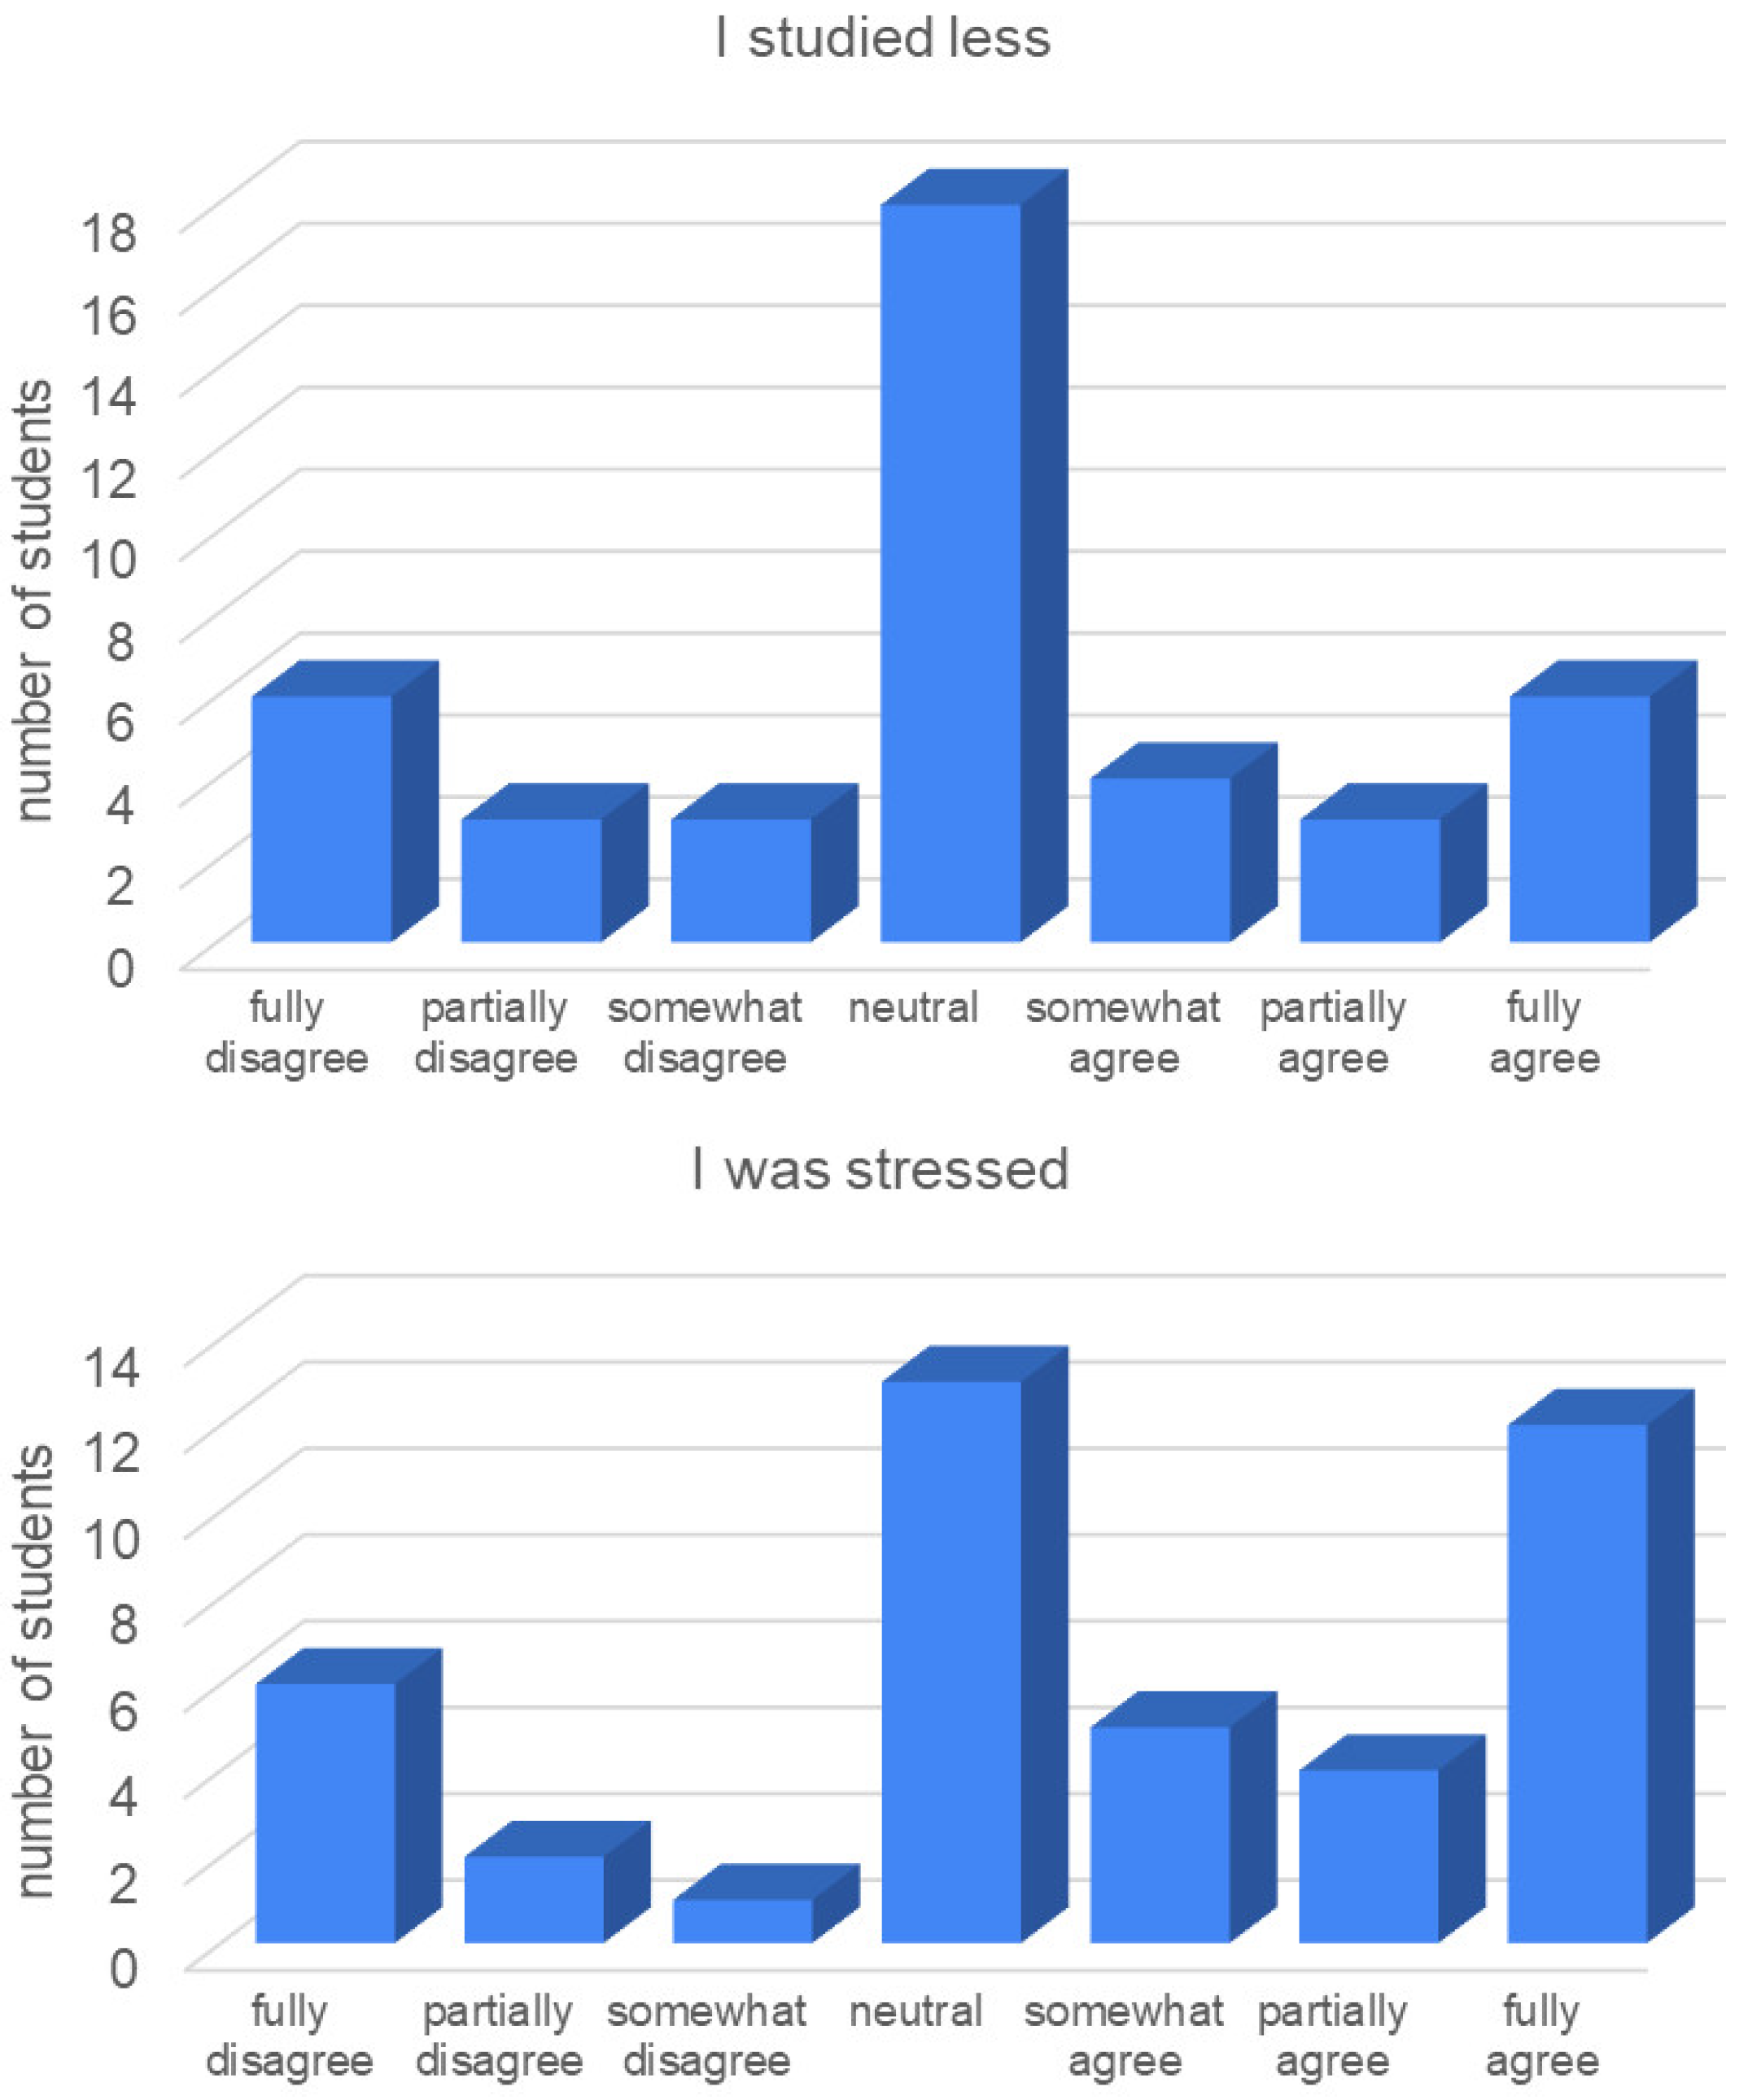
The following statement Q-5 was combined with the two sub-statements SQ-5.1 and SQ-5.2 (columns) and a −3 to +3 Likert scale (rows) in a multiple-choice grid to assess the students’ perception of the situation due to COVID-19:
- Q-5: Due to my personal situation under the COVID-19 measures…
- SQ-5.1: I studied less as I did not find the time (compared to previous semesters)
- SQ-5.2: I was stressed
With respect to the amount of reported study time (SQ-5.1), it is interesting to note that there was on average no effect at all of COVID-19 for the students of this course (Figure 14). The mean was = 0.02 (with a standard deviation of = 1.80). Eighteen responders, i.e., 42% of the students, reported a completely neutral stance towards this aspect. The number of students responding strongly negatively (−3) was six, i.e., 14%. This was exactly the same number of students who responded strongly positively (+3). Therefore, for each student for whom there was a reported negative effect on the amount of study time, there tended to be also another student for whom there was a positive effect.
For the reported level of stress due to COVID-19 (SQ-5.2), there was a slightly more pronounced effect (Figure 14). The mean was = 0.60 (with a standard deviation of = 2.02), i.e., the students in the course reported on average a slightly increased level of stress. However, it must be noted that this mean was strongly influenced by 12 students, i.e., 28%, who strongly agreed (+3) with SQ-5.2. A slightly larger group of 13 students, i.e., 30%, had a neutral stance. A surprising number of six students, i.e., 14%, even strongly disagreed (−3) with respect to being stressed due to COVID-19.
Compared to the first international studies with respect to the effects of the COVID-19 pandemic [5], the surveyed students in this course seemed to have been affected comparably little in terms of study time and stress. This is possibly the case as there was in general a relatively smooth continuation of education activities at Jacobs University. Furthermore, the students largely could stay in their familiar environment with their friends on campus—though under the constraints of the German COVID-19 measures including a lock-down in March 2020.
6. Conclusions
Observations from an undergraduate Robotics course are presented, which was offered online at Jacobs University Bremen, Germany, in the spring 2020 semester during the COVID-19 pandemic. Students achieved a better grade performance compared to previous years, and there were indicators for high approval rates for the way the course was taught. Based on different indicators and a discussion of the educational literature, hypotheses were presented why this was the case.
Specifically, there was evidence for the following hypotheses, which can be of interest for online education in robotics and related disciplines in general:
- Asynchronous online teaching can provide benefits over synchronous online teaching.
- (a)
- Students appreciate the flexibility that asynchronous teaching material provides. This includes aspects with respect to both the timing, as well as the location of study (Section 4: SES1.1 and SES1.4; Section 5.4: Q-3).
- (b)
- Keeping focused in online meetings was reported by students to be the main detrimental factor in online education (Section 4: SES2.4), which is accordingly a challenge for synchronous online teaching.
- (c)
- Videos were an increasingly important, if not the most important form of study material for generation-Z (Section 5.3: Q2); material that is specifically produced for online studies can hence have a high impact—especially in comparison to just a recording of a synchronous stream.
- Social interaction is an important factor, but it can happen in self-organized, smaller peer-groups
- (a)
- The lack of social interactions with other students, as well as with the instructor scored high among the detrimental factors in online education (Section 4: SES2.9 and SES2.10).
- (b)
- There is a tendency for generation-Z to prefer small peer groups, which may reflect a reduced usage up to an avoidance of online forums and online sessions with the whole class if they are not essential for the studies (Section 5.3.2: SQ-2.6)
- (c)
- Social interactions among the students can emerge in self-organized study groups, likely using a substantial amount of social media, without the intervention of the instructor (Section 5.3.2: SQ-2.5)
- (d)
- Simple reminder emails can already have a positive effect; though there is the risk of just spamming students (Section 5.5: Q-4).
Of course, one has to be cautious with respect to the universal validity of these hypotheses, which must be further validated in future work or as contributions to meta-studies. However, in combination with the extensive references to the literature, it is expected that the article can be useful for instructors of robotics courses when considering online teaching in the future beyond the COVID-19 pandemic. This also holds for just using elements of online teaching in combination with face-to-face teaching, i.e., for blended learning [48,49], e.g., by combining asynchronous online material with in-class sessions.
Author Contributions
Conceptualization, A.B., E.D., and F.M.; methodology, A.B., E.D., and A.N.; formal analysis, A.B. and E.D.; writing A.B.; visualization, A.B. and E.D.; funding acquisition, A.B. and F.M. All authors read and agreed to the published version of the manuscript.
Funding
This research was funded by the project “Hands-On 4.0: Individualized Applied Education in the Digitalization Age” (Grant 2019-1347-00) by the Jacobs Foundation within the “B3—Bildung Beyond Boundaries” framework.
Informed Consent Statement
Informed consent was obtained from all subjects involved in the study.
Data Availability Statement
The data presented in this study are available on request from the corresponding author. The data are not publicly available to ensure proper handling under data protection regulations.
Conflicts of Interest
The authors declare no conflict of interest. The funders had no role in the design of the study; in the collection, analyses, or interpretation of data; in the writing of the manuscript; nor in the decision to publish the results.
References
- Cucinotta, D.; Vanelli, M. WHO Declares COVID-19 a Pandemic. Acta Bio-Med. Atenei Parm. 2020, 91, 157–160. [Google Scholar] [CrossRef]
- Symonds, Q. The Coronavirus Crisis and the Future of Higher Education. 2020. Available online: https://www.qs.com/portfolio-items/the-coronavirus-crisis-and-the-future-of-higher-education-report/ (accessed on 30 December 2020).
- Bai-Yun, C. The Effects of COVID-19 on International Secondary Assessment. 2020. Available online: https://www.naric.org.uk/downloads/The%20Effects%20of%20COVID-19%20on%20International%20Secondary%20Assessment%20-%20UK%20NARIC.pdf (accessed on 30 December 2020).
- Symonds, Q. International Student Survey—Global Opportunities in the New Higher Education Paradigm. 2020. Available online: https://info.qs.com/rs/335-VIN-535/images/QS_EU_Universities_Edition-International_Student_Survey_2020.pdf (accessed on 30 December 2020).
- Aristovnik, A.; Kerzic, D.; Ravselj, D.; Tomazevic, N.; Umek, L. Impacts of the COVID-19 Pandemic on Life of Higher Education Students: A Global Perspective. Sustainability 2020, 12, 8438. [Google Scholar] [CrossRef]
- Crawford, J.; Butler-Henderson, K.; Rudolph, J.; Malkawi, B.; Glowatz, M.; Burton, R.; Magni, P.A.; Lam, S. COVID-19: 20 countries’ higher education intra-period digital pedagogy responses. J. Appl. Learn. Teach. 2020, 3. [Google Scholar] [CrossRef] [Green Version]
- IAU. Regional/National Perspectives on the Impact of COVID-19 on Higher Education; IAU: Paris, France, 2020. [Google Scholar]
- Pearson. The Global Learner Survey; Pearson: London, UK, 2020. [Google Scholar]
- Davies, P. What is Evidence-based Education? Br. J. Educ. Stud. 1999, 47, 108–121. [Google Scholar] [CrossRef]
- Slavin, R.E. Evidence-Based Education Policies: Transforming Educational Practice and Research. Educ. Res. 2002, 31, 15–21. [Google Scholar] [CrossRef] [Green Version]
- Costello, E. Opening up to open source: Looking at how Moodle was adopted in higher education. Open Learn. J. Open Distance e-Learn. 2013, 28, 187–200. [Google Scholar] [CrossRef]
- Dougiamas, M.; Taylor, P.C. Moodle: Using Learning Communities to Create an Open Source Course Management System; EdMedia; Association for the Advancement of Computing in Education (AACE): Chesapeake, VA, USA, 2003. [Google Scholar]
- Ilag, B.N. Microsoft Teams Overview. In Understanding Microsoft Teams Administration: Configure, Customize, and Manage the Teams Experience; Springer: Berkeley, CA, USA, 2020; pp. 1–36. [Google Scholar] [CrossRef]
- Schneider, M.; Preckel, F. Variables associated with achievement in higher education: A systematic review of meta-analyses. Psychol. Bull. 2017, 143, 565–600. [Google Scholar] [CrossRef]
- Stroebe, W. Student Evaluations of Teaching Encourages Poor Teaching and Contributes to Grade Inflation: A Theoretical and Empirical Analysis. Basic Appl. Soc. Psychol. 2020, 42, 276–294. [Google Scholar] [CrossRef]
- Linse, A.R. Interpreting and using student ratings data: Guidance for faculty serving as administrators and on evaluation committees. Stud. Educ. Eval. 2017, 54, 94–106. [Google Scholar] [CrossRef]
- Stroebe, W. Why Good Teaching Evaluations May Reward Bad Teaching: On Grade Inflation and Other Unintended Consequences of Student Evaluations. Perspect. Psychol. Sci. 2016, 11, 800–816. [Google Scholar] [CrossRef]
- Clayson, D.E. Student Evaluations of Teaching: Are They Related to What Students Learn: A Meta-Analysis and Review of the Literature. J. Mark. Educ. 2009, 31, 16–30. [Google Scholar] [CrossRef] [Green Version]
- Carpenter, S.K.; Witherby, A.E.; Tauber, S.K. On Students’ (Mis)judgments of Learning and Teaching Effectiveness. J. Appl. Res. Mem. Cogn. 2020, 9, 137–151. [Google Scholar] [CrossRef]
- Perry, R.P.; Smart, J.C. The Scholarship of Teaching and Learning in Higher Education: An Evidence-Based Perspective; Springer: Dordrecht, The Netherlands, 2007. [Google Scholar] [CrossRef]
- Xu, D.; Jaggars, S.S. Performance Gaps Between Online and Face-to-Face Courses: Differences Across Types of Students and Academic Subject Areas. J. High. Educ. 2014, 85, 633–659. [Google Scholar] [CrossRef]
- Young, K.; Joines, J.; Standish, T.; Gallagher, V. Student evaluations of teaching: The impact of faculty procedures on response rates. Assess. Eval. High. Educ. 2019, 44, 37–49. [Google Scholar] [CrossRef]
- Nulty, D.D. The adequacy of response rates to online and paper surveys: What can be done? Assess. Eval. High. Educ. 2008, 33, 301–314. [Google Scholar] [CrossRef] [Green Version]
- Alderman, L.; Towers, S.; Bannah, S. Student feedback systems in higher education: A focused literature review and environmental scan. Qual. High. Educ. 2012, 18, 261–280. [Google Scholar] [CrossRef]
- Nair, C.S.; Adams, P.; Mertova, P. Student Engagement: The Key to Improving Survey Response Rates. Qual. High. Educ. 2008, 14, 225–232. [Google Scholar] [CrossRef] [Green Version]
- Bacon, D.R.; Johnson, C.J.; Stewart, K.A. Nonresponse Bias in Student Evaluations of Teaching. Mark. Educ. Rev. 2016, 26, 93–104. [Google Scholar] [CrossRef]
- Cohen, P.A. Student Ratings of Instruction and Student Achievement: A Meta-analysis of Multisection Validity Studies. Rev. Educ. Res. 1981, 51, 281–309. [Google Scholar] [CrossRef]
- Davison, E.; Price, J. How do we rate? An evaluation of online student evaluations. Assess. Eval. High. Educ. 2009, 34, 51–65. [Google Scholar] [CrossRef]
- Griffin, B.W. Grading leniency, grade discrepancy, and student ratings of instruction. Contemp. Educ. Psychol. 2004, 29, 410–425. [Google Scholar] [CrossRef]
- Centra, J.A. Will Teachers Receive Higher Student Evaluations by Giving Higher Grades and Less Course Work? Res. High. Educ. 2003, 44, 495–518. [Google Scholar] [CrossRef]
- Buzzetto-More, N.A. An Examination of Undergraduate Student’s Perceptions and Predilections of the Use of YouTube in the Teaching and Learning Process. Interdiscip. J. e-Skills Lifelong Learn. 2014, 10, 17–32. [Google Scholar] [CrossRef]
- Nicholas, A.J. Preferred Learning Methods of the Millennial Generation. Int. J. Learn. Annu. Rev. 2008, 15, 27–34. [Google Scholar] [CrossRef] [Green Version]
- Poll, T.H. Beyond Millennials: The Next Generation of Learners; Pearson: London, UK, 2018. [Google Scholar]
- Sun, A.; Chen, X. Online Education and Its Effective Practice: A Research Review. J. Inf. Technol. Educ. Res. 2016, 15, 157–190. [Google Scholar] [CrossRef] [Green Version]
- Garrison, D.R.; Anderson, T.; Archer, W. Critical Inquiry in a Text-Based Environment: Computer Conferencing in Higher Education. Internet High. Educ. 1999, 2, 87–105. [Google Scholar] [CrossRef] [Green Version]
- Ke, F. Online interaction arrangements on quality of online interactions performed by diverse learners across disciplines. Internet High. Educ. 2013, 16, 14–22. [Google Scholar] [CrossRef]
- Chen, L.T.; Liu, L. Social Presence in Multidimensional Online Discussion: The Roles of Group Size and Requirements for Discussions. Comput. Sch. 2020, 37, 116–140. [Google Scholar] [CrossRef]
- Akcaoglu, M.; Lee, E. Increasing Social Presence in Online Learning through Small Group Discussions. Int. Rev. Res. Open Distrib. Learn. 2016, 17. [Google Scholar] [CrossRef] [Green Version]
- Craig, J.J. Introduction to Robotics—Mechanics and Control; Prentice Hall: Upper Saddle River, NJ, USA, 2005. [Google Scholar]
- Thrun, S.; Burgard, W.; Fox, D. Probabilistic Robotics; MIT Press: Cambridge, MA, USA, 2005. [Google Scholar]
- Choset, H.; Lynch, K.M.; Hutchinson, S.; Kantor, G.; Burgard, W.; Kavraki, L.E.; Thrun, S. Principles of Robot Motion; MIT Press: Cambridge, MA, USA, 2005; p. 625. [Google Scholar]
- Siegwart, R.; Nourbakhsh, I.R. Introduction to Autonomous Mobile Robots (Intelligent Robotics and Autonomous Agents); The MIT Press: Cambridge, MA, USA, 2004. [Google Scholar]
- Dudek, G.; Jenkin, M. Computational Principles of Mobile Robotics; Cambridge University Press: Cambridge, MA, USA, 2000. [Google Scholar]
- Selwyn, N.; Gorard, S. Students’ use of Wikipedia as an academic resource—Patterns of use and perceptions of usefulness. Internet High. Educ. 2016, 28, 28–34. [Google Scholar] [CrossRef] [Green Version]
- Lim, S. How and why do college students use Wikipedia? J. Am. Soc. Inf. Sci. Technol. 2009, 60, 2189–2202. [Google Scholar] [CrossRef]
- Carrell, S.E.; Kurlaender, M. My Professor Cares: Experimental Evidence on the Role of Faculty Engagement. Natl. Bur. Econ. Res. 2020. [Google Scholar] [CrossRef]
- Li, K.; Moore, D.R. Motivating Students in Massive Open Online Courses (MOOCs) Using the Attention, Relevance, Confidence, Satisfaction (ARCS) Model. J. Form. Des. Learn. 2018, 2, 102–113. [Google Scholar] [CrossRef]
- Osguthorpe, R.T.; Graham, C.R. Blended Learning Environments: Definitions and Directions. Q. Rev. Distance Educ. 2003, 4, 227. [Google Scholar]
- Curtis, J.; Bonk, C.R.G. The Handbook of Blended Learning: Global Perspectives, Local Designs; Wiley: Hoboken, NJ, USA, 2005. [Google Scholar]
Figure 1.
ANOVA box-plot statistics of grades by year for the Robotics lectures. There is a strong shift toward higher grades in the year with online teaching (2020) compared to the years with face-to-face teaching (2017–2019).
Figure 1.
ANOVA box-plot statistics of grades by year for the Robotics lectures. There is a strong shift toward higher grades in the year with online teaching (2020) compared to the years with face-to-face teaching (2017–2019).

Figure 2.
Histogram of the frequencies of exam grades by year for the Robotics lectures. Frequencies for each year are shown relative to the total number of students for that year.
Figure 2.
Histogram of the frequencies of exam grades by year for the Robotics lectures. Frequencies for each year are shown relative to the total number of students for that year.

Figure 3.
Distribution of responses to the statement “Online teaching was equally effective as in-person teaching” by CS and RIS students in the Jacobs SES.
Figure 3.
Distribution of responses to the statement “Online teaching was equally effective as in-person teaching” by CS and RIS students in the Jacobs SES.

Figure 4.
Distribution of responses to the statement “In the future, I would like to have (some) courses in an online format” by CS and RIS students in the Jacobs SES.
Figure 4.
Distribution of responses to the statement “In the future, I would like to have (some) courses in an online format” by CS and RIS students in the Jacobs SES.

Figure 5.
Most students of Jacobs University stayed on campus during the COVID-19 pandemic. This is also reflected in the self-reports on whether they spent time in a different time zone during the semester.
Figure 5.
Most students of Jacobs University stayed on campus during the COVID-19 pandemic. This is also reflected in the self-reports on whether they spent time in a different time zone during the semester.

Figure 6.
The multiple choice grid for Q-1.1 as an example for the way the questions related to different forms of instruction were polled. The grids for Q-1.2 and Q-1.3 are formed accordingly; the only difference is the core statement on top of the multiple choice grid.
Figure 6.
The multiple choice grid for Q-1.1 as an example for the way the questions related to different forms of instruction were polled. The grids for Q-1.2 and Q-1.3 are formed accordingly; the only difference is the core statement on top of the multiple choice grid.

Figure 7.
The asynchronous online course received high approval rates with respect to its suitability for aspects SQ-1.1 to SQ-1.4 (knowledge acquisition, comprehension, application to homework, exam preparation) in comparison to all three other possible forms of instruction covered in Q-1.1 to Q-1.3 (presence in class, synchronous with only stream, synchronous with recording).

Figure 8.
Histograms of the normalized usages of the different forms of study material as a stacked plot (top) and as a bar plot (bottom).
Figure 8.
Histograms of the normalized usages of the different forms of study material as a stacked plot (top) and as a bar plot (bottom).

Figure 9.
Histograms of the number of students with respect to their use of the videos versus PDFs covering the lectures, respectively homework solutions.
Figure 9.
Histograms of the number of students with respect to their use of the videos versus PDFs covering the lectures, respectively homework solutions.

Figure 10.
Histogram of the time brackets related to studying in a group, respectively in contact with other students (SQ-2.5).
Figure 10.
Histogram of the time brackets related to studying in a group, respectively in contact with other students (SQ-2.5).

Figure 11.
Distribution of the amount of study time using external material from the web (Wikipedia, YouTube, etc.).
Figure 11.
Distribution of the amount of study time using external material from the web (Wikipedia, YouTube, etc.).

Figure 12.
The distribution of reported Time Brackets (TB-3.1–TB-3.9) for the question Q-3 regarding the time schedule of studies. It can be noted that a substantial number of students studied the material for a substantial amount of time without a fixed schedule.
Figure 12.
The distribution of reported Time Brackets (TB-3.1–TB-3.9) for the question Q-3 regarding the time schedule of studies. It can be noted that a substantial number of students studied the material for a substantial amount of time without a fixed schedule.

Figure 13.
The distribution of the students’ perception of reminder emails.

Figure 14.
The students’ perception of the impact of COVID-19 with respect to study time and stress.
Figure 14.
The students’ perception of the impact of COVID-19 with respect to study time and stress.


Table 1.
Distribution of the majors of the 58 students in the spring 2020 course. RIS, Robotics and Intelligent Systems; CS, Computer Science; ECE, Electrical and Computer Engineering.
Table 1.
Distribution of the majors of the 58 students in the spring 2020 course. RIS, Robotics and Intelligent Systems; CS, Computer Science; ECE, Electrical and Computer Engineering.
| RIS | CS | ECE | Math | Physics | Total | |
|---|---|---|---|---|---|---|
| #students | 21 | 31 | 3 | 2 | 1 | 58 |
Table 2.
The number of slides and the duration (minutes) of the videos of the asynchronous online lecture part of the Spring 2020 robotics course at Jacobs University.
Table 2.
The number of slides and the duration (minutes) of the videos of the asynchronous online lecture part of the Spring 2020 robotics course at Jacobs University.
| Lecture Part | # of Slides | Video (min) |
|---|---|---|
| P1 Introduction | 27 | 41 |
| P2 Spatial Transforms | 70 | 96 |
| P3 Kinematics | 15 | 22 |
| P4 Actuators | 45 | 86 |
| P5 Inverse Kinematics | 64 | 68 |
| P6 Locomotion | 47 | 58 |
| P7 Localization | 63 | 91 |
| P8 Probabilistic Localization | 56 | 92 |
| P9 Mapping | 60 | 91 |
Table 3.
The number of slides and the duration (minutes) of the videos for the asynchronous online explanations and solutions of the homework exercises of the Spring 2020 robotics course at Jacobs University.
Table 3.
The number of slides and the duration (minutes) of the videos for the asynchronous online explanations and solutions of the homework exercises of the Spring 2020 robotics course at Jacobs University.
| Solution | # of Slides | Video (min) |
|---|---|---|
| HW-1 | 39 | 54 |
| HW-2 | 36 | 36 |
| HW-3 | 16 | 20 |
| HW-4 | 9 | 15 |
| HW-5 | 42 | 61 |
| HW-6 | 16 | 24 |
| HW-7 | 18 | 20 |
| HW-8 | 17 | 23 |
| HW-9 | 4 | 16 |
Table 4.
The responses to the questions Student Experience Survey (SES)-1 and SES-2 among RIS, CS, and all Jacobs students in the SESs.
Table 4.
The responses to the questions Student Experience Survey (SES)-1 and SES-2 among RIS, CS, and all Jacobs students in the SESs.
| SES-1: Which elements of online teaching were beneficial for your learning success? | |||
|---|---|---|---|
| Jacobs | CS | RIS | |
| 1: More flexible schedule | 57.9% | 52.1% | 58.8% |
| 2: Promotion of self-discipline and responsibility | 35.6% | 35.2% | 47.1% |
| 3: Distraction free learning environment | 18.2% | 26.8% | 29.4% |
| 4: No need to move physically to classrooms | 48.2% | 54.9% | 52.9% |
| 5: Better teacher-student communication via online platforms | 14.8% | 8.5% | 5.9% |
| 6: Better student-student communication via online platforms | 9.5% | 8.5% | 11.8% |
| 7: Better structured courses | 9.2% | 12.7% | 11.8% |
| 8: Better structured/available learning materials | 19.1% | 18.3% | 17.6% |
| 9: None of these were beneficial | 13.6% | 12.7% | 11.8% |
| SES-2: Which elements of online teaching were detrimental for your learning success? | |||
| Jacobs | CS | RIS | |
| 1: Stronger need to self-organize | 36.5% | 45.1% | 41.2% |
| 2: Lack of routine hampers productivity | 42.1% | 40.8% | 41.2% |
| 3: Distracting (private) learning environment | 39.9% | 35.2% | 47.1% |
| 4: Difficult to keep focused in online meetings | 54.3% | 50.7% | 58.8% |
| 5: Worse teacher-student communication via online platforms | 36.3% | 45.1% | 58.8% |
| 6: Worse student-student communication via online platforms | 25.9% | 28.2% | 17.6% |
| 7: Worse structured courses | 26.90% | 36.6% | 11.8% |
| 8: Worse structured/available learning materials | 17.0% | 25.4% | 5.9% |
| 9: Lack of direct social interaction with other students | 47.90% | 39.4% | 52.9% |
| 10: Lack of direct social interaction with instructors | 49.60% | 40.8% | 35.3% |
| 11: None of these were detrimental | 7.0% | 8.5% | 0.0% |
Table 5.
Mean () and standard deviation () of the responses on the Likert scale related to the different forms of instruction, i.e., for the statement combinations Q-1.X with Sub-statement SQ-1.Y.
Table 5.
Mean () and standard deviation () of the responses on the Likert scale related to the different forms of instruction, i.e., for the statement combinations Q-1.X with Sub-statement SQ-1.Y.
| SQ-1.1 | SQ-1.2 | SQ-1.3 | SQ-1.4 | |
|---|---|---|---|---|
| Knowledge Acquisition | Comprehension | HW-Application | Exam Preparation | |
| Q-1.1 (presence) | 2.07 ( = 1.129) | 2.05 ( = 1.099) | 2.12 ( = 1.145) | 2.26 ( = 1.102) |
| Q-1.2 (stream) | 2.37 ( = 0.916) | 2.37 ( = 0.890) | 2.44 ( = 0.948) | 2.40 ( = 0.992) |
| Q-1.3 (recorded) | 1.98 ( = 1.131) | 1.95 ( = 1.099) | 2.09 ( = 1.235) | 1.95 ( = 1.430) |
Table 6.
Mean () and standard deviation () for the normalized time spent on the different forms of study material.
Table 6.
Mean () and standard deviation () for the normalized time spent on the different forms of study material.
| Mean () | Std dev () | |
|---|---|---|
| SQ-2.1: lecture slides | 18.13% | 0.085 |
| SQ-2.2: lecture videos | 23.16% | 0.075 |
| SQ-2.3: homework slides | 21.05% | 0.130 |
| SQ-2.4: homework videos | 27.32% | 0.116 |
| SQ-2.5: study group | 7.18% | 0.072 |
| SQ-2.6: course forum | 0.03% | 0.002 |
| SQ-2.7: textbook(s) | 0.14% | 0.007 |
| SQ-2.8: WWW | 2.97% | 0.035 |
Table 7.
Percentages of students with respect to their use of the videos versus PDFs covering the lectures, respectively homework solutions.
Table 7.
Percentages of students with respect to their use of the videos versus PDFs covering the lectures, respectively homework solutions.
| More Video | Same Usage | More PDF | |
|---|---|---|---|
| lecture | 35% | 53% | 12% |
| homework | 33% | 53% | 14% |
Publisher’s Note: MDPI stays neutral with regard to jurisdictional claims in published maps and institutional affiliations. |
© 2020 by the authors. Licensee MDPI, Basel, Switzerland. This article is an open access article distributed under the terms and conditions of the Creative Commons Attribution (CC BY) license (http://creativecommons.org/licenses/by/4.0/).
Share and Cite
MDPI and ACS Style
Birk, A.; Dineva, E.; Maurelli, F.; Nabor, A. A Robotics Course during COVID-19: Lessons Learned and Best Practices for Online Teaching beyond the Pandemic. Robotics 2021, 10, 5. https://doi.org/10.3390/robotics10010005
AMA Style
Birk A, Dineva E, Maurelli F, Nabor A. A Robotics Course during COVID-19: Lessons Learned and Best Practices for Online Teaching beyond the Pandemic. Robotics. 2021; 10(1):5. https://doi.org/10.3390/robotics10010005
Chicago/Turabian StyleBirk, Andreas, Evelina Dineva, Francesco Maurelli, and Andreas Nabor. 2021. "A Robotics Course during COVID-19: Lessons Learned and Best Practices for Online Teaching beyond the Pandemic" Robotics 10, no. 1: 5. https://doi.org/10.3390/robotics10010005
Note that from the first issue of 2016, this journal uses article numbers instead of page numbers. See further details here.