Article

Comparative Analysis of Responses of Land Surface Temperature to Long-Term Land Use/Cover Changes between a Coastal and Inland City: A Case of Freetown and Bo Town in Sierra Leone

1
School of Resources and Environment, University of Electronic Science and Technology of China, Chengdu 611731, China
2
School of Inoformation Science and Engineering, Hebei University of Science and Technology, Shijiazhuang 050000, China
3
Department of Physics, University of Zimbabwe, P.O. Box MP197, Mount Pleasant, Harare 263, Zimbabwe
4
Discipline of Geography, School of Agricultural, Earth and Environmental Sciences, University of KwaZulu-Natal, P/Bag X01, Scottsville, Pietermaritzburg 3209, South Africa
*
Authors to whom correspondence should be addressed.
Remote Sens. 2018, 10(1), 112; https://doi.org/10.3390/rs10010112
Submission received: 24 November 2017 / Revised: 9 January 2018 / Accepted: 12 January 2018 / Published: 15 January 2018
(This article belongs to the Special Issue Learning to Understand Remote Sensing Images)

Abstract

:
Urban growth and its associated expansion of built-up areas are expected to continue through to the twenty second century and at a faster pace in developing countries. This has the potential to increase thermal discomfort and heat-related distress. There is thus a need to monitor growth patterns, especially in resource constrained countries such as Africa, where few studies have so far been conducted. In view of this, this study compares urban growth and temperature response patterns in Freetown and Bo town in Sierra Leone. Multispectral Landsat images obtained in 1998, 2000, 2007, and 2015 are used to quantify growth and land surface temperature responses. The contribution index (CI) is used to explain how changes per land use and land cover class (LULC) contributed to average city surface temperatures. The population size of Freetown was about eight times greater than in Bo town. Landsat data mapped urban growth patterns with a high accuracy (Overall Accuracy > 80%) for both cities. Significant changes in LULC were noted in Freetown, characterized by a 114 km2 decrease in agriculture area, 23 km2 increase in dense vegetation, and 77 km2 increase in built-up area. Between 1998 and 2015, built-up area increased by 16 km2, while dense vegetation area decreased by 14 km2 in Bo town. Average surface temperature increased from 23.7 to 25.5 °C in Freetown and from 24.9 to 28.2 °C in Bo town during the same period. Despite the larger population size and greater built-up extent, as well as expansion rate, Freetown was 2 °C cooler than Bo town in all periods. The low temperatures are attributed to proximity to sea and the very large proportion of vegetation surrounding the city. Even close to the sea and abundant vegetation, the built-up area had an elevated temperature compared to the surroundings. The findings are important for formulating heat mitigation strategies for both inland and coastal cities in developing countries.

Graphical Abstract

1. Introduction

There has been an increase in the number of urban dwellers, together with an accompanying expansion of built-up area globally [1]. Urban areas are strategic areas economically, as well as from an administrative perspective. They are important for issues such as the improvement of education and health delivery of a nation. Despite their socio-economic importance, urban areas and characteristic complex land use and land cover (LULC) spatial structure also pose a variety of environmental changes [2,3,4,5]. According to Acharya et al. [5], the benefits of urban growth in developing countries include opportunities for employment, specialization, and the better production of goods and services. The challenges, however, include air pollution and water pollution in industrialized areas, while flash flooding is prevalent in highly impervious areas. Another notable challenge of urban development is temperature elevation, especially in densely built-up areas [6,7]. Studies have shown that urban areas are comparatively warmer than undisturbed surroundings such as rural areas; a phenomenon called Urban Heat Island (UHI) [8,9,10,11,12]. According to Gusso et al. [8], cities use construction materials such as concrete and asphalt, which do not allow water to penetrate and absorb a large amount of heat, thereby increasing urban temperatures. Elevated temperature results in increased outdoor and indoor human thermal discomfort, as well as increased heat-related health risk [13,14,15,16]. Urban heat islands have maximized the number of heat wave days and tropical-like night conditions in several main cities, including Paris, Baltimore, Washington D.C., and Shanghai, during the summer [17,18,19]. Furthermore, the Intergovernmental Panel on Climate Change (IPCC) [20] stressed that land cover changes have the potential to raise air temperatures of urbanized areas by 4 °C by 2100. The changes and associated adverse impacts seriously threaten the sustainable development of urban areas [21]. Urban land use and land cover heterogeneity, as well as changes, result in the complex and varied spatial structure of heat intensities which also vary from city to city. It is thus important to establish city specific land surface temperature patterns in order to derive relevant mitigation and response strategies.
Remote sensing offers a variety of options for monitoring both LULC and LST spatial structure. Unfortunately, space-borne sensors detect thermal infra-red at either a low (e.g., above 500 m such as METEOSAT) or medium (e.g., 30–500 m such Landsat, ASTER and MODIS), but not high, spatial resolution (e.g., below 30 m such as SPOT). This results in mismatch in the resolution between retrieved LULC and LST maps. High resolution thermal data is often obtained from air-borne missions. Generally, high spatial resolution datasets are expensive to gather, have a low temporal resolution, usually lack a thermal infra-red component, and have very limited historical archives not sufficient for long term analysis [22]. Medium resolution multi-spectral datasets are often reliable for urban LULC and LST analysis. For example, Landsat has large stores of visible, infra-red, and thermal data archives spanning from as early as 1972 to present [6,22]. Recently, studies showed that Landsat data are effective and very accurate in mapping urban LULC distribution, as well as changes thereof [22,23,24,25]. For example, using Landsat data, Mushore et al. [9] retrieved LULC spatial and temporal patterns in Harare between 1984 and 2015 at overall accuracies greater than 80%. Studies have also proved the effectiveness of Landsat thermal data in mapping land surface temperature variations, including those in complex urban settings [26,27,28]. Recently, multi-temporal Landsat data was used to develop a model to predict future urban surface temperatures in Harare [29]. Mushore et al. [29], showed that if historical growth patterns will persist, land surface temperatures will increase by as much as 5 °C by 2045. Therefore, the utility of medium resolution datasets in quantifying the impact of urban growth on LST patterns needs to be continually exploited. This is necessary in cities of low Gross Domestic Product countries such as in Africa, especially where similar studies have not yet been done; for example, in Sierra Leone.
In Africa, the studies have been confined to a few cities mainly in South Africa, Zimbabwe, and Nigeria. For example, Odindi et al. [7] investigated the impact of seasonality of urban greenery on heat island patterns in the Ethkwini municipality in South Africa. However, although they used 30 m multispectral Landsat 7 data for LULC mapping, surface temperatures were retrieved from course resolution (1 km) MODIS thermal data. Other studies in Africa were also confined to a single city; for example, Mushore et al. [9] only focused on Harare in Zimbabwe, while in West Africa, Abegunde and Adedeji [30] focused on Ibadan in Nigeria. Given the projected urban growth which must be faster in developing countries, there is thus a need to understand the implications in other parts of Africa [19]. While Odindi et al. [31] compared LST patterns in coastal cities of South Africa, there is a general paucity of literature on comparing LST patterns between two cities of an African country. Precisely, there is a lack of literature comparing LST patterns of two cities, especially with one being inland and the other being coastal, such as Freetown and Bo town in Sierra Leone. As such, there is the need for a novel study to understand urban growth patterns, as well as responses of LST, in Sierra Leone, in West Africa. Such analysis is important for understanding both the differential effect of urban growth and of global warming between a coastal and an inland city in West Africa. Adaptation and mitigation strategies derived from such an analysis will take into account the position of a city relative to the ocean. Furthermore, the Contribution Index (CI) has not yet been used to compare growth patterns of two cities, as well as to explain the impacts of growth on surface temperatures in West Africa. To the best of our knowledge, the index has only been successfully tested on the African continent in South Africa [7,23,31] and in Zimbabwe [9]. Odindi et al. [31] used CI to compare LULC and LST patterns between coastal cities of South Africa, but did not compare a coastal city with an inland city. Although Odindi et al. [31] compared LST variations in two cities; they used course resolution MODIS data, leaving a gap on comparison analysis using Landsat data in Africa. Liu and Weng [32] also found the 30 m visible and infrared, as well as the 90 to 120 m resolution thermal infra-red, Landsat data to be optimal in the analysis of the relationship between LULC and LST patterns.
The objectives of this study are thus to (1) use remote sensing to determine urban growth patterns in Sierra Leone; (2) quantify the effect of urban growth on spatial and temporal LST patterns in two major cities of Sierra Leone using the CI; and (3) understand the differences in responses of LST to urban growth and global warming between a coastal city (Freetown) and an inland city (Bo town) in Sierra Leone. The study hypothesizes that urban growth patterns should differ between Freetown and Bo town and thus influence LST spatial and temporal changes to differ between the two cities.

2. Materials and Methods

2.1. Study Area

The study was conducted in the two major cities of Sierra Lone; Freetown and Bo town (Figure 1). Freetown is the major port city on the Atlantic Ocean and is located in the western area of Sierra Leone. Bo town is the second largest city in Sierra Leone (after Freetown) and the biggest city in the Southern Province. Bo town serves as the capital and administrative focus of Bo District in the Southern Province. Freetown has a total area of 357 km2 and a population of 772,873, constituting 15.53% of the total Sierra Leonean population [33]. From the projected population of local administrative data from 2005 to 2014 (http://statistics.sl), out of 6,348,350 populations in Sierra Leone, 27.14% lives in urban areas, with 16.4% living in Freetown and 4% living in Bo [33]. In Sierra Leone, the national census should be done once every 10 years. To date, five censuses have been conducted in 1963, 1974, 1985, 2004, and 2015. Another census was supposed to be done between 1994 and 1995, but was postponed due to the civil war which commenced in 1991 in the country. In order to ascertain that the population was growing in the study area, we used all the available data from the five censuses, although focus was on the period between 1998 and 2015. Census statistics are obtainable from Statistics Sierra Leone at national, town, and chiefdom levels. Therefore, population statistics for Freetown and Bo town were obtained at the town level.
Climate summaries were obtained from the Sierra Leone Meteorological Department under the Ministry of Transport and Aviation (http://mta.sl/meteorological-department). Freetown and Bo town experience a tropical climate, with a rainy season from May to October and a hot dry season from November to April. Freetown has an average annual precipitation of more than 3500 mm. It receives the highest amount of rainfall in the country due to its proximity to the Peninsula Mountains and Atlantic Ocean. The average annual precipitation of Bo town is around 2616.6 mm. The annual average minimum temperature for Freetown is around 23.8 °C, while the average maximum temperature is 29.9 °C. The annual mean minimum temperature for Bo town is 21.2 °C and the average maximum temperature is 31.3 °C.
The topography of Freetown is undulated. Elevation ranges between 100 m and 700 m, with slopes exceeding 50 m and Bo town is 104 m above sea level. The prevailing winds are the south west monsoon during the wet season and the northeastern harmattan, which is a dust laden wind from the Sahara Desert, during the dry season. In this research, we have taken the most developed parts of Bo town (10,808.57 ha or 108.08 km2) and the most developed parts of Freetown (51,896.79 ha or 518.97 km2), as illustrated in Figure 1. The red bordered area of Freetown and Bo town (study areas) are the rapidly developing areas. The period between November and April was selected for temperature analysis because it is hot and dry, hence posing a threat to human thermal comfort.

2.2. Datasets

This study uses cloud free and geometrically corrected Landsat imagery from the Earth Resources Observation and Science (EROS) center through the United States Geological Survey (USGS) Global Visualization Viewer. The path/row was 202/54 for Freetown and 201/054 for Bo town. The image scenes dated to 27 February 1998 (TM5), 3 February 2000 (ETM), and 23 February 2007 and 28 January 2015 (OLI) for Bo town, and 28 February 1998 (TM5), 3 February 2000 (ETM), 27 February 2007 (ETM), and 4 February 2015 for Freetown. Apart from satellite imagery, several referenced datasets like ground GPS data of different LULC categories, Population census data from the Statistics Sierra Leone, and mean temperature and mean humidity from the Sierra Leone metrological Department were used. High resolution contemporary satellite imagery (GEOEYE-1 and Google Earth historical image of 2015), administrative spatial datasets from the National Tourist Board and Environmental Protection Agency, and ancillary secondary maps were also used as ground truth data for accuracy assessment.

2.3. Image Preprocessing

The remote sensing images are re-projected to the UTM WGS 84 N (UTM zone 29-North) following a third order polynomial fit and nearest neighbor resampling techniques. Digital numbers (DN) of TM5, ETM+, and OLI images are stored as 8 bit and 16 bit, respectively [34,35,36]. These DNs of each image are converted to the top of atmospheric (TOA) spectral radiance using sensor specific calibration parameters directly obtained from the image MTL (metadata) file following the standard spectral radiance (Equation (1)).
L =   ( A ρ 1 ρ e S ) + ( B ρ e 1 ρ e S ) + L a
where, ρ is the pixel surface reflectance, ρe is an average surface reflectance for the pixel and a surrounding region, S is the spherical albedo of the atmosphere, La is the radiance back scattered by the atmosphere, A and B are coefficients that depend on atmospheric and geometric conditions but not on the surface, and L is the spectral radiance.
The radiance of the reflective bands is then converted to a band interleaved by line (BIL) format to make them efficient for the atmospheric correction process in order to reduce atmospheric effects like water content, dust particles, aerosols, cloud, and varying sun angles, etc., which could significantly influence optical images and thereby degrade their spectral information. Hence, these are subjected to an atmospheric correction process to be applied to minimize those effects and produce corrected surface reflectance. The Fast Line-of-sight Atmospheric Analysis of Hypercube (FLAASH) is applied for the atmospheric correction process [37]. FLAASH is a first principle of atmospheric correction tool which generally corrects wavelengths of visible, near-infrared, and shortwave infrared data. It uses the MODTRAN radiation transfer code [38] for retrieving atmospheric noises like aerosols, dusts, and water vapor content, etc., from dark land pixels in the scene based on a nearly fixed ratio between reflectance from pixels at 660 nm and 2100 nm [39]. The overall FLAASH method takes input from the radiance and provides an atmospherically corrected surface reflectance image output using Equation (2).
L e   ( ( A + B ) ρ e 1 ρ e S ) + L a

2.4. Urban Growth Assessment Using Remote Sensing and Census Data in Freetown and Bo Town

Land use and land cover (LULC) maps for 1998, 2000, 2007, and 2015 were obtained using supervised image classification of multispectral Landsat data described in Section 2.2 above. Supervised image classification involves the use of ground control points obtained from field surveys or high resolution imagery to assist remote sensing software to assign LULC classes to pixels based on multi-spectral images. In each classification procedure, thermal data were left out since the objective was then to link LULC dynamics with LST derived from these data. The Support Vector Machine (SVM) algorithm was used because it was found to perform better than other common classifiers such as ANN, maximum likelihood, and Mahalanobis distance [22,40,41]. SVM also comparatively requires very little training data. In each year, the ground truth LULC data collected from field work and auxiliary data were split into 70% (for classification) and 30% (for accuracy assessment) following the recommendation of Adelabu et al. [40]. The area is classified into built-up, dense vegetation, sparse vegetation, water/wetlands, and agriculture land. A post classification change detection approach was used to determine the effect of growth on the spatial distribution and areal coverage of LULC types. According to Yu et al. [42], post classification is the most widely used change detection method. Due to simplicity and ease of interpretation, in this study, we detect changes in area per class, as was done by Salvati and Sabbi [43].
In order to link remotely sensed spatial and temporal patterns in LULC with population growth, census data for 1963, 1974, 1985, 2004, and 2015 were used. Although the study focuses on the time interval from 1998 to 2015, the analysis of population dynamics includes time as far back as 1963 in order to take advantage of data availability, as well as to obtain a clearly convincing description of the population trends in the area.

2.5. LST Retrieval from Thermal Infrared Data

The steps as summarised by Weng et al. [26] and described in detail by Weng et al. [44] are followed to retrieve the land surface temperature from Landsat’s thermal infrared data. The procedure involved (i) conversion of digital numbers (DN) to spectral radiance; (ii) computation of satellite brightness temperature from spectral radiance; and (iii) retrieval of land surface temperature from brightness temperature (emissivity correction). Full details of the steps are described in the Section 2.5.1 and Section 2.5.2 below.

2.5.1. Conversion from Digital Numbers to Brightness Temperature

The DNs of the TIR bands of each year’s ETM+ and TM5 images are converted to spectral radiance using the formula adopted by Chander and Markham [45] (Equation (3)) and Landsat 8’s thermal infrared images were converted using the USGS standard (Equation (4)).
L λ =   L m i n + L m a x L m i n Q C A L m a x Q C A L m i n D N
L λ = M L × Q cal + A L
In the above equations, Lλ is the spectral radiance in W/(m2 srμm) received by the sensor from each pixel of the image. ML and AL are band specific multiplicative and additive rescaling factors obtained from the image MTL file, Qcal is the DN of each image, and QCALmax is the maximum DN (65535 for the 16-bit Landsat 8 and 255 for other Landsat missions). Lmax and Lmin are the maximum and minimum top of atmospheric (TOA) radiances in W/(m2 srμm), respectively.
After the conversion of the DNs to the spectral radiance, the radiant images are converted to the blackbody temperature using (Equation (5)).
T b = K 2 ln { ( K 1 L λ ) + 1 }    
where Tb is the effective at-sensor brightness temperature in Kelvin unit, Lλ is the spectral radiance in W/(m 2 srμm), and K1 and K2 are prelaunch calibration constants in Kelvin unit obtained from the image MTL file.

2.5.2. Surface Emissivity ( ε ) Retrieval

The land surface emissivity is retrieved using the Normalized Difference Vegetation Index (NDVI) threshold method [45,46]. According to the method, when NDVI < 0.2, the pixels are considered as bare lands and the emissivity is retrieved from the red spectral region. When NDVI > 0.5, the pixels are considered as fully vegetation coverage and the emissivity value is assumed to be 0.99. When NDVI ranges between 0.2 and 0.5, the pixels are considered as a mixture use of soil and vegetation. In this case, emissivity is retrieved using Equation (6), as follows:
ε = ε v P v + ε s ( 1 P v ) + Δ ε
where ε v is the emissivity of vegetation coverage, ε s is the emissivity of soil surface, and, P v is the proportion of vegetation calculated from Equation (7),
P v = [ N D V I     N D V I s N D V I v     N D V I s   ]   2
where N D V I s is the NDVI value of pure soil and N D V I v   is the NDVI value of pure vegetation extracted from the NDVI image.
In Equation (6), the term Δ ε is the indication of the geometrical distribution of the natural surface, as well as the internal reflection whose value is considered as negligible for the plain and homogenous surfaces. However, in the case of a rough and heterogeneous surface, the value is assumed to be 2% Sobrino et al. [46] and is expressed by the following (Equation (8)):
Δ ε = ( 1 ε s ) ( 1 P v ) F ε v
where F is the shape factor whose mean value for different geometrical distributions is assumed to be 0.55 [45,46].
By summarizing Equations (6) and (8), the final equation for emissivity estimation is obtained by Equation (9), as follows:
ε = m P v + n
where m and n coefficients are calculated as:
m =   ε v ε s ( 1 ε s ) F ε v and n =   ε s + ( 1 ε s ) F ε v
Brightness temperatures assume that the earth is a blackbody, which it is not, and this can result in errors in surface temperature. In order to minimize these errors, emissivity correction is necessary and this is done to finally obtain the land surface temperature (LST) from Tb using Equation (11) [44].
L S T = T b 1   +   { λ T b ( K ρ )   ×   ln ε }
In the above equation, λ is the wavelength of emitted radiance (11.5 μm) [47,48], ρ = hc/σ (mK), K is the Stefan–Boltzmann’s constant (1.38 × 10⁻²³ JK−1), h is the Planck’s constant (6.26 × 10⁻³⁴ Js), c is the velocity of light (2.998 × 10⁸ ms−1), and ε is the surface emissivity.

2.6. Linking Urban Growth to LST

The effect of LULC in the warming or cooling of an area depends on the LULC type and the proportion of the total area occupied by each type. For example, vegetation cover and water/wetlands have a surface cooling effect due to latent heat transfer. However, even though they have a cooling effect, the overall value depends on the proportion of the total area they occupy [49]. The warming or cooling extent of an LULC type taking into account the proportion of the total area it occupies is quantified using the Contribution Index (CI). The CI is used to link spatial structure, as well as long term changes in LULC, to LST intensities. The CI for each LULC type is computed for both cities using Equation (12) for all the periods mentioned in Section 2.2 [7,31,48].
C I = D t × S
D t is the difference between the average temperature of the entire study area and the average of the LULC class type. Variable S is the proportional area of the LULC type, which is the ratio of the area covered by the class to the total area of the study area. Positive values of CI indicate how much the LULC type contributes to raising the surface temperatures of an area, while negative values indicate a heat mitigation value.

3. Results

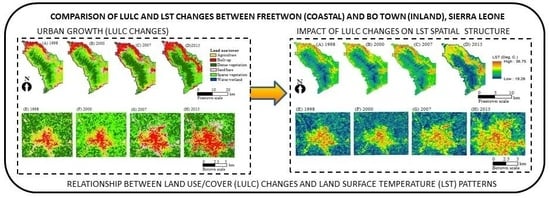
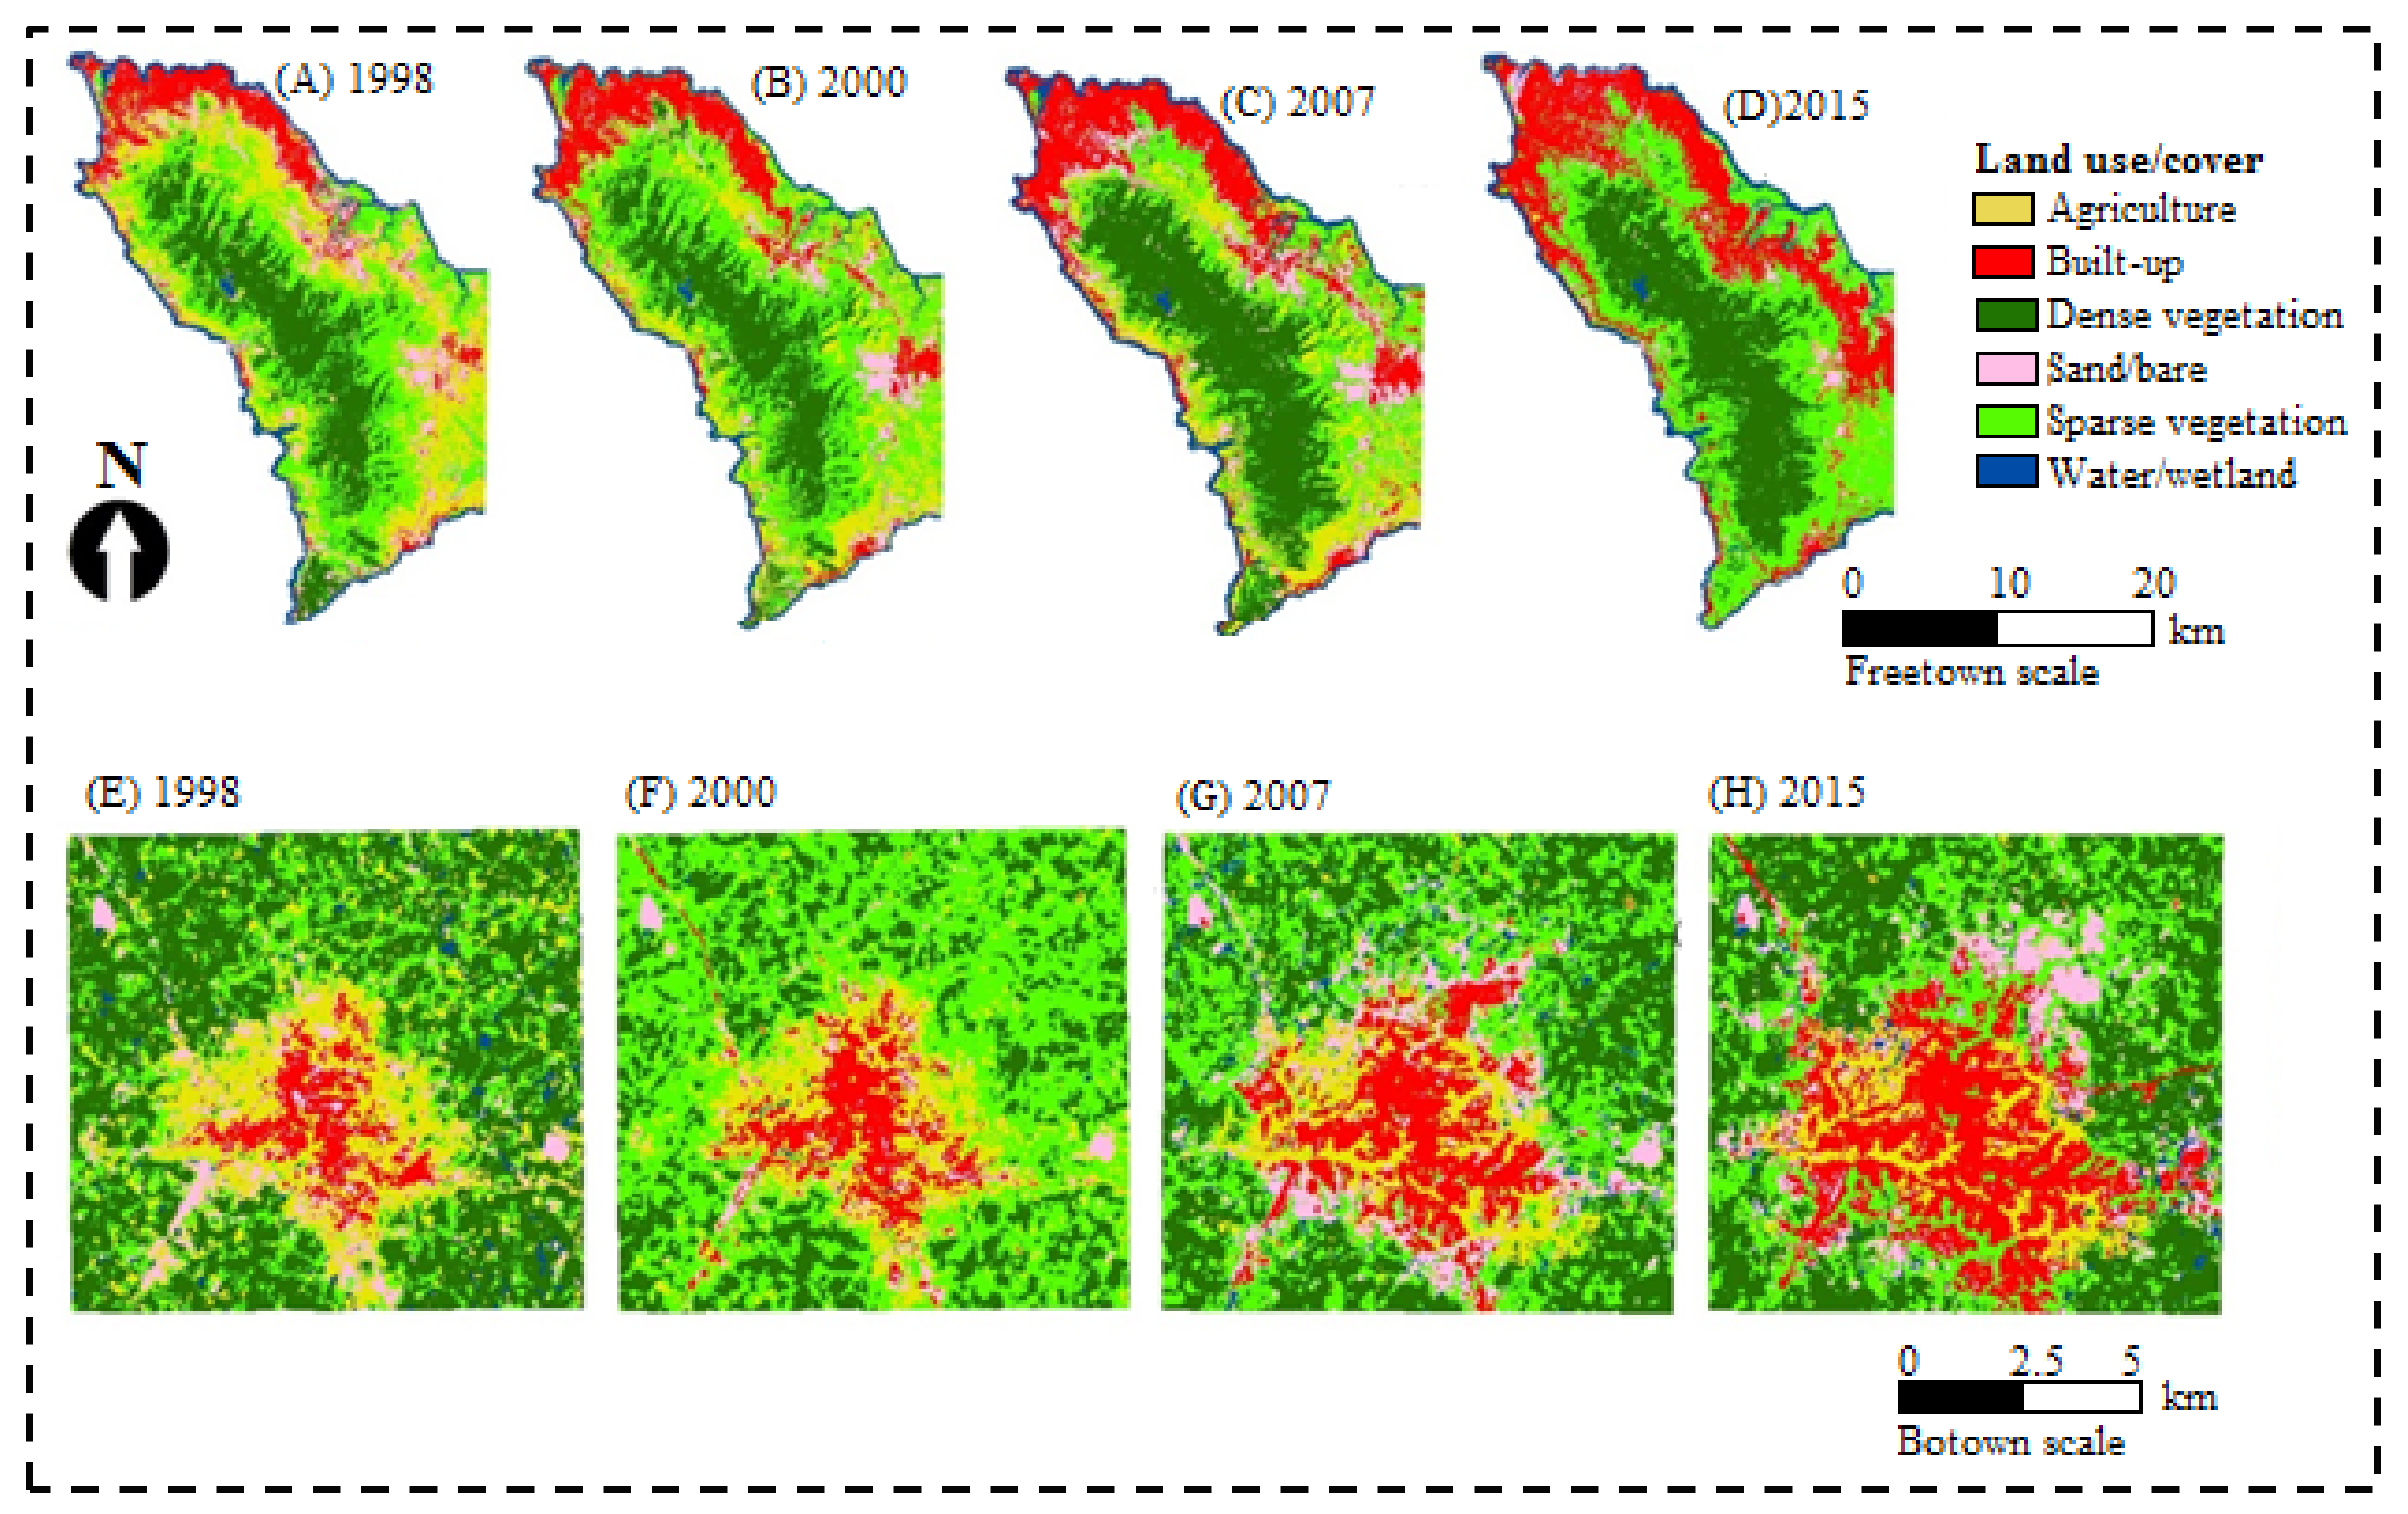
3.1. Remote Sensing Based Urban Growth Assessment in Freetown and Bo Town

Visual inspection of Figure 2A–D indicates the expansion of built-up area in Freetown. This is notable in the northern, eastern, and western parts of the city. Since 1998, the city has been characterized by a tongue of dense vegetation occupying most of the central part of the city. This dense vegetation area is not diminishing, even as built-up area is expanding. The growth of Freetown concentrated along the northwestern and eastern margins is influenced by the ocean (Figure 2A–D). On the other hand, the growth of Bo town since 1998 has been largely characterized by expansion from the central to the southwestern areas of the city (Figure 2E–H). The growth of Bo town also infiltrated into densely vegetated areas between 1998 and 2015.
Table 1 indicates the overall accuracy (OA) and kappa coefficient (k) obtained in LULC classification for different years in Freetown and Bo town. The overall accuracies were greater than 85% for both cities in all years. Accuracies per individual LULC class (i.e., user accuracy (UA) and producer accuracy (PA)) are shown in Appendix A.
Between 1985 and 2015, the agriculture area has decreased by about 84 km2, while the built-up area increased by almost 80 km2 in Freetown (Figure 3). Dense vegetation areas increased by 22 km2, while sparse vegetation areas increased by 40 km2. The increase in vegetation areas could be part of an explanation of why bare areas reduced in area by 28 km2. A difference was observed in Freetown because, here, growth occurs along the coast away from the central zone of dense vegetation. Land use and land cover changes in Bo town were not as marked as in Freetown. For example, built-up areas increased by 15 km2, while areas with sparse vegetation increased by 7 km2 in Bo town. During the same period, the dense vegetation and agriculture areas decreased by 14 km2 and 10 km2, respectively.

3.2. Census Based Urban Growth Patterns in Freetown and Bo town

The population increased by almost ten times in both Freetown and Bo town between 1963 and 2015 (Table 2). Population densities also changed from 246.5 to 2023.8 (people/km2) and from 246.2 to 1609.0 (people/km2) in Freetown and Bo town, respectively. The population size of Freetown has always far exceeded that of Bo town, such that in 2015, the sizes were 1,050,301 and 173,905, respectively.

3.3. Responses of LST to Growth Patterns in Freetown and Bo Town

High surface temperatures (above 30 °C) are most notable in the northern and western parts of Freetown in 1998 (Figure 4A). Over the years, high surface temperatures have also been spreading southward along the western margin of the city (Figure 4B–D). Low surface temperatures below 22 °C have remained characteristic of the central and southwestern parts of the city. On the contrary, since 1998, the high surface temperature has spread from the central parts of the city of Bo town, especially towards the southwest (Figure 4E–H). Low temperature areas (below 20 °C) surround this expanding hot spot and are shrinking in size. The shape of high surface temperature areas in both Freetown and Bo town closely mimics that of the built-up area, indicating their strong warming influence. Conversely, low surface temperature patterns also track areas with vegetation cover, being low in dense vegetation areas in both cities. In both cities, average temperatures are rising with time (Table 3).

3.4. Link between Long Term Changes in LULC and LST Dynamics

The agriculture area has a positive contribution index (CI) in Freetown, indicating that such places increase heat in the city during the dry season (Table 3). Although the area under agriculture has reduced between 1998 and 2015, the CI has remained positive and increased. The cooling contribution of dense vegetation is increased as indicated by a CI of −0.47 in 1998 followed by −0.85 in 2015. Sparse vegetation also has a significant cooling effect in Freetown, although its value has decreased slightly between 1998 (CI = −0.34) and 2015 (CI = −0.24). The heat mitigation value of vegetation was also noted in Texas, where woodlands were 1.5–3.9 °C cooler than neighboring areas. The cooling effect of dense vegetation was more than that of sparse vegetation indicated for an example by a CI of −0.67 compared to −0.13 in Freetown in 2015 for dense and sparse greenery, respectively. The built- up area in Freetown increased in terms of the warming effect by almost three times, as indicated by the CI of 0.26 in 1998 and 0.72 in 2015.
In Bo town, the surface cooling effect of dense vegetation is increasing significantly (CI = −0.55 in 2000 and −0.85 in 2015). At the same time, bare areas and areas with sparse vegetation are decreasing in terms of their warming and cooling effect, respectively (Table 4). The hot spot area expanding from the centre of the city, mainly to the southeast, can thus be explained by the increasing warming effect of the built-up area between 1998 (CI = 0.26) and 2015 (CI = 0.41). Although water bodies have a cooling effect, their contribution has remained minimal over the years due to the low proportion of the cities they occupy. In both cities, the CI for water has remained less than −0.2 in all the years.
Urban growth patterns in Freetown are unique, in that they are characterized by the expansion of built-up and dense vegetation areas. Although Freetown is larger in size and growing faster, it was about 2 °C cooler than Bo town in all periods.

4. Discussion

The study obtained a high classification accuracy both in a coastal city (Freetown) and an inland city (Bo town). The overall classification accuracy reached the 85% recommendation by Anderson [49], because even at a 30 m resolution of Landsat optical data, the mixed pixel problem did not significantly affect the quality of the LULC maps produced. Despite the complexity of classification in urban areas due to surface heterogeneity, the mapping accuracies are also higher than the 80% overall accuracy recommended by Omran [50]. The high level of accuracy can be justified by Voogt and Oke [51], who noticed that improvements that have occurred in satellite sensors over the years provide detailed and accurate land surface representation at a low cost. The high classification accuracy could also be attributed to the renowned performance of the Support Vector Machine algorithm [22,40,41]. According to Jia et al. [41], the Support Vector Machine (SVM) algorithm was found to outperform other common classifiers such as ANN, maximum likelihood, and Mahalanobis distance. The algorithm was also used for multi-temporal Landsat-based classification in an urban setting in Harare, where overall accuracies above 80% were also obtained. These findings show the value of freely available medium resolution space-borne remotely sensed datasets for monitoring urban extent and growth, especially in resource-constrained nations.
The population increased by almost ten-fold in both Freetown and Bo town between 1963 and 2015, while the population densities also increased. In all the periods considered, the population size of Freetown has always far exceeded that of Bo town. Most of the economic and administrative activities of Sierra Leone are concentrated in Freetown, hence the larger population size and faster growth than Bo town. Furthermore, the beauty of the sea seems to make residents prefer to concentrate along the coastal margins of Freetown than to spread further inland towards the dense vegetation area. Besides increasing population sizes, built-up areas are also expanding in both cities. Growth patterns observed in both cities agree with earlier observations and predictions that urban population is growing, globally [19,52]. Expansion of the built-up area in Freetown has been mainly concentrated along the coast and is most notable in the northern, eastern, and western parts of the city. This growth along the northern margins of Freetown explains why the dense vegetation area in the central part of the city is not diminishing even as the built-up area is expanding. A different pattern is observed in Bo town, where the built-up area is expanding from central locations outwards. Unlike in Freetown, the growth of Bo town has led to a reduction in the area of the densely vegetated LULC category between 1985 and 2015. As observed in Bo town, in most studies, the proportion of total area occupied by dense vegetation decreases with continuous urban expansion [26,27,53,54]. Kamusoko et al. [54] observed that the expansion of built-up areas in Harare Zimbabwe pushed most dense vegetation locations outwards to the peripheries of the city.
As expected, temperature responded strongly to spatiotemporal dynamics of LULC in both Freetown and Bo town. High temperatures in both cities were observed in built-up areas and their extent increased with time as the cities were expanding. The influence of buildings explains why high surface temperatures (above 30 °C) were recorded in northern and eastern parts of Freetown. Over the years, surface temperatures in this regime have also been spreading southward along the western margin of the city following the expansion of the built-up area. The shape of high surface temperature areas in both Freetown and Bo town closely mimics that of the built-up area, indicating their strong warming influence. This concurs with Sha and Ghauri [28], who observed that surface urban heat island expands with expansion in a built-up area. Buildings reduce heat removal by advection and reduce the sky view factor, thus limiting heat escape to space, while walls and pavements absorb and emit heat [28,53,55,56]. This results in large amounts of stagnant heat and high temperatures, especially in closely packed and high rise buildings. The warming in both cities could also be explained by increased anthropogenic activities supported by an increasing population size in both cities over time, which increases long wave radiation in the lower atmosphere. Nayak and Mandal [3] and Grimmond [57] also attributed urban warming to both LULC changes and other anthropogenic effects such as greenhouse gas emissions. The rising temperature in response to the growth of both cities can be captured by the explanation that, as population grows, urbanization increases and the magnitude of the urban heat island also expands [58]. Similar findings were obtained in Australia between 1951 and 2003, where land cover changes produced statistically significant warming [59].
Vegetation cover has been indicated to be a strong mitigation measure against the elevation of surface temperatures in both cities. For example, in Freetown, low surface temperatures (below 22 °C) remained characteristic of the central and southwestern parts of the city where buildings have not yet replaced vegetation cover. Similarly, low temperature areas (below 20 °C) surround an expanding hot spot in the central parts of the city of Bo town. The heat mitigation value of vegetation was also captured by a strong negative Contribution Index (between −0.5 and −1) in areas with dense and sparse vegetation. This concurs with Odindi et al. [7] who in the EThekwini municipality, South Africa, showed that the temperature reduction effect of vegetation increases with the percentage of total area covered. Although water bodies also have a cooling effect (negative Contribution Index [CI]), their contribution has remained minimal over the years due to the low proportion of the cities they occupy in both cities. Based on CI, the cooling effect of dense vegetation was more than of sparse vegetation, which echoes the suggestion by Zhang et al. [60] that not only vegetation types but also spatial structure affects LST distribution. Vegetation cover promotes surface cooling due to latent heat transfer.
In both Freetown and Bo town, agriculture areas were causing warming of the city, as indicated by a positive Contribution Index (CI) in all periods. This could be because, during the dry seasons, agriculture areas will either be covered by drying crop residue or will be semi-bare/bare, thus absorbing a considerable amount of heat. This is in agreement with the findings of Mushore et al. [61] in Harare, which showed that, during the hot dry season, croplands act as a heat source as they absorb and release large amounts of heat due to negligible evaporation. Although areas under agriculture have reduced between 1998 and 2015, the CI has remained positive and increased, implying an increased warming contribution to the city. This could be because the temperature of these areas has increased over the years with the changes attributed to global warming. Early planting of crops means that by the dry season the residues will be completely dry, resulting in high heat absorption, which could also be another explanation. However, the decrease in area under agriculture may indicate a shift of agriculture to the secondary industry and services in both cities. In other cities such as Harare [9], growth is also characterized by the major replacement of dense vegetation and agriculture areas with building and impervious surfaces, resulting in warming. Therefore, the surface warming mostly of Freetown between 1998 and 2015 can be attributed to global warming, the warming effect of dry agricultural land, and increase in the built-up area which absorbs a significant amount of heat. This agrees with Jiang and Tian [62], who demonstrated that the construction of buildings leads to the transition of an area from a dense vegetation low temperature to sparse vegetation high temperature zone.
Even in coastal cities where the water table is presumed to be high and sea breezes cool the atmosphere, a high density of buildings still causes warming. Although Freetown is larger in population size as well as built-up extent and also growing faster, it was cooler than Bo town in all periods (by about 2 °C). The difference could be a result of surface moisture and cold air advection due to proximity to the sea. Surface wetness reduces the temperature of a surface due to increased evaporation and latent heat transfer [56]. According to Rasul et al. [56], green areas and water bodies act as urban cool islands, hence the low temperature of Freetown despite being larger in size than Bo town. Besides being close to the sea, the proportion of dense vegetation cover is greater in Freetown than Bo town, which reduces the average temperature of the city. According to Sithole and Odindi, green spaces act as heat sinks, tend to be porous, and assimilate heat. Due to the influence of the sea, dense buildings and high surface temperature are found along the coast in Freetown. This has also led to the sustenance and expansion of a tongue of dense green area and low temperature in the central part. Water and vegetation which surround the built-up area of Freetown act as a sink to these gases, which may also explain the lower temperature there than in Bo town. According to Odindi et al. [7], the heat contribution of dense vegetation is similar to that of water, hence Freetown is surrounded by cool areas resulting a in lower mean surface temperature than Bo town.

5. Conclusions

We have compared urban growth and land surface temperature patterns between a coastal city (Freetown) and an inland city (Bo town) in Sierra Leone in this paper. Multi spectral Landsat data are used to quantify land use and land cover, as well as surface temperature, changes between 1998 and 2015. Based on the findings of the study, we conclude that multi-spectral Landsat data and the Support Vector Machine algorithm retrieve LULC spatial patterns and urban growth with a high accuracy. The growth patterns of Freetown are concentrated along city margins at the coast, while Bo town expanded from the center outwards. The abundance of dense vegetation and proximity to ocean makes Freetown cooler, although it is larger in population and is expanding in terms of the built-up area faster than Bo town. However, even in cool areas such as at the coast, built-up areas have warmer surface temperatures than non-built-up areas such as dense vegetation areas. Expansion of the built-up area from the city core pushes out vegetation towards the margin, resulting in a high temperature towards the center, as in Bo town. Overall, the built-up area expansion increases urban temperature, in addition to the effect of global warming, while vegetation has a strong heat mitigation effect. The Freetown-Bo town scenario has indicated that it is possible for a small city to be warmer than larger and faster growing cities within the same country. Temperature patterns depend heavily on position relative to ocean, as well as the size and spatial structure of dense vegetation area. Therefore, even vegetation and water patches around a built-up area (not only those within) have an influence on its temperature. Although the study managed to convincingly link urban growth induced LULC changes with LST dynamics, future efforts must address some limitations which could hamper the reliability of the findings. The study depended on medium spatial resolution Landsat datasets, whose temporal resolution of 16 days is low. This, together with the cloud free image requirement for surface analysis, resulted in a limited amount of data available for the study. In the presence of sufficient data, averages could have been computed to eliminate the effects of randomness associated with the use of single date images to represent an entire month. Due to the low temporal resolution of Landsat data, it is difficult to obtain in-situ meteorological data at the exact time of satellite overpass for a comparison of temperatures obtained from remote sensing with in-situ observations of air temperature in Sierra Leone. Meteorological operations in Sierra Leone are still manned; taking observations at World Meteorological Organization (WMO) prescribed synoptic hours which do not coincide with the overpass times of Landsat missions. Limited access to in-situ meteorological data inhibited the analysis to test the validity of the findings of this study, although they agreed with global trends. Reflective bands of Landsat are at a higher spatial resolution than the thermal dataset (for example 30 m versus 100 m for Landsat 8). This mismatch has the potential to increase the mixed pixel problem on LST retrievals, thus compromising the link between LULC (30 m resolution) and LST (100 m), even though thermal data is downloaded at a resolution of 30 m after resampling. Other factors which affect thermal properties such as differences in building material and roof types between Freetown and Bo town were not investigated in this study.

Acknowledgments

This work was supported by grants from the National Natural Science Foundation of China (41371398)

Author Contributions

Musa Tawarally, Wenbo Xu, Hou Weiming, and Terence Darlington Mushore designed the study and wrote the paper.

Conflicts of Interest

The authors declare no conflict of interest

Appendix A

Table A1. Accuracy statistic for multi-temporal LULC classification.
Study AreaYearBo Town and Freetown Accuracy Assessment
LULC CategoryProducer AccuracyUser AccuracyOverall AccuracyKhat
(%)(%)(%)
Freetown1998Agricultural land92.3189.7591.560.91
Built-up area96.5794.87
Dense vegetation96.7793.33
Exposed land89.9891.65
Sparse vegetation85.3988.71
Waterbody100100
2000Agricultural land1009095.560.95
Built-up area100100
Dense vegetation96.5593.33
Exposed land100100
Sparse vegetation87.190
Waterbody90.91100
2007Agricultural land97.1186.6793.330.92
Built-up area95.3386.67
Dense vegetation93.3393.33
Exposed land96.77100
Sparse vegetation89.5793.33
Waterbody98.39100
2015Agricultural land96.5593.3389.440.87
Built-up area96.5593.33
Dense vegetation87.8896.67
Exposed land95.6573.33
Sparse vegetation85.7180
Waterbody78.95100
Botown1998Agricultural land89.7887.8789.870.88
Built-up area93.2291.33
Dense vegetation95.6792.89
Exposed land89.8986.78
Sparse vegetation87.5683.89
Waterbody10099.8
2000Agricultural land93.19089.440.87
Built-up area96.386.67
Dense vegetation10093.33
Exposed land71.7993.33
Sparse vegetation92.3180
Waterbody90.3293.33
2007Agricultural land96.1583.3387.780.85
Built-up area96.6796.67
Dense vegetation10090
Exposed land68.5780
Sparse vegetation93.190
Waterbody78.7986.67
2015Agricultural land96.386.6788.330.86
Built-up area90.91100
Dense vegetation10076.67
Exposed land74.3696.67
Sparse vegetation86.2183.33
Waterbody89.6686.67

References

  1. Owen, T.W.; Carlson, T.N.; Gillies, R.R. An assessment of satellite remotely-sensed land cover parameters in quantitatively describing the climatic effect of urbanization. Int. J. Remote Sens. 1998, 19, 1663–1681. [Google Scholar] [CrossRef]
  2. Hallegatte, S.; Corfee-Morlot, J. Understanding climate change impacts, vulnerability and adaptation at city scale: An introduction. Clim. Chang. 2010, 104, 1–12. [Google Scholar] [CrossRef]
  3. Nayak, S.; Mandal, M. Impact of land-use and land-cover changes on temperature trends over Western India. Curr. Sci. 2012, 102, 1166–1173. [Google Scholar]
  4. Pielke, R.A.; Pitman, A.; Niyogi, D.; Mahmood, R.; McAlpine, C.; Hossain, F.; Goldewijk, K.K.; Nair, U.; Betts, R.; Fall, S.; et al. Land use/land cover changes and climate: Modeling analysis and observational evidence. Wiley Interdiscip. Rev. Clim. Chang. 2011, 2, 828–850. [Google Scholar] [CrossRef]
  5. Acharya, T.D.; Parajuli, J.; Poudel, D.; Yang, I. Extraction and Modelling of Spatio-Temporal Urban Change in Kathmandu Valley. Int. J. Eng. Appl. Sci. Res. 2015, 4, 1–11. [Google Scholar]
  6. Shi, T.; Huang, Y.; Wang, H.; Shi, C.-E.; Yang, Y.-J. Influence of urbanization on the thermal environment of meteorological station: Satellite-observed evidence. Adv. Clim. Chang. Res. 2015, 6, 7–15. [Google Scholar] [CrossRef]
  7. Odindi, J.O.; Bangamwabo, V.; Mutanga, O. Assessing the value of urban green spaces in mitigating multi-seasonal urban heat using MODIS Land Surface Temperature (LST) and Landsat 8 data. Int. J. Environ. Res. 2015, 9, 9–18. [Google Scholar]
  8. Gusso, A.; Cafruni, C.; Bordin, F.; Veronez, M.R.; Lenz, L. Multitemporal Analysis of Thermal Distribution Characteristics for Urban Heat Island Management. In Proceedings of the 4th World Sustainability Forum, Basel, Switzerland, 1–30 November 2014; pp. 1–17. [Google Scholar]
  9. Mushore, T.D.; Mutanga, O.; Odindi, J.; Dube, T. Linking major shifts in land surface temperatures to long term land use and land cover changes: A case of Harare, Zimbabwe. Urban Clim. 2017, 20, 120–134. [Google Scholar] [CrossRef]
  10. Zhou, D.; Zhang, L.; Hao, L.; Sun, G.; Liu, Y.; Zhu, C. Spatiotemporal trends of urban heat island effect along the urban development intensity gradient in China. Sci. Total Environ. 2016, 544, 617–626. [Google Scholar] [CrossRef] [PubMed]
  11. Pal, S.; Devara, P. A wavelet-based spectral analysis of long-term time series of optical properties of aerosols obtained by lidar and radiometer measurements over an urban station in Western India. J. Atmos. Sol. Terr. Phys. 2012, 84–85, 75–87. [Google Scholar] [CrossRef]
  12. Behrendt, A.; Wagner, G.; Petrova, A.; Shiler, M.; Pal, S.; Schaberl, T.; Wulfmeyer, V. Modular lidar systems for high-resolution 4-dimensional measurements of water vapor, temperature, and aerosols. SPIE 2005, 5653, 220. [Google Scholar] [CrossRef]
  13. Harlan, S.L.; Declet-Barreto, J.H.; Stefanov, W.L.; Petitti, D.B. Neighborhood effects on heat deaths: Social and environmental predictors of vulnerability in Maricopa county, Arizona. Environ. Health Perspect. 2013, 121, 197–204. [Google Scholar] [PubMed]
  14. Gronlund, C.J.; Berrocal, V.J.; White-Newsome, J.L.; Conlon, K.C.; O’Neill, M.S. Vulnerability to extreme heat by socio-demographic characteristics and area green space among the elderly in Michigan, 1990–2007. Environ. Res. 2015, 136, 449–461. [Google Scholar] [CrossRef] [PubMed]
  15. Mushore, T.; Mutanga, O.; Odindi, J.; Dube, T. Outdoor thermal discomfort analysis in Harare, Zimbabwe in Southern Africa. S. Afr. Geogr. J. 2017. [Google Scholar] [CrossRef]
  16. Uejio, C.K.; Wilhelmi, O.V.; Golden, J.S.; Mills, D.M.; Gulino, S.P.; Samenow, J.P. Intra-urban societal vulnerability to extreme heat: The role of heat exposure and the built environment, socioeconomics, and neighborhood stability. Health Place 2011, 17, 498–507. [Google Scholar] [CrossRef] [PubMed]
  17. Reid, C.E.; Mann, J.K.; Alfasso, R.; English, P.B.; King, G.C.; Lincoln, R.A.; Margolis, H.G.; Rubado, D.J.; Sabato, J.E.; West, N.L.; et al. Evaluation of a Heat Vulnerability Index on Abnormally Hot Days: An Environmental Public Health Tacking Study. Environ. Health Perspect. 2012, 120, 715–720. [Google Scholar] [CrossRef] [PubMed]
  18. Dousset, B.; Gourmelon, F. Satellite multi-sensor data analysis of urban surface temperatures and landcover. ISPRS J. Photogramm. Remote Sens. 2003, 58, 43–54. [Google Scholar] [CrossRef]
  19. Simone, D.G.; Janeiro, R.D.; Toronto, T.D.; Jack, D.; York, N.; Toronto, J.P.; Rahman, M. Climate Change and Human Health in Cities. In Cities and Climate Change—First Assessment Report of the Urban Climate Change Research Network; Cambridge University Press: Cambridge, UK, 2011; pp. 179–213. [Google Scholar]
  20. Intergovernmental Panel on Climate Change (IPCC). Climate Change 2001: Synthesis Report. In Acontribution of Working Groups I, II and III to the Third Assessment Report of the Intergovernmental Panel on Climate Change; Watson, R.T., The Core Writing Team, Eds.; Cambridge University Press: Cambridge, UK, 2001. [Google Scholar]
  21. Wu, H.; Ye, L.-P.; Shi, W.-Z.; Clarke, K.C. Assessing the effects of land use spatial structure on urban heat islands using HJ-1B remote sensing imagery in Wuhan, China. Int. J. Appl. Earth Obs. Geoinf. 2014, 32, 67–78. [Google Scholar] [CrossRef]
  22. Forkuor, G.; Cofie, O. Dynamics of land-use and land-cover change in Freetown, Sierra Leone and its effects on urban and peri-urban agriculture—A remote sensing approach. Int. J. Remote Sens. 2011, 32, 1017–1037. [Google Scholar] [CrossRef]
  23. Sithole, K.; Odindi, J.O. Determination of Urban Thermal Characteristics on an Urban/Rural Land Cover Gradient Using Remotely Sensed Data. S. Afr. J. Geomat. 2015, 4, 384–396. [Google Scholar] [CrossRef]
  24. Mushore, T.D.; Mutanga, O.; Odindi, J.; Dube, T. Assessing the potential of integrated Landsat 8 thermal bands, with the traditional reflective bands and derived vegetation indices in classifying urban landscapes. Geocarto Int. 2017, 32, 886–899. [Google Scholar] [CrossRef]
  25. Lo, C.P.; Quattrochi, D.A.; Luvall, J.C. Application of high-resolution thermal infrared remote sensing and GIS to assess the urban heat island effect. Int. J. Remote Sens. 2010, 18, 287–304. [Google Scholar] [CrossRef]
  26. Weng, Q.; Liu, H.; Lu, D. Assessing the effects of land use and land cover patterns on thermal conditions using landscape metrics in city of Indianapolis, United States. Urban Ecosyst. 2007, 10, 203–219. [Google Scholar] [CrossRef]
  27. Franco, S.; Mandla, V.R.; Rao, K.R.M.; Kumar, M.P.; Anand, P.C. Study of Temperature Profile on Various Land Use and Land Cover for Emerging Heat Island. J. Urban Environ. Eng. 2015, 9, 32–37. [Google Scholar] [CrossRef]
  28. Sha, B.; Ghauri, B. Mapping Urban Heat Island Effect in Comparison with the Land Use, Land Cover of Lahore District. Pak. J. Meteorol. 2015, 11, 37–48. [Google Scholar]
  29. Mushore, T.D.; Mutanga, O.; Odindi, J.; Dube, T. Prediction of future urban surface temperatures using medium resolution satellite data in Harare metropolitan city, Zimbabwe. Build. Environ. 2017, 122, 397–410. [Google Scholar] [CrossRef]
  30. Abegunde, L.; Adedeji, O. Impact of Landuse Change on Surface Temperature in Ibadan, Nigeria. Int. J. Environ. Ecol. Geol. Geophys. Eng. 2015, 9, 235–241. [Google Scholar]
  31. Odindi, J.; Mutanga, O.; Abdel-Rahman, E.M.; Adam, E.; Bangamwabo, V. Determination of urban land-cover types and their implication on thermal characteristics in three South African coastal metropolitans using remotely sensed data. S. Afr. Geogr. J. 2017, 99, 52–67. [Google Scholar] [CrossRef]
  32. Liu, H.; Weng, Q.H. Scaling Effect on the Relationship between Landscape Pattern and Land Surface Temperature: A Case Study of Indianapolis, United States. Photogramm. Eng. Remote Sens. 2009, 75, 291–304. [Google Scholar] [CrossRef]
  33. Statistics Sierra Leone. Sierra Leone Population and Housing Census 2004; Final Report; Statistics Sierra Leone: Freetown, Sierra Leone, 2006. [Google Scholar]
  34. Roy, D.P.; Wulder, M.A.; Loveland, T.R.; Woodcock, C.E.; Allen, R.G.; Anderson, M.C.; Helder, D.; Irons, J.R.; Johnson, D.M.; Kennedy, R.; et al. Landsat-8: Science and product vision for terrestrial global change research. Remote Sens. Environ. 2014, 145, 154–172. [Google Scholar] [CrossRef]
  35. Storey, J.; Scaramuzza, P.; Schmidt, G.; Barsi, J. LANDSAT 7 Scan Line Corrector- off Gap-Filled Product Development. In Proceedings of the Pecora 16 Conference on Global Priorities in Land Remote Sensing, Sioux Falls, SD, USA, 23–27 October 2005. [Google Scholar]
  36. Markham, B.; Goward, S.; Arvidson, T.; Barsi, J.; Scaramuzza, P. Landsat-7 long-term acquisition plan radiometry-evolution over time. Photogramm. Eng. Remote Sens. 2006, 72, 1129–1135. [Google Scholar] [CrossRef]
  37. Dube, T.; Mutanga, O. Evaluating the utility of the medium-spatial resolution Landsat 8 multispectral sensor in quantifying aboveground biomass in uMgeni catchment, South Africa. ISPRS J. Photogramm. Remote Sens. 2015, 101, 36–46. [Google Scholar] [CrossRef]
  38. Matthew, M.W.; Adler-Golden, S.M.; Berk, A.; Richtsmeier, S.C.; Levine, R.Y.; Bernstein, L.S.; Acharya, P.K.; Anderson, G.P.; Felde, G.W.; Hoke, M.P. Status of Atmospheric Correction Using a MODTRAN4-Based Algorithm; Spectral Sciences Inc.: Burlington, MA, USA, 2000. [Google Scholar]
  39. Kaufman, Y.J.; Wald, A.E.; Remer, L.A.; Gao, B.-C.; Li, R.-R.; Flynn, L. The MODIS 2.1-/SPL mu/m channel-correlation with visible reflectance for use in remote sensing of aerosol. IEEE Trans. Geosci. Remote Sens. 1997, 35, 1286–1298. [Google Scholar] [CrossRef]
  40. Adelabu, S.; Mutanga, O.; Adam, E.; Cho, M.A. Exploiting machine learning algorithms for tree species classification in a semiarid woodland using RapidEye image. J. Appl. Remote Sens. 2013, 7, 073480. [Google Scholar] [CrossRef]
  41. Jia, K.; Wei, X.; Gub, X.; Yao, Y.; Xie, X.; Li, B. Land cover classification using Landsat 8 Operational Land Imager data in Beijing, China. Geocarto Int. 2014, 29, 941–951. [Google Scholar] [CrossRef]
  42. Yu, X.; Zhang, A.; Hou, X.; Li, M. Multi-temporal remote sensing of land cover change and urban sprawl in the coastal city of Yantai, China. Int. J. Digit. Earth 2013, 6, 37–41. [Google Scholar] [CrossRef]
  43. Salvati, L.; Sabbi, A. Exploring long-Term Land Cover Changes in an Urban Region of Southern Europe. Int. J. Sustain. Dev. World Ecol. 2011, 18, 273–282. [Google Scholar] [CrossRef]
  44. Weng, Q.; Lu, D.; Schubring, J. Estimation of land surface temperature-vegetation abundance relationship for urban heat island studies. Remote Sens. Environ. 2004, 89, 467–483. [Google Scholar] [CrossRef]
  45. Sobrino, J.; Caselles, V.; Becker, F. Significance of the remotely sensed thermal infrared measurements obtained over a citrus orchard. ISPRS J. Photogramm. Remote Sens. 1990, 44, 343–354. [Google Scholar] [CrossRef]
  46. Sobrino, J.A.; Jiménez-Muñoz, J.C.; Paolini, L. Land surface temperature retrieval from LANDSAT TM 5. Remote Sens. Environ. 2004, 90, 434–440. [Google Scholar] [CrossRef]
  47. Markham, B.L. Landsat MSS and TM Post-Calibration Dynamic Ranges, Exoatmospheric Reflectances and at-Satellite Temperatures; Landsat Technical Notes; European Space Agency (ESA): Paris, France, 1986; Volume 1, pp. 3–8. [Google Scholar]
  48. Chen, X.-L.; Zhao, H.-M.; Li, P.-X.; Yin, Z.-Y. Remote sensing image-based analysis of the relationship between urban heat island and land use/cover changes. Remote Sens. Environ. 2006, 104, 133–146. [Google Scholar] [CrossRef]
  49. Anderson, J.R. A Land Use and Land Cover Classification System for Use with Remote Sensor Data; US Government Printing Office: Washington, DC, USA, 1976; Volume 964.
  50. Omran, E.-S.E. Detection of Land-Use and Surface Temperature Change at Different Resolutions. J. Geogr. Inf. Syst. 2012, 04, 189–203. [Google Scholar] [CrossRef]
  51. Voogt, J.A.; Oke, T.R. Thermal remote sensing of urban climates. Remote Sens. Environ. 2003, 86, 370–384. [Google Scholar] [CrossRef]
  52. Zhang, Q.; Schaaf, C.; Seto, K.C. The Vegetation adjusted NTL Urban Index: A new approach to reduce saturation and increase variation in nighttime luminosity. Remote Sens. Environ. 2013, 129, 32–41. [Google Scholar] [CrossRef]
  53. Adebowale, B.I.; Kayode, S.E. Geospatial Assessment of Urban Expansion and Land Surface Temperature in Akure, Nigeria. In Proceedings of the ICUC9—9th International Conference on Urban Climate Jointly with 12th Symposium on the Urban Environment, Toulouse, France, 20–24 July 2015; pp. 1–6. [Google Scholar]
  54. Kamusoko, C.; Gamba, J.; Murakami, H. Monitoring Urban Spatial Growth in Harare Metropolitan Province, Zimbabwe. Adv. Remote Sens. 2013, 2, 322–331. [Google Scholar] [CrossRef]
  55. Blake, R.; Grimm, A.; Ichinose, T.; Horton, R.; Gaffin, S.; Jiong, S.; Bader, D.A.; Cecil, L.D. Urban climate: Processes, trends and projections. In First Assessment Report of the Urban Climate Change Research Network; Cambridge University Press: Cambridge, UK, 2011; pp. 43–81. [Google Scholar]
  56. Rasul, A.; Balzter, H.; Smith, C. Spatial variation of the daytime Surface Urban Cool Island during the dry season in Erbil, Iraqi Kurdistan, from Landsat 8. Urban Clim. 2015, 14, 176–186. [Google Scholar] [CrossRef]
  57. Grimmond, S.U.E. Urbanization and global environmental change: Local effects of urban warming. Geogr. J. 2007, 173, 83–88. [Google Scholar] [CrossRef]
  58. Zhang, H.; Qi, Z.; Ye, X.; Cai, Y.; Ma, W.; Chen, M. Analysis of land use/land cover change, population shift, and their effects on spatiotemporal patterns of urban heat islands in metropolitan Shanghai, China. Appl. Geogr. 2013, 44, 121–133. [Google Scholar] [CrossRef]
  59. Thatcher, M.; Hurley, P. Simulating Australian Urban Climate in a Mesoscale Atmospheric Numerical Model. Bound. Layer Meteorol. 2012, 142, 149–175. [Google Scholar] [CrossRef]
  60. Zhang, Y.; Odeh, I.O.A.; Han, C. Bi-temporal characterization of land surface temperature in relation to impervious surface area, NDVI and NDBI, using a sub-pixel image analysis. Int. J. Appl. Earth Obs. Geoinf. 2009, 11, 256–264. [Google Scholar] [CrossRef]
  61. Mushore, T.D.; Mutanga, O.; Odindi, J.; Dube, T. Determining extreme heat vulnerability of Harare Metropolitan City using multispectral remote sensing and socio-economic data. J. Spat. Sci. 2017, 1–19. [Google Scholar] [CrossRef]
  62. Jiang, J.; Tian, G. Analysis of the impact of Land use/Land cover change on Land Surface Temperature with Remote Sensing. Procedia Environ. Sci. 2010, 2, 571–575. [Google Scholar] [CrossRef]
Figure 1. Location of Freetown and Bo town in Sierra Leone, West Africa.
Remotesensing 10 00112 g001
Figure 2. Urban growth induced LULC changes in Freetown (AD) and Bo town (EH) between 1998 and 2015.
Remotesensing 10 00112 g002
Figure 3. Urban growth induced LULC changes in Freetown and Bo town (1998 to 2015).
Remotesensing 10 00112 g003
Figure 4. Land surface temperature change in Freetown (AD) and Bo town (EH) between 1998 and 2015.
Remotesensing 10 00112 g004
Table 1. Accuracy of multi-temporal LULC classifications in Freetown and Bo town.
YearFreetownBo Town
OAKappaOAKappa
199891.560.9189.870.88
200095.560.9589.440.87
200793.330.9287.880.85
201589.440.8788.330.86
Table 2. Census-based population growth in Freetown and Bo town.
YearPopulation Size
FreetownBo Town
1963127,91726,613
1974276,24739,741
1985469,77659,768
2004772,873148,705
20151,050,301173,905
Table 3. Changes in the heat source/sink role of land use and land cover types in Freetown between 1998 and 2015. Green means vegetation.
1998200020072015
DT (°C)S (%)CIDT (°C)S (%)CIDT (°C)S (%)CIDT (°C)S (%)CI
Built-up2.679.920.263.1713.160.422.1517.840.382.9224.730.72
Dense green−2.1921.43−0.47−2.7921.98−0.61−1.5128.76−0.43−2.6025.82−0.67
Sparse green−1.1529.52−0.34−1.2834.55−0.44−0.4822.57−0.11−0.3737.29−0.14
Agriculture0.1822.930.04−0.4817.16−0.08−0.4213.85−0.060.970.980.10
Bare/sand1.7010.460.181.217.610.091.4310.600.151.745.240.09
Water−1.175.73−0.07−0.415.55−0.02−1.156.38−0.07−2.655.95−0.16
Table 4. Changes in the heat source/sink role of land use and land cover types in Bo town between 1998 and 2015.
1998200020072015
DT (°C)S (%)CIDT (°C)S (%)CIDT (°C)S (%)CIDT (°C)S (%)CI
Built-up3.655.080.192.787.380.212.5812.690.332.0919.790.41
Dense green−2.3147.06−1.09−2.2124.68−0.55−1.6331.09−0.51−2.5133.97−0.85
Sparse green−1.4419.91−0.29−1.4849.14−0.73−0.8331.39−0.26−0.9326.11−0.24
Agriculture0.5218.260.100.5414.760.080.3810.490.040.208.620.02
Bare/sand1.257.960.101.563.720.060.7811.150.091.299.690.13
Water−1.701.73−0.03−1.220.31−0.01−1.273.20−0.01−0.131.83−0.01

