Spaceborne GNSS-R Observation of Global Lake Level: First Results from the TechDemoSat-1 Mission


1
Institute of Remote Sensing and GIS, School of Earth and Space Sciences, Peking University, Beijing 100871, China
2
Engineering Research Center of Earth Observation and Navigation (CEON), Ministry of Education, Beijing 100871, China
3
Department of Hydraulic Engineering, Tsinghua University, Beijing 100084, China
*
Author to whom correspondence should be addressed.
Remote Sens. 2019, 11(12), 1438; https://doi.org/10.3390/rs11121438
Submission received: 24 May 2019
/
Revised: 9 June 2019
/
Accepted: 15 June 2019
/
Published: 18 June 2019
Abstract
:Spaceborne global navigation satellite system reflectometry (GNSS-R) data collected by the UK TechDemoSat-1 (TDS-1) satellite is applied to retrieve global lake levels for the first time. Lake levels of 351 global lakes (area greater than 500 km2 and elevation lower than 3000 m each) are estimated using TDS-1 Level 1b data over 2015–2017. Strong correlations (overall R2 greater than 0.95) are observed among lake levels derived from TDS-1 and other altimetry satellites such as CryoSat-2, Jason, and Envisat (the latter two are collected by Hydroweb), although with large root-mean-square error (RMSE) (tens of meters) mainly due to the fact that TDS-1 is not dedicated for altimetry measuring purpose. Examples of the Caspian Sea and the Poyang Lake show consistent spatial and temporal variations between TDS-1 and other data sources. The results in this paper provide supportive information for further application of GNSS-R constellations to measure altimetry of inland water bodies.
1. Introduction
Global navigation satellite system reflectometry (GNSS-R) is a bistatic radar approach to infer surface properties through analyzing the reflected GNSS signals from the Earth’s surface. Compared to traditional optical or microwave remote sensing approaches, this technique is cost-effective since it uses operational GNSS satellites as microwave transmitters [1]. Since the launch of the UK’s TechDemoSat-1 (TDS-1) in 2015 and NASA’s cyclone global navigation satellite system (CYGNSS) in 2016, the feasibility of spaceborne GNSS-R retrievals has been demonstrated for various parameters such as ocean surface wind [2], ocean altimetry [3], sea ice and ice sheets [4,5], soil moisture [6], and flood inundation [7].
Lake water level is an important component of lake hydrology [8]. Common methods to monitor lake level include in situ measurements from hydrologic stations and observations from satellite altimeters [9]. Hydrologic stations are point-distributed and difficult to set up in harsh environments. Satellite altimeters provide an alternative way to monitor lake level with fine temporal and spatial resolutions (e.g., 183 d/70 m for ICESat, 30 d/1.6 km for CryoSat-2, and 35 d/1.7 km for Envisat) [10]. However, current satellite altimetry missions can only monitor 15% of global water volume variations of the inland water bodies due to the insufficient spatial and temporal resolution [11]. GNSS-R technique could be, to some extent, treated as a radar altimeter with GNSS satellites as transmitters. Previous GNSS-R altimetry mainly focused on sea surface height [12], whilst only a few studies concentrated on the water level of inland lakes [13,14,15].
This paper first demonstrates the advantages and limitations of using TDS-1 GNSS reflections to estimate global lake level. Data used are collected by the space GNSS receiver remote sensing instrument (SGR-ReSI) on board of TDS-1. The SGR-ReSI operates for 2 days of an 8 days cycle at the time of initial operation. With the life extension of TDS-1, the data rate of reflectometry measurements increased four-fold to near continuous measurement availability. TDS-1 data is now segmented into 6 h sections, and is made available 48 h after measurement to fast data subscribers in network Common Data Form (netCDF) format [16]. Routine TDS-1 data collection ceased on 16 December 2018. The website and data repository will be maintained.
2. Data and Methods
2.1. Data Description
The TDS-1 Level 1b data are used to investigate the global lake level since this is the product most publicly available (rather than L0 data using which could derive better accuracy of lake level [15]) at the MERRByS (measurement of Earth reflected radio-navigation signals by satellite) website. The data set used in this study covers a 3 year period from 2015 to 2017. The main observation from the TDS-1 L1b data is the delay-Doppler maps (DDMs). DDM is the correlation power sampled in delay and Doppler space by correlating the reflected signal with a local generated replica [17]. The TDS-1 DDMs are made of 128 delay pixels by 20 Doppler pixels, with a Doppler resolution of 500 Hz and a delay resolution of 244.3942 ns [16].
Two data sets, i.e., the CyroSat-2 level 2 GDR data set and the Hydroweb data set [18] are used to validate TDS-derived lake level. Both of the two data sets can provide centimeter-level altimetry accuracy. The CryoSat-2 spatial data is referenced to the WGS84 Ellipsoid, and the surface height is processed through instrument correction, transmission delay correction, geometric correction and geophysical correction [19]. The Hydroweb data set collects time series of daily water levels of more than 150 inland lakes and rivers around the world. The water levels from Hydroweb are derived using altimetry satellites such as Jason and Envisat. The data source for each lake used in this study is attached in the supplementary materials, Table S1. The reference surface of Hydroweb data is the GRACE gravity model 02C (GGM02C), which is a high-resolution global gravity model (i.e., a kind of geoid).
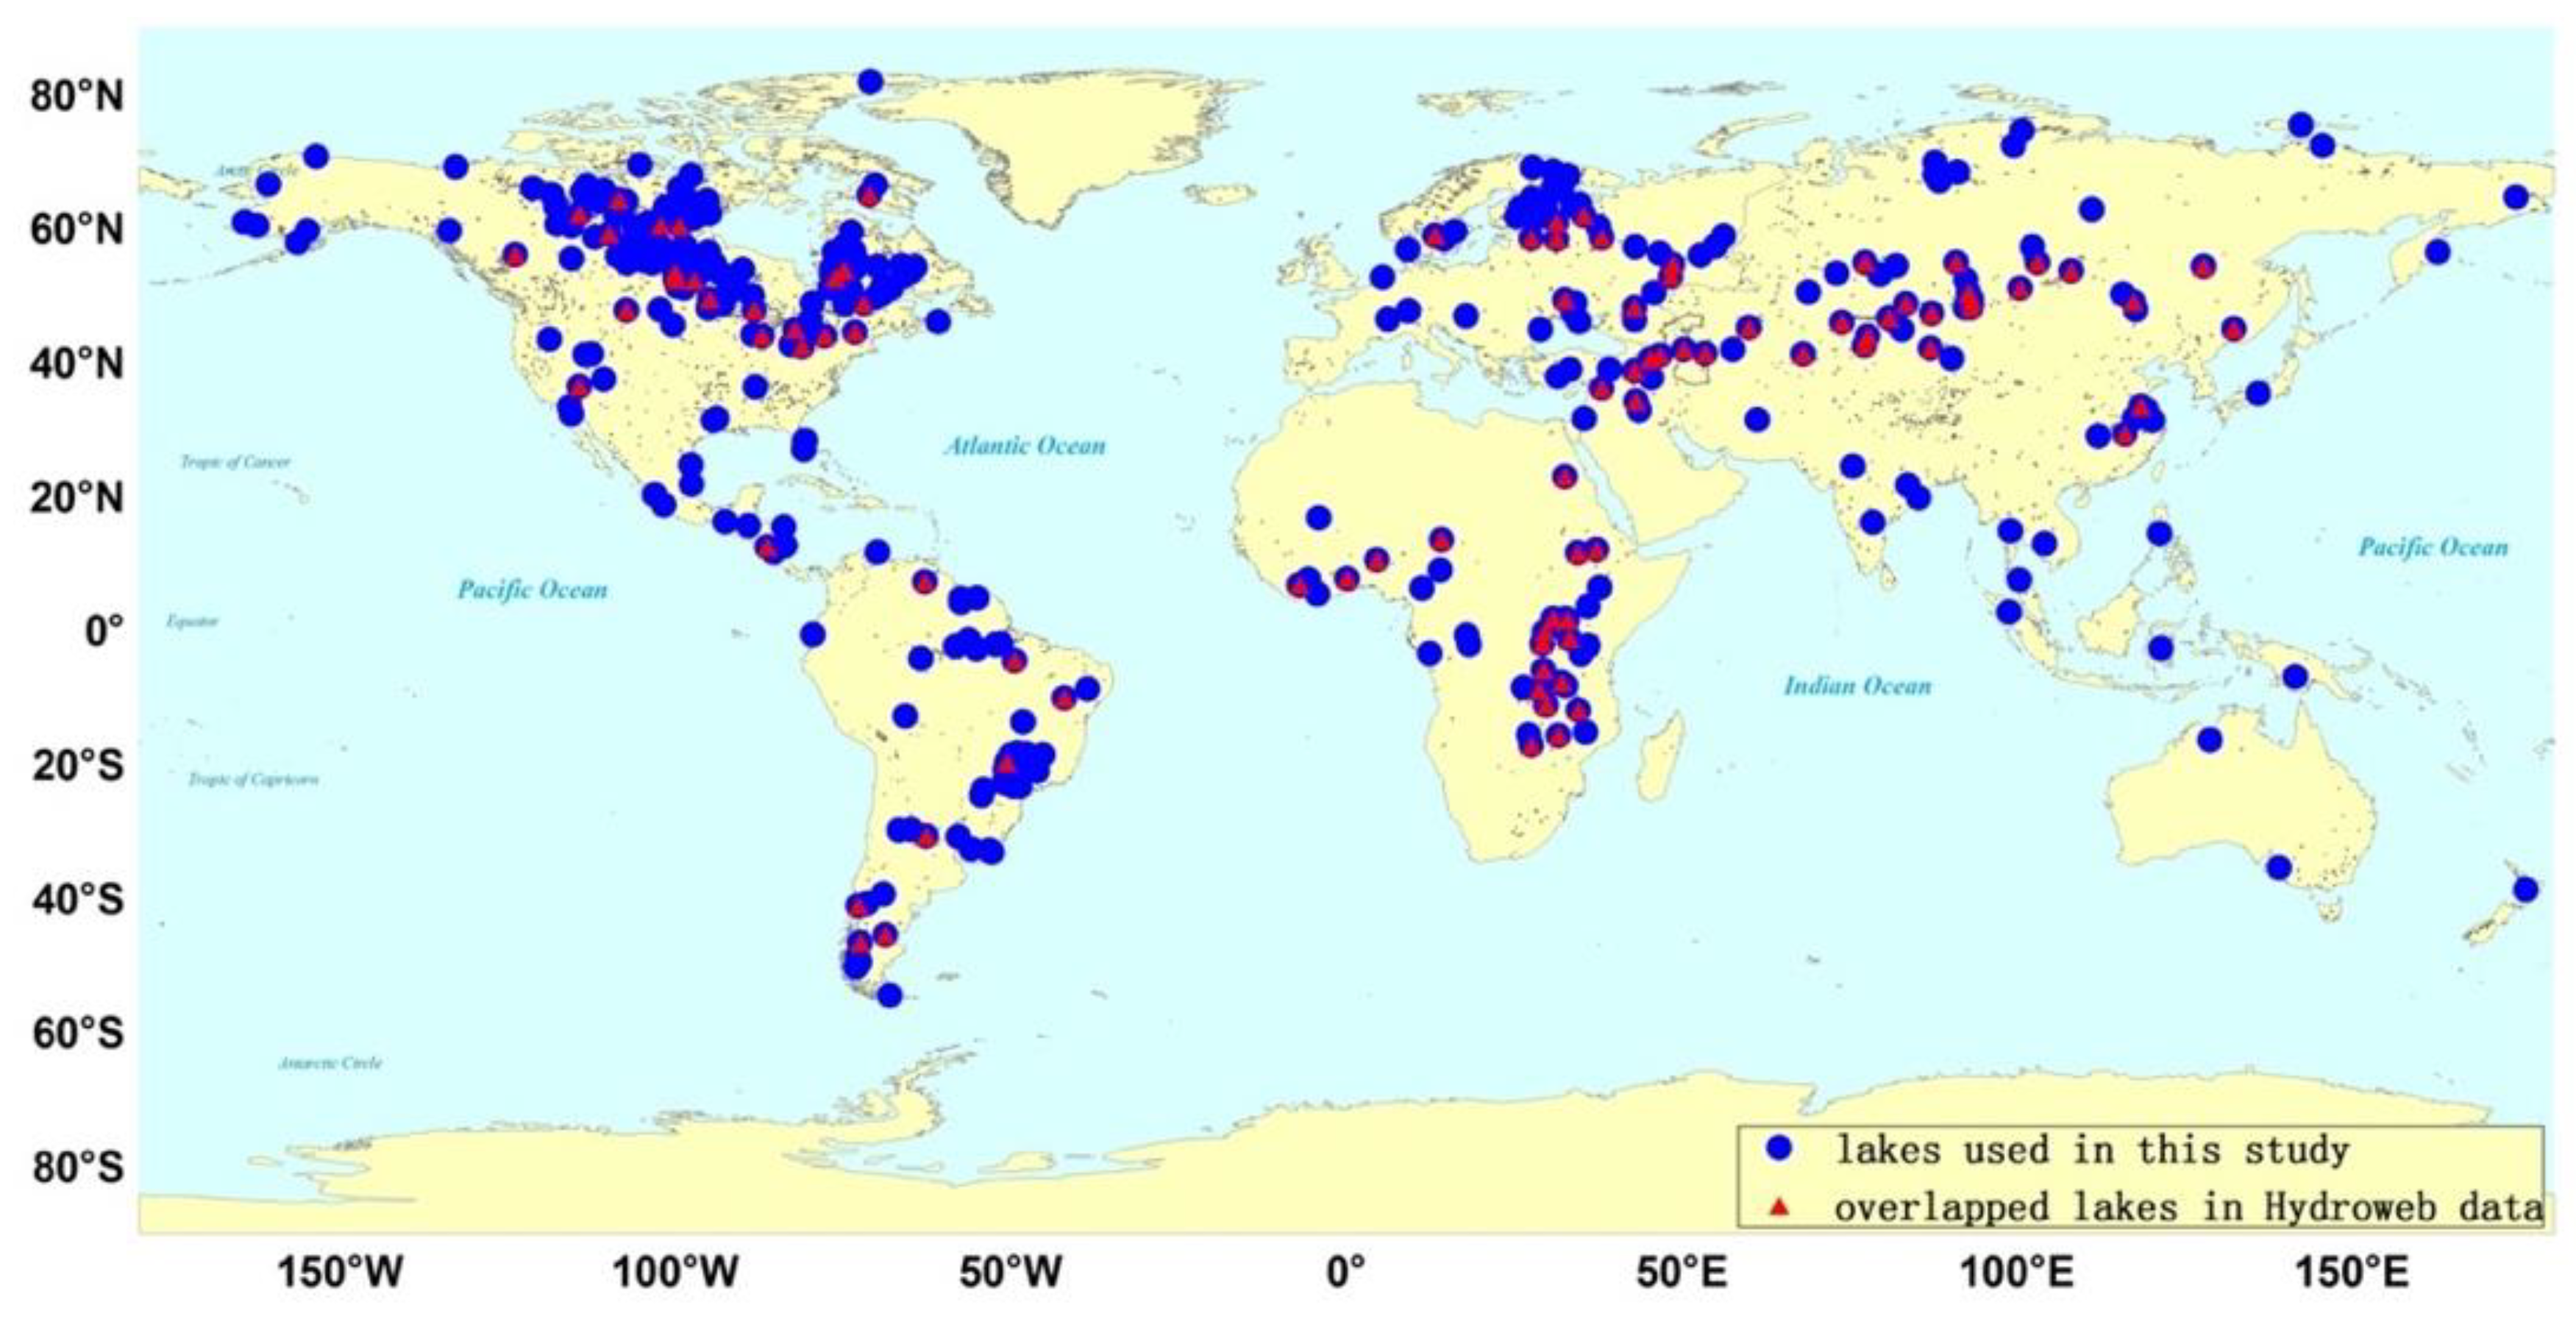
Given that the reflected waveform from surface with elevations over 3000 m is not contained within the DDM window [6], in this study, we investigate 351 lakes globally with areas greater than 500 km2 and elevations lower than 3000 m (Figure 1). Surface area and mean elevation of these lakes are derived from the Global Lakes and Wetlands Database (GLWD) [20]. The 500 km2 threshold is determined to ensure that, (1) a specific lake is large enough to have sufficient specular points located on it within a certain time window, and (2) there are sufficient lake samples for correlation analysis on a global scale.
2.2. Data Preprocessing
To derive reliable lake water level estimates, for each lake, a 1 km buffer is firstly made to reduce the influence from water-land interactions, and a landmask is then applied to extract the specular points that fell into the lake. We only use the samples with the antenna gain pointed at the specular point greater than 5 dBi. This gain threshold is the same as that used for estimation of sea surface height in [3] and soil moisture in [6]. The data are then filtered for (1) the SNR of the peak DDM pixel greater than 5 dB (since there have been uncertainties reported in the measured antenna gain pattern that increases with increasing distance from the peak of the main lobe [6]), and (2) the elevation angle of the specular points higher than 30° (to prevent multipath effects). The TDS-1 L1b data in September 2016 are filtered out due to the poor quality of the delay waveforms in this period. Data of descending tracks are also filtered out to remove orbital errors and minimize the effects of fluctuating tropospheric and ionospheric propagation delays, since descending tracks of TDS-1 are mainly during daytime hours when there are larger errors of tropospheric and ionospheric delays than during the nighttime [21].
The CryoSat-2 Level 2 GDR data have three height values at each observed sample since the altimeter includes three measurement modes. First, we filter the data to remove random error, i.e., we only use data samples whose height differences among the three types of measurement are lower than 0.3 m. Second, for one single data sample, we use the average height of the three types of measurement. In order to make the comparison among TDS-1/Cryosat-2/Hydroweb on a consistent basis, the vertical datum of CryoSat-2 is converted to GGM02C according to the spherical harmonic coefficients.
2.3. Lake Level Retrieval
The time delay of the specular reflected signal with respect to the direct signal determines the retrieval of a relative surface height [22]. There are multiple methods to track the specular point from the waveform extracted from DDM at central Doppler, e.g., using a given point of leading edge maximum derivative (LED), using the maximum of the waveform (MAX), and using the half or a fractional power point (HALF) [23]. In this study, the HALF method is implemented since previous studies have shown that this method is simple, computationally efficient, and more precise than other point tracking techniques [24].In order to determine the delay at the specular point more accurately (to overcome the coarse sampling of the waveform), the delay waveform is interpolated using a spline interpolation method and the interpolation factor is set as 1000, the same as the process for the observation of sea surface height in [3].
The WGS84 ellipsoid reference is used to measure lake water level from TDS-1. The water level is calculated using the following Equations (1)–(3):
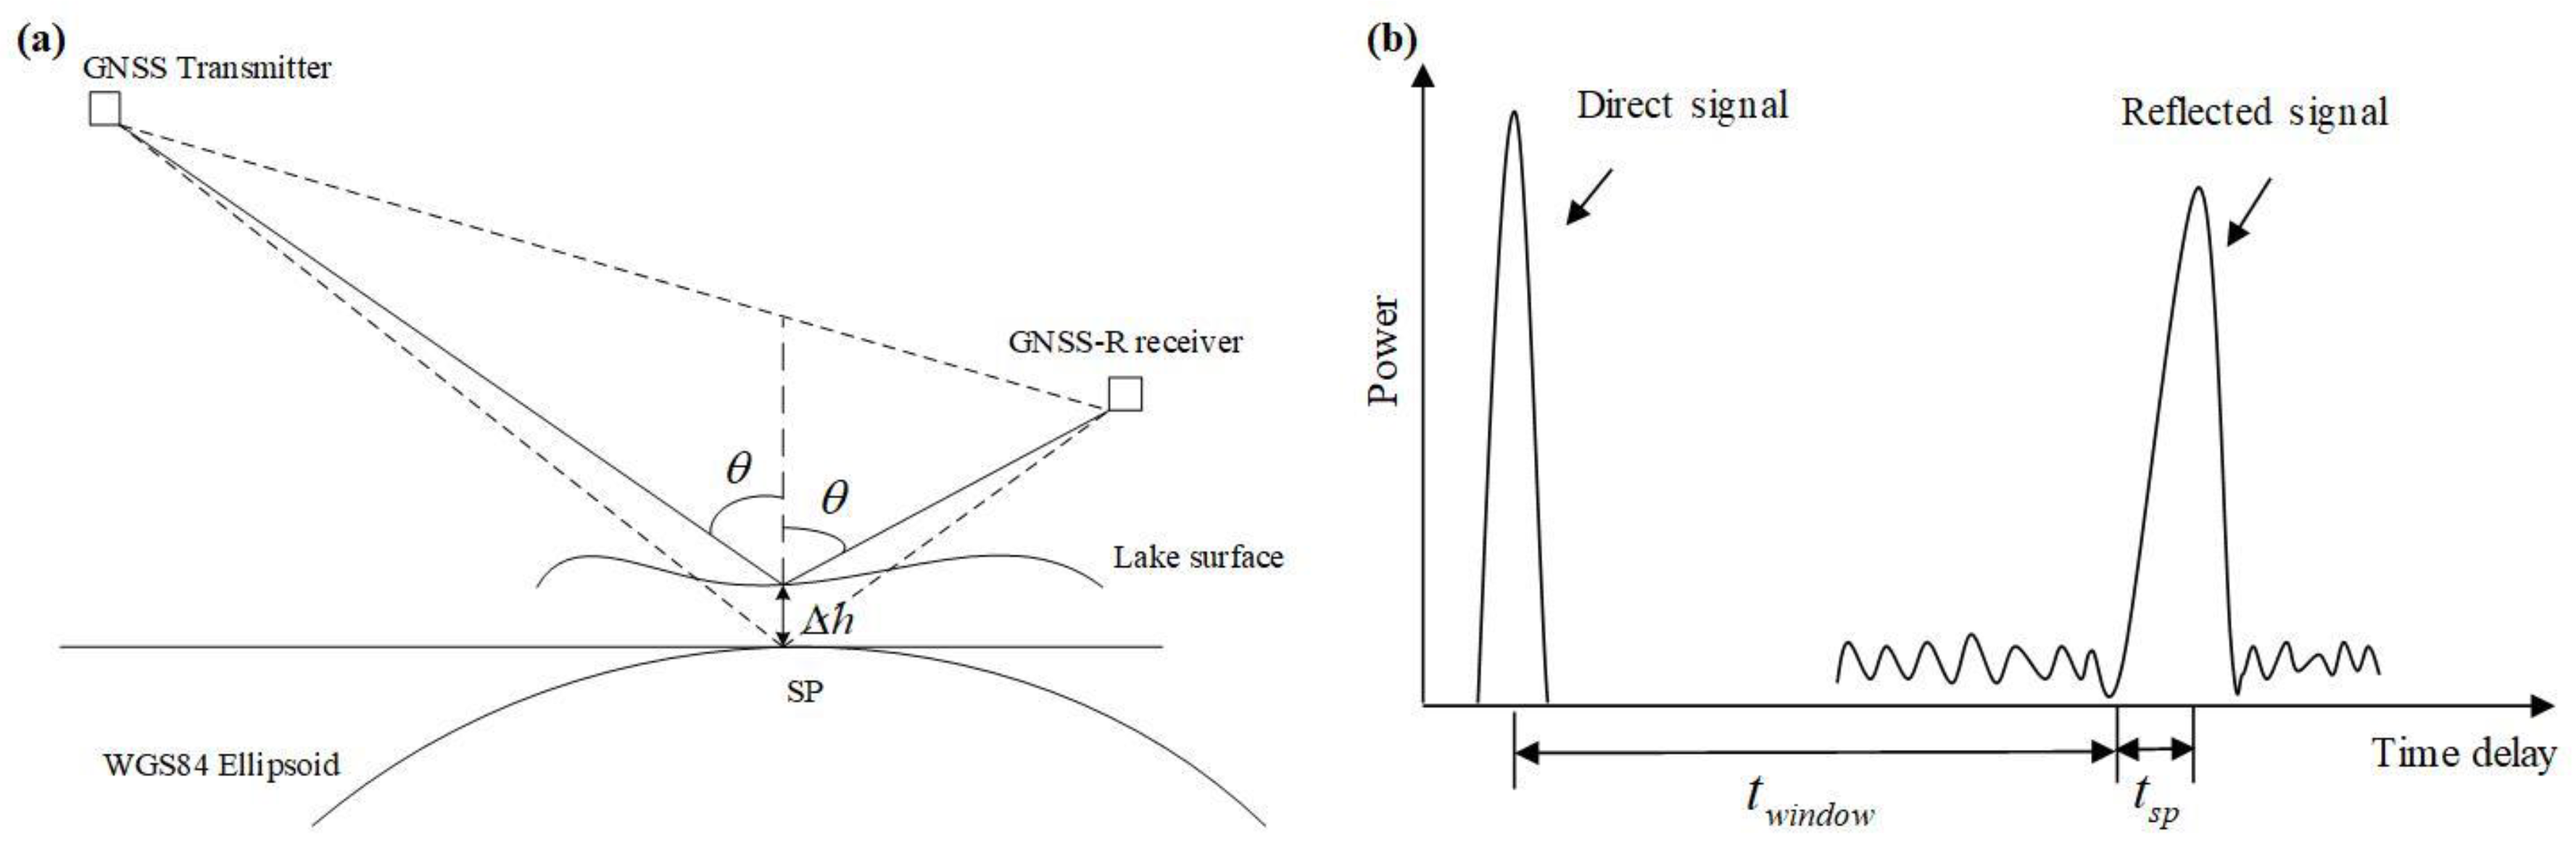
where, is the speed of light. As shown in Figure 2a, is the incidence angle of each specular point. and are the observable time delay with respect to the direct signal and the time delay with respect to the direct signal of the hypothetical specular point on the WGS84 ellipsoid reference, respectively. is the altimetry of the specular point over lake surface relative to the WGS84 ellipsoid reference. As shown in Figure 2b, and , are the delay of DDM window and the delay of specular point within the DDM window, respectively.
The TDS-derived lake water level () is susceptible to large errors due to measurement noise, orbit uncertainty, ionosphere/troposphere delay, and limited receiver bandwidth, which may lead to a few outliers. Therefore, we filter the raw results using the following criterion to remove the nonphysical outliers [3]:
where is the mean TDS-1 lake level. , , and are the mean, minimum, and maximum lake levels, respectively, of each lake from CryoSat-2.
The altimetry of each specular point with respect to the WGS84 ellipsoid reference is converted to that with respect to the GGM02C. The lake level is finally calculated as the average of the altimetry values of those specular points which fell into the lake during a given time period.
3. Results and Discussions
3.1. Overall Evaluations and Comparisons
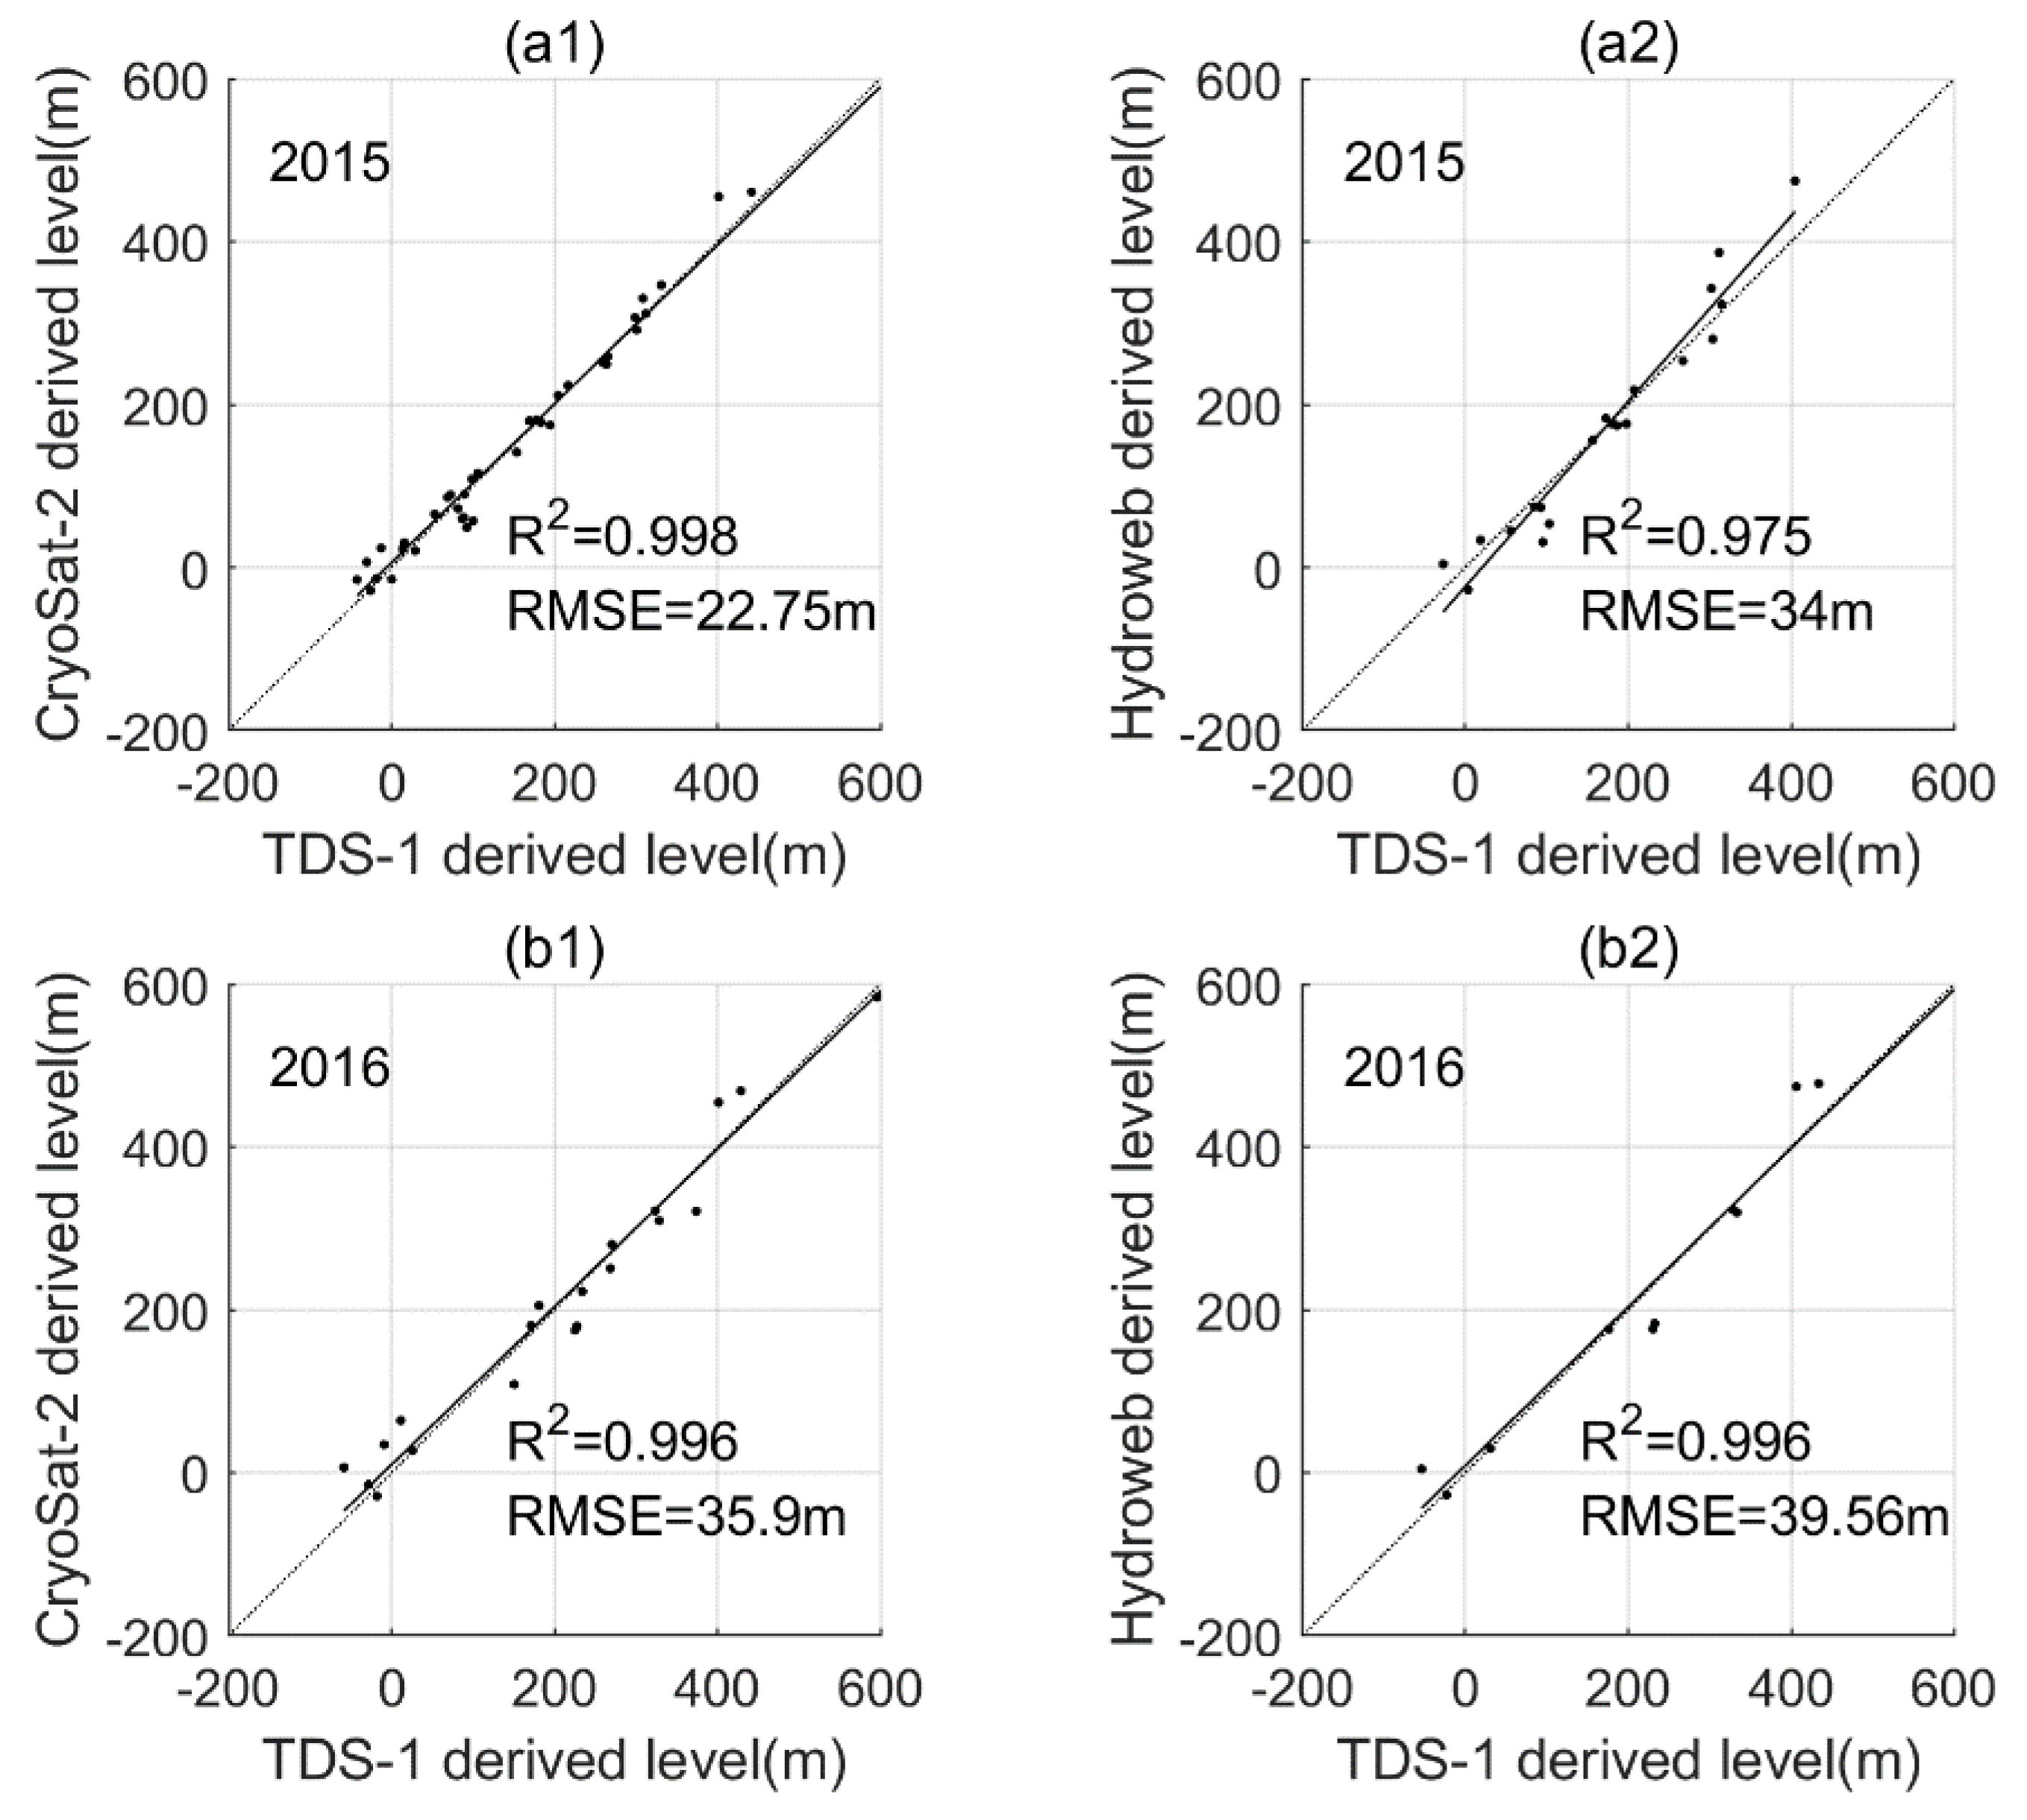
Comparisons between TDS-1/CryoSat-2 and TDS-1/Hydroweb using summer data are performed in this section. Data from summer is applied to avoid the influence of lake ice, and it is set as a duration from August to October in the Northern hemisphere and from February to April in the Southern hemisphere [25]. Figure 3 shows the correlations of the global lake level results derived from TDS-1, CryoSat-2 and Hydroweb data from 2015 (a1, a2) and 2016 (b1, b2). The results from 2017 are dismissed since there is only one-day data (i.e., 31/10/2017) publicly available within the selected time window. The scattered points in Figure 3 denote the water levels of overlapped lakes derived from TDS-1/CryoSat-2 (a1, b1) and TDS-1/Hydroweb (a2, b2). For TDS-1, the water level of each lake is the mean value of all the specular points within the lake boundary. For CryoSat-2, the water level of each lake is determined using the rules described in Section 2.2. Note that the TDS-derived lake levels have strong correlations with those from CryoSat-2 and the Hydroweb data, with R2 greater than 0.95 for both 2015 and 2016. However, the overall root-mean-square error (RMSE) (the reference lake level data are treated as ground-truth data) is large (approximately tens of meters), and the data show a smaller RMSE in 2015 than that in 2016. The large RMSE of the data indicates that although TDS-1 has relatively comparable results, it cannot guarantee incredibly high accuracy of the lake level estimates. Possible contributing factors will be discussed in the following Section 3.3.
3.2. Spatial and Temporal Analyses
We use data from two lakes, i.e., the Caspian Sea and the Poyang Lake, to further show spatial and temporal comparisons among TDS-1, Cryosat-2, and in situ measurements. Caspian Sea (14.85° N, 50.36° E) is the largest lake of the world with an area of 386,400 km2, thus it is a good example to show the spatial variations of water levels with respect to WGS84 ellipsoid over different areas of the lake. Poyang Lake (29.25° N, 116.06° E) is the largest lake in China with an area of 4125 km2. Given the limitation of acquiring in situ data from operational hydrologic stations, we chose this lake to compare the temporal variations of water levels observed by TDS-1 and other approaches. The in situ water levels observed from the hydrologic station are from April to November in 2015 and 2017.
Figure 4a shows maps of three TDS-1 tracks for the Caspian Sea on 06/07/2015, 08/08/2016, and 06/11/2017. The background map of Figure 4a shows the spatial variations of water levels observed by all the available CryoSat-2 tracks in 2015. Figure 4b–d show the spatial variations of water levels with respect to the WGS84 ellipsoid observed by the corresponding TDS-1 tracks in Figure 4a, with CryoSat-2 derived water levels of the same year as a contrast. Each value of CryoSat-2 data (black point) in Figure 4b–d is determined as the mean value of points within a 0.03° spatial window around the corresponding TDS-1 specular point. For each year, an overall bias (i.e., −16.73 m, −10.68 m, and −30.1 m for 2015, 2016, and 2017, respectively) is removed which forces the mean lake level estimated from TDS-1 to equal the mean CryoSat-2. The only purpose of doing this removal is to show the possibility of measurements using TDS-1 data. Precise calibration is left to future work or possibly future spacecraft dedicated for altimetry measuring purposes. It shows an overall agreement of spatial variations of water level derived from TDS-1 and CryoSat-2. The final RMSE of 2015, 2016, and 2017 is 6.88 m, 7.18 m, and 5.7 m, respectively, which is of the same order as that from previous studies measuring ocean surface (8.1 m and 7.4 m in [3], and 6.4 m in [24]).
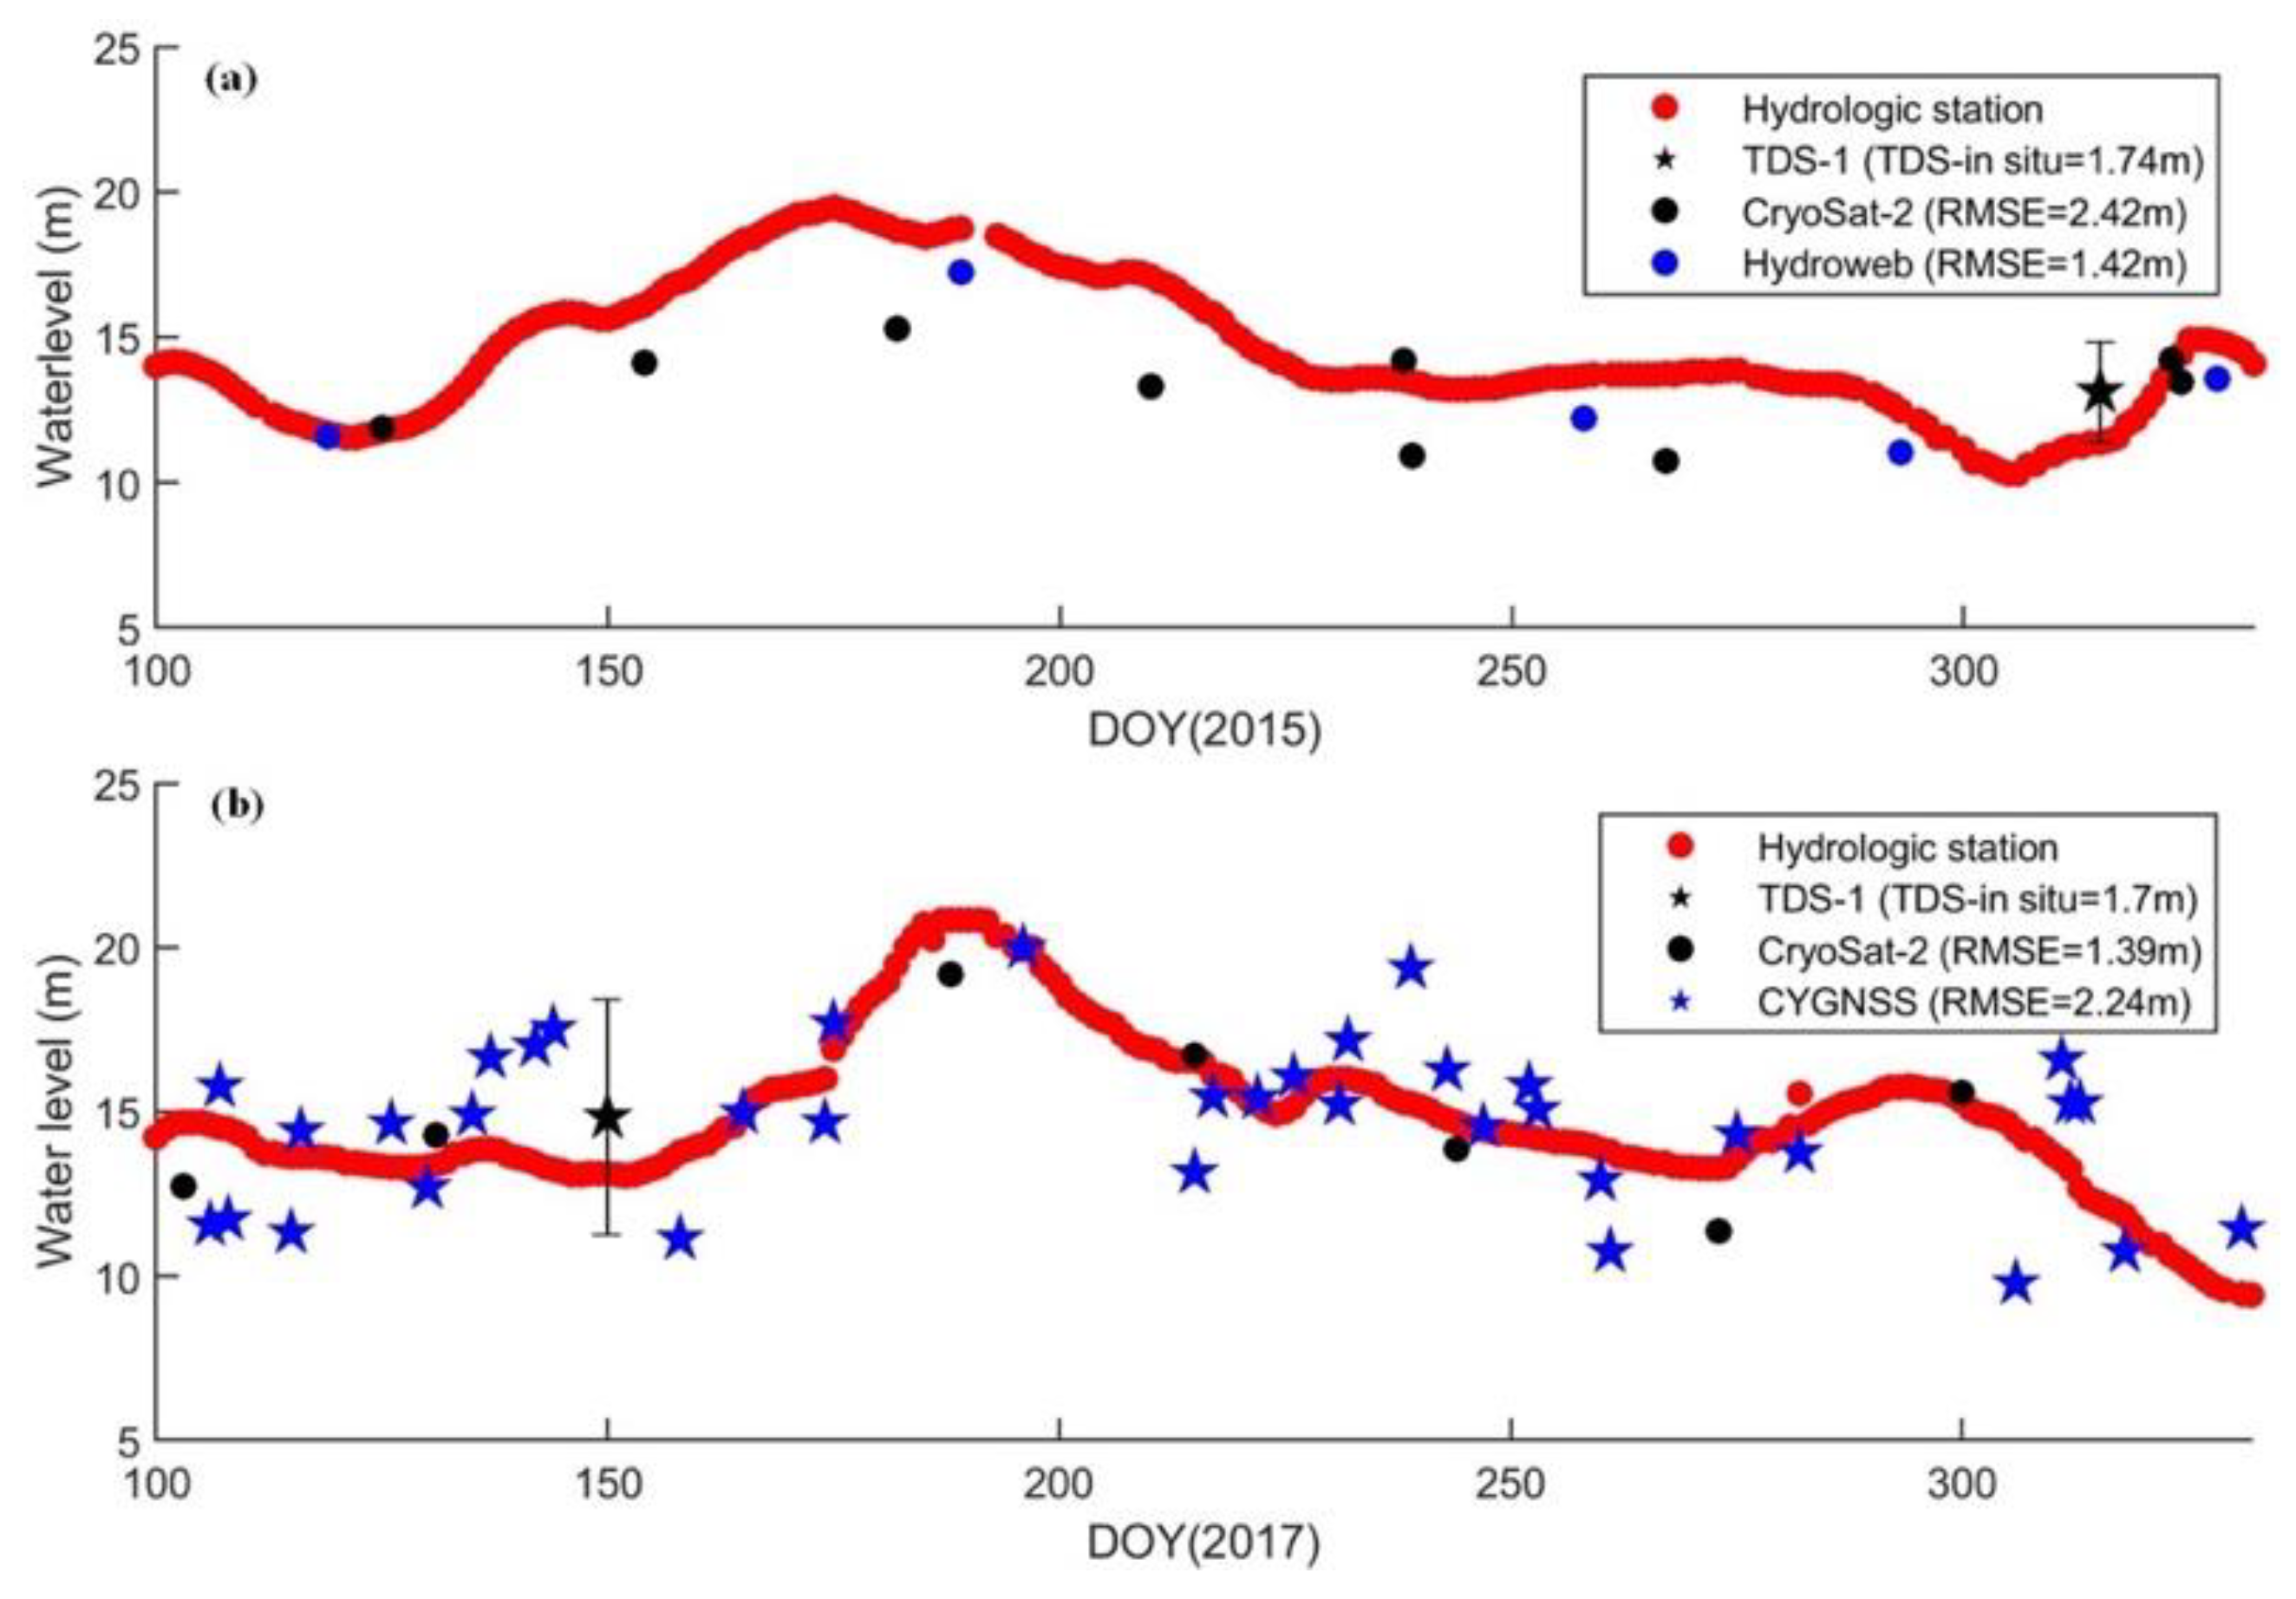
Figure 5 shows water level changes of the Poyang Lake observed by TDS-1, CryoSat-2, Hydroweb, and the hydrologic station in 2015 and 2017. Note that TDS-1 only has one-day lake level due to the strict data filter method (Figure 5a,b). To make the comparison more complete, we additionally involve CYGNSS data from 2017 in Figure 5b to further evaluate the performance of lake level retrieval using the spaceborne GNSS-R technique, since the GNSS-R payloads onboard of CYGNSS and TDS-1 have similar technical parameters. The error bars of TDS-1 in 5(a) and 5(b) show the standard deviations (1.72 m and 3.58 m) of water level values derived from all the specular points located on the lake. The TDS-1/CYGNSS-derived lake level is generally consistent with that derived from other data sources, e.g., the differences between TDS-1 and in situ data are 1.74 m in 2015 and 1.7 m in 2017, and the RMSE of CYGNSS is 2.24 m in 2017 which is of the same order as that of Cryosat-2 (1.39 m). More in situ data should be involved to further evaluate the performance of TDS-1 data for time series analyses.
3.3. Limitations of the Data and Methods
This paper demonstrates the feasibility of using spaceborne GNSS-R data to estimate global lake level, and presents the comparisons with results derived from other altimetry satellites such as CryoSat-2, Jason, and Envisat (the latter two are collected by Hydroweb). Although the consistency found is good, the RMSEs between TDS-1 and other data are quite large (tens of meters). The error sources are identified below.
First, the miscorrected effects in the raw GPS data. The magnitudes of orbit error from GPS and receivers are reported as 1 m and 2.6 m [24]. Atmospheric effects (e.g., ionospheric effect, tropospheric effect) can result in an error as high as 20 m, which is double the error in one-way GNSS links [26]. The spatial variability of the above-mentioned effects on the extent of each lake is a matter of centimeters [27].
Second, poor precision of the TDS-1 L1b data. The L1b data have limited delay resolution (224.3942 ns), limited receiver bandwidth (~2 MHz), and low peak antenna gain (13.3 dB). The mean observed SNR of the reflected signal over lake surface is ~7 dB, which corresponds to a tracking noise of ~10 m standard deviation [24]. Previous studies have suggested that an ideal GNSS-R configuration for altimetry would require high-gain antennas, wideband ranging codes, and a dual-frequency signal tracking strategy, so that the achievable height precision for a 1 s GNSS-R measurement would be in the order of 1 m [28]. Also, the data have noise that affects the DDM waveforms. These issues could lead to an overall error between 3.5 m and 7 m [29]. Better results can be obtained with larger directivity antennas and less noisy receivers [30]. To guarantee sufficient data samples, we filter the data using thresholds which are relatively lower than the SNR (5 dB), the antenna gain (5 dBi) and the elevation angle (30°). These thresholds are not optimal since the SGR-ReSI is not designed for altimetry measurements.
Third, effects from sampling and co-location tolerance. As shown in Figure 4, for large lakes, it is not accurate to use one single value to represent the overall water level without considering the spatial variations. In addition, although the reference of WGS84 ellipsoid is converted to geoid in order to minimize the co-location tolerance, it is not absolutely accurate. The assumed time window tolerance (e.g., the entire summer months) could also lead to the altimetry dispersion, particularly in large lakes.
Finally, uncertainties from the retrieval algorithm. The altimetry precision obtained using the HALF method cannot represent the truly achievable precision [31], since the tracking HALF point only takes the information near the specular point. One 0.25 chip delay increment could correspond to a height increment of 37–50 m [3]. This study uses the same method as that for retrieving sea surface height in [3]. Although the waveform of lake better maintains the specular characteristics than that over sea surface, the accuracy of water level estimates should be affected by the water-land interactions, particularly for lakes that are not large enough. Several theoretical studies predicted that per-second altimetry precision can range from 0.2 to 3 m depending on GNSS-R mission configurations and processing algorithms [23,29,31].
4. Conclusions
In summary, the capability of using spaceborne TDS-1 GNSS reflections to estimate global lake level has been demonstrated for the first time, and the results have been compared with the results from traditional satellite altimeters. Strong correlations (overall R2 greater than 0.95) are observed among lake levels derived from TDS-1, CryoSat-2 and Hydroweb data, with large RMSE (tens of meters) mainly due to the fact that TDS-1 is not dedicated for altimetry measuring purpose. With the launch of NASA’s CYGNSS in 2016, Japan’s WNISAT-1R in 2017, and the plan for several GNSS-R missions dedicated to altimetry applications (e.g., G-TERN [32], Cookie [33], and Pretty [34]), spaceborne GNSS-R data with higher spatial/temporal resolution and higher quality has been (or will be) acquired. This could bring more potential applications in altimetry retrievals. The results in this paper provide supportive information for further designation of GNSS-R constellations to measure altimetry of inland water bodies.
Supplementary Materials
The following are available online at https://www.mdpi.com/2072-4292/11/12/1438/s1, Table S1: Hydroweb data source of the water levels for lakes used in this study.
Author Contributions
Conceptualization, W.W., X.C., and Y.H.; methodology, L.X., W.W., B.L., and S.Z.; validation, L.X. and S.Z.; formal analysis, L.X., W.W., and B.L.; resources, X.C., W.W., and Y.H.; writing—original draft preparation, L.X. and W.W.; writing—review and editing, L.X., W.W., and X.C.; supervision, X.C., W.W., and Y.H.; funding acquisition, X.C., W.W., and Y.H.
Funding
This work is jointly supported by the National Key Research and Development Program of China (Grant No. 2017YFC1500900 and No. 2018YFC1506504), and the National Natural Science Foundation of China (Grant No. 41501360).
Acknowledgments
The authors are grateful to the TDS-1 Team at SSTL (Surrey Satellite Technology Ltd.) for making the data publicly available. The authors appreciate ESA for providing CryoSat-2 data and the Hydroweb website (http://hydroweb.theia-land.fr/) for providing water level data. The authors also appreciate the providers of the open source MATLAB codes used to calculate the global height anomalies between the WGS84 and GGM02C. These are found at http://gps.alaska.edu/jeff/Classes/GEOS602/downloads.html.
Conflicts of Interest
The authors declare no conflict of interest. The funding sponsors had no role in the design of the study, in the collection, analyses, or interpretation of data, in the writing of the manuscript, and in the decision to publish the results.
References
- Wan, W.; Liu, B.; Zeng, Z.; Chen, X.; Wu, G.; Xu, L.; Chen, X.; Hong, Y. Using CYGNSS Data to Monitor China’s Flood Inundation during Typhoon and Extreme Precipitation Events in 2017. Remote Sens. 2019, 11, 854. [Google Scholar] [CrossRef]
- Foti, G.; Gommenginger, C.; Jales, P.; Unwin, M.; Shaw, A.; Robertson, C.; Roselló, J. Spaceborne GNSS reflectometry for ocean winds: First results from the UK TechDemoSat-1 mission. Geophys. Res. Lett. 2015, 42, 5435–5441. [Google Scholar] [CrossRef] [Green Version]
- Clarizia, M.P.; Ruf, C.; Cipollini, P.; Zuffada, C. First spaceborne observation of sea surface height using GPS-Reflectometry. Geophys. Res. Lett. 2016, 43, 767–774. [Google Scholar] [CrossRef]
- Li, W.; Cardellach, E.; Fabra, F.; Rius, A.; Ribó, S.; Martín-Neira, M. First spaceborne phase altimetry over sea ice using TechDemoSat-1 GNSS-R signals. Geophys. Res. Lett. 2017, 44, 8369–8376. [Google Scholar] [CrossRef]
- Rius, A.; Cardellach, E.; Fabra, F.; Li, W.; Ribó, S.; Hernández-Pajares, M. Feasibility of GNSS-R Ice Sheet Altimetry in Greenland Using TDS-1. Remote Sens. 2017, 9, 742. [Google Scholar] [CrossRef]
- Chew, C.; Shah, R.; Zuffada, C.; Hajj, G.; Masters, D.; Mannucci, A.J. Demonstrating soil moisture remote sensing with observations from the UK TechDemoSat-1 satellite mission. Geophys. Res. Lett. 2016, 43, 3317–3324. [Google Scholar] [CrossRef]
- Chew, C.; Reager, J.T.; Small, E. CYGNSS data map flood inundation during the 2017 Atlantic hurricane season. Sci. Rep. 2018, 8, 9336. [Google Scholar] [CrossRef] [PubMed]
- Wan, W.; Zhao, L.; Xie, H.; Liu, B.; Li, H.; Cui, Y.; Ma, Y.; Hong, Y. Lake surface water temperature change over the Tibetan Plateau from 2001–2015: A sensitive indicator of the warming climate. Geophys. Res. Lett. 2018, 45, 11–77. [Google Scholar] [CrossRef]
- Song, C.; Huang, B.; Ke, L.; Richards, K.S. Seasonal and abrupt changes in the water level of closed lakes on the Tibetan Plateau and implications for climate impacts. J. Hydrol. 2014, 514, 131–144. [Google Scholar] [CrossRef]
- Song, C.; Ye, Q.; Sheng, Y.; Gong, T. Combined ICESat and CryoSat-2 Altimetry for Accessing Water Level Dynamics of Tibetan Lakes over 2003–2014. Water 2015, 7, 4685–4700. [Google Scholar] [CrossRef]
- Biancamaria, S.; Andreadis, K.M.; Durand, M.; Clark, E.A.; Rodriguez, E.; Mognard, N.M.; Alsdorf, D.E.; Lettenmaier, D.P.; Oudin, Y. Preliminary Characterization of SWOT Hydrology Error Budget and Global Capabilities. IEEE J. Sel. Top. Appl. Earth Obs. Remote Sens. 2010, 3, 6–19. [Google Scholar] [CrossRef]
- Yu, K.; Rizos, C.; Dempster, A. GNSS-Based Model-Free Sea Surface Height Estimation in Unknown Sea State Scenarios. IEEE J. Sel. Top. Appl. Earth Obs. Remote Sens. 2014, 7, 1424–1435. [Google Scholar] [CrossRef]
- Treuhaft, R.N.; Lowe, S.; Zuffada, C.; Chao, Y. 2-cm GPS altimetry over Crater Lake. Geophys. Res. Lett. 2001, 22, 4343–4346. [Google Scholar] [CrossRef]
- Bai, W.; Sun, Y.; Fu, Y.; Zhu, G.; Du, Q.; Zhang, Y.; Han, Y.; Cheng, C. GNSS-R open-loop difference phase altimetry: Results from a bridge experiment. Adv. Space Res. 2012, 50, 1150–1157. [Google Scholar] [CrossRef]
- Li, W.; Cardellach, E.; Fabra, F.; Ribó, S.; Rius, A. Lake Level and Surface Topography Measured with Spaceborne GNSS-Reflectometry From CYGNSS Mission: Example for the Lake Qinghai. Geophys. Res. Lett. 2018, 45, 13332–13341. [Google Scholar] [CrossRef]
- Jales, P.; Unwin, M. MERRByS Product Manual: GNSS-Reflectometry on TDS-1 with the SGR-ReSI; Surrey Satellite Technology Limited: Guildford, UK, 2016; p. 23. [Google Scholar]
- Zavorotny, V.U.; Voronovich, A.G. Scattering of GPS signals from the ocean with wind remote sensing application. IEEE Trans. Geosci. Remote Sens. 2000, 38, 951–964. [Google Scholar] [CrossRef] [Green Version]
- Crétaux, J.F.; Jelinski, W.; Calmant, S.; Kouraev, A.; Vuglinski, V.; Bergé-Nguyen, M.; Gennero, M.C.; Nino, F.; Abarca Del Rio, R.; Cazenave, A.; et al. SOLS: A lake database to monitor in the Near Real Time water level and storage variations from remote sensing data. Adv. Space Res. 2011, 47, 1497–1507. [Google Scholar] [CrossRef]
- Mayer, V. CryoSat-2 for Hydrological Purposes: Data Processing, Visualization and Analysis. Bachelor’s Thesis, University of Stuttgart, Stuttgart, Germany, 2013. [Google Scholar]
- Lehner, B.; Döll, P. Development and validation of a global database of lakes, reservoirs and wetlands. J. Hydrol. 2004, 296, 1–22. [Google Scholar] [CrossRef]
- Foti, G.; Gommenginger, C.; Unwin, M.; Jales, P.; Tye, J.; Roselló, J. An Assessment of Non-geophysical Effects in Spaceborne GNSS Reflectometry Data from the UK TechDemoSat-1 Mission. IEEE J. Sel. Top. Appl. Earth Obs. Remote Sens. 2017, 10, 3418–3429. [Google Scholar] [CrossRef]
- Garrison, J.L.; Katzberg, S.J. The Application of Reflected GPS Signals to Ocean Remote Sensing. Remote Sens. Environ. 2000, 73, 175–187. [Google Scholar] [CrossRef]
- Cardellach, E.; Rius, A.; Martín-Neira, M.; Fabra, F.; Nogués-Correig, O.; Ribó, S.; Kainulainen, J.; Camps, A.; Addio, S.D. Consolidating the Precision of Interferometric GNSS-R Ocean Altimetry Using Airborne Experimental Data. IEEE Trans. Geosci. Remote Sens. 2014, 52, 4992–5004. [Google Scholar] [CrossRef]
- Mashburn, J.; Axelrad, P.; Lowe, S.T.; Larson, K.M. Global Ocean Altimetry With GNSS Reflections From TechDemoSat-1. IEEE Trans. Geosci. Remote Sens. 2018, 56, 4088–4097. [Google Scholar] [CrossRef]
- Wan, W.; Xiao, P.; Feng, X.; Li, H.; Ma, R.; Duan, H.; Zhao, L. Monitoring lake changes of Qinghai-Tibetan Plateau over the past 30 years using satellite remote sensing data. Chin. Sci. Bull. 2014, 59, 1021–1035. [Google Scholar] [CrossRef]
- Hoque, M.; Jakowski, N. Ionospheric Propagation Effects on GNSS Signals and New Correction Approaches. In Global Navigation Satellite Systems—Signal, Theory and Applications; InTech: Rijeka, Croatia, 2012; pp. 381–426. ISBN 978-953-307-843-4. [Google Scholar]
- Martin-Neira, M.; Addio, S.D.; Buck, C.; Floury, N.; Prieto-Cerdeira, R. The PARIS Ocean Altimeter In-Orbit Demonstrator. IEEE Trans. Geosci. Remote Sens. 2011, 49, 2209–2237. [Google Scholar] [CrossRef]
- Li, Z.; Zuffada, C.; Lowe, S.; Lee, T.; Zlotnicki, V. Analysis of GNSS-R Altimetry for Mapping Ocean Mesoscale Sea Surface Heights Using High-Resolution Model Simulations. IEEE J. Sel. Top. Appl. Earth Obs. Remote Sens. 2016, 9, 4631–4632. [Google Scholar] [CrossRef]
- Zuffada, C.; Li, Z.; Nghiem, S.V.; Lowe, S.; Shah, R.; Clarizia, M.P.; Cardellach, E. The rise of GNSS reflectometry for Earth remote sensing. In Proceedings of the 2015 IEEE International Geoscience and Remote Sensing Symposium (IGARSS), Milan, Italy, 26–31 July 2015; pp. 5111–5114. [Google Scholar]
- Camps, A.; Park, H.; Domènech, E.V.i.; Pascual, D.; Martin, F.; Rius, A.; Ribo, S.; Benito, J.; Andrés-Beivide, A.; Saameno, P.; et al. Optimization and Performance Analysis of Interferometric GNSS-R Altimeters: Application to the PARIS IoD Mission. IEEE J. Sel. Top. Appl. Earth Obs. Remote Sens. 2014, 7, 1436–1451. [Google Scholar] [CrossRef]
- Li, W.; Rius, A.; Fabra, F.; Cardellach, E.; Ribó, S.; Martín-Neira, M. Revisiting the GNSS-R Waveform Statistics and Its Impact on Altimetric Retrievals. IEEE Trans. Geosci. Remote Sens. 2018, 56, 2854–2871. [Google Scholar] [CrossRef]
- Cardellach, E.; Wickert, J.; Baggen, R.; Benito, J.; Camps, A.; Catarino, N.; Chapron, B.; Dielacher, A.; Fabra, F.; Flato, G.; et al. GNSS Transpolar Earth Reflectometry exploriNg System (G-TERN): Mission Concept. IEEE Access 2018, 6, 13980–14018. [Google Scholar] [CrossRef]
- Martín-Neira, M.; Li, W.; Andrés-Beivide, A.; Ballesteros-Sels, X. “Cookie”: A Satellite Concept for GNSS Remote Sensing Constellations. IEEE J. Sel. Top. Appl. Earth Obs. Remote Sens. 2016, 9, 4593–4610. [Google Scholar] [CrossRef]
- Høeg, P.; Fragner, H.; Dielacher, A.; Zangerl, F.; Koudelka, O.; Høeg, P.; Wickert, J. PRETTY: Grazing altimetry measurements based on the interferometric method. In Proceedings of the 5th Workshop on Advanced RF Sensors and Remote Sensing Instruments, ARSI’17, Noordwijk, The Netherlands, 12–14 September 2017. [Google Scholar]
Figure 1.
Global lakes (area greater than 500 km2 and elevation lower than 3000 m each) used for water level retrieval in this study. There are 351 lakes (blue solid circles), with 284 in the Northern hemisphere and 67 in the Southern hemisphere. Red solid triangles represent the overlapped 89 lakes in the Hydroweb data. All the lakes are overlapped with the Cryosat-2 data.

Figure 2.
Principle of lake water level measurement using TechDemoSat-1 (TDS-1) data. (a) Geometry of lake water level measurement. The solid reflected line minus the direct path is , and the dotted reflected line minus the direct path is ; (b) calculation of the observed time delay. represents the delay of the delay-Doppler map (DDM) window and represents the delay of the specular point within the DDM window.

Figure 3.
Correlations of TDS-derived lake level with that from CryoSat-2 and Hydroweb data during the summers of 2015 and 2016. (a1) TDS-1 vs CryoSat-2 in 2015; (a2) TDS-1 vs Hydroweb in 2015; (b1) TDS-1 vs CryoSat-2 in 2016; (b2) TDS-1 vs Hydroweb in 2016.
Figure 3.
Correlations of TDS-derived lake level with that from CryoSat-2 and Hydroweb data during the summers of 2015 and 2016. (a1) TDS-1 vs CryoSat-2 in 2015; (a2) TDS-1 vs Hydroweb in 2015; (b1) TDS-1 vs CryoSat-2 in 2016; (b2) TDS-1 vs Hydroweb in 2016.

Figure 4.
Spatial distributions of water level with respect to WGS84 ellipsoid over the Caspian Sea. (a) Map of three TDS-1 tracks for the Caspian Sea from 06/07/2015 (red), 08/08/2016 (green), and 06/11/2017 (blue), respectively. The background map shows the spatial variations of water levels observed by CryoSat-2 in 2015; (b–d) spatial variations of water levels observed by the corresponding TDS-1 tracks in (a), with CryoSat-2 derived water levels of the same year as a contrast.

Figure 5.
Water level changes of the Poyang Lake observed by (a) TDS-1, CryoSat-2, Hydroweb, and the hydrologic station in 2015, and (b) TDS-1, CryoSat-2, and the hydrologic station in 2017.
Figure 5.
Water level changes of the Poyang Lake observed by (a) TDS-1, CryoSat-2, Hydroweb, and the hydrologic station in 2015, and (b) TDS-1, CryoSat-2, and the hydrologic station in 2017.

© 2019 by the authors. Licensee MDPI, Basel, Switzerland. This article is an open access article distributed under the terms and conditions of the Creative Commons Attribution (CC BY) license (http://creativecommons.org/licenses/by/4.0/).
Share and Cite
MDPI and ACS Style
Xu, L.; Wan, W.; Chen, X.; Zhu, S.; Liu, B.; Hong, Y. Spaceborne GNSS-R Observation of Global Lake Level: First Results from the TechDemoSat-1 Mission. Remote Sens. 2019, 11, 1438. https://doi.org/10.3390/rs11121438
AMA Style
Xu L, Wan W, Chen X, Zhu S, Liu B, Hong Y. Spaceborne GNSS-R Observation of Global Lake Level: First Results from the TechDemoSat-1 Mission. Remote Sensing. 2019; 11(12):1438. https://doi.org/10.3390/rs11121438
Chicago/Turabian StyleXu, Liwen, Wei Wan, Xiuwan Chen, Siyu Zhu, Baojian Liu, and Yang Hong. 2019. "Spaceborne GNSS-R Observation of Global Lake Level: First Results from the TechDemoSat-1 Mission" Remote Sensing 11, no. 12: 1438. https://doi.org/10.3390/rs11121438
Note that from the first issue of 2016, this journal uses article numbers instead of page numbers. See further details here.