Spatial and Temporal Variability in the Onset of the Growing Season on Svalbard, Arctic Norway — Measured by MODIS-NDVI Satellite Data

Abstract
: The Arctic is among the regions with the most rapid changes in climate and has the expected highest increase in temperature. Changes in the timing of phenological phases, such as onset of the growing season observed from remote sensing, are among the most sensitive bio-indicators of climate change. The study area here is the High Arctic archipelago of Svalbard, located between 76°30′ and 80°50′N. The goal of this study was to use MODIS Terra data (the MOD09Q1 and MOD09A1 surface reflectance products, both with 8-day temporal composites) to map the onset of the growing season on Svalbard for the 2000–2013 period interpreted from field observations. Due to a short and intense period with greening-up and frequent cloud cover, all the cloud free data is needed, which requires reliable cloud masks. We used a combination of three cloud removing methods (State QA values, own algorithms, and manual removal). This worked well, but is time-consuming as it requires manual interpretation of cloud cover. The onset of the growing season was then mapped by a NDVI threshold method, which showed high correlation (r2 = 0.60, n = 25, p < 0.001) with field observations of flowering of Salix polaris (polar willow). However, large bias was found between NDVI-based mapped onset and field observations in bryophyte-dominated areas, which indicates that the results in these parts must be interpreted with care. On average for the 14-year period, the onset of the growing season occurs after July 1st in 68.4% of the vegetated areas of Svalbard. The mapping revealed large variability between years. The years 2000 and 2008 were extreme in terms of late onset of the growing season, and 2002 and 2013 had early onset. Overall, no clear trend in onset of the growing season for the 2000–2013 period was found.1. Introduction
The Arctic is among the regions with the most rapid changes in climate and has the expected highest increase in temperature [1]. On the western parts of the Arctic archipelago Svalbard, the projected average annual temperature at the end of this century is projected to increase by 3–4 °C as compared with the present climate, and by 4–8 °C in the northeastern parts [2]. Changes in the growing season are among the best bio-indicators of changes in climate, both at species and at aggregated levels [3–5]. The timing of the onset of the growing season influences the growth, seed production, and competition between plants, and could be among the first indication of changes in the vegetation cover [6]. Changes in the length of the season also influences the feedback to the climate system, by changes in seasonal albedo and CO2 catchment [7,8] and it might lead to implications for trophic interactions with insect pollinators [9]. Hence, the importance of phenological research for understanding the consequences of global environmental change on vegetation is indisputable [10].
A phenological observation site in Zackenberg, northeast Greenland, shows an increase of about 10 days in flowering during the 1995–2011 period [11,12]. However, only a few observation sites with long time series of the growing season exist in the Arctic. Hence, not much is known about the spatial patterns or long-term trends in the terrestrial growing season on Svalbard or elsewhere in the Arctic. On Svalbard, only a few phenological studies have been carried out [13,14] and from these point observations it is difficult to detect long-term trends and spatial variability in the archipelago. Carrying out field phenological observations is tedious and expensive, and full coverage of all regions can never be obtained. Satellite image aided analysis of phenology provides a spatially complete coverage that can be used to interpolate traditional ground-based phenological observations. Several remote sensing based studies indicate earlier onset of the growing season in the Northern Hemisphere during the last decades [15–22], but none of these studies used phenological field data from the High Arctic for validation. Hence, the spatial pattern and trends needs to be validated. Remote sensing-based mapping of the growing season in the Arctic zone is a challenging task. This is due to the huge local differences created by local topography, snow cover and hydrology, which could lead to onset of flowering on a ridge several weeks earlier than in a snow-bed a few meters away. Most of the satellite sensors with high revisit rate that are available today have insufficient spatial resolution to detect this variability, hence this has to be considered when establishing field validation sites. Frequent cloud cover, short season, and weak response in NDVI from the often scattered vegetation cover further increase the challenges.
The aim of this study was to develop methods for using MODIS satellite data to map the onset of the growing season on Svalbard for the 2000–2013 period, interpreted in the light of field observations. In 2009 we established field observation sites, with observation on a spatial and temporal scale, which could be compared with MODIS data. For the satellite imagery we used a semi-automatic method for detecting the cloud clover and interpolated for cloudy pixels. We mapped the onset of the growing season by a NDVI threshold method, and finally, we analyzed the trends, and the temporal and spatial variability in the mapped onset of the growing season.
2. Materials and Methods
2.1. Study Area
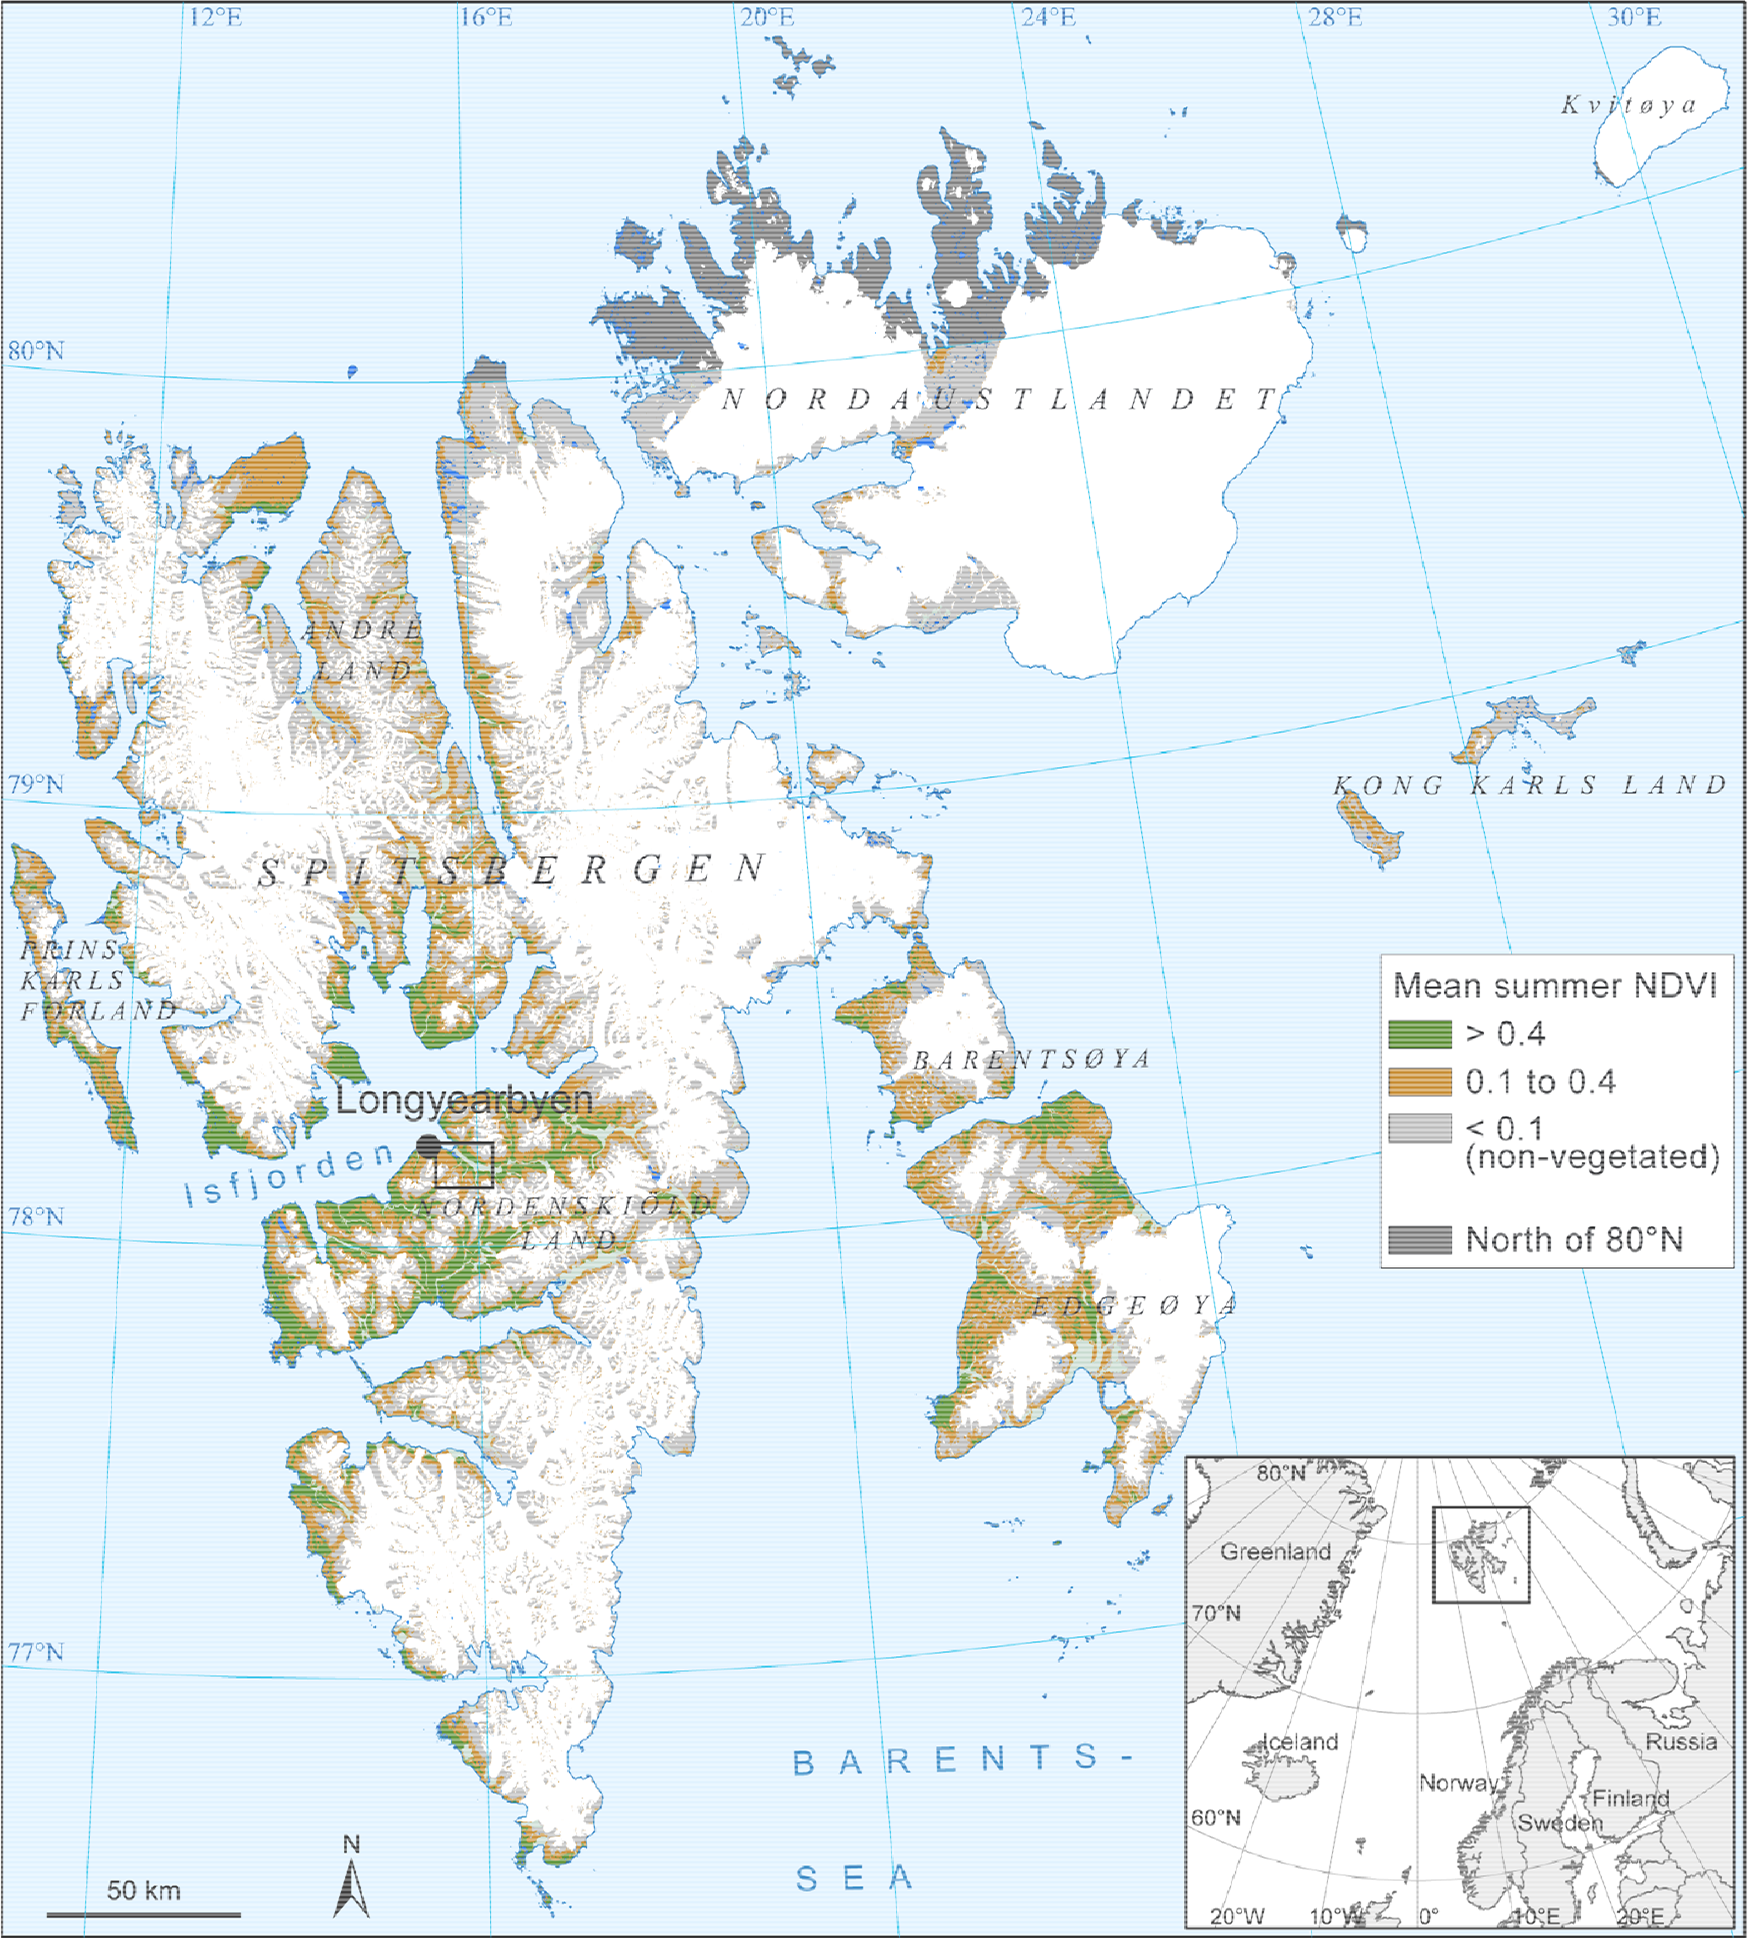
The High Arctic archipelago of Svalbard is located between 76°30′–80°50′N and 10°30′–34°45′E (Figure 1). The total area is about 62,000 km2. The main island is Spitsbergen, with four neighboring large islands (Prins Karls Forland, Edgeøya, Barentsøya, Nordaustlandet) and several small islands in addition. The western part is influenced by a mild ocean current from the south, and the eastern side by a cold current from the north. Glaciers dominate on most of the islands and cover more than 60% of the land area. The largest ice-free areas are found on the André Land and Nordenskiöld Land peninsulas in central parts of Spitsbergen. These are also the areas with the highest summer temperatures, although climatic data are only available from the latter. The meteorological station Svalbard Lufthavn, close to the administration center Longyearbyen (Figure 1), shows a mean July air temperature of 7.0 °C during 2000–2013 [23]. Annual mean air temperature in the same period was −3.7 °C, and annual mean precipitation was 192 mm.
About 170 vascular plant, 373 bryophyte [24] and 923 lichen species, including lichenicolous fungi [25,26] are known from the archipelago. Approximately half of the ice-free area is without vegetation, and the largest areas with dense vegetation cover are also found in the central parts [27]. Vegetation is diverse [28] and includes closed tundra, fens, mires and even high-arctic steppes in the warmest parts, vegetation with intermediate cover along the western coast and mostly polar desert vegetation in the coldest areas [29]. In the cold eastern islands Edgeøya and Barentsøya, long-term reindeer grazing probably explains why polar desert vegetation has developed with bryophyte dominance over large areas [29,30].
2.2. Phenological In-Situ Data
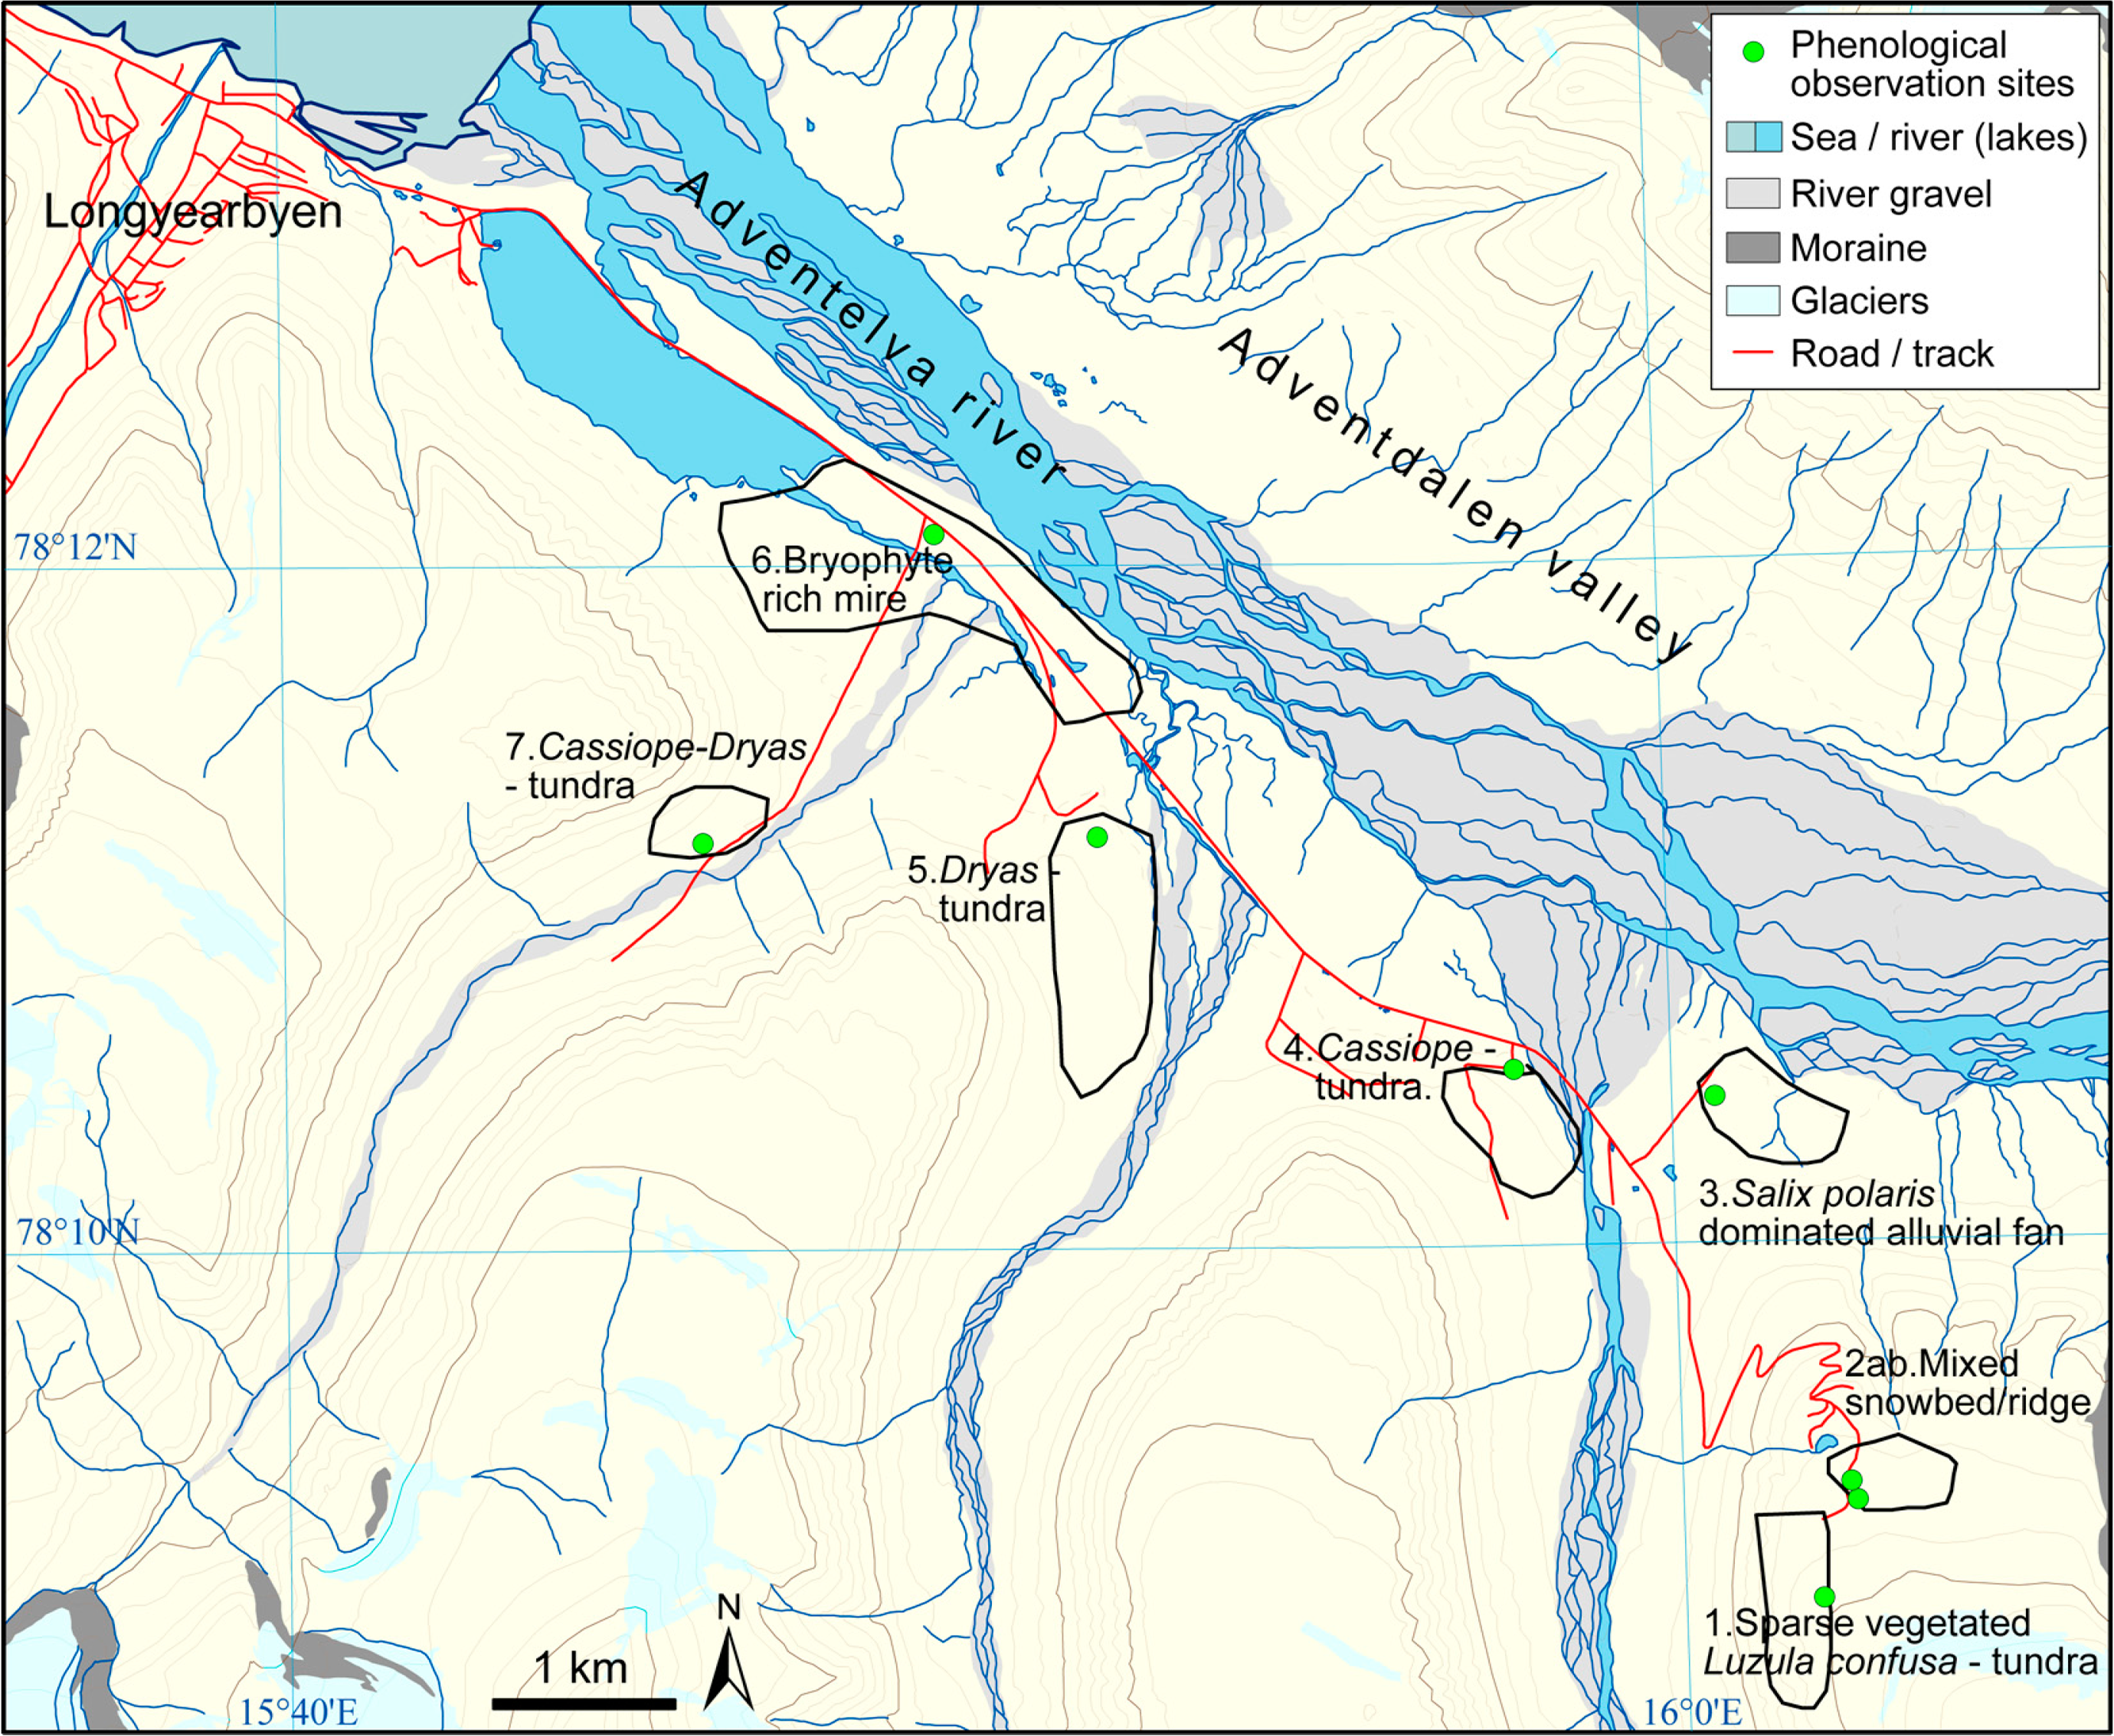
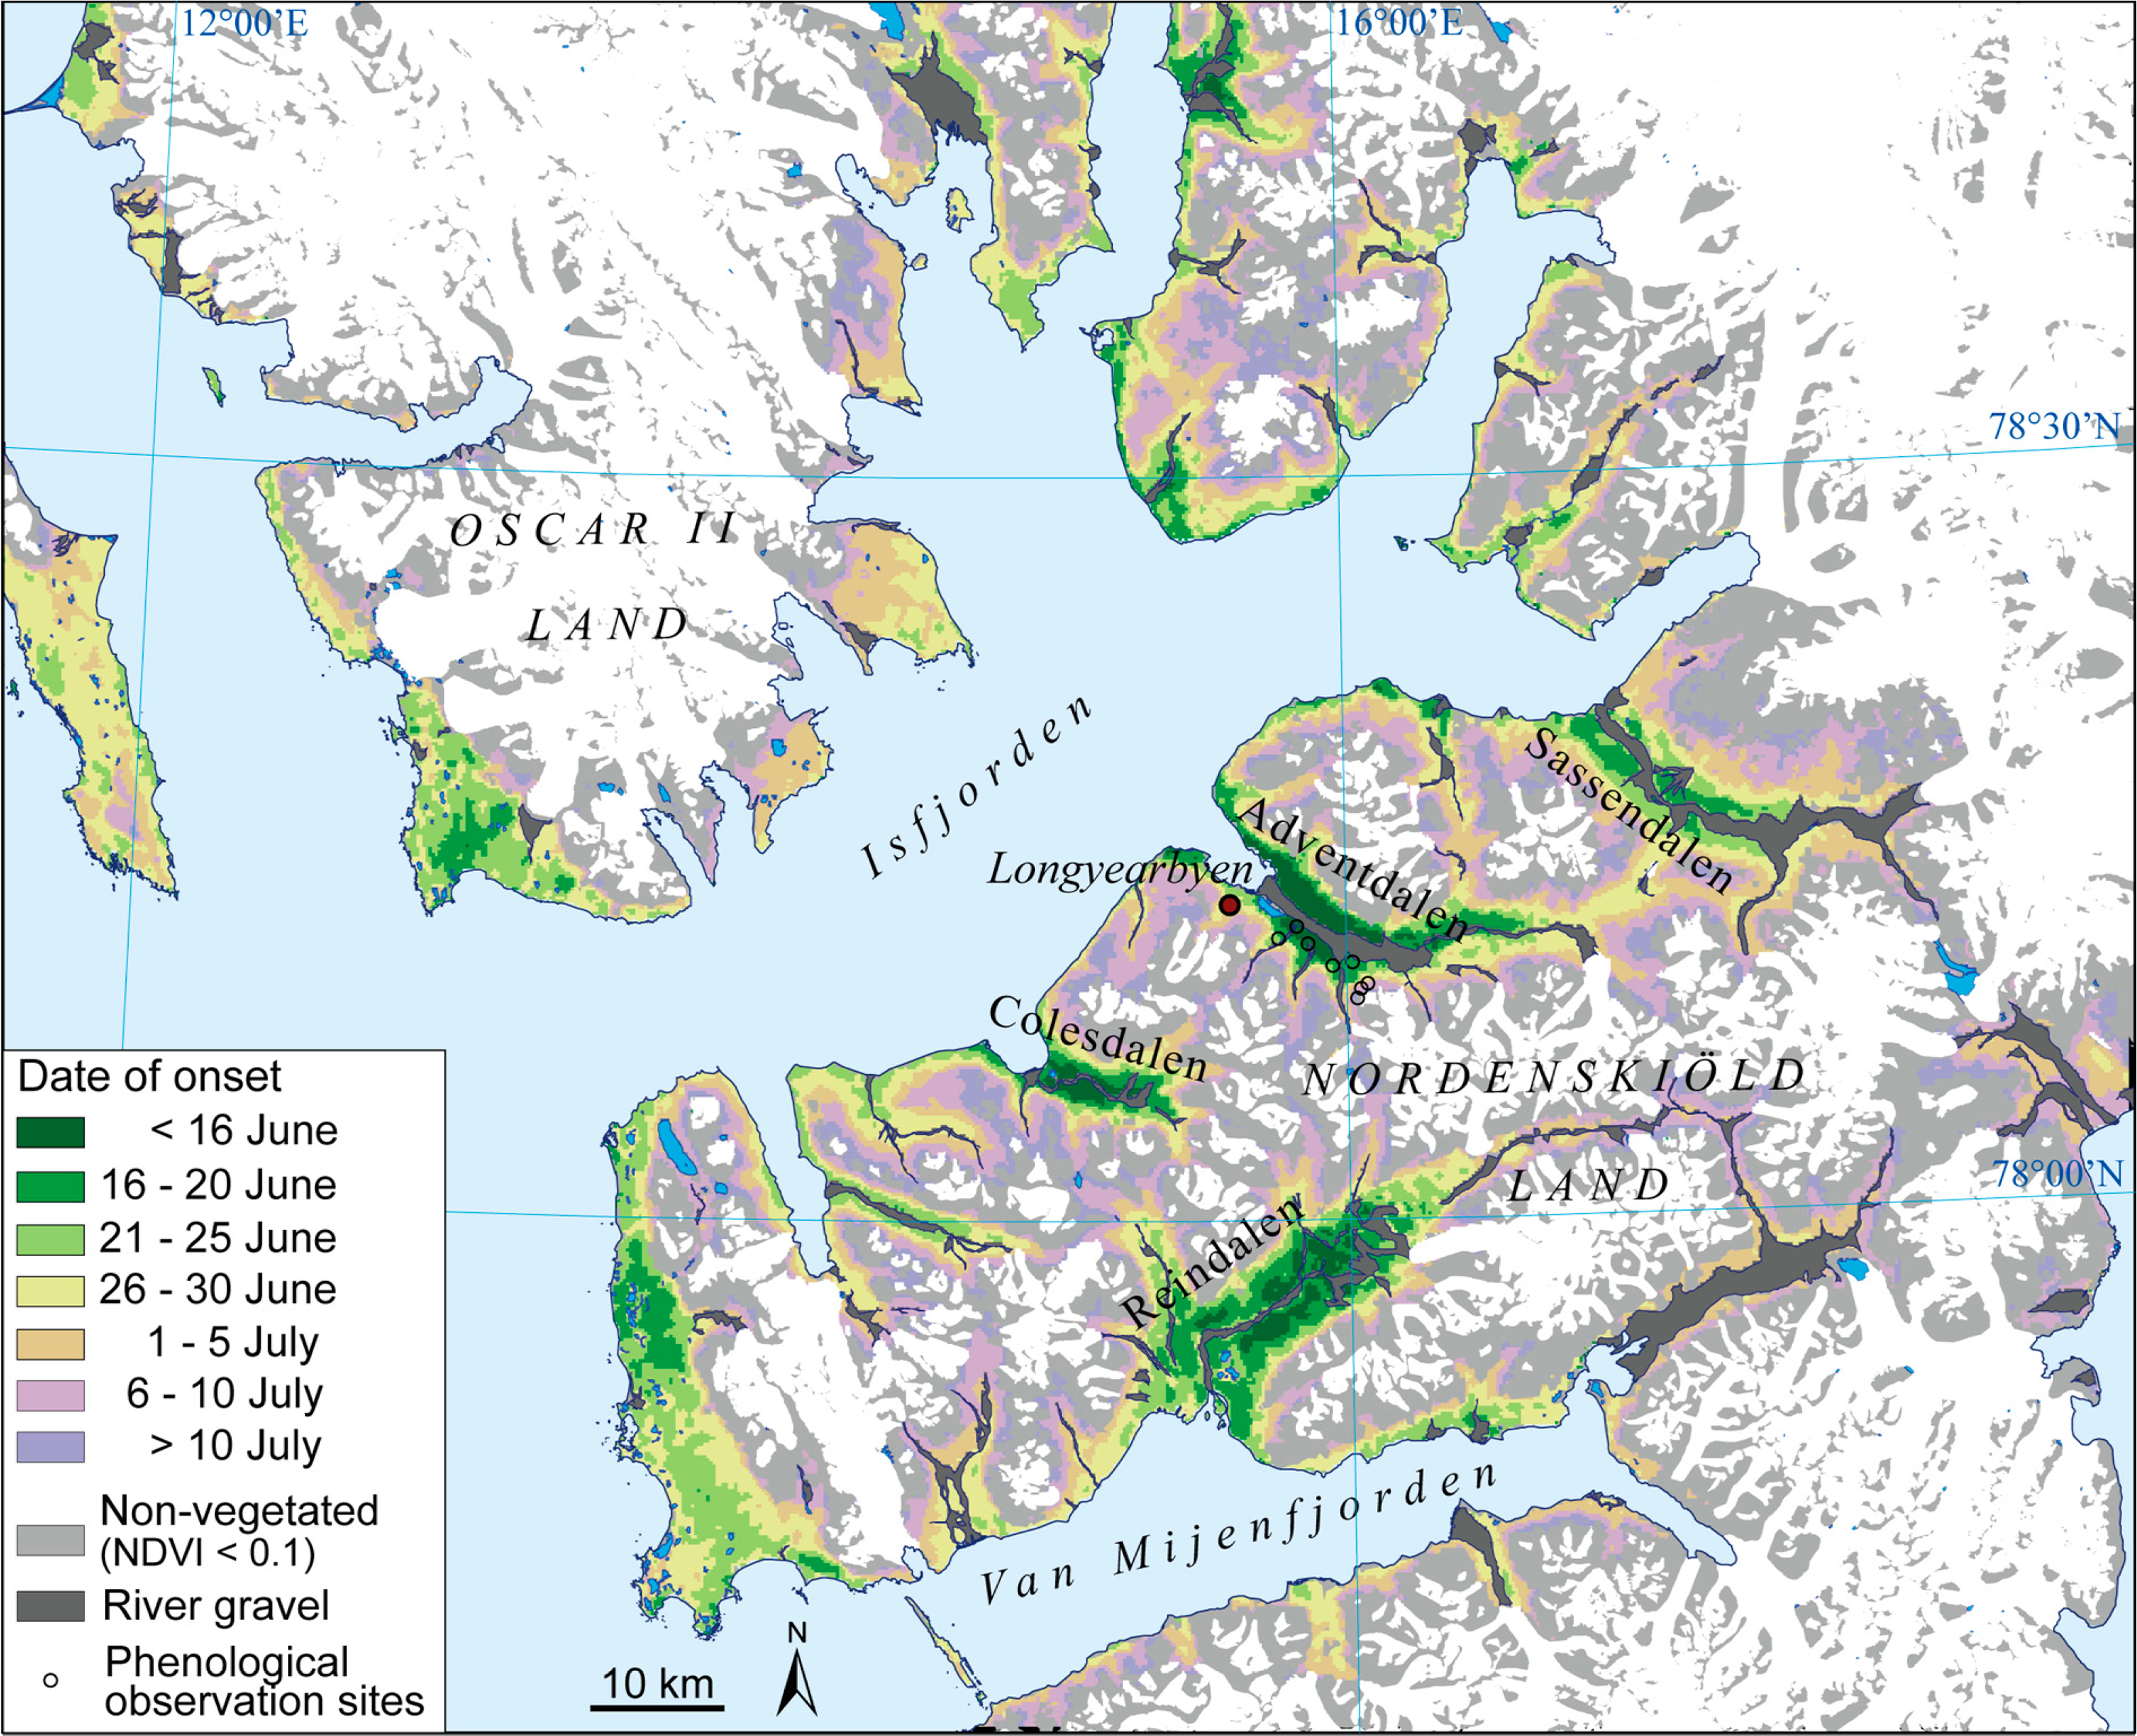
Phenological field observation sites close to the administration center Longyearbyen were established in 2009. The observation sites are designed to detect the phenological variation in the Adventdalen valley and on a nearby mountain plateau. First we located large areas with a dominating vegetation type, by using a Landsat TM based vegetation map [27], and drew polygons surrounding these areas. Then we used MODIS-NDVI data to adjust these polygons, by avoiding pixels with to deviating NDVI values. Seven polygons were selected, five in the valley floor and two on a mountain plateau (400–500 m a.s.l.) (Figure 2). The polygons in the valley floor represent the main land cover types, both in areas with early (ridges) and late (snowbeds) onset of the growing season. By field survey, both in spring and summer, we selected a representative observation site within each polygon. On the mountain plateau, mixed snowbed/ridge areas include observations on both the ridge and the snowbed, and where the mean dates of these observations are used (site 2ab on Figure 2). The mountain plateau also includes an observation site with scattered vegetation cover (Luzula confusa tundra).
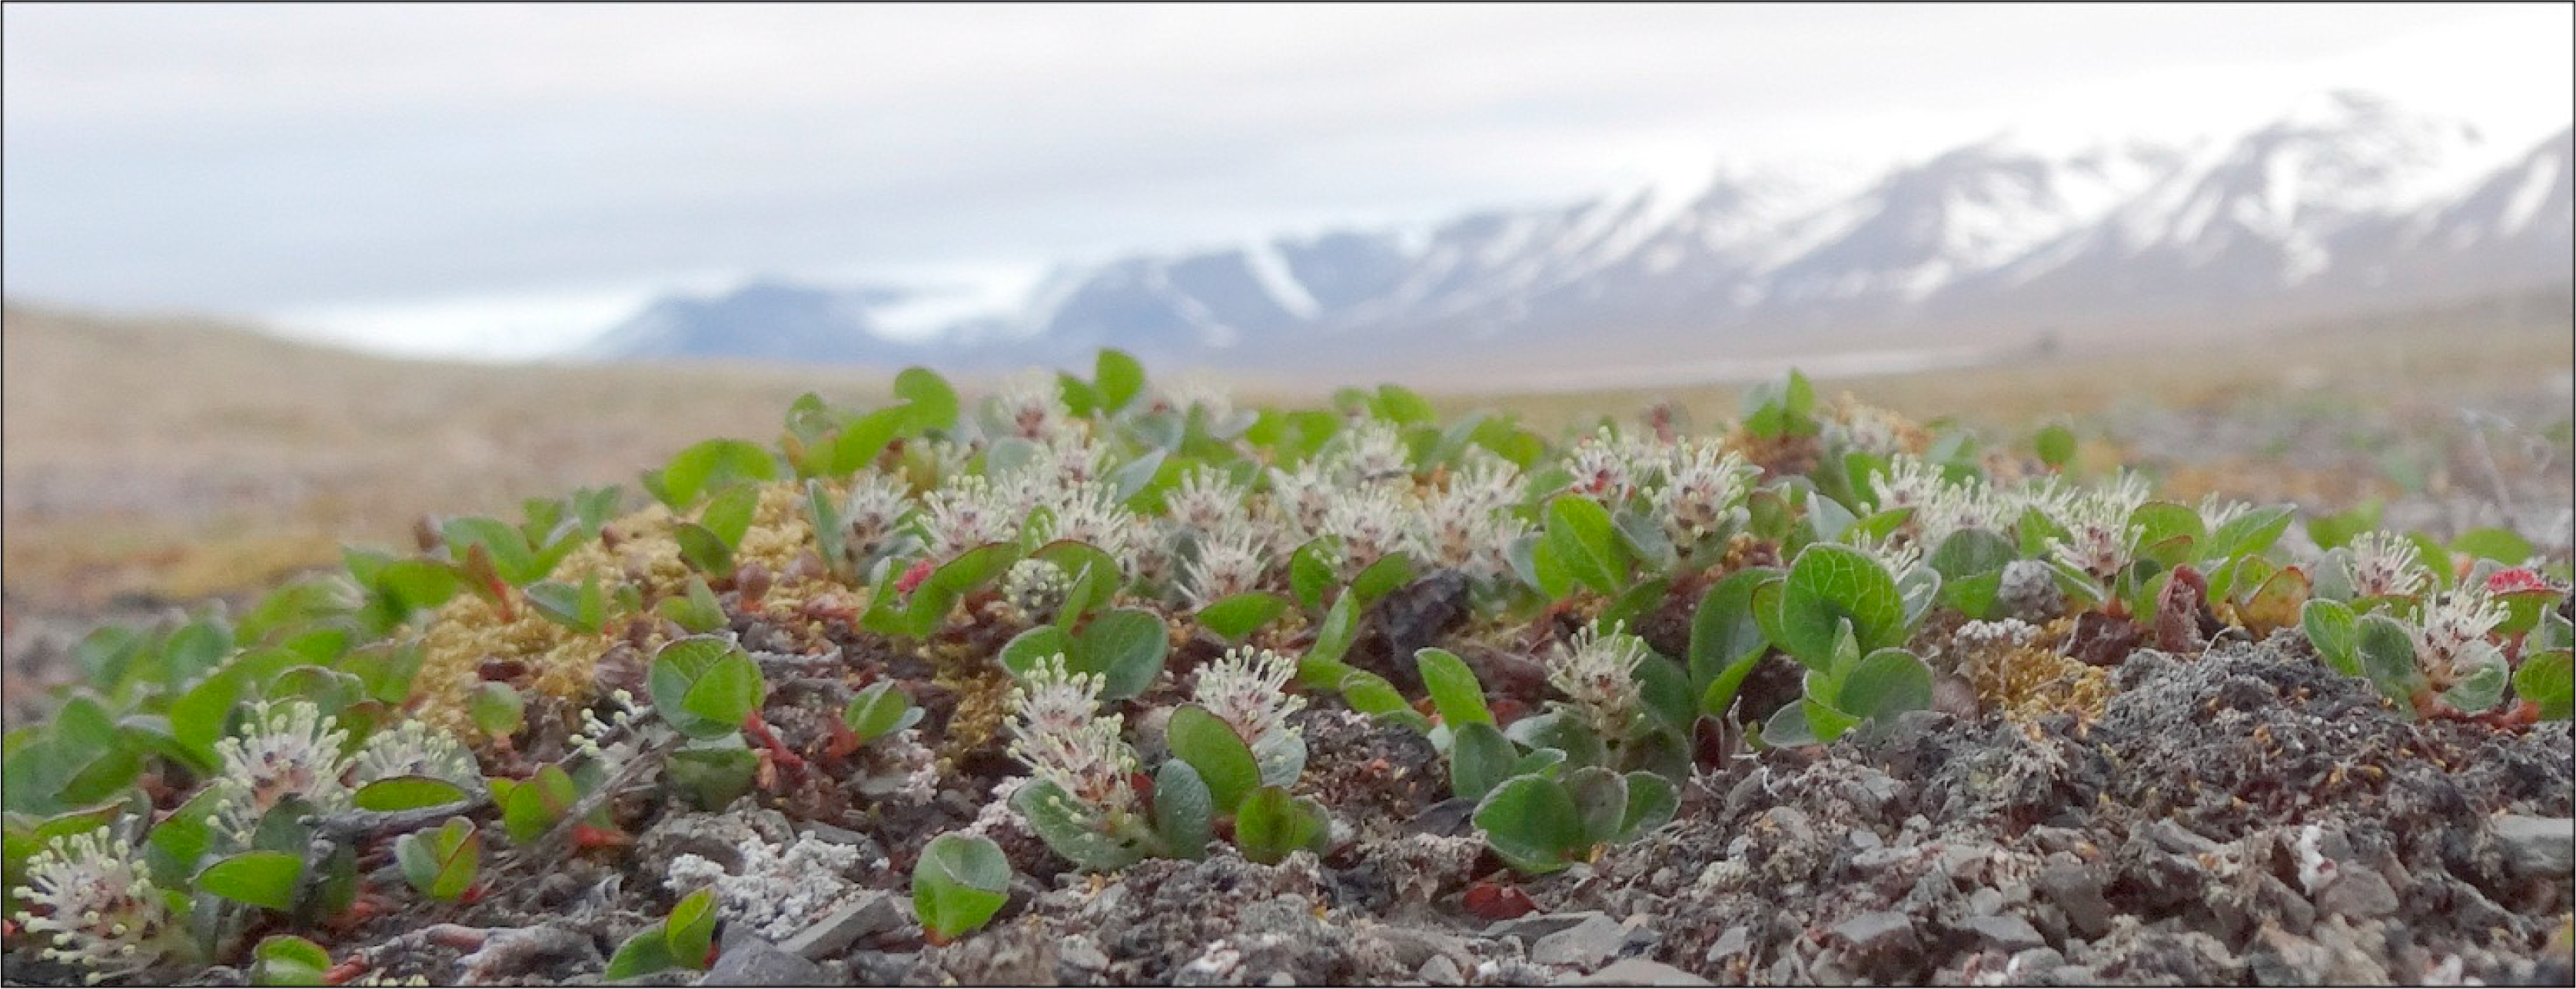
The first flowering and general flowering of 13 vascular plant species are recorded. The recordings are estimated averages within 0.8 × 0.8 m2 plots at all sites, except the Luzula confuza tundra desert site where 5 × 5 m2 is used due to scattered vegetation cover. Only a few of the 13 species were found at each site, and only Salix polaris (polar willow) is found at all sites. Hence, to compare with MODIS data we used the observations of general flowering of catkins of Salix polaris (Figure 3), and the recording of the other species only as references. Trained personnel at the Norwegian Polar Institute in Longyearbyen do the registration weekly from about 10 June to 5 September every year. From the year 2012, the observations were supplemented with photos, which were interpreted after the end of the season.
In this study we defined the onset of the growing season as general flowering of catkins of Salix polaris (Figure 3). This species is among the most common vascular species on Svalbard, occurs in most habitats, and the flowering is easily recorded and occurs only a few days after the leaves are unfolded. Hence, from a distance this is often seen as a greening of the vegetation, where this species is common.
2.3. Processing MODIS Data—Cloud Removal and Interpolation
Two MODIS Terra products, both with 8-day temporal composites, were used. The MOD09A1 product with surface reflectance values for bands 1–7 at 500 m resolution, were used to extract information about the cloud cover, and the MOD09Q1 product with surface values for bands 1 and 2 at 250 m resolution, were used to calculate NDVI values. Both datasets were processed for the 2000–2013 period, and reprojected to the UTM Zone 33N projection. Both these datasets have data only south of 80°N, hence the northernmost area of the archipelago is not covered.
Frequent fog and clouds, snow and ice, short growing season, and often weak response from the vegetation characterize Svalbard, and makes cloud detection on the archipelago a challenging task.
Product quality assessment (QA) and validation are integral parts of the MODIS Land product generation process. The QA flags in the MOD09A1 product give information about different types of atmospheric noise. For each 8-day period we made a visual quality control in ArcGIS, of which of the different State QA values detected the cloud cover in each 8-day period. In most cases, one of the State QA values or a combination of the State QA values, detect the clouds in the data covering Svalbard. However, this was not always the case, as it depends on the cloud type, time of the season, and type of land cover. In particular, detection of cloud shadows and clouds over sparsely vegetated areas sometimes fails. Therefore we also applied our own cloud detection algorithms, as for instance the algorithm: The value of band 2 (NIR) for a given pixel is compared to its median value for that pixel in the 2000–2013 period, and values less than 30% of the median indicate cloud shadows covering vegetated areas. In a few cases, none of the State QA values or our own cloud algorithms were able to detect the noise in the data. In these cases, we manually masked out the noisy parts by drawing polygons around them. Altogether we have 15 different combinations of using State QA values/own algorithms/manual masking in the cloud detection. For each of these combinations we developed a python script to remove the clouds. Hence, after visually evaluating each 8-day composite, we chose one of the 15 python scripts, which then automatically removed the noisy part of the composite. This is time-consuming work, but it is only done once and ensures that most of the noise in the datasets is removed and that most of the noise-free data is retained.
After removing the clouds from the dataset, the next step was to replace the cloudy pixels with values as realistic as possible. First we resampled the cloud mask to 250 m to fit the MOD09Q1 resolution. Then we calculated NDVI from the MOD09Q1 dataset, and removed the clouds with the cloud mask. From this clear-sky time-series of NDVI data we calculated a 14-year median NDVI value for each 8-day period for the 2000–2013 period. We then used temporal information by considering cloud information in 8-day periods forwards and backwards. If the cloudy pixel had cloud free pixel in both the period before and after, we replaced the cloudy pixel with the mean values from before and after. If the period before was cloudy we used the 14-year median values from that period and the value for the period after, and calculated the mean values as the replacement for the cloudy pixel. If it was cloudy in the actual period, and both the period before and after, we replaced the cloudy pixel with the 14-year median value. This resulted in a preliminary cloud-corrected version of the NDVI dataset with interpolated values. However, this version of the dataset had many interpolated values, which we wanted to reduce the importance of, in particular if information from previous years was used. Hence, on the dataset with interpolated values we applied the Savitzky-Golay filter with down-weighting of the interpolated values, using the TIMESAT software [31,32]. If mean values from periods before and after were used, we down-weighted to 0.9, if some/all information from previous years were used we down-weighted to 0.7 and 0.4, respectively. This curve-fitting ensures less importance of the interpolated values, and avoids too high values for interpolated values.
2.4. Mapping the Growing Season
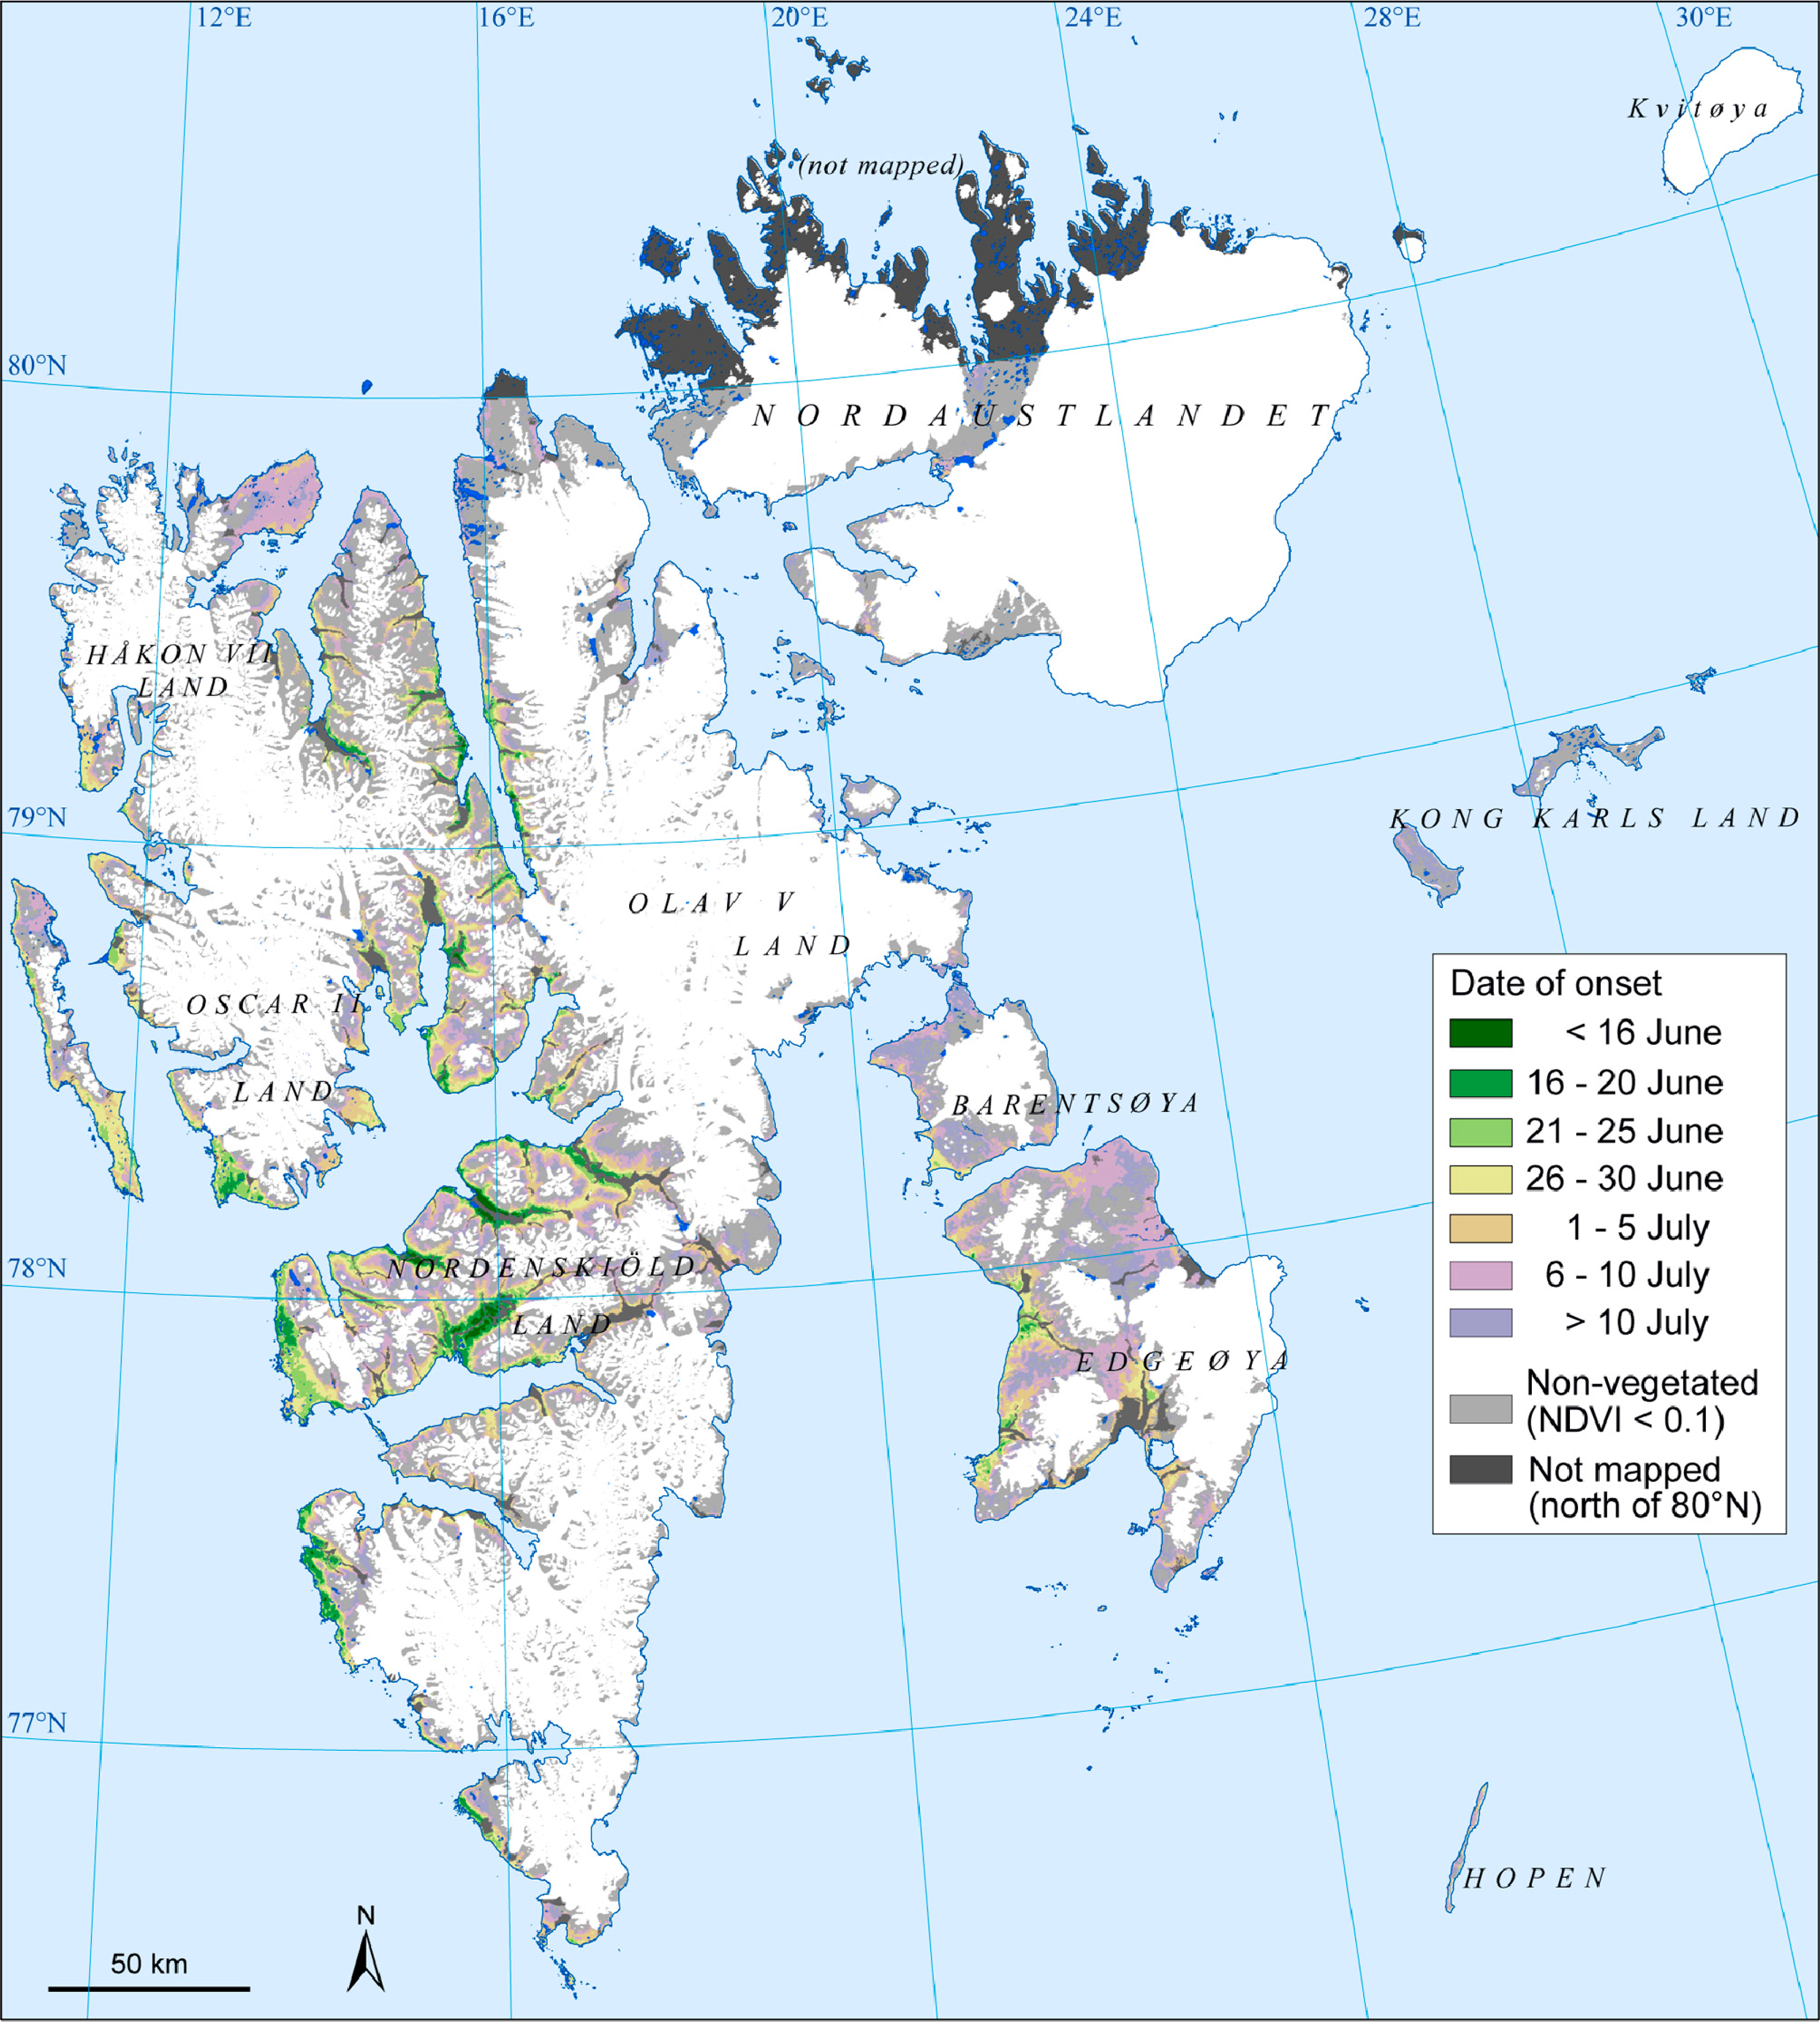
To map the onset of the growing season we used the time-series of the cloud-corrected, interpolated and filtered NDVI values. The mean NDVI values were calculated for a polygon (representing a dominating land cover types) on each of the phenological observations sites (Figure 2). To link surface phenology with NDVI data in order to measure the onset of the growing season, we computed for every pixel in the study area the 14-year (2000–2013) mean NDVI value for the 4 July to 3 August period. The use of only NDVI values between 4 July and 3 August reduced the “noise” from snow-covered ground. The onset of the growing season at each pixel was then defined by the time when the NDVI value each year exceeded 70% of the 4 July to 3 August 14-year mean NDVI value. This NDVI threshold level was reached after several iterations, and is the level that gives the highest correlation with general flowering of Salix polaris. Variants of this method have earlier been applied in Fennoscandia [33–36]. Areas with 14-year mean NDVI values below 0.1 for the 4 July to 3 August period have too weak response in vegetation cover to be mapped, and are masked out as “non-vegetated” (Figure 1).
Finally, maps that show the 14-year mean (2000–2013) date for onset of the growing season, trends and annual deviations were produced. To improve the cartographic presentation of the mean onset of the growing season and the trend, a 3 × 3 median filter was applied on the maps, and a 5 × 5 median filter on the deviation maps.
3. Results
3.1. Timing of the Onset of the Growing Season
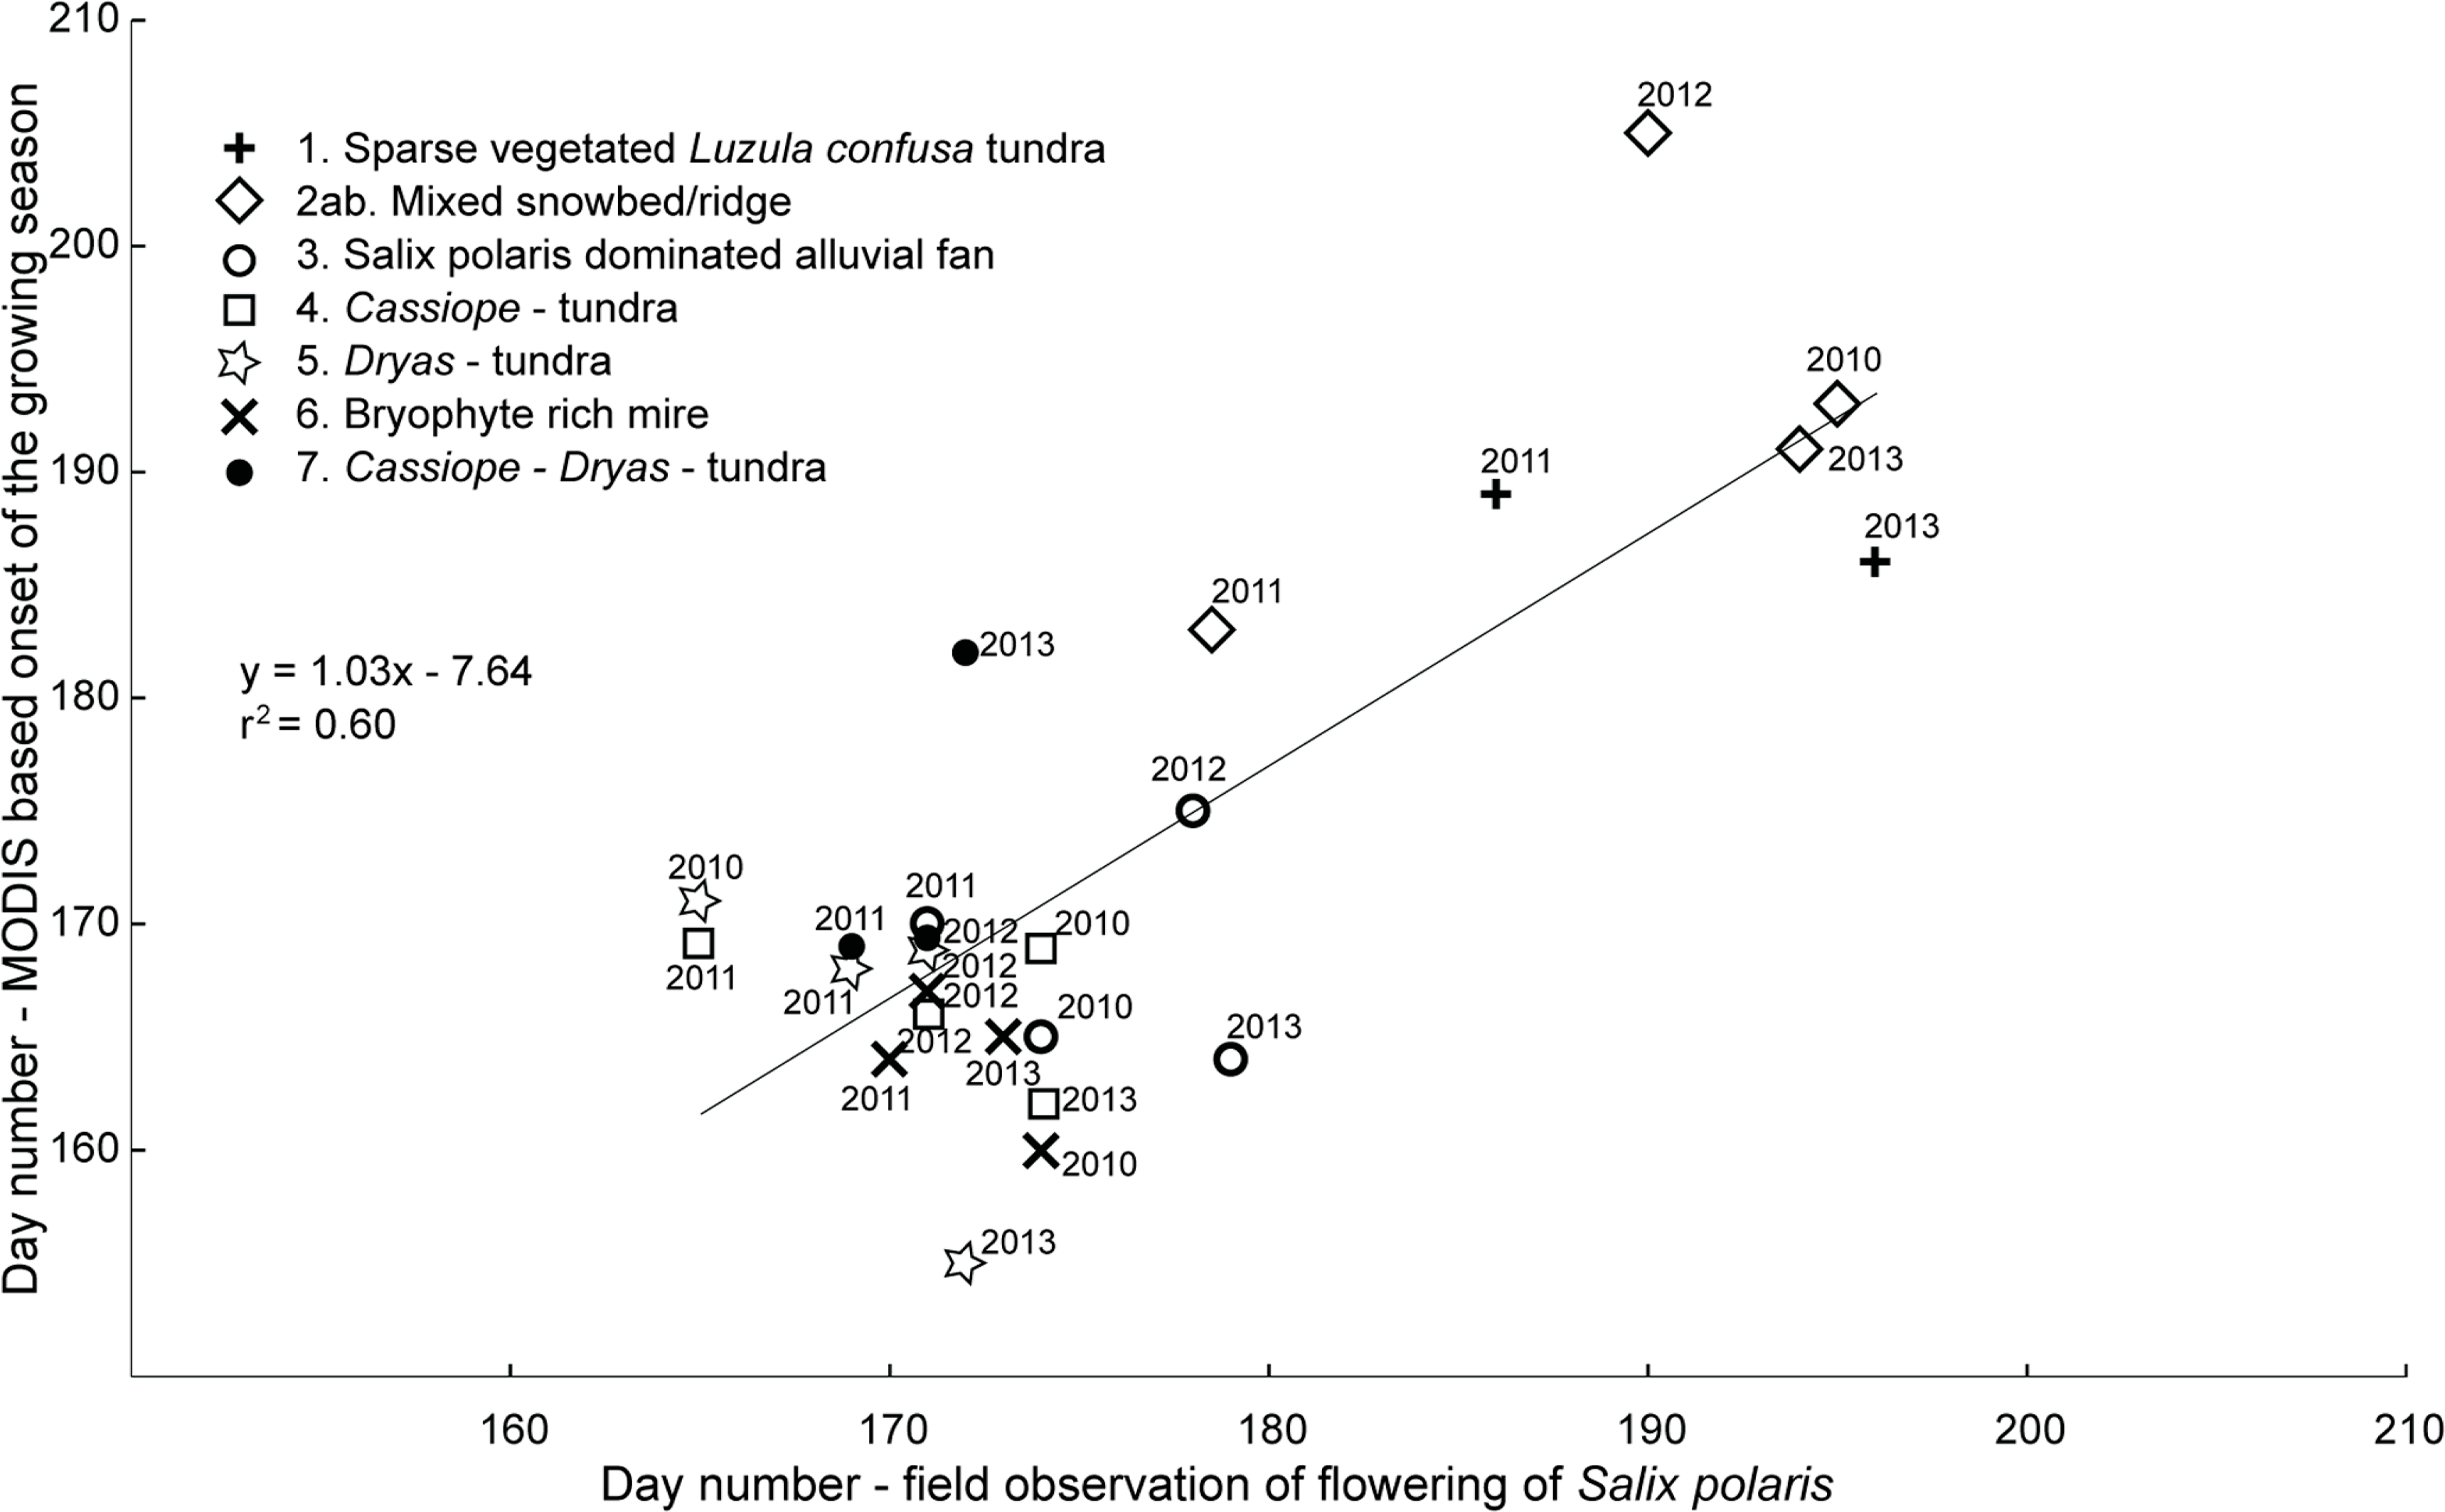
Four years (2010–2013) of field observation in seven different vegetation types of general flowering of Salix polaris and 12 other vascular plants in Adventdalen areas (Figure 2), showed that the flowering of Salix polaris occurs on average six days before the mean flowering date of all the other recordings. The observations showed that the Cassiope-tundra, the Dryas-tundra, and the mixed Cassiope-Dryas-tundra located in the valley floor of Adventdalen (Figure 2) had earliest flowering, between day number 165 and 174 (12–23 June) all years.
The calculation of the MODIS-NDVI based onset of the growing season for each of the seven polygons, representing the different vegetation types (Figure 2), showed that the variation in date of onset within each polygon was low. Most of the pixels within each polygon had date of onset on the same 8-day period or the 8-day period just before or after, and the standard deviation value in date of onset for each polygon was in the range 3–8 days.
When we compared the average date of onset mapped by MODIS-NDVI data for the polygons with the field observations of flowering of Salix polaris we found high correlation (r2 = 0.60, n = 25, p < 0.001) (Figure 4). The bias between the NDVI-defined onset and the observed flowering of Salix polaris is six days or less for 17 of the 25 field observations. On average the bias is 1.1 day, and the onset is mapped earlier by NDVI data. Larger bias was found for the bryophyte dominated mire, with 4–14 days earlier onset measured by NDVI data than observation of flowering of Salix polaris.
3.2. Mean Onset of the Growing Season
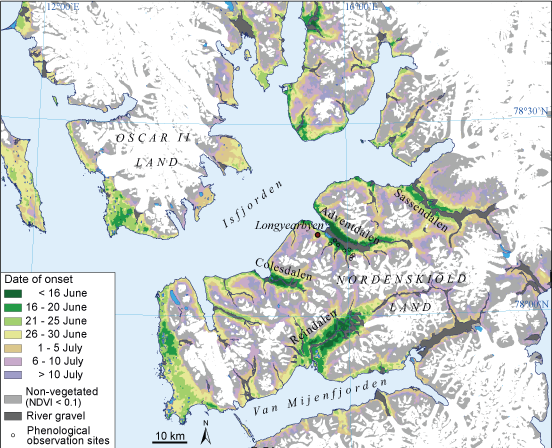
The NDVI-based map of the mean onset of the growing season for the 2000–2013 period is shown in Figures 5 and 6. On average, onset before 20 June, is only found in 5.1% (430 km2) of the vegetated areas south of 80°N, and mainly in the valleys (Adventdalen, Reindalen, and Colesdalen) on Nordenskiöld Land (Figure 6).
In 26.5% (2247 km2) of the vegetated areas on Svalbard the onset of the growing season occurs between 20 and 31 June. In 68.4% (5790 km2) the onset of the growing season occurs after 1st July. This category covers most of the area on the northern and eastern parts of Svalbard, as well as high altitude parts of central-western Spitsbergen.
3.3. Annual and Spatial Variability
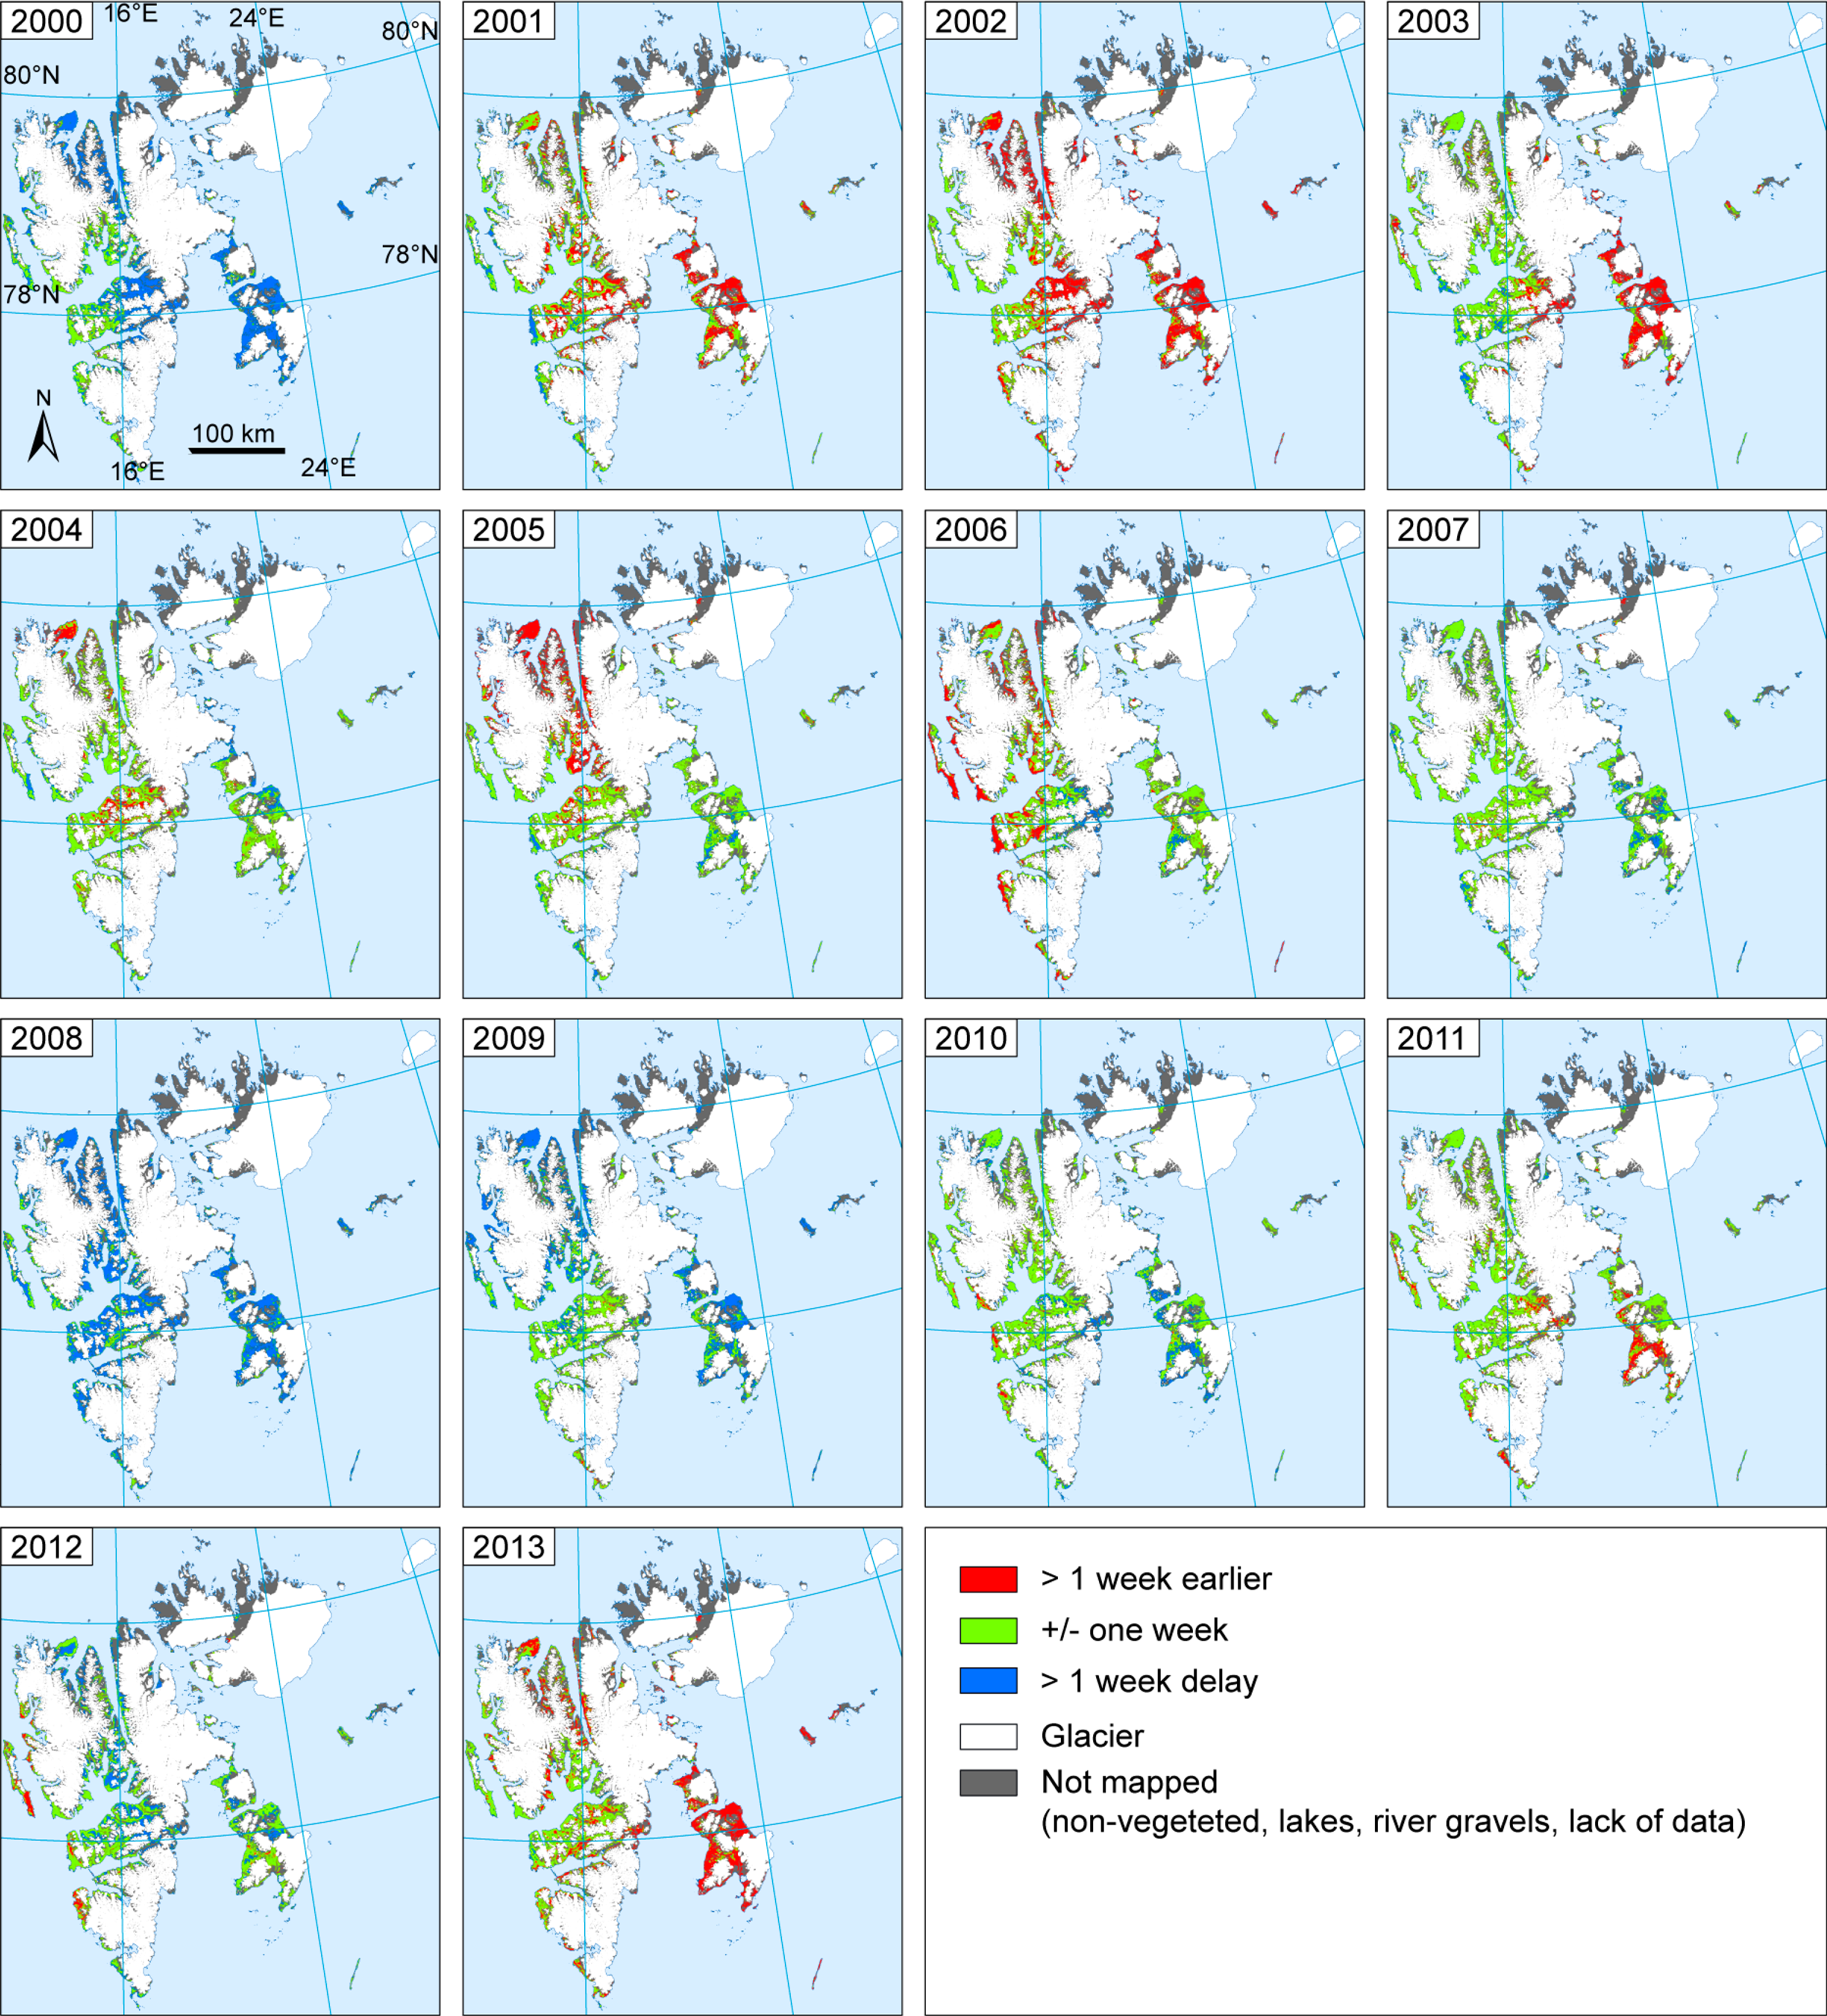
Figure 7 shows that the timing of onset of the growing season displays large regional variation both from year-to-year during the 2000–2013 period, as well as of different parts of Svalbard within a year. The year 2008 was generally the most extreme in terms of late NDVI-defined onset of the growing season: in this year 78% of the vegetated areas on Svalbard show more than one week later onset than the 2000–2013 average. It was late throughout the archipelago, except in the warmest valleys on Nordenskiöld Land, which had an average timing of onset that year. The onset in 2000 was late in 61% of the mapped area, but not on the western part of Spitsbergen. In 2009, 45% of the vegetated area had late onset, where most parts of eastern (the islands Barentsøya and Edgeøya) and northern Svalbard were classified as late that year. On the other hand, the year 2002 had more than one week earlier onset of the growing season in 57% of the vegetated areas, but not in some western parts, which had an average timing of onset. The year 2013 had early onset in 44% of the area, mainly in the east and north. The year 2006 was early only on the western coast, while the eastern parts were average or even late.
The years 2004, 2007, 2010, 2011 showed mostly average timing in onset, with more than 80% of the vegetated areas within ± one week from the 2000–2013 mean values.
3.4. Trends
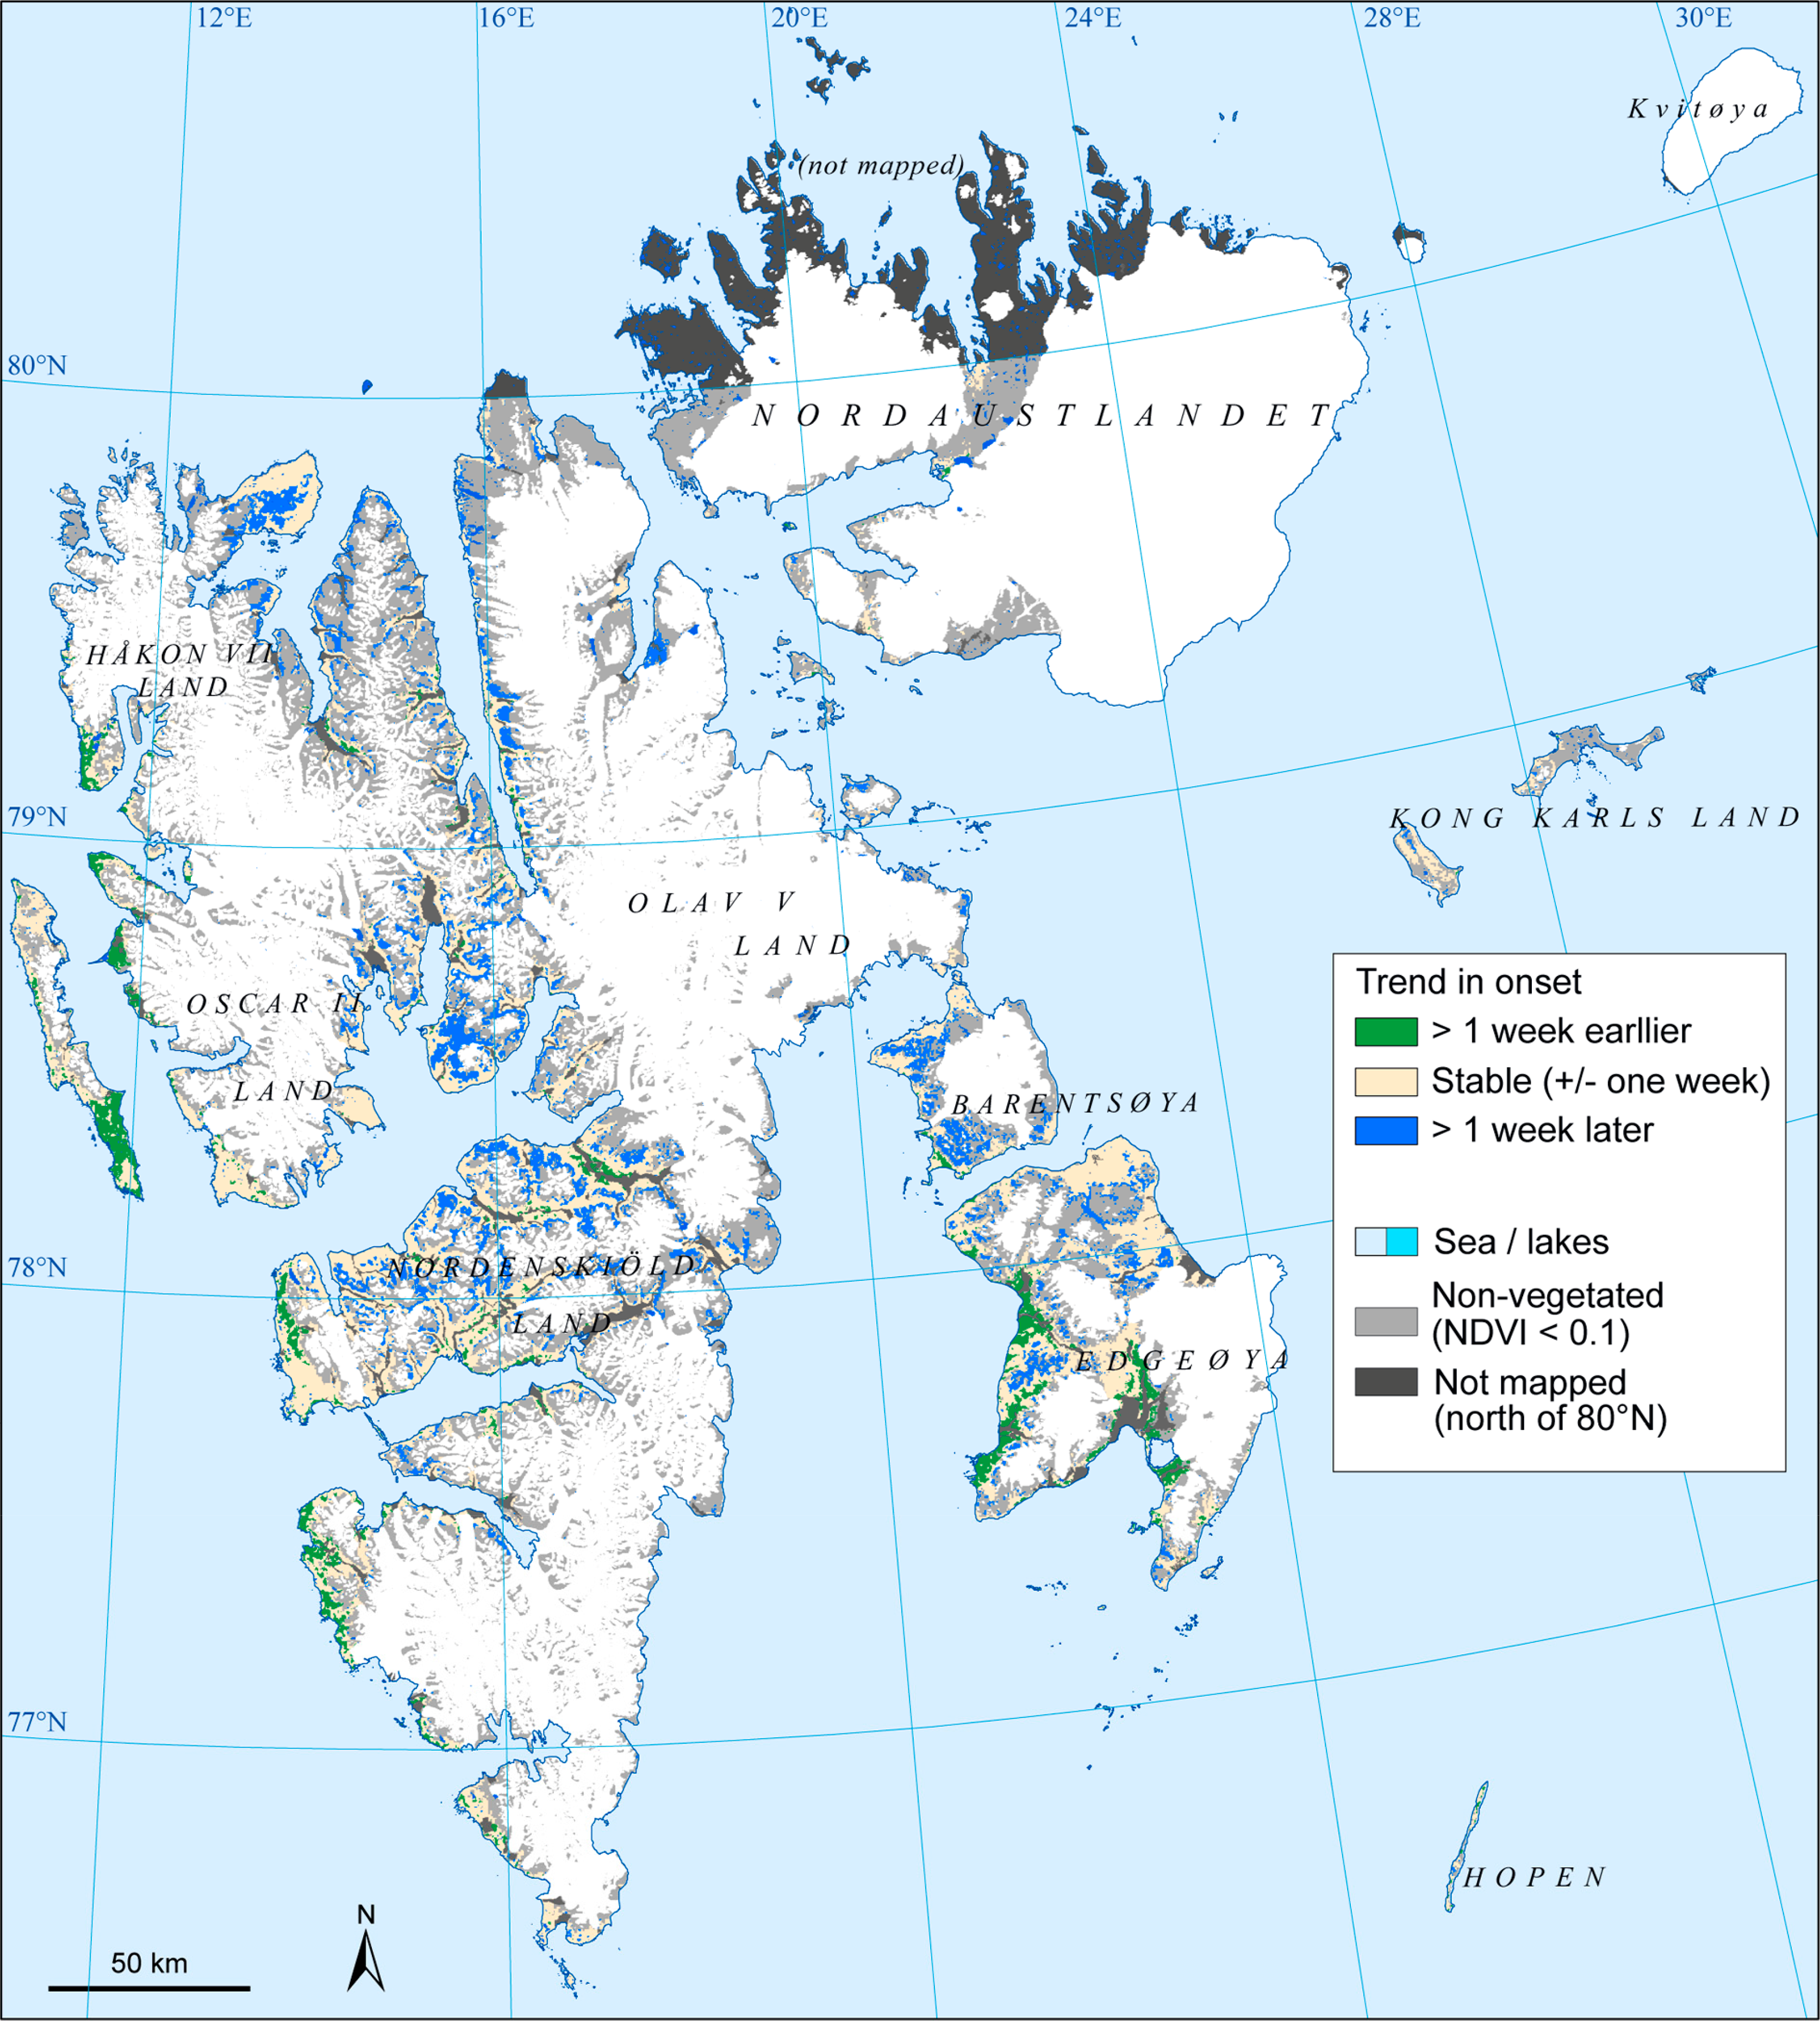
Figure 8 shows the 14-year linear trends in onset of the growing season within Svalbard for the 2000–2013 period. The average trend for the entire archipelago is only a 1.3 days (0.1 day per year) later onset of the growing season in 2013 compared to 2000 assuming a linear trend. Hence, overall it is rather stable, and 70.3% (5952 km2) of the vegetated area has a trend of ± one week. A trend towards earlier onset of the growing season of one week or more occurs in 9.2% (779 km2). This category is mainly found on the west coast of Spitsbergen, partly in the warm valleys on Nordenskiöld Land, and on some spots on Edgeøya with average earliest onset (Figure 5). A linear trend of one week or more in delay of onset is found in 20.5% (1734 km2) of the vegetated area. This category is found in central Spitsbergen at relatively high altitude, areas characterized by relatively late average onset (after 5th July), and in some northern parts
4. Discussion
4.1. The Geographical Pattern of the Onset of the Growing Season
To our knowledge, this is the first time the growing season has been mapped over large areas by satellite data, validated through field observations, in the High Arctic environment. The mapping has revealed large spatial variability, both within years and between years, in the onset of the growing season at Svalbard. Within years, early or late onset on the eastern parts of the archipelago (the islands Barentsøya and Edgeøya) does not necessarily correspond with early/late onset in western-central Spitsbergen (Nordenskiöld Land) (Figure 7). This might be explained by sea-ice distribution patterns. western parts are influenced by warm ocean currents from the south and are ice-free even during winter time, while the eastern side is influenced by cold currents from the north. On the eastern parts, some years the sea-ice disappears early and in others very late (as observed from MODIS data during the cloud interpretation). A relationship between proximity to sea-ice and vegetation pattern is evident in the Arctic [37] and has also been shown to be linked to vegetation changes in the Arctic [38,39]. However, a possible correspondence between retreating sea-ice and onset of the growing season in eastern parts of Svalbard remains to be studied.
For the 14-year mapping period (2000–2013), the overall linear trend in onset of the growing season for the whole of the archipelago is only a weak trend of delayed onset (0.1 days per year, or 1.3 days for the entire period). During this period, data from the meteorological station Svalbard Lufthavn, close to Longeyarbyen, shows a total change according to the linear trend of the period, of 1.46 °C and 0.44 °C increase in June and July temperatures (met.no), respectively. This should indicate a trend of earlier onset. However, at the same time the precipitation during winter time (1 October to 30 April), which mainly falls as snow, shows a linear increase from 94–135 mm. Hence, the effects on the growth season onset due to higher spring temperatures may be counteracted by the effects of increased amounts of winter snow, which delay the timing of snowmelt. From Adventdalen valley, recent studies have shown that late snowmelt might delay plant development [14], but it depends on the species and phenophases [40,41]. However, the effect of delayed snowmelt on our MODIS-NDVI defined onset also remains to be studied.
4.2. Are the “Onset of the Growing Season” Maps Reliable?
To map the short and intense period with onset of the growing season on Svalbard we need to keep as much as possible of the cloud-free data, as well as removing all the clouds, which requires high-quality cloud-mask and reliable interpolation methods. Frequent fog and clouds, dominance of snow and ice, short growing season, and often scattered vegetation cover, are some of the factors that make cloud detection on Svalbard a challenging task. In addition, there is often weak response in NDVI from the thin and often scattered vegetation cover, which requires interpretation of a rather weak signal in mapping the growing season. There are several different MODIS products to choose between. The cloud detection in this study included visual interpretation, hence, using daily MODIS products (MOD09GA/MOD09GQ), would be too time-consuming, and also due to the extensive cloud cover on Svalbard we believe daily products would not significantly increase the quality. BRDF-adjusted reflectance product (MCD43A4) has 16-day time-resolution and 500 m spatial resolution, and due to the scarce vegetation and short growing season on Svalbard, we wanted a product with 250 m spatial resolution and better time-resolution. Therefore, we used two different MODIS Terra products, both with 8-day temporal composites. The MOD09Q1 product with surface values for bands 1 and 2 at 250 m resolution, was used to calculate NDVI values, and the MOD09A1 product with surface reflectance values for bands 1–7 at 500 m resolution, was used to extract information about the cloud cover. To extract cloud information, the State QA flags from the MOD09A1 product were carefully evaluated. In more than half of the 8-day periods, one value or a combination of the State QA values, could be used to detect clouds well enough, otherwise they were only partly good enough. The State QA flags often fail in detecting thin clouds, covering sparsely vegetated areas. In sparsely vegetated areas, where rocks or saxicolous lichens dominate, the reflectance might have the same signature as clouds in the short wave infrared parts [42], which could be the explanation. Some of these clouds could be seen by visual evaluation or by comparing with median values from the previous years of the same 8-day period. Hence, these noisy parts were masked out by drawing polygons manually. The shadows of the cloud also sometimes fail to be detected by the State QA flag. During summer, over vegetated areas, these shadow areas could be detected and removed by using a threshold where the near infrared values (MODIS band 2) were less than 30% of the 14-year median value. This evaluation and combination of three cloud removal methods (Sate QA values, time series-based own algorithms, and manually removal based on visual interpretation), of each 8-day periods, is time-consuming. However, until a better automatic cloud detection algorithm can be developed, this is necessary in growing season mapping under High Arctic conditions, such as on Svalbard.
To achieve the best method in mapping the onset of the growing season we analyzed the seasonal changes in reflectance in all the seven bands in the MOD09A1 products over several vegetation types. During spring most land cover classes show large responses in both the red and NIR bands, hence, this indicates that NDVI is useful in mapping the onset of the growing season, even in often sparsely vegetated High Arctic areas. Several methods for detecting the onset of the growing season exist [43,44], and some of them were evaluated. For instance the “moving-average” method cannot be used due to too few data points, the “seasonal midpoint” method gives no meaning in areas with four months of polar night and 8–9 months with snow, “inflection point” method gave far too early onset. Hence, we used a variant of a pixel-threshold method based on mean summer NDVI from the 14-years with data, which has previously been used and discussed for Fennoscandia [33,45] included alpine parts of Norway, as this method gave the best fit with the field observations.
Although the correlation values between the NDVI-based measurements and the field observations were high and significant (r2 = 0.60, n = 25, p < 0.001) there were some uncertainties and possible errors in the mapping. The NDVI-based measurement of the onset of the growing season is defined as general flowering of the catkins of the Salix polaris, and the field observation sites are designed to detect the phenological variation in a valley and on a mountain plateau. This is done by selecting observations in seven different vegetation types. The 250 m resolution satellite data used, do not measure the signals from flowering of Salix polaris, but a mix of all species and abiotic factors in the pixel. However, the high correlation and small bias with NDVI data in several vegetation types indicate that the phenophase of Salix polaris could be used as an indicator of the green-up in most of the vegetation types, where this species is common. Salix polaris is also among the most common vascular species on Svalbard, and occurs in most habitats. The largest bias between NDVI-threshold and field observations was found in bryophyte dominated mire, with 4–14 days earlier NDVI-based onset than flowering of Salix polaris (Figures 2 and 3). The reason for this may be that “evergreen” bryophytes emerge from the snow apparently with peak greenness, well before the flowering of Salix polaris. This could indicate that the methods used actually measure the time of snowmelt in the case of bryophyte-dominated communities, instead of the later onset of flowering of Salix polaris. Moss-tundra covers large areas in many cold areas on Svalbard, such as Edgeøya, [27,30]. Some spots on Edgeøya have early average onset of growing season (<25 June, Figure 5), which is unexpectedly early for such cold areas. Although winter precipitation patterns are poorly known here, it could indicate that the time of snow-melt is measured.
Another uncertainty is that the vegetation in the valley and on the mountain plateau with field observations only represents a part of the vegetation diversity on the archipelago, and for instance does not include lichen dominated vegetation types, which is rather common on the archipelago. However, in general the uncertainties are mostly a general bias dependent on vegetation type and year-to-year variations and trends are not so much affected by this.
5. Conclusions
This study uses 14 years (2000–2013) of MODIS-NDVI data to map the onset of the growing season on the High Arctic archipelago of Svalbard. The main conclusions are as follows:
The mapping of the onset of the growing season shows a high and significant correlation (r2 = 0.60, n = 25, p < 0.001) with the timing of general flowering of the selected indicator species Salix polaris (polar willow).
A large bias was found between the NDVI-based measurement of the onset and field observations of onset in bryophyte-dominated areas, which indicates that the results in bryophyte-dominated areas are less accurate.
The mapping reveals large spatial variability within years and between years in the onset of the growing season, but with no statistically significant trend.
The years 2000 and 2008 were extreme in terms of late onset of the growing season, and 2002 and 2013 had early onset.
Acknowledgments
The project is a part of the Environmental Monitoring of Svalbard and Jan Mayen (MOSJ), coordinated by the Norwegian Polar Institute. We are grateful to senior advisor John Richard Hansen, who has been the contact person at the Norwegian Polar Institute during the project period. We are also grateful to all the persons at the Norwegian Polar Institute at Longyearbyen, who participated in phenological field data collection, and we are grateful to Prof. Lars Eklundh, Lund University, for help with the TIMESAT software. In addition this project is related to, and partly funded by the Research Council of Norway’s project: “Predicting effects of climate change on Svalbard reindeer population dynamics: a mechanistic approach (REINCLIM)”, grant 216051, and the EC FP7 collaborative project Sentinels Synergy Framework (SenSyF).
Author Contributions
Stein Rune Karlsen has been the main author of the manuscript, done the research design, the field work, and most of the processing of the satellite data. Arve Elvebakk has contributed with the ecological interpretation of the satellite data and written parts of the paper. Kjell Arild Høgda and Tom Grydeland have contributed with the processing of the satellite data and contributed to editing and reviewing the manuscript.
Conflicts of Interest
The authors declare no conflict of interest.
References
- IPCC. Climate Change 2013: The Physical Science Basis. Contribution of Working Group I to the Fifth Assessment Report of the Intergovernmental Panel on Climate Change; Stocker, T.F., Qin, D., Plattner, G.-K., Tignor, M., Allen, S.K., Boschung, J., Nauels, A., Xia, Y., Bex, V., Midgley, P.M., Eds.; Cambridge University Press: Cambridge, UK/New York, NY, USA, 2013. [Google Scholar] [CrossRef]
- Førland, E.J.; Benestad, R.; Hanssen-Bauer, I.; Haugen, J.E.; Skaugen, T.E. Temperature and precipitation development at Svalbard 1900–2100. Adv. Meteorol 2011, 2011, 14. [Google Scholar]
- Cleland, E.E.; Chuine, I.; Menzel, A.; Mooney, H.A.; Schwartz, M.D. Shifting plant phenology in response to global change. Trends Ecol. Evolut 2007, 22, 357–365. [Google Scholar]
- Karlsen, S.; Solheim, I.; Beck, P.A.; Høgda, K.; Wielgolaski, F.; Tømmervik, H. Variability of the start of the growing season in Fennoscandia, 1982–2002. Int J. Biometeorol 2007, 51, 513–524. [Google Scholar]
- Wielgolaski, F.; Nordli, Ø.; Karlsen, S.; O’Neill, B. Plant phenological variation related to temperature in Norway during the period 1928–1977. Int J. Biometeorol 2011, 55, 819–830. [Google Scholar]
- Walther, G.-R.; Post, E.; Convey, P.; Menzel, A.; Parmesan, C.; Beebee, T.J.C.; Fromentin, J.-M.; Hoegh-Guldberg, O.; Bairlein, F. Ecological responses to recent climate change. Nature 2002, 416, 389–395. [Google Scholar]
- Piao, S.; Ciais, P.; Friedlingstein, P.; Peylin, P.; Reichstein, M.; Luyssaert, S.; Margolis, H.; Fang, J.; Barr, A.; Chen, A.; et al. Net carbon dioxide losses of northern ecosystems in response to autumn warming. Nature 2008, 451, 49–52. [Google Scholar]
- Richardson, A.D.; Andy Black, T.; Ciais, P.; Delbart, N.; Friedl, M.A.; Gobron, N.; Hollinger, D.Y.; Kutsch, W.L.; Longdoz, B.; Luyssaert, S.; et al. Influence of spring and autumn phenological transitions on forest ecosystem productivity. Philos. Trans. R. Soc. B: Biol. Sci 2010, 365, 3227–3246. [Google Scholar]
- Høye, T.T.; Post, E.; Schmidt, N.M.; Trojelsgaard, K.; Forchhammer, M.C. Shorter flowering seasons and declining abundance of flower visitors in a warmer arctic. Nat. Clim. Change 2013, 3, 759–763. [Google Scholar]
- Morisette, J.T.; Richardson, A.D.; Knapp, A.K.; Fisher, J.I.; Graham, E.A.; Abatzoglou, J.; Wilson, B.E.; Breshears, D.D.; Henebry, G.M.; Hanes, J.M.; et al. Tracking the rhythm of the seasons in the face of global change: Phenological research in the 21st century. Front. Ecol. Environ 2008, 7, 253–260. [Google Scholar]
- Høye, T.T.; Post, E.; Meltofte, H.; Schmidt, N.M.; Forchhammer, M.C. Rapid advancement of spring in the high arctic. Curr. Biol 2007, 17, R449–R451. [Google Scholar]
- Iler, A.M.; Høye, T.T.; Inouye, D.W.; Schmidt, N.M. Long-term trends mask variation in the direction and magnitude of short-term phenological shifts. Am. J. Bot 2013, 100, 1398–1406. [Google Scholar]
- Dubiel, E. Ecological observations on vascular plants in the NW Sörkapp land (Spitsbergen). Prace Botaniczne—Zeszyt 1991, 22, 39–46. [Google Scholar]
- Cooper, E.J.; Dullinger, S.; Semenchuk, P. Late snowmelt delays plant development and results in lower reproductive success in the high arctic. Plant Sci 2011, 180, 157–167. [Google Scholar]
- Karlsen, S.R.; Høgda, K.A.; Tolvanen, A.; Johansen, B.; Elvebakk, A. New satellite-based maps of the growing season north of 50°N. In Proceedings of Sixth International Symposium on Digital Earth: Models, Algorithms, and Virtual Reality, Beijing, China, 9 September 2009; pp. 784023–784028.
- Myneni, R.B.; Keeling, C.D.; Tucker, C.J.; Asrar, G.; Nemani, R.R. Increased plant growth in the northern high latitudes from 1981 to 1991. Nature 1997, 386, 698–702. [Google Scholar]
- Zhang, X.; Friedl, M.A.; Schaaf, C.B.; Strahler, A.H. Climate controls on vegetation phenological patterns in northern mid- and high latitudes inferred from MODIS data. Glob. Change Biol 2004, 10, 1133–1145. [Google Scholar]
- Zeng, H.; Jia, G.; Epstein, H. Recent changes in phenology over the northern high latitudes detected from multi-satellite data. Environ. Res. Lett 2011, 6, 45508–45518. [Google Scholar]
- De Beurs, K.M.; Henebry, G.M. A land surface phenology assessment of the northern polar regions using MODIS reflectance time series. Can. J. Remote Sens 2010, 36, S87–S110. [Google Scholar]
- Jeganathan, C.; Dash, J.; Atkinson, P.M. Remotely sensed trends in the phenology of northern high latitude terrestrial vegetation, controlling for land cover change and vegetation type. Remote Sens. Environ 2014, 143, 154–170. [Google Scholar]
- Xu, L.; Myneni, R.B.; Chapin, F.S., III; Callaghan, T.V.; Pinzon, J.E.; Tucker, C.J.; Zhu, Z.; Bi, J.; Ciais, P.; Tommervik, H.; et al. Temperature and vegetation seasonality diminishment over northern lands. Nat. Clim. Change 2013, 3, 581–586. [Google Scholar]
- Eastman, J.R.; Sangermano, F.; Machado, E.A.; Rogan, J.; Anyamba, A. Global trends in seasonality of normalized difference vegetation index (NDVI), 1982–2011. Remote Sens 2013, 5, 4799–4818. [Google Scholar]
- Norwegian Meterological Institute. eKlima—Free Access to Weather- and Climate Data from Norwegian Meteorological Institute from Historical Data to Real Time Observations. Available online: http://www.eklima.no (accessed on 1 April 2014).
- Frisvoll, A.A.; Elvebakk, A. Part 2. Bryophytes. Elvebakk, A., Prestrud, P., Eds.; 1996; Volume 198, pp. 57–172. [Google Scholar]
- Øvstedal, D.; Tønsberg, T.; Elvebakk, A. The lichen flora of Svalbard. Sommerfeltia 2009, 33. [Google Scholar] [CrossRef]
- Zhurbenko, M.P.; Brackel, W.V. Checklist of lichenicolous fungi and lichenicolous lichens of svalbard, including new species, new records and revisions. Herzogia 2013, 26, 323–359. [Google Scholar]
- Johansen, B.E.; Karlsen, S.R.; Tømmervik, H. Vegetation mapping of Svalbard utilising Landsat TM/ETM+ data. Polar Rec 2012, 48, 47–63. [Google Scholar]
- Elvebakk, A. A survey of plant associations and alliances from Svalbard. J. Veg. Sci 1994, 5, 791–802. [Google Scholar]
- Elvebakk, A. A vegetation map of Svalbard on the scale 1:3.5 mill. Phytocoenologia 2005, 35, 951–967. [Google Scholar]
- Zonneveld, I.S.; Lebouille, M.; de Nies, N. Landscape ecology (“land unit”) map of edgeøya, spitsbergen with emphasis on vegetation. In Permanence in Diversity. Netherlands Ecological Research on Edgeøya, Spitsbergen; Boschman, N., Hacquebord, L., Eds.; Circumpolar Studies: Plainfield, VT, USA, 2004; Volume 1, pp. 103–156. [Google Scholar]
- Jonsson, P.; Eklundh, L. Seasonality extraction by function fitting to time-series of satellite sensor data. IEEE Trans. Geosci. Remote Sens 2002, 40, 1824–1832. [Google Scholar]
- Jönsson, P.; Eklundh, L. Timesat—A program for analyzing time-series of satellite sensor data. Comput. Geosci 2004, 30, 833–845. [Google Scholar]
- Karlsen, S.R.; Elvebakk, A.; Høgda, K.A.; Johansen, B. Satellite-based mapping of the growing season and bioclimatic zones in Fennoscandia. Glob. Ecol. Biogeogr 2006, 15, 416–430. [Google Scholar]
- Karlsen, S.R.; Tolvanen, A.; Kubin, E.; Poikolainen, J.; Høgda, K.A.; Johansen, B.; Danks, F.S.; Aspholm, P.; Wielgolaski, F.E.; Makarova, O. MODIS-NDVI-based mapping of the length of the growing season in northern Fennoscandia. Int. J. Appl. Earth Obs. Geoinf 2008, 10, 253–266. [Google Scholar]
- Karlsen, S.; Ramfjord, H.; Høgda, K.; Johansen, B.; Danks, F.; Brobakk, T. A satellite-based map of onset of birch (Betula) flowering in Norway. Aerobiologia 2009, 25, 15–25. [Google Scholar]
- Høgda, K.A.; Tømmervik, H.; Karlsen, S.R. Trends in the start of the growing season in Fennoscandia 1982–2011. Remote Sens 2013, 5, 4304–4318. [Google Scholar]
- Bay, C. Floristical and ecological characterization of the polar desert zone of Greenland. J. Veg. Sci 1997, 8, 685–696. [Google Scholar]
- Bhatt, U.S.; Walker, D.A.; Raynolds, M.K.; Comiso, J.C.; Epstein, H.E.; Jia, G.; Gens, R.; Pinzon, J.E.; Tucker, C.J.; Tweedie, C.E.; et al. Circumpolar arctic tundra vegetation change is linked to sea ice decline. Earth Interact 2010, 14, 1–20. [Google Scholar]
- Bhatt, U.S.; Walker, D.A.; Raynolds, M.K.; Bieniek, P.A.; Epstein, H.E.; Comiso, J.C.; Pinzon, J.E.; Tucker, C.J.; Polyakov, I.V. Recent declines in warming and vegetation greening trends over pan-arctic tundra. Remote Sens 2013, 5, 4229–4254. [Google Scholar]
- Semenchuk, P.R.; Elberling, B.; Cooper, E.J. Snow cover and extreme winter warming events control flower abundance of some, but not all species in high arctic svalbard. Ecol. Evol 2013, 3, 2586–2599. [Google Scholar]
- Rumpf, S.B.; Semenchuk, P.R.; Dullinger, S.; Cooper, E.J. Idiosyncratic responses of high arctic plants to changing snow regimes. PLoS ONE 2014, 9. [Google Scholar] [CrossRef]
- Van Der Veen, C.J.; Csatho, B.M. Spectral characteristics of Greenland lichens. Géogr. phys. Quat 2005, 59, 63–73. [Google Scholar]
- White, M.A.; de Beurs, K.M.; Didan, K.; Inouye, D.W.; Richardson, A.D.; Jensen, O.P.; O’Keefe, J.; Zhang, G.; Nemani, R.R.; van Leeuwen, W.J.D.; et al. Intercomparison, interpretation, and assessment of spring phenology in north America estimated from remote sensing for 1982–2006. Glob. Change Biol 2009, 15, 2335–2359. [Google Scholar]
- De Beurs, K.; Henebry, G. Spatio-temporal statistical methods for modelling land surface phenology. In Phenological Research; Hudson, I.L., Keatley, M.R., Eds.; Springer: Dordrecht, The Netherlands, 2010; pp. 177–208. [Google Scholar]
- Karlsen, S.R.; Høgda, K.A.; Wielgolaski, F.E.; Tolvanen, A.; Tømmervik, H.; Poikolainen, J.; Kubin, E. Growing-season trends in Fennoscandia 1982–2006 determined from satellite and phenology data. Climate Res 2009, 39, 275–286. [Google Scholar]


© 2014 by the authors; licensee MDPI, Basel, Switzerland This article is an open access article distributed under the terms and conditions of the Creative Commons Attribution license (http://creativecommons.org/licenses/by/3.0/).
Share and Cite
Karlsen, S.R.; Elvebakk, A.; Høgda, K.A.; Grydeland, T. Spatial and Temporal Variability in the Onset of the Growing Season on Svalbard, Arctic Norway — Measured by MODIS-NDVI Satellite Data. Remote Sens. 2014, 6, 8088-8106. https://doi.org/10.3390/rs6098088
Karlsen SR, Elvebakk A, Høgda KA, Grydeland T. Spatial and Temporal Variability in the Onset of the Growing Season on Svalbard, Arctic Norway — Measured by MODIS-NDVI Satellite Data. Remote Sensing. 2014; 6(9):8088-8106. https://doi.org/10.3390/rs6098088
Chicago/Turabian StyleKarlsen, Stein Rune, Arve Elvebakk, Kjell Arild Høgda, and Tom Grydeland. 2014. "Spatial and Temporal Variability in the Onset of the Growing Season on Svalbard, Arctic Norway — Measured by MODIS-NDVI Satellite Data" Remote Sensing 6, no. 9: 8088-8106. https://doi.org/10.3390/rs6098088