Article

Urban Built-up Areas in Transitional Economies of Southeast Asia: Spatial Extent and Dynamics

1
Center for Global Change and Earth Observations, Michigan State University, East Lansing, MI 48823, USA
2
School of Planning, Design, and Construction & Center for Global Change and Earth Observations, Michigan State University, East Lansing, MI 48823, USA
3
Department of Geography & Center for Global Change and Earth Observations, Michigan State University, East Lansing, MI 48823, USA
*
Author to whom correspondence should be addressed.
Remote Sens. 2016, 8(10), 819; https://doi.org/10.3390/rs8100819
Submission received: 3 August 2016 / Revised: 15 September 2016 / Accepted: 27 September 2016 / Published: 2 October 2016

Abstract

:
Urban built-up area, one of the most important measures of an urban landscape, is an essential variable for understanding ecological and socioeconomic processes in urban systems. With an interest in urban development in transitional economies in Southeast Asia, we recognized a lack of high-to-medium resolution (<60 m) built-up information for countries in the region, including Vietnam, Laos, Cambodia and Myanmar. In this study, we combined multiple remote sensing data, including Landsat, DMSP/OLS night time light, MODIS NDVI data and other ancillary spatial data, to develop a 30-m resolution urban built-up map of 2010 for the above four countries. Following the trend analysis of the DMSP/OLS time series and the 2010 urban built-up extent, we also quantified the spatiotemporal dynamics of urban built-up areas from 1992 to 2010. Among the four countries, Vietnam had the highest proportion of urban built-up area (0.91%), followed by Myanmar (0.15%), Cambodia (0.12%) and Laos (0.09%). Vietnam was also the fastest in new built-up development (increased ~8.8-times during the 18-year study period), followed by Laos, Cambodia and Myanmar, which increased at 6.0-, 3.6- and 0.24-times, respectively.

Graphical Abstract

1. Introduction

Urban and its surrounding areas are hotspots of human-induced land cover/use change. Though relatively small in area, the extent and change that urbanized lands have on socioeconomic and ecosystem functions, including human health and well-being, climate (e.g., urban heat island), water conservation (e.g., rainfall), air pollution (e.g., PM2.5), biodiversity, ecosystem productivity and carbon cycling [1,2,3,4,5,6,7,8,9], are disproportionate at multiple scales. It has been increasingly recognized that urbanization needs to be considered as a necessary component of studying regional and global change [10].
Southeast Asia is currently one of the fastest urbanizing regions in the world [11], with rapid urbanization occurring particularly in countries under transitional economies (e.g., Cambodia, Laos, Myanmar and Vietnam). These countries have experienced major shifts from centralized and planned economies to free market economies since the 1980s, which were characterized by liberalization, macroeconomic stabilization, restructuring and privatization and legal and institutional reforms. Once the least developed countries in Asia, economic transition unleashed the forces for urbanization. The percentage of urban population jumped from 9%, 12%, 24% and 19% in 1980 to 20%, 32%, 33% and 35% in 2012 in Cambodia, Laos, Myanmar and Vietnam, respectively. Despite the importance of understanding the spatiotemporal changes of urban built-up land, as well as the causes and consequences of the urbanization, only a few studies have assessed the spatial extent and dynamics of urban built-up areas in Southeast Asian countries [11,12].
To understand the broad-scale spatiotemporal changes of urban built-up area, remote sensing has been recognized as a powerful tool [13,14,15]. There are now a number of urban land cover datasets at the global scale with 300–1000 m resolution data from satellite imagery, such as AVHRR, MODIS and DMSP/OLS. For example, at least eight maps of urban land extensions are available dating up until the year 2000 [16]. There are also urban built-up maps available at: 500-m resolution based on MODIS [13,17] from 2001 to the present (MODIS-500); 300-m resolution based on GlobCover in 2009 by the European Space Agency [18] (GLOBC-300); and at 1000-m resolution based on impervious surface area in 2010 by Sutton et al. [19] (IMPSA-1000). It is possible to extract information from these global products for any country, but with low accuracies for many developing countries (e.g., countries in Southeast Asia) [16]. The low accuracy is mostly attributed to the lack of high-resolution data for training and validation. For example, the MODIS data developed for country-level urban expansion and change from 2000 to 2010 in East-Southeast Asia has a user accuracy of <70% for the Southeast Asian countries [11,20]. More so, these global urban maps are inconsistent in spatial resolution and thematic definitions for “urban” [21]. As a result, the spatiotemporal information of urban land in Southeast Asia since 1992 cannot be readily derived from existing products [22,23,24]. Fortunately, there are other plausible, alternative products that can be used instead. The DMSP/OLS nighttime light (NTL) images, for example, have proven to be a cost-effective tool for large-scale human settlement mapping with records since 1992 [25,26]. The ability and effectiveness of the DMSP/OLS NTL time series to quantify the changes of urban areas over time has been shown at regional and global scales [27,28]. Methodologically, using different thresholding methods in quantifying the changes has been widely practiced [29,30]. For example, Liu et al. studied urban expansion in China from 1992 to 2008 and developed optimal thresholds in different years and in different regions [31]. Most recently, Liu et al. investigated urban expansion in India and China by combining the annual urban area that was quantified by thresholding NTL luminosity, sensor-specific effects and city-specific effects through regression [3,32]. However, few studies have applied a pixel-based time series analysis to quantify spatiotemporal changes in Southeast Asia.
A coarse resolution with low accuracy results in a low level of agreement among the estimates of total urban built-up areas in Southeast Asian countries (Figure 1). Consequently, there is a demand for a new product with improved spatial resolution and accuracy. Mapping land use and land cover (LULC) with 30-m resolution Landsat TM/enhanced TM (ETM+) can provide more detailed and accurate spatial information of built-up surfaces in an urban landscape than coarse resolution images [33,34]. It is important for local or regional planning and management to continue efforts using this 30-m (or finer) resolution. Recent advances in data accessibility and high-performance computing capacity make it feasible to use Landsat-like data for regional/global LULC mapping, such as the delivery of the global LULC at 30 m for the public. Examples include Finer Resolution Observation and Monitoring of Global Land Cover (FROM-GLC) [35] and the global land cover (GLC-30) [33], which provide more accurate surface cover fractions for land process models and fill the data/knowledge gaps that are needed by developing countries in Africa, Asia and South America, where limited LULC products at the national level exist. However, the accuracy of the impervious area class in FROM-GLC is too low (<35%) for practical applications. While the GLC-30 achieved higher accuracy (>80%), it does not include urban built-up/land classes. As a result, reliable 30-m resolution urban built-up maps are not available from global datasets. From local and regional studies focusing on Southeast Asia, a few case studies on urban LULC based on 30-m resolution Landsat TM/ETM+ [36,37,38] for individual cities exist but none had developed national urban built-up maps for countries with a transitional economy.
The primary objectives of this study were to develop an accurate urban built-up map at 30-m resolution for Southeast Asian countries that experienced transitional economies and to quantify the broad-scale spatiotemporal changes of the urban built-up area from 1992 to 2010. We aimed to provide information that is more accurate than other global coarse resolution products, including an estimate of the total urban built-up area and its spatial distribution within Cambodia, Laos, Myanmar and Vietnam; and to provide a conservative estimate of urban built-up changes from coarse, yet consistent DMSP/OLS time series data.

2. Materials and Methods
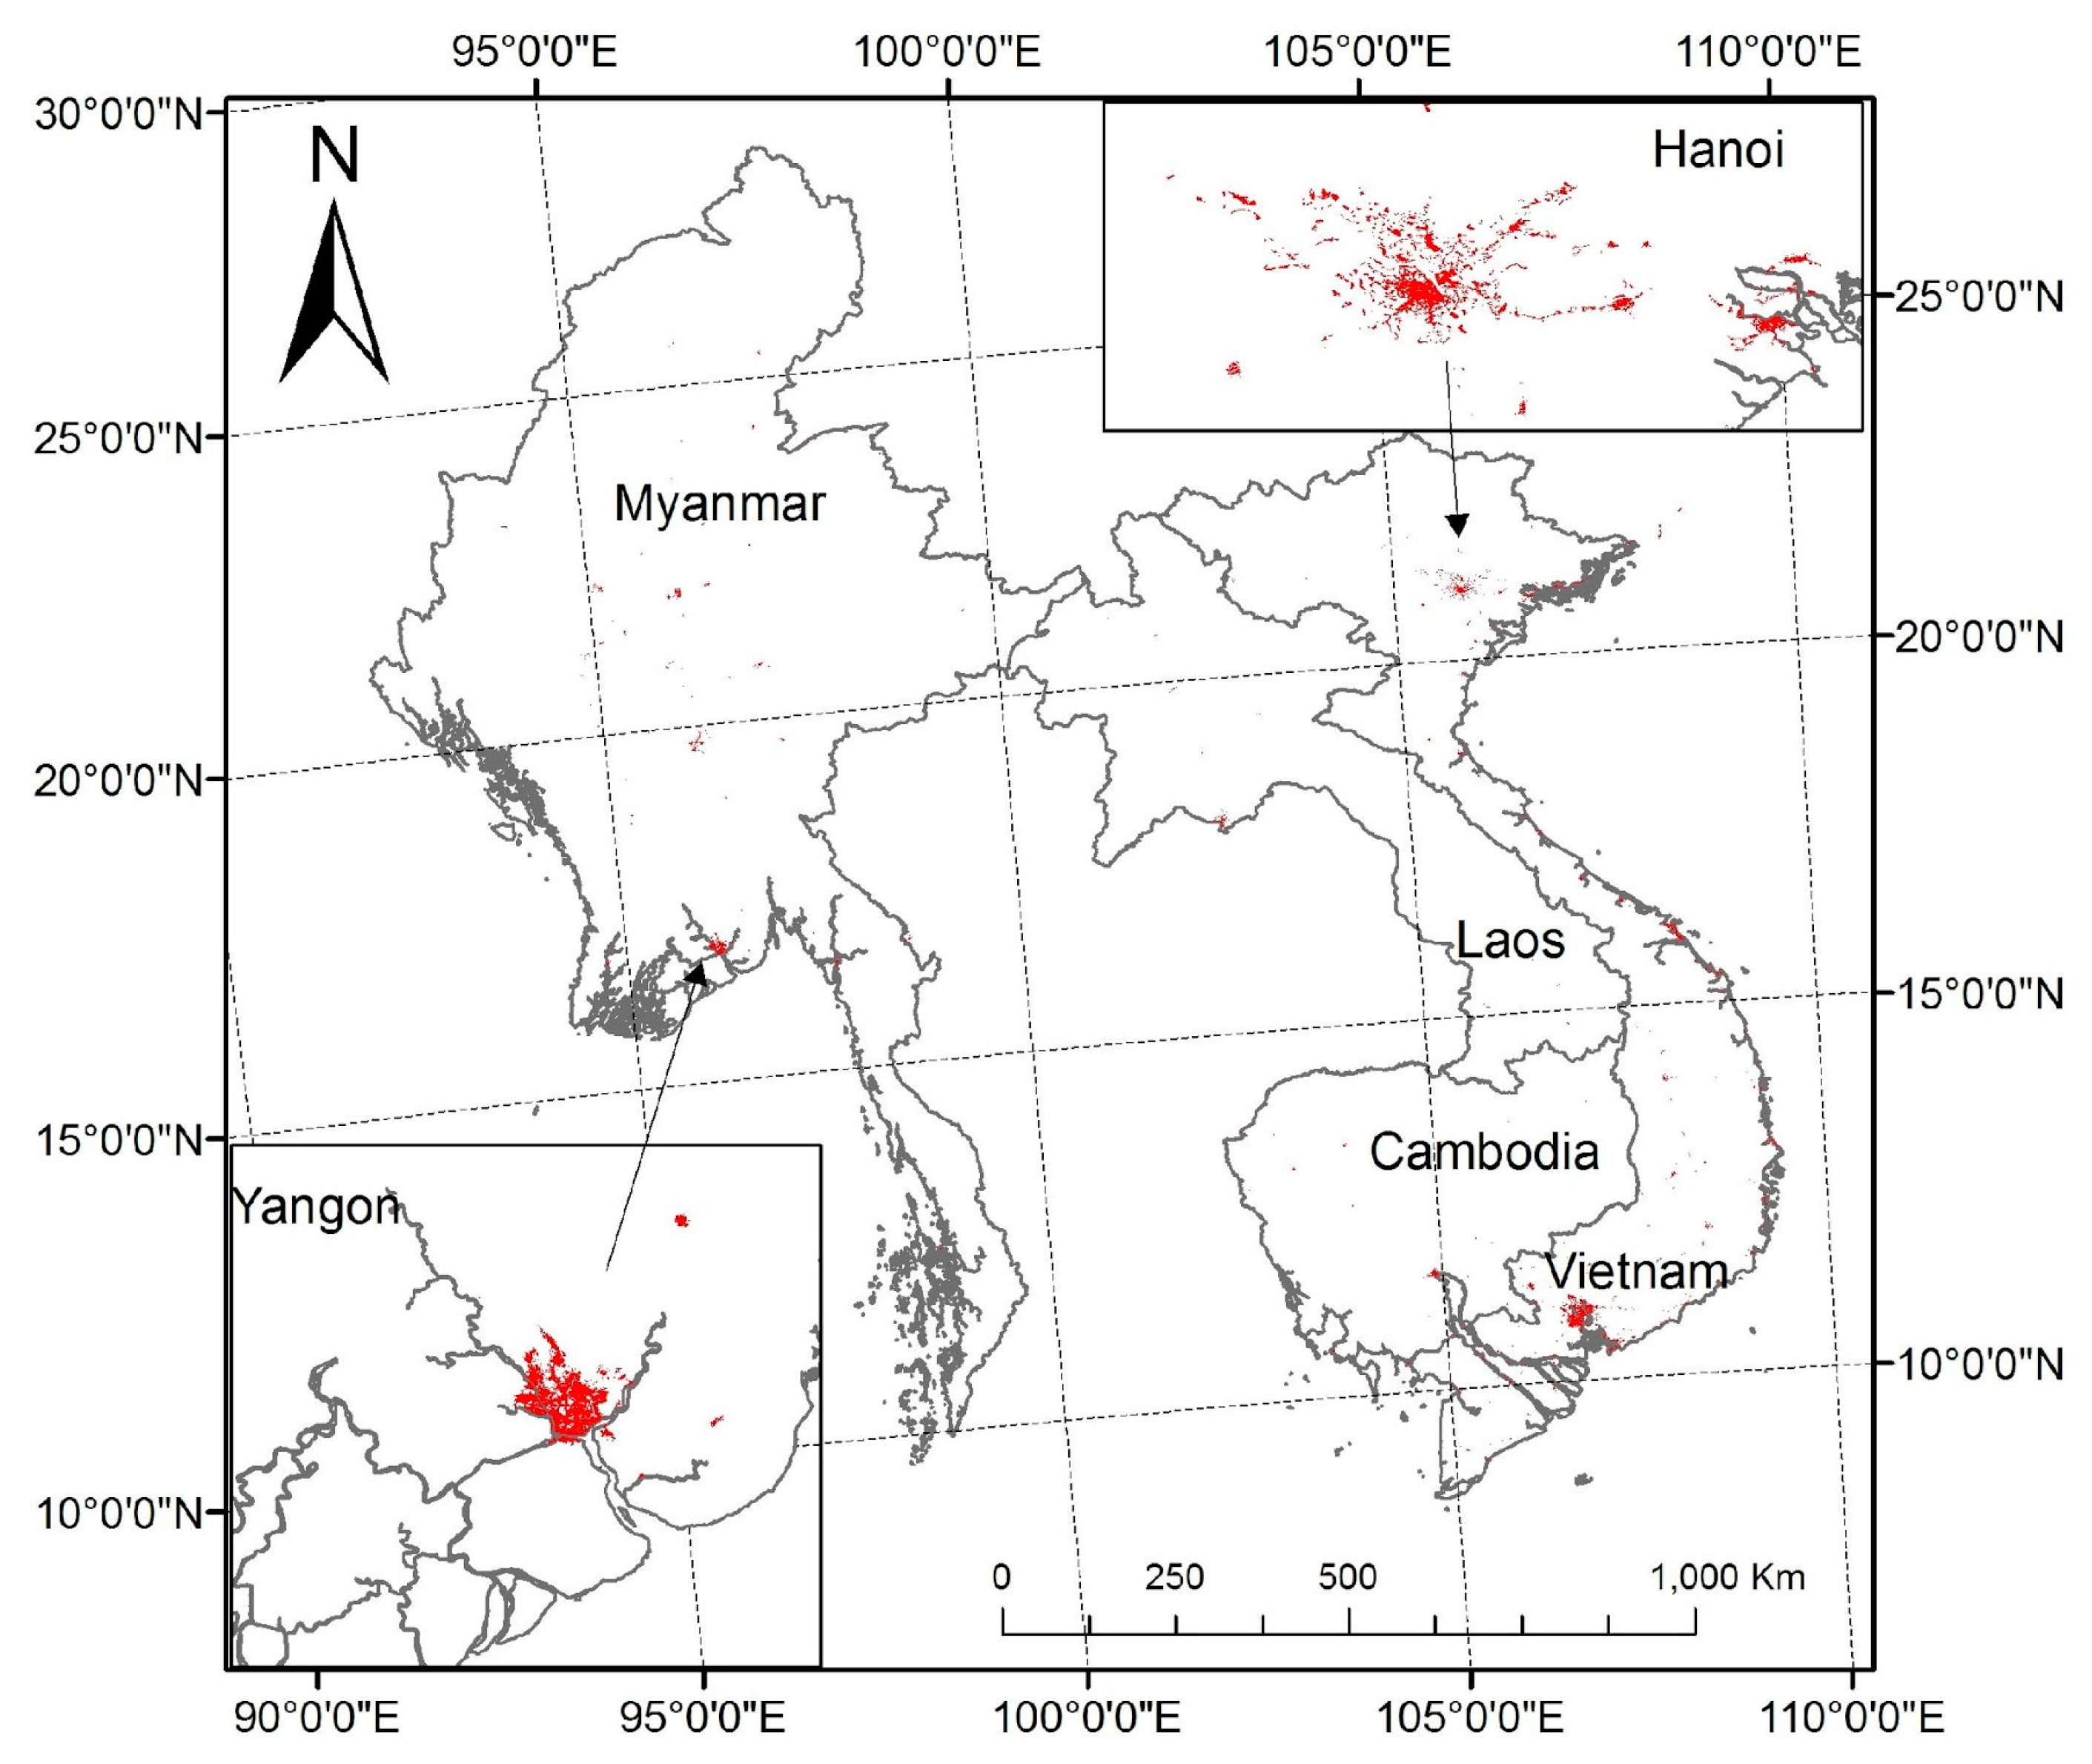
2.1. Study Area

Our study area focused on the four countries that are in economic transition in Southeast Asia: Cambodia, Laos, Myanmar and Vietnam (Figure 2). In 2010, the four countries had a total population of over 159.2 million and a total area of over 1.4 million km2. These countries started their institutional transitions with various degrees of policy support and at different times [39,40]. Vietnam formally launched its economic reform in 1979 and has maintained a high economic growth since then [41]. Laos launched the New Economic Mechanism (NEM) in 1986 to shift toward a market economy, considerably improving its macroeconomic situation. In Cambodia, the transition took place in the late 1980s. Myanmar started its economic liberalization in the 1990s, but the authoritarian rule by the military did not end until 2011. When compared to the other three countries prior to 2010, Myanmar’s transition was less efficient and had been delayed. Four dominant cities (i.e., Hanoi in Vietnam, Phnom Penh in Cambodia, Vientiane in Laos and Yangon in Myanmar) were used in an accuracy assessment.

2.2. Data and Data Preprocessing

We used multiple sources of data, including the 2010 GLC-30 30-m global land use and land cover map, the 2010 MODIS NDVI 16-d 500-m composite data, the 1992 to 2010 DMSP-OLS 1000 m nighttime stable light data, the 2010 LandScan population counts data, the 2009 to 2011 single-date Landsat TM/ETM+ images (Table S1), Google Earth high resolution images and populated places and the GRUMPv1 city points. The details of the data sources and their main functions are provided in Table 1. Data preprocessing included filtering the original DMSP-OLS data by removing water via a water mask from the MODIS MOD44W product and removing gas flare pixels via the gas flare data from Elvidge et al. [42]. Geo-referenced Landsat TM/ETM+ images were converted to top-of-atmosphere reflectance using the built-in quick atmospheric correction model in ENVI 4.8 [43]. All spatial data were re-projected into the Albers Conical Equal Area projection. In total, we used 53 Landsat TM and 2 Landsat ETM+ images to map the urban built-up area at 30 m resolution. The detailed information on the number of path-row and dates per path-row are listed in Table S1 in our supplementary materials. For each Landsat image, we only included and used Bands 1–5 (i.e., blue, green, red, near infrared and short-wave infrared bands).

2.3. Thematic Definition

The term “urban” has many different connotations in the literature [51,52]. In addition to different data sources and methods of image processing and classification, disagreements among the “urban land” maps can be also caused by the inconsistent definitions of urban land [21]. It is therefore important to define the thematic properties of our target class for future use and comparison. Most remote sensing-based urban land maps refer to “urban built-up” products (e.g., MODIS-500) or “impervious surface” proportion products (e.g., IMPSA2010) that could be converted to “urban built-up” areas: locations dominated by constructed surfaces or built environment, where dominancy implies >50% coverage of pixels [16,20]. In this study, we adopted this definition to produce an urban built-up map at 30-m resolution. Note that while urban land in these developing countries can be composed of bare soil, these areas were not considered as urban built-up areas and were excluded in our results.

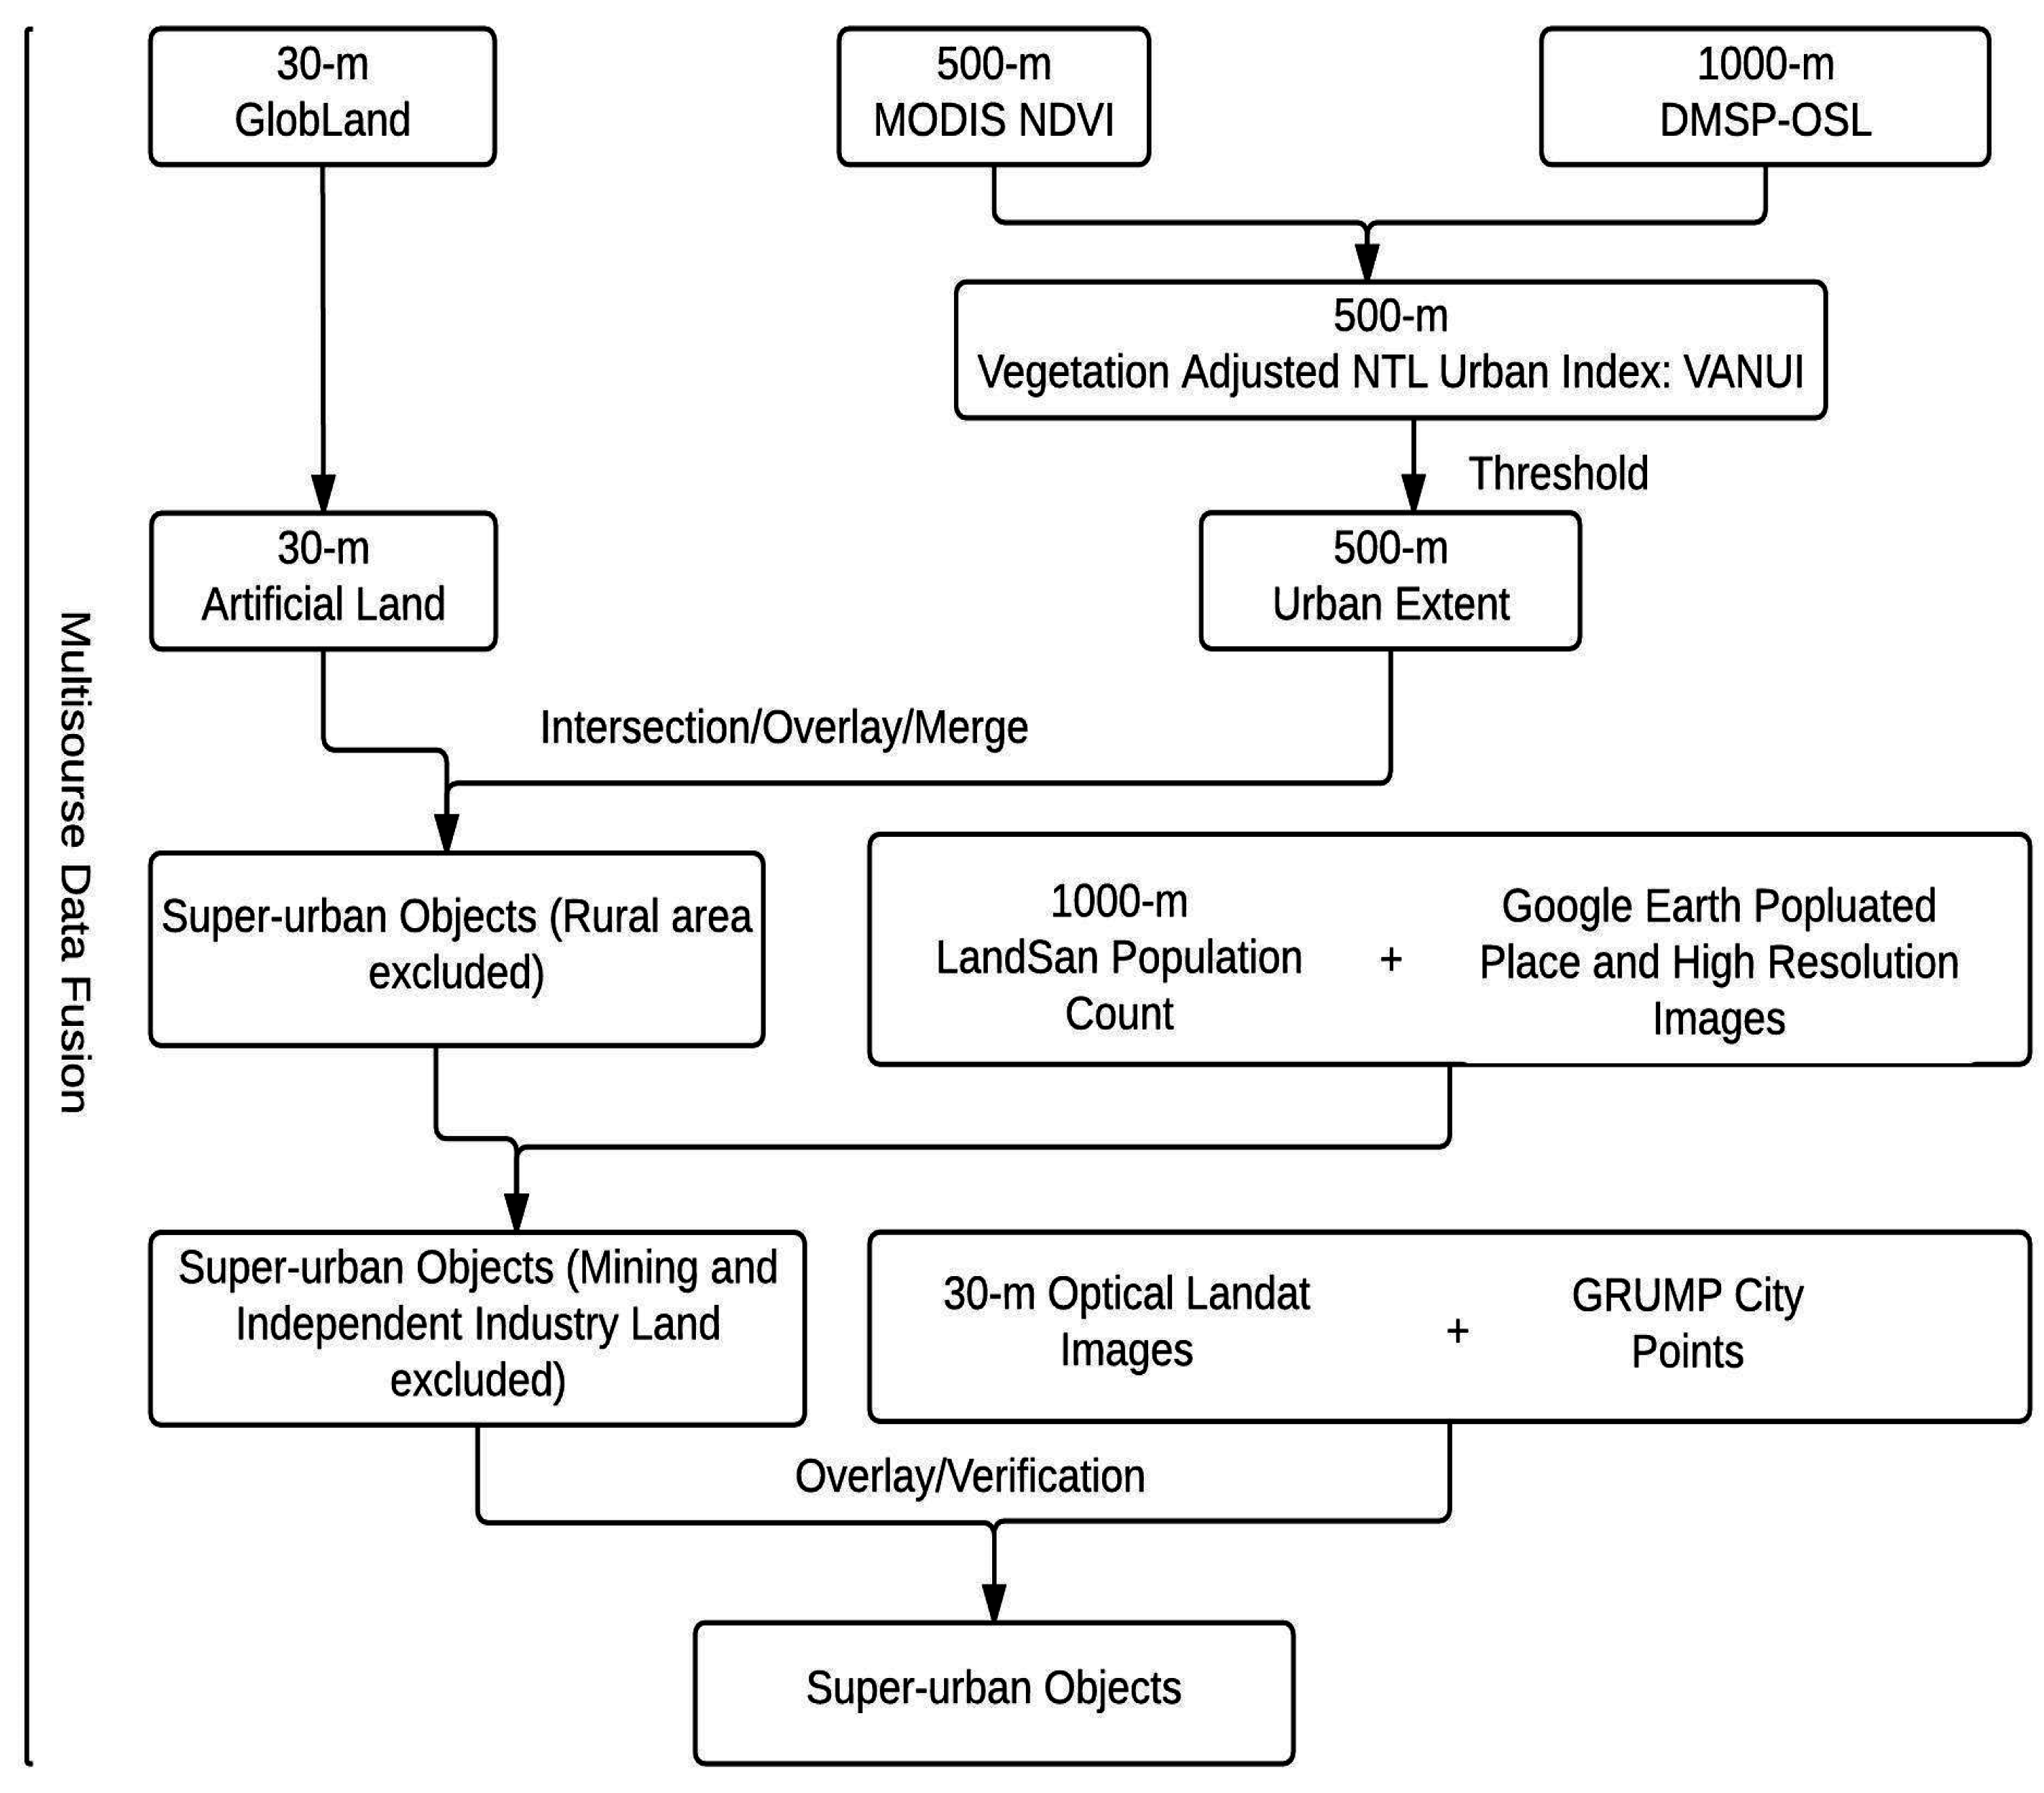
2.4. Super-Urban Objects

Super-urban objects were constructed to include all potential urban built-up areas and were allowed to include other land cover types, but to a minimum degree. The super-urban objects pre-confined image classification in urban and surrounding areas in order to save computing time and human-machine interaction time. GLC-30, DMSP-OLS and MODIS NDVI were fused to define the super-urban objects (i.e., polygons) in 2010 (Figure 3). First, we extracted the artificial land cover from 2010 GLC-30, which included urban built-up areas (excluding urban vegetation, water bodies and bare soil), rural residential lands and cover types for traffic, industry and mining construction [22,33]. However, the omission errors of the 2010 GLC-30 remained non-negligible, with many urban built-up areas missing in the artificial land cover product. To deal with this issue, we took advantage of DMSP-OLS NTL and MODIS NDVI data, from which the Vegetation Adjusted NTL Urban Index (VANUI) [53] was computed. The threshold-based image segmentation was conducted on VANUI to extract potential urban areas (NTL-urban area) in eCognition 8.7: we set the threshold VANUI as 0.18 in this paper. The use of VANUI, instead of NTL, was to reduce the effect of NTL saturation and to increase the variation of the NTL signal within urban areas. Note there is no single optical VANUI threshold for all urban clusters, which is usually higher for large urban clusters and lower for small urban clusters. A high threshold would have excluded too many small cities, but a low threshold would have led to implausibly large super-urban objects around big cities [3,32]. The threshold of 0.18 was based on medium urban clusters in the study area and, thus, may have missed some potential urban areas around small urban clusters. However, GLC-30 artificial land cover caught most of the small urban areas that were missed. Therefore, to create the super-urban objects, we overlaid the resulting NTL-urban areas onto the GLC-30 artificial land cover and merged the polygons from the two layers that intersected. Through these processes, rural areas in the GLC-30 artificial land cover were largely removed and missing urban areas in small urban clusters of the NTL-urban areas were recaptured from the GLC-30 artificial land cover.
Further processing was performed to remove other image objects that should not have been included in our definition of urban built-up area, including industry and mining land (e.g., hydropower station). We used low residential population as the criteria to identify these cover types, assuming that they have a very low or non-existent population. Images objects with total ambient population (i.e., from LandScan) <5000 were detected as suspicious objects, which were then verified for exclusion against Google Earth Pro’s high-resolution images and the populated place layers. Finally, GRUMP city, town and settlement points were used to assure that important urban clusters were not excluded in the super-urban objects layer. To convert super-urban objects into image objects, a chessboard segmentation was applied in eCognition v8.7 with the super-urban objects vector layer as an additional thematic layer.

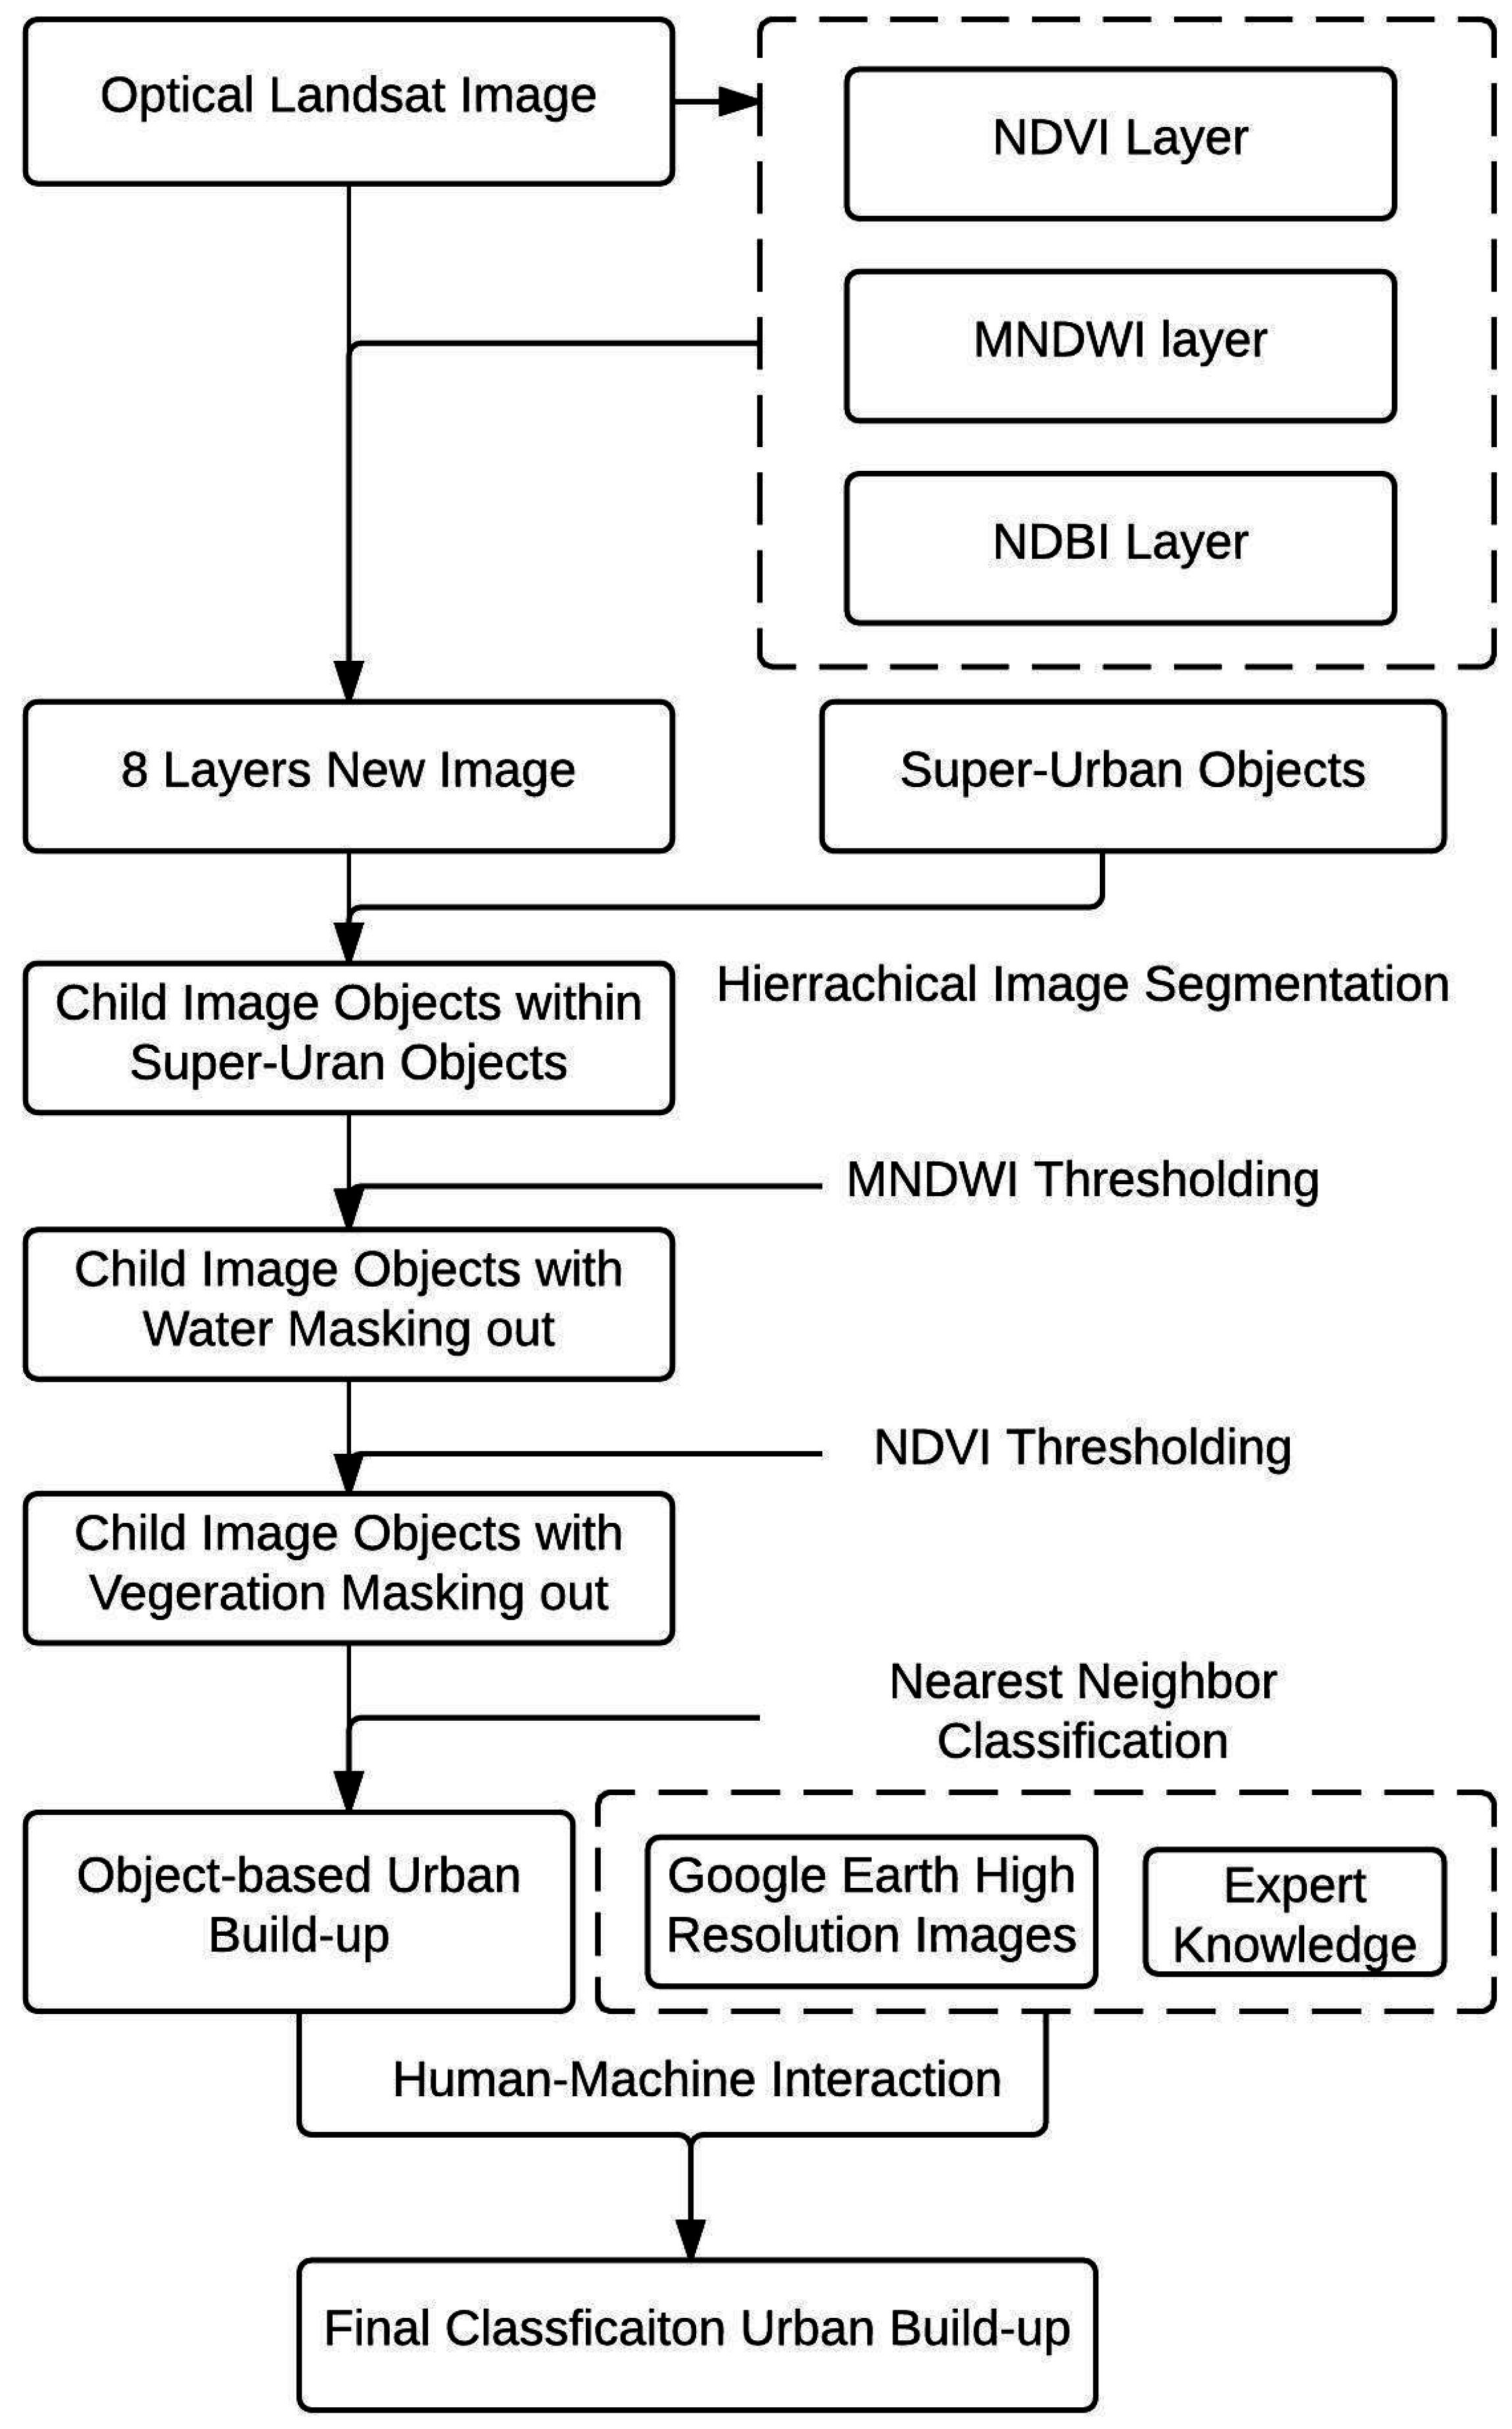
2.5. Object-Based Image Classification

During the past two decades, extracting urban built-up area and other land cover types from Landsat-like images has been widely practiced with a variety of automated and semi-automated algorithms [23,33,54,55]. These included pixel-by-pixel supervised and unsupervised methods, the neural network method, the regression tree method, the sub-pixel decomposition method and the relatively new object-based method [56,57,58,59]. To map LULC at large scales with Landsat-like images, it is necessary to utilize automated classification routines as much as possible to save human resources. However, experimental evaluation also suggests that automated classifiers are not able to achieve high accuracy results due to the significant spectral confusion among land cover types [33,35]. Object-based approaches (vs. pixel-based) are preferred in applications in high-resolution images because high-resolution images have large spectral variation and heterogeneity among pixels, which make per-pixel classification difficult to accomplish accurately in spite of rich spatial and spectral information [57,60,61]. For medium resolution images like TM/ETM+, similar accuracy is also achieved in many cases between pixel-based and object-based classification [57]. However, a large number of misclassified pixels, known as the “salt-and-pepper effect” that is generated through pixel-based classification, requires substantial post-classification processing for removal. In object-based classification, this issue can be eliminated with good image segmentation. Additionally, when images are segmented at different scales, an object-based classification allows hierarchical image analysis that exploits the shape, texture and contextual information and also provides easy human-machine interactions. We therefore adopted a knowledge-integrated, object-based approach. Knowledge-based rule sets and a sample-trained Nearest Neighbor classifier were used to produce the initial classification; and knowledge-based human-machine interaction was used to tune the initial classification for corrections (Figure 4).
Classification was applied to separate urban clusters, which were all covered by 1 to 3 Landsat scenes and then merged for the entire region. Three index images were calculated first for feature enhancement to aid image classification: the normalized difference vegetation index (NDVI) to enhance vegetated pixels, the modified normalized difference water index (MNDWI) [62] to enhance water pixels and the normalized difference built-up index (NDBI) to enhance built-up pixels. A new Landsat image dataset was created with these three layers added as additional bands.
Image sub-objects were then generated using the multi-resolution image segmentation algorithm within super-urban objects through a hierarchical image segmentation scheme. Multi-resolution image segmentation is a bottom-up region-merging algorithm that begins with one-pixel objects and includes a pair-wise clustering process to merge smaller objects into larger ones with controlled texture and color heterogeneity criteria [63,64]. Although multi-resolution image segmentation is essential for object-based classification, there are no established criteria to determine the best segmentation parameters. We employed a qualitative visual inspection method [65]. One of the most important parameters is the scale parameter, which determines the average size and homogeneity/heterogeneity of image objects. To identify a proper scale parameter, we examined and compared the uniformity of the visual properties of the image objects through a series of trials. Depending on urban cluster size and complexity, scale parameters varying between 30 and 90 were used for different images.
Threshold-based rule sets were then applied to classify the easy classes (e.g., water and green vegetation). An MNDWI threshold was used to mask water while an NDVI threshold was used for masking green vegetation (i.e., forests and urban greens) from the remaining image objects. Thresholds varied by images and were determined with the “Feature View” function in eCognition 8.7, which allowed gradual changes of the threshold at 0.01 intervals with real-time display. Afterwards, by defining training image objects as urban built-up areas and others, a supervised classification using a Nearest Neighbor classifier was employed. The feature space of the Nearest Neighbor was also optimized from the five Landsat spectral bands and the three index bands with the feature space optimization procedure of eCognition 8.7, which calculated a subset of features with the greatest separate distance [64]. Due to frequent cloudy weather under the tropical monsoon climate in growing seasons, most cloud-free images collected were in the winter, which increased the spectral confusion among harvested cropland and urban built-up land. This caused misclassification, especially in the urban-rural fringes. A few urban built-up image objects with low reflectance might have also been missed. Such misclassifications were eliminated through knowledge-based manual correction.
After the automated procedure, manual corrections were applied to further improve the object-based classification based on various expert knowledge (Table 2) and visual comparison with high-resolution images (i.e., Google Earth). Segmented image objects allowed easy manual correction. This included revising image objects around the urban-rural fringes, picking up missed low reflectance built-up area and excluding bare soil. Expert knowledge helped to identify suspicious image objects while high-resolution images were used for verification. Figure 5 shows an example of the object-based classification.

2.6. Validation of Urban Built-up Classification

In order to validate maps created using an object-based approach, the reference sample units should be the same as the segments (i.e., polygons) rather than the pixels and an area-based error matrix should be developed. However, it is difficult to acquire widely-distributed object-based reference samples. More so, a state-of-the-art approach for object-based accuracy assessment is not available [57]. As a result, an error matrix based on point-based sampling is still widely used in object-based studies [57,64]. In this study, we used a two-tiered approach to make up for the deficiency without real object-based references: one at the object level and the other at the pixel level.
First, we randomly selected 180 urban built-up objects among the four countries to examine the omission and commission errors at the object level. The randomly-selected image objects were exported as a polygon vector layers, imported to Google Earth Pro and then compared against the Google Earth VHR images (≤4 m) using a double-blind procedure with an independent photo-interpretation analyst. When >90% of a polygon’s area was correctly interpreted as urban built-up area, it was labeled as urban built-up area; if not, it was labeled as non-urban built-up area. The total area of incorrectly-classified urban built-up polygons among the urban built-up class and the total area of missed urban built-up polygons in the non-urban built-up class was used to calculate total commission and omission errors.
The second tier assessment was designed to assess accuracy at the pixel level. Segmentation of an image may not always represent conterminous pixels of the same land cover type; therefore, a pixel-level assessment also merits advantage. We avoided this assessment across the entire study area because it may require a large number of reference locations that are labor intensive and difficult to interpret. Large cities are usually more difficult to map due to high dimensions of dynamics. We thus selected some of the largest cities for assessment instead. Hanoi, Vientiane, Phnom Penh and Yangon were selected from Vietnam, Laos, Cambodia and Myanmar, respectively. For each city, 120 random pixels were generated within super-urban objects with a stratified strategy (30 points in classified urban built-up and the remaining points in other area). These pixels were then converted to 30 × 30 m squares and were verified in Google Earth as one of the two labels: “urban built-up” if more than 50% of the square was composed of urban built-up surface and “non-urban built-up” if otherwise. Because there might have been horizontal positional errors in Google Earth [54], a sampled square was labeled as urban built-up only when the >50% criterion was satisfied after shifting horizontally 40 meters away. An error matrix was then calculated based on these manually-interpreted references for each city.

2.7. Change Analysis in Built-up Areas

A trend analysis was conducted based on the time series of annual DMSP/OLS NTL composites to analyze the spatial and temporal patterns of urban built-up changes from 1992 to 2010. Strong correlations between DMSP/OLS NTL data and population density, economic activity and impervious area [66,67] imply that the increase in NTL brightness is indicative of the growth of economic and built-up density. In order to reduce the variations and differences among sensors, an inter-calibration of NTL data was first performed following Elvidge et al. [42]. When there were multiple annual DMSP/OLS NTL composites of a year, we chose the one with the largest number of could-free observations (Table S2). The Mann–Kendall test [57] was performed to detect the monotonic trends in the inter-calibrated DMSP/OLS NTL time series. Sen’s slope estimator [58] was used to compute numerical trend values for pixels passing the Mann–Kendall trend tests at the 95% confidence level. Mann–Kendall and Sen’s slope are non-parametric; therefore, they are robust to data outliers left after inter-calibration.
The results from trend analysis were classified into two classes: areas with significant increase in NTL brightness and areas without significant change. Areas with significant NTL brightness increase included urban built-up environment, as well as other artificial or human settlement surfaces. The 30-m urban built-up map produced for 2010 was then overlaid with the classified map from trend analysis to extract urban built-up areas with/without a significant increase in NTL brightness. Urban built-up areas with no significant NTL change were assumed to be stable/old urban built-up areas that had existed since 1992, while the other urban built-up areas with significant NTL changes were assumed to be new urban built-up areas that had newly emerged or intensified after 1992. Because the NTLs were obtained at a lower spatial resolution (i.e., 1000 m), 30-m urban built-up area was first aggregated to 1000-m resolution before spatial analysis.

3. Results

3.1. Accuracy Assessment

Our effort to develop the 30-m resolution urban built-up map was successful according to the accuracy assessment. The commission error and omission errors calculated based on the areas of these objects were 0.9% and 5.3%, respectively. The pixel-based validation produced a high accuracy among all selected cities, as well, with some variations among the cities (Table 3). The overall accuracy for Hanoi, Yangon, Vientiane and Phnom Penh was >90%, with the producer’s accuracy (one commission error) for urban built-up area at 82.7%, 94.0%, 92.8% and 88.8% and the user’s accuracy (one commission error) at 85.7%, 85.0%, 84.2% and 86.7%, respectively. The Kappa coefficient was 0.78 for Hanoi, 0.87 for Yangon, 0.83 for Vientiane and 0.90 for Phnom Penh, indicating strong overall agreement after agreement due to chance was factored out.

3.2. Urban Built-up Area in 2010

Urban built-up areas were distributed unevenly throughout the study area (Figure 6). Most built-up areas were distributed around large metropolitan areas (i.e., Hanoi, Ho Chi Minh, Vientiane, Phnom Penh, Naypyidaw and Yangon) and the coastal area of Vietnam (Figure 6). Among the four countries, Vietnam was the most urbanized country and owned more urban built-up land than all of the other countries combined. Vietnam had a total of 2857.92 km2 urban built-up area, occupying about 0.91% of its total land area; Laos had a total of 199.8 km2 urban built-up area, occupying about 0.09% of its total land area; Cambodia had a total of 212.5 km2 urban built-up area, occupying about 0.12% of its total land area; and Myanmar had a total of 1044.65 km2 urban built-up area, occupying about 0.15% of its total land area. The population density was 9.2k, 9.8k, 13.0k and 15.18k people per km2 urban built-up area in Vietnam, Laos, Cambodia and Myanmar, respectively. Considering the commission and omission errors from object-based accuracy assessment, the total urban built-up area was estimated to be between 2832.20 and 3020.56 km2, 198.00 and 211.19 km2, 210.5 and 224.62 km2 and 1035.24 and 1104.21 km2 for Vietnam, Laos, Cambodia and Myanmar, respectively.

3.3. Urban Built-up Land and NTL Dynamics

Most areas around urban built-up land within the four countries significantly increased in NTL brightness (Figure 7). The fastest increasing trends were observed in large urban clusters, such as Hanoi, Ho Chi Minh City, Vientiane, Phnom Penh and Naypyidaw. In terms of spatial distribution, the largest areas of increased NTL brightness were observed in these same large metropolitan areas, as well as the coastal cities of Vietnam. While 25.4% of the total area of Vietnam had experienced an increase in NTL brightness, only 1.6%, 1.8% and 1.9% of the total area of Laos, Myanmar and Cambodia, respectively, had a significant increase in NTL brightness.
Old urban built-up areas (i.e., stable urban built-up without NTL change since 1992) and new urban built-up areas (i.e., newly-emerged or intensified urban build-up area with a significant NTL increase after since 1992) were clearly shown when the 2010 urban built-up map was overlaid with the NTL temporal trends (Figure 8). Three typical types of cities were found: (1) completely new cities with no old urban built-up areas since 1992 (Figure 8a); (2) old cities with small increase in new urban build-up areas (Figure 8b); and (3) fast growing cities with rapid increase in NTL brightness around their old urban built-up areas (Figure 8c). The new urban built-up areas in 2010 were 6.0-, 0.24-, 8.8-, 3.6-times that of old built-up areas in 1992 for Laos, Myanmar, Vietnam and Cambodia, respectively, suggesting that urbanization in this region was fast, except for Myanmar.

4. Discussion

It is important to know the amount of land that has been converted to urban built-up area in Vietnam, Cambodia, Laos and Myanmar since the transition started from planning-based economies to market-based economies, as that is the key information in assessing the impact of urbanization on biodiversity, carbon and hydrological processes, environmental conditions and in understanding the social-economic drivers of urbanization. However, no consistent estimates of the urban built-up areas has existed for these countries, in spite of the fact that we have advanced remote sensing, GIS technologies and multiple global urban built-up maps. Our product, developed at 30-m resolution, accomplished a much higher accuracy than previous coarse resolution maps and, therefore, provided a more reliable answer.
The increased accuracy of our product is attributed to its medium 30-m resolution, which provides a better match with the thematic definition of “urban built-up areas” than the coarse resolution products, which cannot capture much of the spatial complexity in urban landscapes [68]. For example, because of the mixed pixels, other products cannot detect small, isolated built-up patches (Figure 9). Although there are still issues of mixed pixels for Landsat images [33,69], a much higher level of spatial detail is allowed (Figure 9). Urban landscape is structurally complex and highly dynamic, especially in Southeast Asia’s fast, urbanizing countries. Many important landscape structures of a city, such as the green spaces and water bodies, could not be reliably isolated from urban maps based on 300 to 1000-m resolutions, but were quite visible and separable at 30-m resolution (Figure 5). These intra-urban structures are important in urban planning and management [70] and for modeling many ecosystem processes and functions of the urban landscapes, such as the urban heat island effect [71] or air pollution [9,72]. Although this study focused on regional-scale urban built-up mapping, our product could be used to study intra-urban landscape structures when combined with other 30-m LULC, such as the 30-m forest cover [73] and the GLC-30 [33].
The rich spatial information of 30-m LULC maps is useful in many applications. However, large-scale monitoring of LULC using Landsat-like data is not an easy task because automatic algorithms alone do not perform well. We developed an innovative approach by integrating the DMSP/OLS lighted area, artificial surface from GLC-30 and other ancillary information to define super-urban objects, which substantially reduced the amount of images for processing. The object-based classification with hierarchical image segmentation also allowed easy integration of expert knowledge and manual correction, which greatly improved the overall accuracy. This approach can be readily applied to other developing countries to produce high-resolution, urban-related land cover products.
The urban built-up area has been rapidly increasing in transitional countries in Southeast Asia, as revealed by DMSP/OLS NTL trends and the current 2010 urban built-up extent. While the urban built-up area may have increased 880%, 600% and 360% from 1992 to 2010 in Vietnam, Laos and Cambodia, it has only increased about 24% in Myanmar. Based on the tight relationship between urban expansion and economic development [74], this implies the great economic success of transitioning to a free market in Vietnam, Laos and Cambodia, but not in Myanmar. The Gross Domestic Product (GDP) increased 10.7-, 5.3-, 3.4- and 0.25-times in Vietnam, Laos, Cambodia and Myanmar, respectively, which correlated well with the increasing rate of urban built-up area (Figure 10). The current urban built-up areas in the four countries were also correlated well with current GDP and urban population (Figure 10). This further verified our implicit hypothesis that the current extent and historical dynamics of urban built-up areas in the four countries resulted from economic development. Myanmar’s urban built-up area increased slower than the other three countries because its economic development had largely fallen behind due to decades of military authoritarian rule, which hindered its transition.
Our study also has its limitations. For example, although the DMSP/OLS NTL time series were successfully adopted to explore urbanization dynamics, there were some sources of uncertainty inherent from the spatial and radiometric resolution of the DMSP/OLS NTL images. To address this limitation for future studies, a new generation of NTL data that provide improved measurements can be incorporated [75] or other data of higher spatial and spectral resolution optical image with a better characterization of urban areas can be integrated [27].

5. Conclusions

We developed a 30-m resolution urban built-up map of Southeast Asian transitional economies (Vietnam, Laos, Cambodia and Myanmar) in 2010 by developing an object-based classification approach and by fusing data from multiple sources. We found that the total urban built-up area was 2857.92 km2 for Vietnam, 1044.65 km2 for Myanmar, 212.5 km2 for Cambodia and 199.3 km2 for Laos in 2010. Among the four transitional economies, Vietnam had the largest proportion of its total land as urban built-up area (0.91%), followed by Myanmar (0.15%), Cambodia (0.12%) and Laos (0.09%). The DMSP/OLS NTL time series images were successfully used to examine urban dynamics from 1992 to 2010 with a Mann–Kendall trend analysis. Among the four transitional economies, Vietnam had the fastest increase in urban built-up area (880%) from 1992 to 2010, followed by Laos (600%) and Cambodia (360%). Myanmar had experienced only a 24% increase of urban built-up from 1992 to 2010. The different rates of urban expansion reflected the different magnitude of success in economic transition. These dramatic changes in successful countries that opened up early (e.g., Vietnam) suggest that future studies should provide timely and higher temporal/spatial resolution products in order to catch such a change. Our high resolution and accuracy information about urban built-up areas could be useful to both city and country level urban management; and our approach can be readily applied to other developing countries that lack national-level 30-m resolution built-up area products.

Supplementary Materials

The following are available online at www.mdpi.com/2072-4292/8/10/819/s1: Table S1: Landsat dataset (Path 32, Row 27) used in this study, Table S2: DMSP/OLS data used in this study and their inter-annual calibration equation.

Acknowledgments

We would like to acknowledge the financial support from the National Aeronautics and Space Administration’s (NASA) Land Cover and Land Use Change Program (LCLUC) through its grant to Michigan State University (Grant No. NNX15AD51G). We thank our local collaborators who provided assistance to our field trips in Cambodia, Laos, Myanmar and Vietnam, including Duong Dinh Nguyen, Lam Dao Nguyen, Pham Thi Mai Thy, Thi Thuy Hang Nguyen, Tep Makathy, Sok Vanna, Zaw Naing, Myint Nwe Zin, Souphanthalop Outhailak, Saly Vasaly Sisavath and numerous others. We also thank Dengsheng Lu for his constructive comments, Yuanwei Qin for his help on acquiring data and Gabriela Shirkey for editing the manuscript. Any opinions, findings and conclusions or recommendations expressed in this paper are those of the authors and do not necessarily reflect the views of NASA.

Author Contributions

Zutao Ouyang conceived of, designed and performed the experiments. Zutao Ouyang, Peilei Fan and Jiquan Chen analyzed the data and wrote the paper.

Conflicts of Interest

The authors declare no conflict of interest.

References

  1. Shepherd, J.M. A review of current investigations of urban-induced rainfall and recommendations for the future. Earth Interact. 2005, 9, 1–27. [Google Scholar] [CrossRef]
  2. Imhoff, M.L.; Bounoua, L.; DeFries, R.; Lawrence, W.T.; Stutzer, D.; Tucker, C.J.; Ricketts, T. The consequences of urban land transformation on net primary productivity in the United States. Remote Sens. Environ. 2004, 89, 434–443. [Google Scholar] [CrossRef]
  3. Gibson, J.; Li, C.; Boe-Gibson, G. Economic growth and expansion of China’s urban land area: Evidence from administrative data and night lights, 1993–2012. Sustainability 2014, 6, 7850–7865. [Google Scholar] [CrossRef]
  4. Churkina, G.; Brown, D.G.; Keoleian, G. Carbon stored in human settlements: The conterminous United States. Glob. Chang. Biol. 2010, 16, 135–143. [Google Scholar] [CrossRef]
  5. Brabec, E.; Schulte, S.; Richards, P.L. Impervious surfaces and water Quality: A review of current literature and its implications for watershed planning. J. Plan. Lit. 2002, 16, 499–514. [Google Scholar] [CrossRef]
  6. Uneralp, B.; Seto, K.C. Futures of global urban expansion: Uncertainties and implications for biodiversity conservation. Environ. Res. Lett. 2013, 8, 014025. [Google Scholar] [CrossRef]
  7. Zhou, L.; Dickinson, R.E.; Tian, Y.; Fang, J.; Li, Q.; Kaufmann, R.K.; Tucker, C.J.; Myneni, R.B. Evidence for a significant urbanization effect on climate in China. Proc. Natl. Acad. Sci. USA 2004, 101, 9540–9544. [Google Scholar] [CrossRef] [PubMed]
  8. Giannico, V.; Lafortezza, R.; John, R.; Sanesi, G.; Pesola, L.; Chen, J. Estimating Stand Volume and above-Ground Biomass of Urban Forests Using LiDAR. Remote Sens. 2016, 8, 339. [Google Scholar] [CrossRef]
  9. Chen, J.; Zhu, L.; Fan, P.; Tian, L.; Lafortezza, R. Do green spaces affect the spatiotemporal changes of PM2.5 in Nanjing? Ecol. Process. 2016, 5. [Google Scholar] [CrossRef] [PubMed]
  10. Ellis, E.C.; Ramankutty, N. Putting people in the map: Anthropogenic biomes of the world. Front. Ecol. Environ. 2008, 6, 439–447. [Google Scholar] [CrossRef]
  11. Schneider, A.; Mertes, C.M.; Tatem, A.J.; Tan, B.; Sulla-Menashe, D.; Graves, S.J.; Patel, N.N.; Horton, J.A.; Gaughan, A.E.; Rollo, J.T.; et al. A new urban landscape in East–Southeast Asia, 2000–2010. Environ. Res. Lett. 2015, 10, 034002. [Google Scholar] [CrossRef]
  12. Saksena, S.; Fox, J.; Spencer, J.; Castrence, M.; DiGregorio, M.; Epprecht, M.; Sultana, N.; Finucane, M.; Nguyen, L.; Vien, T.D. Classifying and mapping the urban transition in Vietnam. Appl. Geogr. 2014, 50, 80–89. [Google Scholar] [CrossRef]
  13. Schneider, A.; Friedl, M.A.; Potere, D. A new map of global urban extent from MODIS satellite data. Environ. Res. Lett. 2009, 4, 044003. [Google Scholar] [CrossRef]
  14. Kuang, W.; Liu, J.; Zhang, Z.; Lu, D.; Xiang, B. Spatiotemporal dynamics of impervious surface areas across China during the early 21st century. Chin. Sci. Bull. 2013, 58, 1691–1701. [Google Scholar] [CrossRef]
  15. Jing, W.; Yang, Y.; Yue, X.; Zhao, X. Mapping urban areas with integration of DMSP/OLS nighttime light and MODIS data using machine learning techniques. Remote Sens. 2015, 7, 12419–12439. [Google Scholar] [CrossRef]
  16. Potere, D.; Schneider, A.; Angel, S.; Civco, D. Mapping urban areas on a global scale: Which of the eight maps now available is more accurate? Int. J. Remote Sens. 2009, 30, 6531–6558. [Google Scholar] [CrossRef]
  17. Friedl, M.A.; Sulla-Menashe, D.; Tan, B.; Schneider, A.; Ramankutty, N.; Sibley, A.; Huang, X. MODIS Collection 5 global land cover: Algorithm refinements and characterization of new datasets. Remote Sens. Environ. 2010, 114, 168–182. [Google Scholar] [CrossRef]
  18. Bontemps, S.; Defourny, P.; Radoux, J.; Bogaert, E.; Lamarche, C.; Achard, F.; Mayaux, P.; Boettcher, M.; Brockmann, C.; Kirches, G.; et al. Consistent global land cover maps for climate modelling communities: Current achievements of the ESA’ land cover CCI. In Proceedings of the ESA Living Planet Symposium 2013, Edinburgh, UK, 9–13 September 2013.
  19. Sutton, P.C.; Elvidge, C.D.; Tuttle, B.T.; Ziskin, D.; Baugh, K.; Ghosh, T. A 2010 mapping of the constructed surface area density for SE Asia—Preliminary results. Proc. Asia Pac. Adv. Netw. 2010, 30, 181–189. [Google Scholar] [CrossRef]
  20. Mertes, C.M.; Schneider, A.; Sulla-Menashe, D.; Tatem, A.J.; Tan, B. Detecting change in urban areas at continental scales with MODIS data. Remote Sens. Environ. 2015, 158, 331–347. [Google Scholar] [CrossRef]
  21. Liu, Z.; He, C.; Zhou, Y.; Wu, J. How much of the world’s land has been urbanized, really? A hierarchical framework for avoiding confusion. Landsc. Ecol. 2014, 29, 763–771. [Google Scholar] [CrossRef]
  22. Kuang, W.; Chen, L.; Liu, J.; Xiang, W.; Chi, W.; Lu, D.; Yang, T.; Pan, T.; Liu, A. Remote sensing-based artificial surface cover classification in Asia and spatial pattern analysis. Sci. China Earth Sci. 2016, 59, 1720–1737. [Google Scholar] [CrossRef]
  23. Lu, D.; Li, G.; Moran, E. Current situation and needs of change detection techniques. Int. J. Image Data Fusion 2014, 5, 13–38. [Google Scholar] [CrossRef]
  24. Zhang, C.; Chen, Y.; Lu, D. Detecting fractional land-cover change in arid and semiarid urban landscapes with multitemporal Landsat Thematic mapper imagery. GISci. Remote Sens. 2015, 52, 700–722. [Google Scholar] [CrossRef]
  25. Imhoff, M.L.; Lawrence, W.T.; Stutzer, D.C.; Elvidge, C.D. A technique for using composite DMSP/OLS “City Lights” satellite data to map urban area. Remote Sens. Environ. 1997, 61, 361–370. [Google Scholar] [CrossRef]
  26. Small, C.; Pozzi, F.; Elvidge, C.D. Spatial analysis of global urban extent from DMSP-OLS night lights. Remote Sens. Environ. 2005, 96, 277–291. [Google Scholar] [CrossRef]
  27. Huang, X.; Schneider, A.; Friedl, M.A. Mapping sub-pixel urban expansion in China using MODIS and DMSP/OLS nighttime lights. Remote Sens. Environ. 2016, 175, 92–108. [Google Scholar] [CrossRef]
  28. Zhang, Q.; Seto, K.C. Mapping urbanization dynamics at regional and global scales using multi-temporal DMSP/OLS nighttime light data. Remote Sens. Environ. 2011, 115, 2320–2329. [Google Scholar] [CrossRef]
  29. Huang, Q.; Yang, X.; Gao, B.; Yang, Y.; Zhao, Y. Application of DMSP/OLS Nighttime Light Images: A Meta-Analysis and a Systematic Literature Review. Remote Sens. 2014, 6, 6844–6866. [Google Scholar] [CrossRef]
  30. Zhou, Y.; Smith, S.J.; Elvidge, C.D.; Zhao, K.; Thomson, A.; Imhoff, M. A cluster-based method to map urban area from DMSP/OLS nightlights. Remote Sens. Environ. 2014, 147, 173–185. [Google Scholar] [CrossRef]
  31. Liu, Z.; He, C.; Zhang, Q.; Huang, Q.; Yang, Y. Extracting the dynamics of urban expansion in China using DMSP-OLS nighttime light data from 1992 to 2008. Landsc. Urban Plan. 2012, 106, 62–72. [Google Scholar] [CrossRef]
  32. Gibson, J.; Boe-Gibson, G.; Stichbury, G. Urban land expansion in India 1992–2012. Food Policy 2015, 56, 100–113. [Google Scholar] [CrossRef]
  33. Chen, J.; Chen, J.; Liao, A.; Cao, X.; Chen, L.; Chen, X.; He, C.; Han, G.; Peng, S.; Lu, M.; et al. Global land cover mapping at 30 m resolution: A POK-based operational approach. ISPRS J. Photogramm. Remote Sens. 2014, 103, 7–27. [Google Scholar] [CrossRef]
  34. Kuang, W.; Chi, W.; Lu, D.; Dou, Y. A comparative analysis of megacity expansions in China and the U.S.: Patterns, rates and driving forces. Landsc. Urban Plan. 2014, 132, 121–135. [Google Scholar] [CrossRef]
  35. Gong, P.; Wang, J.; Yu, L.; Zhao, Y.; Zhao, Y.; Liang, L.; Niu, Z.; Huang, X.; Fu, H.; Liu, S.; et al. Finer resolution observation and monitoring of global land cover: First mapping results with Landsat TM and ETM+ data. Int. J. Remote Sens. 2013, 34, 2607–2654. [Google Scholar] [CrossRef]
  36. Chen, C.F. Urban growth mapping from Landsat data using linear mixture model in Ho Chi Minh City, Vietnam. J. Appl. Remote Sens. 2012, 6, 063543. [Google Scholar] [CrossRef]
  37. Pham, H.M.; Yamaguchi, Y.; Bui, T.Q. A case study on the relation between city planning and urban growth using remote sensing and spatial metrics. Landsc. Urban Plan. 2011, 100, 223–230. [Google Scholar] [CrossRef]
  38. Pham, H.M.; Yamaguchi, Y. Urban growth and change analysis using remote sensing and spatial metrics from 1975 to 2003 for Hanoi, Vietnam. Int. J. Remote Sens. 2011, 32, 1901–1915. [Google Scholar] [CrossRef]
  39. International Monetary Fund. Transition Economies: An IMF Perspective on Progress and Prospects. Available online: http://www.imf.org/external/np/exr/ib/2000/110300.htm#I (accessed on 7 October 2016).
  40. Than, M.; Thein, M. Transitional economy of myanmar-present status, developmental divide and future prospects. ASEAN Econ. Bull. 2007, 24, 98–118. [Google Scholar] [CrossRef]
  41. Griffin, K. Economic Reform in Vietnam; Keith Griffin, S.T., Ed.; Martin’s Press Inc.: New York, NY, USA, 1998. [Google Scholar]
  42. Elvidge, C.D.; Ziskin, D.; Baugh, K.E.; Tuttle, B.T.; Ghosh, T.; Pack, D.W.; Erwin, E.H.; Zhizhin, M. A fifteen year record of global natural gas flaring derived from satellite data. Energies 2009, 2, 595–622. [Google Scholar] [CrossRef]
  43. Bernstein, L.S.; Adler-Golden, S.M.; Sundberg, R.L.; Levine, R.Y.; Perkins, T.C.; Berk, A.; Ratkowski, A.J.; Felde, G.; Hoke, M.L. Validation of the QUick atmospheric correction (QUAC) algorithm for VNIR-SWIR multi- and hyperspectral imagery. Proc. SPIE 2005, 5806, 668–678. [Google Scholar]
  44. GlobeLand30. Available online: http://glc30.tianditu.com/ (accessed on 1 October 2016).
  45. MODIS NDVI. Available online: https://modis.gsfc.nasa.gov/data/dataprod/mod13.php (accessed on 1 October 2016).
  46. National Centers for Environmental Information. Available online: http://maps.ngdc.noaa.gov (accessed on 1 October 2016).
  47. USGS Eearth Explorer. Available online: http://earthexplorer.usgs.gov/ (accessed on 1 October 2016).
  48. Land Scan. Available online: http://web.ornl.gov/sci/landscan/ (accessed on 1 October 2016).
  49. Google Earth. Available online: https://www.google.com/earth/ (accessed on 1 October 2016).
  50. Global Rural-Urban Mapping Project. Available online: http://sedac.ciesin.columbia.edu/data/set/grump-v1-settlement-points (accessed on 1 October 2016).
  51. McIntyre, N.E.; Knowles-Yánez, K.; Hope, D. Urban Ecology as an Interdisciplinary Field: Differences in the use of “Urban” between the Social and Natural Sciences. In Urban Ecology; Springer: Boston, MA, USA, 2008; pp. 49–65. [Google Scholar]
  52. Wu, J. Urban ecology and sustainability: The state-of-the-science and future directions. Landsc. Urban Plan. 2014, 125, 209–221. [Google Scholar] [CrossRef]
  53. Zhang, Q.; Schaaf, C.; Seto, K.C. The Vegetation Adjusted NTL Urban Index: A new approach to reduce saturation and increase variation in nighttime luminosity. Remote Sens. Environ. 2013, 129, 32–41. [Google Scholar] [CrossRef]
  54. Lu, D.; Weng, Q. A survey of image classification methods and techniques for improving classification performance. Int. J. Remote Sens. 2007, 28, 823–870. [Google Scholar] [CrossRef]
  55. Coppin, P.; Jonckheere, I.; Nackaerts, K.; Muys, B.; Lambin, E. Review Article Digital change detection methods in ecosystem monitoring: A review. Int. J. Remote Sens. 2004, 25, 1565–1596. [Google Scholar] [CrossRef]
  56. Huang, Z.; Jia, X. Integrating remotely sensed data, GIS and expert knowledge to update object-based land use/land cover information. Int. J. Remote Sens. 2012, 33, 905–921. [Google Scholar] [CrossRef]
  57. Hussain, M.; Chen, D.; Cheng, A.; Wei, H.; Stanley, D. Change detection from remotely sensed images: From pixel-based to object-based approaches. ISPRS J. Photogramm. Remote Sens. 2013, 80, 91–106. [Google Scholar] [CrossRef]
  58. Sesnie, S.E.; Gessler, P.E.; Finegan, B.; Thessler, S. Integrating Landsat TM and SRTM-DEM derived variables with decision trees for habitat classification and change detection in complex neotropical environments. Remote Sens. Environ. 2008, 112, 2145–2159. [Google Scholar] [CrossRef]
  59. Yuan, H.; Van Der Wiele, C.F.; Khorram, S. An automated artificial neural network system for land use/land cover classification from Landsat TM imagery. Remote Sens. 2009, 1, 243–265. [Google Scholar] [CrossRef]
  60. Blaschke, T.; Strobl, J. What’s wrong with pixels? Some recent developments interfacing remote sensing and GIS. Interfacing Remote Sens. GIS 2001, 6, 12–17. [Google Scholar]
  61. Myint, S.W.; Gober, P.; Brazel, A.; Grossman-Clarke, S.; Weng, Q. Per-pixel vs. object-based classification of urban land cover extraction using high spatial resolution imagery. Remote Sens. Environ. 2011, 115, 1145–1161. [Google Scholar] [CrossRef]
  62. Xu, H. Extraction of urban built-up land features from Landsat imagery using a thematic-oriented index combination technique. Photogramm. Eng. Remote Sens. 2007, 73, 1381–1391. [Google Scholar] [CrossRef]
  63. Benz, U.C.; Hofmann, P.; Willhauck, G.; Lingenfelder, I.; Heynen, M. Multi-resolution, object-oriented fuzzy analysis of remote sensing data for GIS-ready information. ISPRS J. Photogramm. Remote Sens. 2004, 58, 239–258. [Google Scholar] [CrossRef]
  64. Ouyang, Z.T.; Zhang, M.Q.; Xie, X.; Shen, Q.; Guo, H.Q.; Zhao, B. A comparison of pixel-based and object-oriented approaches to VHR imagery for mapping saltmarsh plants. Ecol. Inform. 2011, 6, 136–146. [Google Scholar] [CrossRef]
  65. Chen, Z.; Zhao, Z.; Gong, P.; Zeng, B. A new process for the segmentation of high resolution remote sensing imagery. Int. J. Remote Sens. 2006, 27, 4991–5001. [Google Scholar] [CrossRef]
  66. Elvidge, C.D.; Baugh, K.E.; Kihn, E.A.; Kroehl, H.W.; Davis, E.R.; Davis, C.W. Relation between satellite observed visible-near infrared emissions, population, economic activity and electric power consumption. Int. J. Remote Sens. 2010, 18, 1373–1379. [Google Scholar] [CrossRef]
  67. Lu, D.; Tian, H.; Zhou, G.; Ge, H. Regional mapping of human settlements in southeastern China with multisensor remotely sensed data. Remote Sens. Environ. 2008, 112, 3668–3679. [Google Scholar] [CrossRef]
  68. Cohen, W.B.; Maiersperger, T.K.; Yang, Z.; Gower, S.T.; Turner, D.P.; Ritts, W.D.; Berterretche, M.; Running, S.W. Comparisons of land cover and LAI estimates derived from ETM+ and MODIS for four sites in North America: A quality assessment of 2000/2001 provisional MODIS products. Remote Sens. Environ. 2003, 88, 233–255. [Google Scholar] [CrossRef]
  69. Fan, F.; Deng, Y. Enhancing endmember selection in multiple endmember spectral mixture analysis (MESMA) for urban impervious surface area mapping using spectral angle and spectral distance parameters. Int. J. Appl. Earth Obs. Geoinf. 2014, 33, 290–301. [Google Scholar] [CrossRef]
  70. Musakwa, W.; van Niekerk, A. Earth observation for sustainable urban planning in developing vountries: Needs, trends, and future directions. J. Plan. Lit. 2015, 30, 149–160. [Google Scholar] [CrossRef] [Green Version]
  71. Amanollahi, J.; Tzanis, C.; Ramli, M.F.; Abdullah, A.M. Urban heat evolution in a tropical area utilizing Landsat imagery. Atmos. Res. 2016, 167, 175–182. [Google Scholar] [CrossRef]
  72. Nowak, D.J.; Crane, D.E.; Stevens, J.C. Air pollution removal by urban trees and shrubs in the United States. Urban For. Urban Green. 2006, 4, 115–123. [Google Scholar] [CrossRef]
  73. Hansen, M.C.; Potapov, P.V.; Moore, R.; Hancher, M.; Turubanova, S.A.; Tyukavina, A.; Thau, D.; Stehman, S.V.; Goetz, S.J.; Loveland, T.R.; et al. High-resolution global maps of 21st-century forest cover change. Science 2013, 342, 850–853. [Google Scholar] [CrossRef] [PubMed]
  74. Fan, P.; Chen, J.; John, R. Urbanization and environmental change during the economic transition on the Mongolian Plateau: Hohhot and Ulaanbaatar. Environ. Res. 2016, 144, 96–112. [Google Scholar] [CrossRef] [PubMed]
  75. Elvidge, C.D.; Baugh, K.E.; Zhizhin, M.; Hsu, F.C. Why VIIRS data are superior to DMSP for mapping nighttime lights. Proc. Asia Pac. Adv. Netw. 2013, 35, 62–69. [Google Scholar] [CrossRef]
  76. The World Bank. Available online: http://www.worldbank.org (accessed on 1 October 2016).
Figure 1. Comparison of the estimated urban built-up area in Cambodia, Laos, Myanmar and Vietnam among different coarse resolution products. GLOBC-300 is the 300-m resolution the GlobCover land cover in 2009 by the European Space Agency [18]; IMPSA-100 is the 1000-m resolution global impervious surface area in 2010, which was converted to urban built-up by applying a 20% threshold [16,19]; MODIS-500 is the 500-m resolution global land cover developed from MODIS images in 2010 [13,17] and MODIS-250 is based on the statistics from the 250-m resolution urban built-up area developed with MODIS images in 2010 [11,20].
Remotesensing 08 00819 g001
Figure 2. Study area in Southeast Asia and locations of the four selected cities for accuracy assessment, which are represented by green-black symbols.
Remotesensing 08 00819 g002
Figure 3. Flowchart creating super urban objects with data fusion from multiple sources. The super urban objects confine image areas that need further classification. NDVI is normalized difference vegetation index. NTL is nighttime light.
Remotesensing 08 00819 g003
Figure 4. Flowchart for urban built-up classification that integrates the object-based classification and the knowledge-based manual corrections. NDVI is the normalized difference vegetation index; MNDWI is the modified normalized difference water index; and NDBI is the normalized difference built-up index.
Remotesensing 08 00819 g004
Figure 5. An example of the object-based classification of the urban districts in Hanoi, Vietnam: (a) Landsat TM image; (b) color composite image of MNDWI (blue); NDVI (green) and NABI (red); (c) segmented image objects; and (d) object-based classification after knowledge-based manual correction.
Remotesensing 08 00819 g005
Figure 6. Urban built-up land in Vietnam, Cambodia, Laos and Myanmar in 2010 with a spatial resolution of 30 m. The area around the cities of Hanoi and Yangon are shown as examples.
Remotesensing 08 00819 g006
Figure 7. The increasing trends of DMSP/OLS NTL brightness in 1992 to 2010. Areas for Yangon and Hanoi were enlarged to illustrate the slow and fast change.
Remotesensing 08 00819 g007
Figure 8. Overlay of the 2010, 30 m urban built-up map (blue polygons) on top of DMSP/OLS NTL trends (grids in a green-red gradient color indicates a small to large increase in NTL brightness), where (a) an old city with stable urban built-up, (b) a completely new city with newly-developed urban built-up and (c) a growing city that was fast growing in built-up areas are shown.
Remotesensing 08 00819 g008
Figure 9. Comparison of the 30-m resolution built-up areas developed in this study with three coarse resolution urban built-up maps: the 2010 MODIS-500 at 500-m resolution, the 2009 GLOBC-300 at 300-m resolution and the 2010 IMPSA-1000 at 1000-m resolution.
Remotesensing 08 00819 g009
Figure 10. Relationship between urban built-up areas and socioeconomic data of GDP and population. The change rate between 1992 and 2010 was calculated as the net increase divided by the base number in 1992. All GDP and population data were acquired from the World Bank [76], except GDP data for Myanmar were acquired from its national statistics collected by our local collaborators.
Remotesensing 08 00819 g010
Table 1. The spatial resolution, data type, data source and main function of the data used for mapping the urban built-up area.
NameResolution and TypeSourceFunction
GLC-3030-m resolution raster land use data[44]To obtain 30 m resolution artificial surface cover
MODIS NDVI (MOD13A1)500-m resolution composite raster data of a 16-day interval[45]To compute urban built-up index and exclude vegetated land
DMSP-OLS1000-m resolution raster data[46]To compute urban built-up index and exclude rural area
Landsat TM/ETM+30-m resolution rectified images[47]To classify urban built-up
LandScan1000-m resolution raster image[48]To exclude non-populated independent mining and industry land
Google EarthHigh resolution rectified images[49]To validate classification accuracy and as reference data for human-machine interaction
GRUMPPoints of cities, towns and settlement[50]To locate and validate urban locations
Table 2. Examples of expert knowledge used for locating suspicious images for manual verification and correction. Such knowledge is only available at the image level, but not at the pixel level.
Type of KnowledgeExamples
Context based knowledgeFragmented urban built-up areas are usually connected by roads
Cropland within the urban core area is not likely
Shape based knowledgeNatural bare lands are more irregularly shaped than urban built-up areas
Roads are long and often straight objects
Texture and spectra based knowledgeCropland after harvest was “smoother” in some texture features than built-up areas, e.g., a smaller standard deviation in brightness
The spectral signal of cropland changes more than built-up areas among different dates
White-colored image objects could be bare land, clouds, or built-up areas and thus need to be checked with other information
Table 3. The accuracy (%) assessment results for Hanoi, Yangon, Vientiane and Phnom Penh. Note that the producer’s accuracy and user’s accuracy were only for the urban built-up area class.
CityProducer’s Accuracy (%)User’s Accuracy (%)Overall Accuracy (%)Kappa Value
Hanoi85.782.791.00.78
Vientiane84.288.895.00.83
Yangon85.094.096.00.87
Phnom Penh86.792.894.00.90

