Development of Phase Detection Schemes Based on Surface Plasmon Resonance Using Interferometry

Abstract
: Surface plasmon resonance (SPR) is a novel optical sensing technique with a unique ability to monitor molecular binding in real-time for biological and chemical sensor applications. Interferometry is an excellent tool for accurate measurement of SPR changes, the measurement and comparison is made for the sensitivity, dynamic range and resolution of the different analytes using interferometry techniques. SPR interferometry can also employ phase detection in addition to the amplitude of the reflected light wave, and the phase changes more rapidly compared with other approaches, i.e., intensity, angle and wavelength. Therefore, the SPR phase interferometer offers the advantages of spatial phase resolution and high sensitivity. This work discusses the advancements in interferometric SPR methods to measure the phase shifts due to refractive index changes. The main application areas of SPR sensors are demonstrated, i.e., the Fabry-Perot interferometer, Michelson interferometer and Mach-Zehnder interferometer, with different configurations. The three interferometers are discussed in detail, and solutions are suggested to enhance the performance parameters that will aid in future biological and chemical sensors.1. Introduction
A significant research has been done in the area of optical sensors for the measurement of chemical and biological samples. A large number of methods have been used for biosensing and chemical sensing, i.e., ellipsometric porosimetry [1], in-situ ellipsometry [2], imaging ellipsometry [3], phosphorescence spectroscopy [4], luminescence spectroscopy [5], fluorescence spectroscopy [6] and Raman spectroscopy [7] as well as the spectroscopy, interferometry and surface plasmon resonance SPR [8]. The given sample amount is measured by sensors through fluorescence, absorbance and n properties of analyte molecules. The SPR process can be observed at metal interfaces as well [9]. Therefore, SPR sensing has received increasing attention from the scientific community and significant efforts are done in the field of SPR biosensing. The chemical and biological samples are measured by using new SPR techniques development has been reported together with their shortcomings and solutions. [10]. The SPR technique is used for measuring kinetic rates of reactions (rates of complex formation and dissociation) [11], affinity (strength of binding) [12], concentration of purified protein or protein in a complex mixture [13], binding partner identification [14], biomolecular complex formation [15], quantification of antibiotics in honey [16], screening for milk testing [17], veterinary drug residues [18], detection of antibodies to salmonella in meat [19] and the presence of genetically modified organisms [20]. The SPR setup is controlled and evaluated via software, and no fluorescent or radioactive labels are required. This technique offers definite advantages in speed and throughput with safe and easy use [21–23].
Other available biosensors display different drawbacks compared with those of SPR biosensors, e.g., impedance spectroscopy (IS) uses complex digital signal processing for measurement of impedance variations of a unit [24]. Micro-cantilever biosensors (MCBs) are nanomechanical sensors have emerged as a label-free detection method, but this approach can be negatively affected by humidity and pressure [25]. Carbon nanotubes (CNTs) are used in biosensors due to change in electrical (the ability to vary the electrical property) and electrochemical properties (metallic to semiconductor materials) [26]. However, control of the diameter and signal processing of these sensors is difficult. Fluorescence biosensors have a lot of applications in the area of drugs, DNA sequencing, purification and cloning. However, this technique requires fluorescent labeling apart from native fluorescence [27]. Chemi-luminescence (CL) is a substitute method for on-chip detection of biomolecules as compared to fluorescence. However, CL performance is degraded due to the factors such as temperature, pH of the solvent etc [28]. An acoustic wave is generated by surface acoustic wave (SAW) sensor that travels on the piezoelectric crystal surface to produce sensitive surface [29]. One disadvantage of SAW is that Rayleigh waves are surface-normal waves that are poorly suited for liquid sensing. A quartz crystal microbalance (QCM) generates an electrical signal produced by piezoelectric gold plated device. The shortcoming of QCM is that the measure of resonant frequency shift is the only parameter available and has restricted this method to mass sensing of thin and rigid films [30].
Other instrumental schemes use evanescent waves to excite surface plasmons (SP). The sensitivity of SPR prism coupler is better as compared to SPR-grating-based sensors [31]. In the Otto configuration, which uses the attenuated total reflectance, the fixed distance between the right angle prism and the metal film at a given value of sample can cause issues [32]. Fiber optic SPR sensors have attained considerable attention recently due to the construction of miniaturized sensors. In fiber-based SPR sensors only few wavelength scans are possible due to almost fixed incident angle problem. Another issue is the limited wavelength range of the optical fiber [33]. To observe the interference phase changes the experiment must be performed continuously in order to have thickness and n values in case of dual polarization interferometry. The features of resonant waveguide grating (RWG) biosensors are widely used in drug detection for monitoring the changes in cell binding of live cells in real-time [34]. A partial penetration of an evanescent wave that cause the miscalculations in evaluating certain cells due to the large size of those cells and therefore, observations can only be conducted on a cell limited portion [11].
This review discusses the basic theory of SPR phase detection via interferometry. Three prominent interferometers are discussed for SPR phase detection: Fabry-Perot, Mach-Zehnder and Michelson interferometers. Another comparison is drawn to demonstrate that the phase is highly sensitive to n changes compared with wavelength, angle and intensity. The SPR phase has become a prominent technique in the optical biosensor field due to its increased sensitivity. The article provides a summary of the current applications of this technique and aids researchers in this area toward the development of efficient phase-sensitive SPR sensors for detection of small molecules with greater output.
2. Theory of SPR Phase Detection
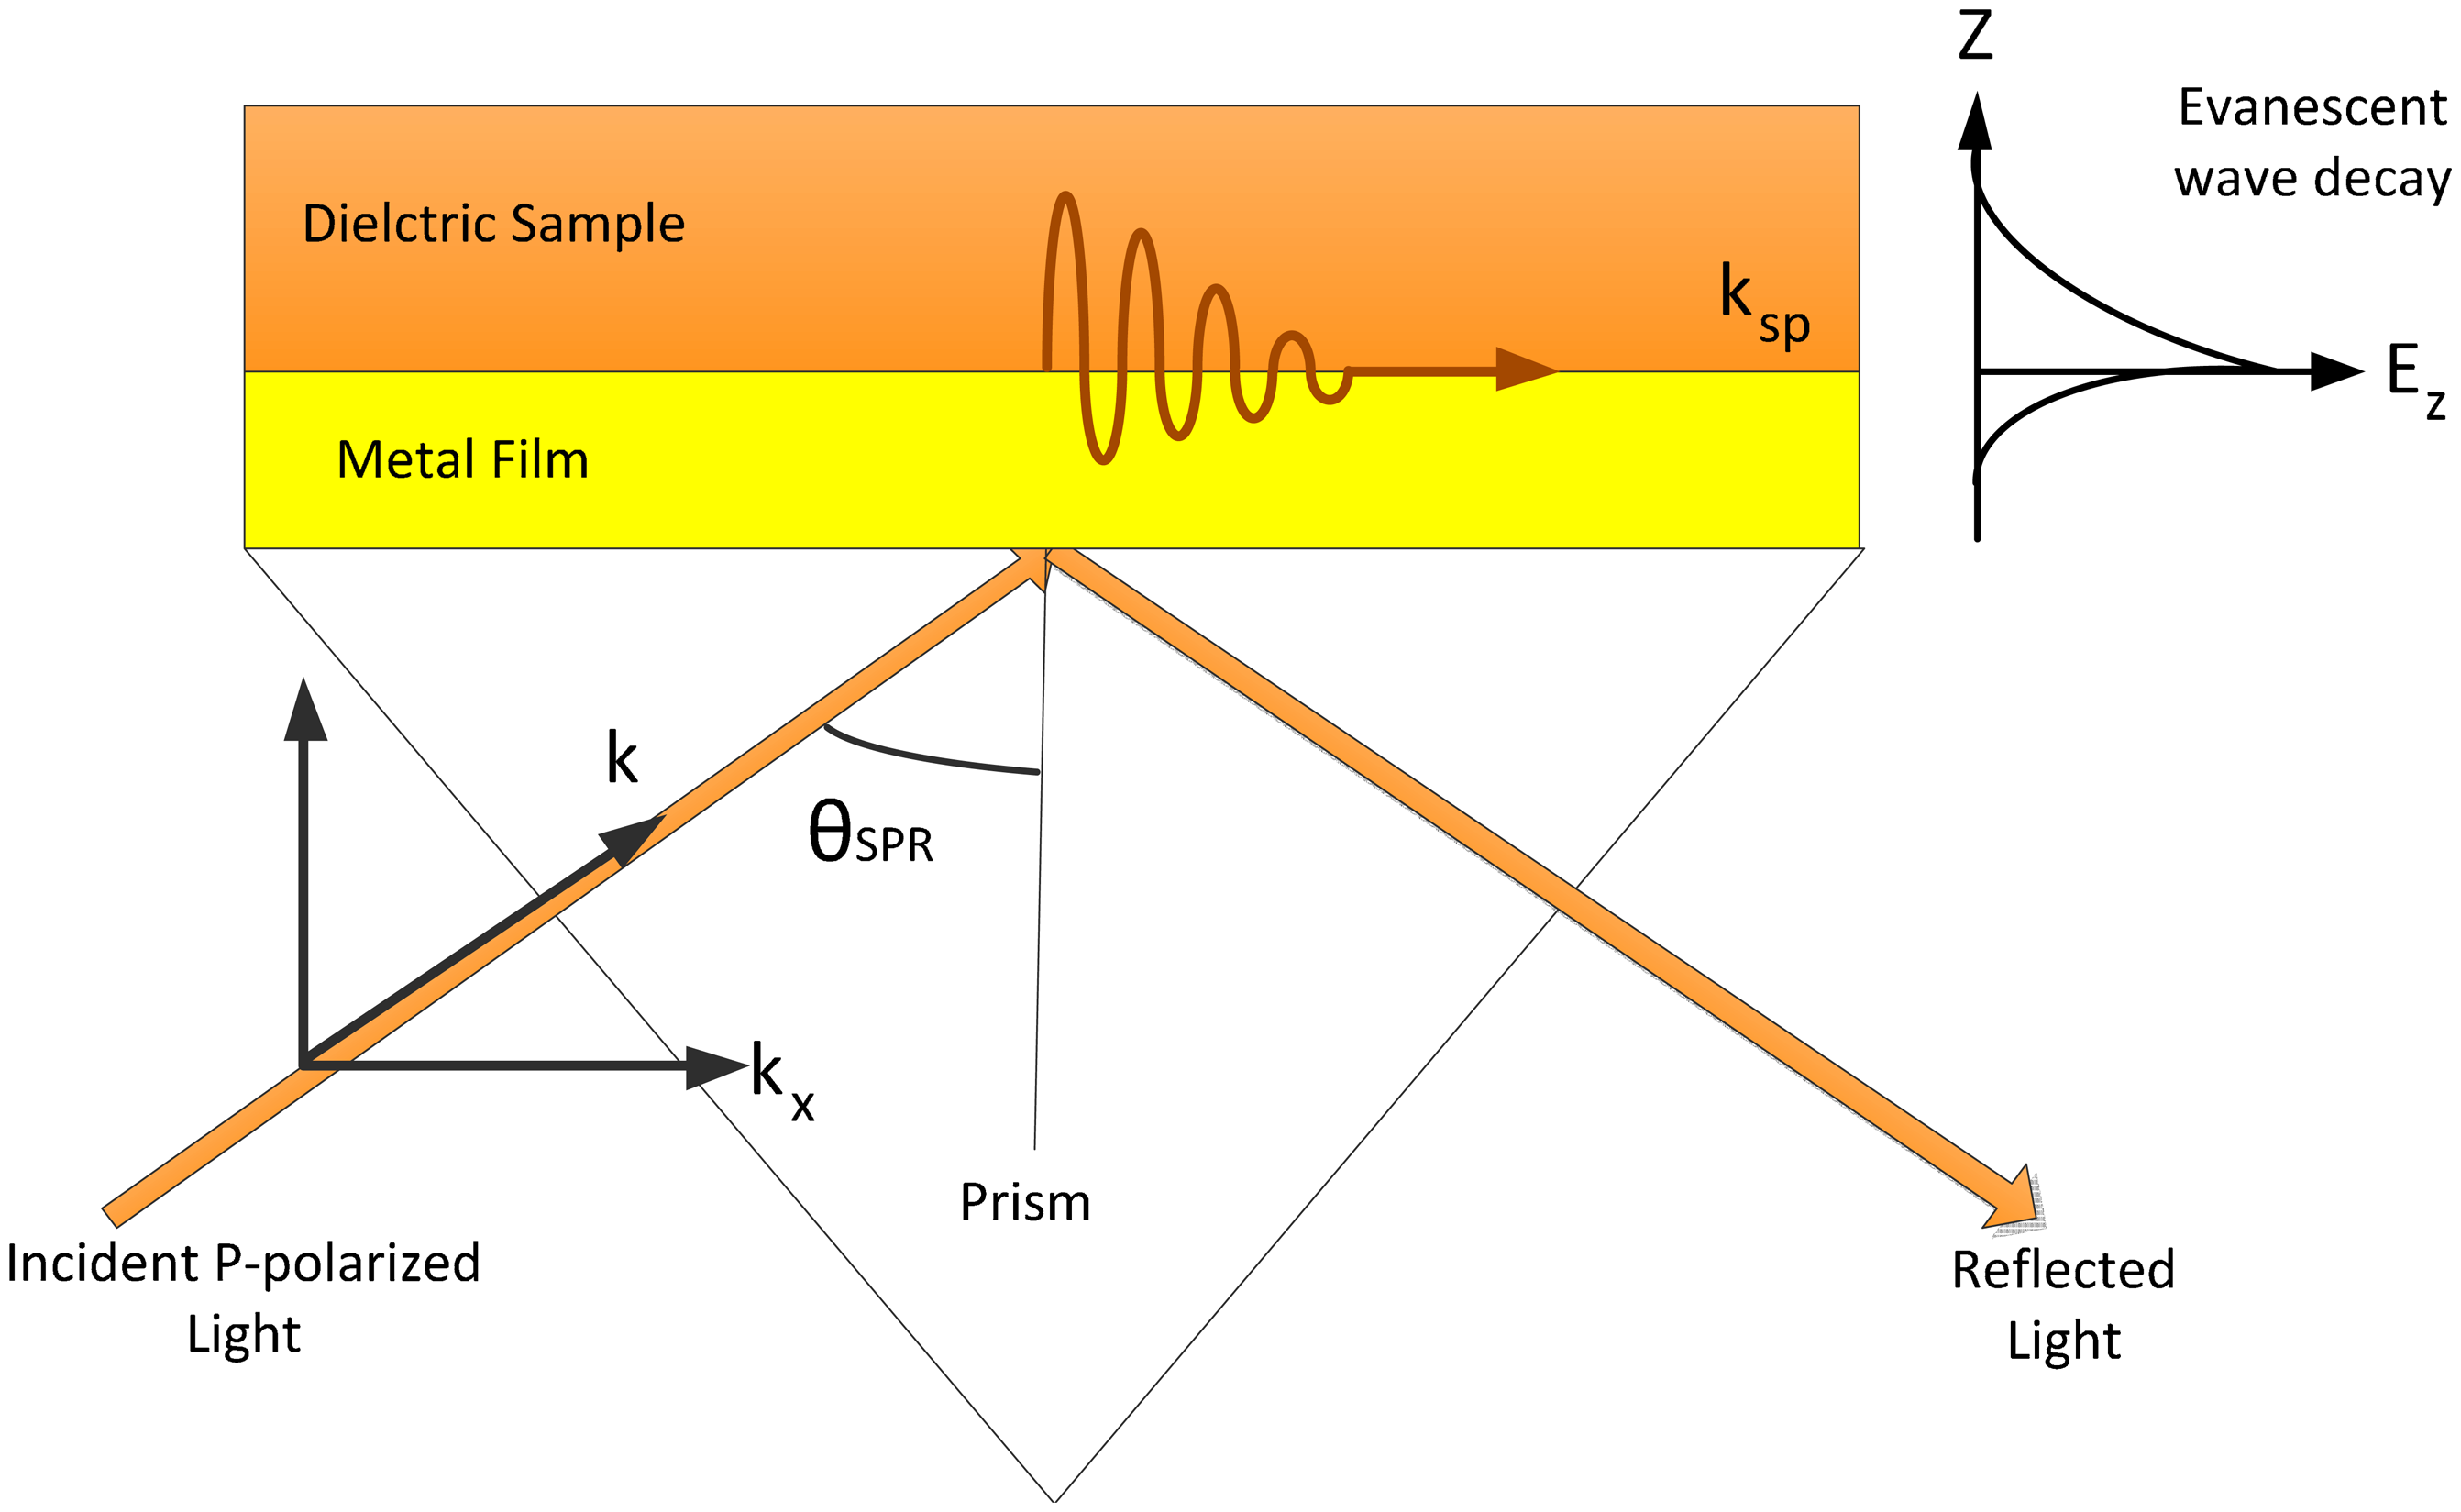
Research is focused to determine the phenomenon of energy transmission from a single plane light wave to the SPW that travels along an interface of metal and dielectric with determination of the reflection coefficient of the incident light. The steep variation in the reflection curve is usually determined to get information about the properties of the metal dielectric interface by using either an angular or wavelength SPR dispersion technique [35]. However, only p-polarization of the electromagnetic field can cause the evanescent waves that produce a change in each electric field reflection, and the vector direction can be measured by the amplitude ratio of its p- and s-components. The s-polarized and p-polarized light act as the reference and measurement beams, respectively [36]. These detection techniques are commonly used for the development of environmental, chemical and biological small amount detection. To increase the sensing performance the higher detection sensitivity is required. Therefore the high sensitivity for SPR sensors can be achieved by measuring the sharp phase variation during SPR occurs has been compromised due to complexity [37].
It is appropriate to discuss the mathematical description of the evanescent wave, which plays a key role in the concept of SPR sensing. When an electromagnetic plane wave propagates in a medium with refractive index, n, it can be expressed mathematically as a function of an electric field (E). The evanescent wave travels parallel to the interface of the metal and sample medium with an electric field amplitude that decays exponentially along the y-direction, given by,
Thus, the electromagnetic wave vector (kx) must be equal to the charge density wave vector (ksp) to perform SPR, where ω is angular frequency, c is the speed of light, εmetal is the dielectric constant of the metal, εdielectric is the dielectric of the sample and εprism is the dielectric constant of the glass prism [38]. Certain properties of SPs, i.e., enhancement, phase jump during SP excitation and SP coherence length, are related to SPR sensor applications [39].
Enormous field enhancement occurs during SPR, and SPR dip is highly sensitive to the changes in the sample n of the dielectric at the interface [40]. At an optimal film thickness for SPR, the phase of light can cause a sharp dip in the angular dependence of the phase on the p-polarized light under SPR. The main light beam is divided into two portions: one is a “probe” beam, and the second is a “reference” beam used for comparison with the s-polarized portion of the main beam. [41]. The theoretical calculations show 102 to 103 times greater sensitivity than the conventional setup for the phase measurement [41]. Because the dispersion of the SPs is highly sensitive to the n of the adjacent medium of the metallic film, the SPR technique is used for highly sensitive sensors, i.e., affinity biosensors. The affinity SPR biosensors are used for the detection of biological molecules at present that are highly sensitive. Additionally, the phase changes are modulated due to reflection in SPR. The phase variation of the reflected light beam occurs when SPs propagate on the metal film surface [42].
Therefore, the phase shifts Δϕ due to interference can be observed by spatial displacement of the light beam. The measurement of the phase shift Δϕmax for SPR conditions produces a change in the effective n of a medium by which the phase derivative Δϕ/Δn can be measured. The phase suffers a rather sharp jump of Δϕmax < 2π at a narrow range of angle Δθph close to the SPR dip, whereas the changes in the intensity Δθint are significantly wider Δθint ≫ Δθph within the angular span. Such a change in the SPR interference pattern by approximately one fringe is equal to the phase shift Δϕ = 2π [43].
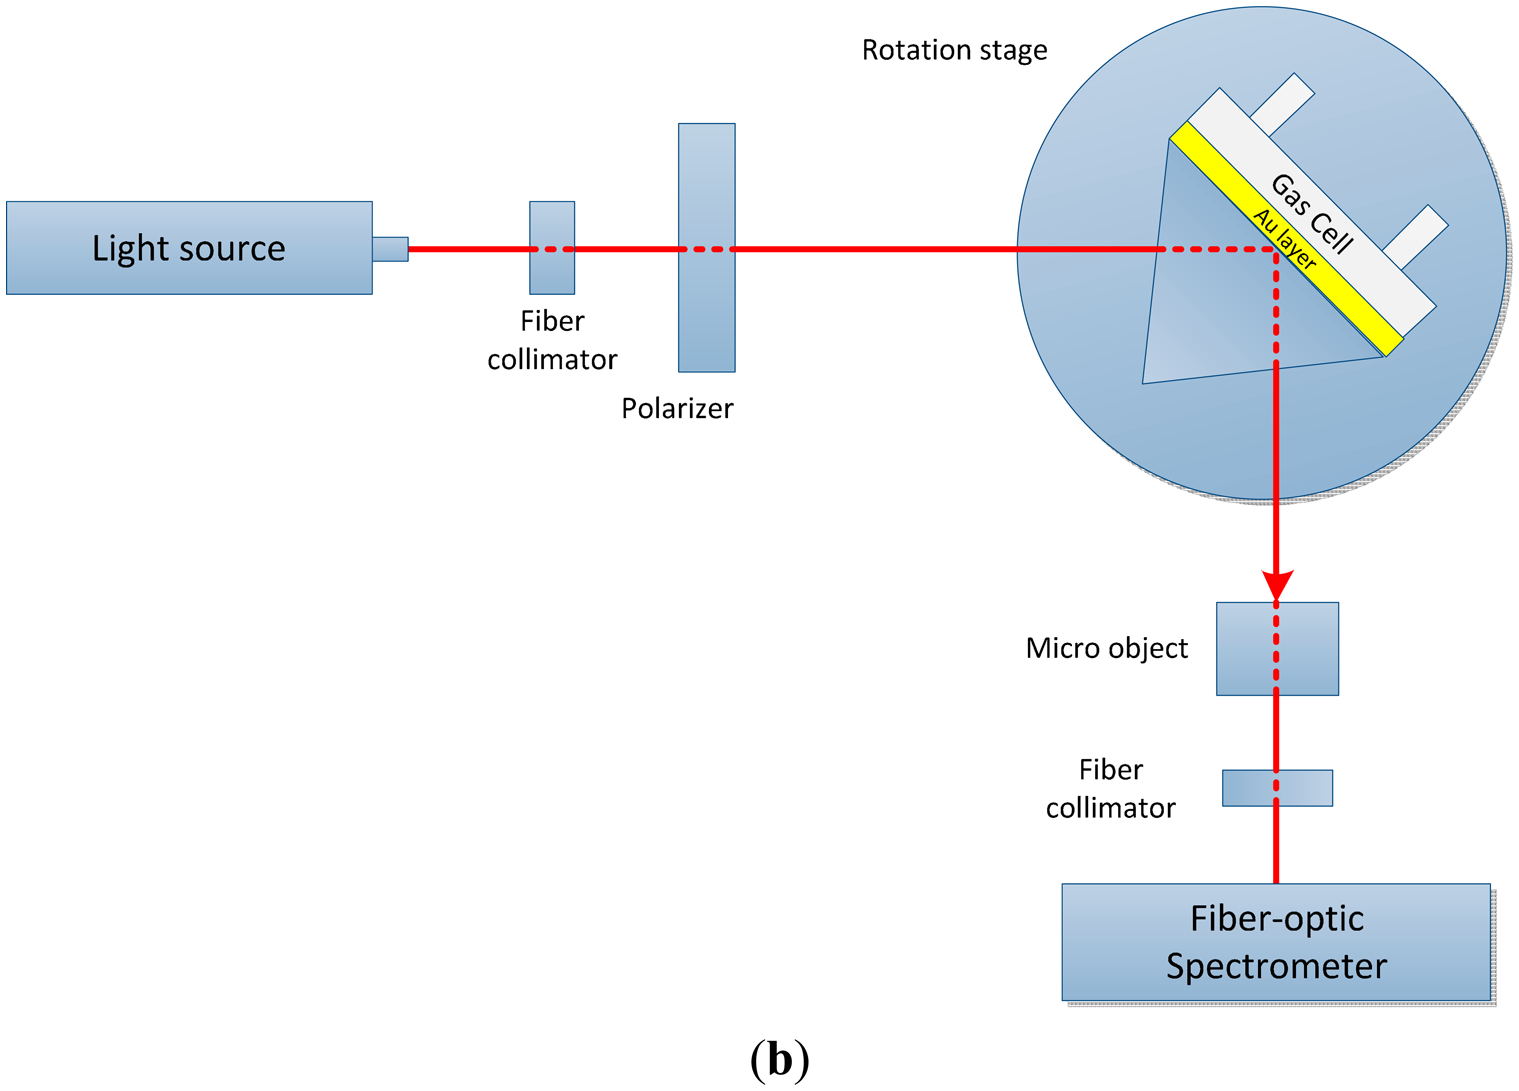
In spectroscopy-based SP sensors, the wavelength or angular spectrum of a light wave coupled to a SP is determined, and the output of the sensor is linked to a change in the wavelength or the angular position of the SPR dip [12]. For an SPR sensor with angle interrogation, the SPs are excited on the gold film surface using a laser as shown in Figure 2a. A plano-convex lens is used to collimate the light on the SPR surface, and a θ − 2θ motorized rotation stage is used to connect two-axis stepping motor drive controllers. Several lenses and filters are used to produce high sensitivity [44,45]. When SPR occurs, the reflected light intensity is the minimum determined with a photodetector. In the case of the wavelength interrogation technique, a polarizer is used as an analyzer for light entering the spectrometer and is mounted on a rotation stage as shown in Figure 2b.
An iris diaphragm is used to filter out the radiation field [46]. The output light is inputted to the spectrometer through a microscope objective via a coupling fiber. The wavelength linked to the dip in the SPR transmission spectra is the SPR wavelength, and the spectral characteristics of the waveguide biosensor are measured by the spectrometer [47,48].
The main performance parameters for an SPR biosensor include sensitivity, signal-to-noise ratio (SNR), accuracy, precision, repeatability and minimum detection limit are described in Table 1.
3. Introduction to Interferometry
Interferometry is a popular analytical technique used in optics for measurement of n changes, small displacements and surface irregularities as well as in spectroscopy for analysis of light absorption or transmission parameters associated with a substance [54]. The principle of superposition is used in interferometry to intermix the waves in such a way that produces the combinational output to get some useful properties that identify the original states of the waves. The biochemical reaction information can be deduced by obtaining the phase change from the interference pattern [55]. Three basic types of interferometers that are commonly used in SPR interferometry are the Fabry-Perot interferometer (FPI), Mach-Zehnder interferometer (MZI), and Michelson interferometer types.
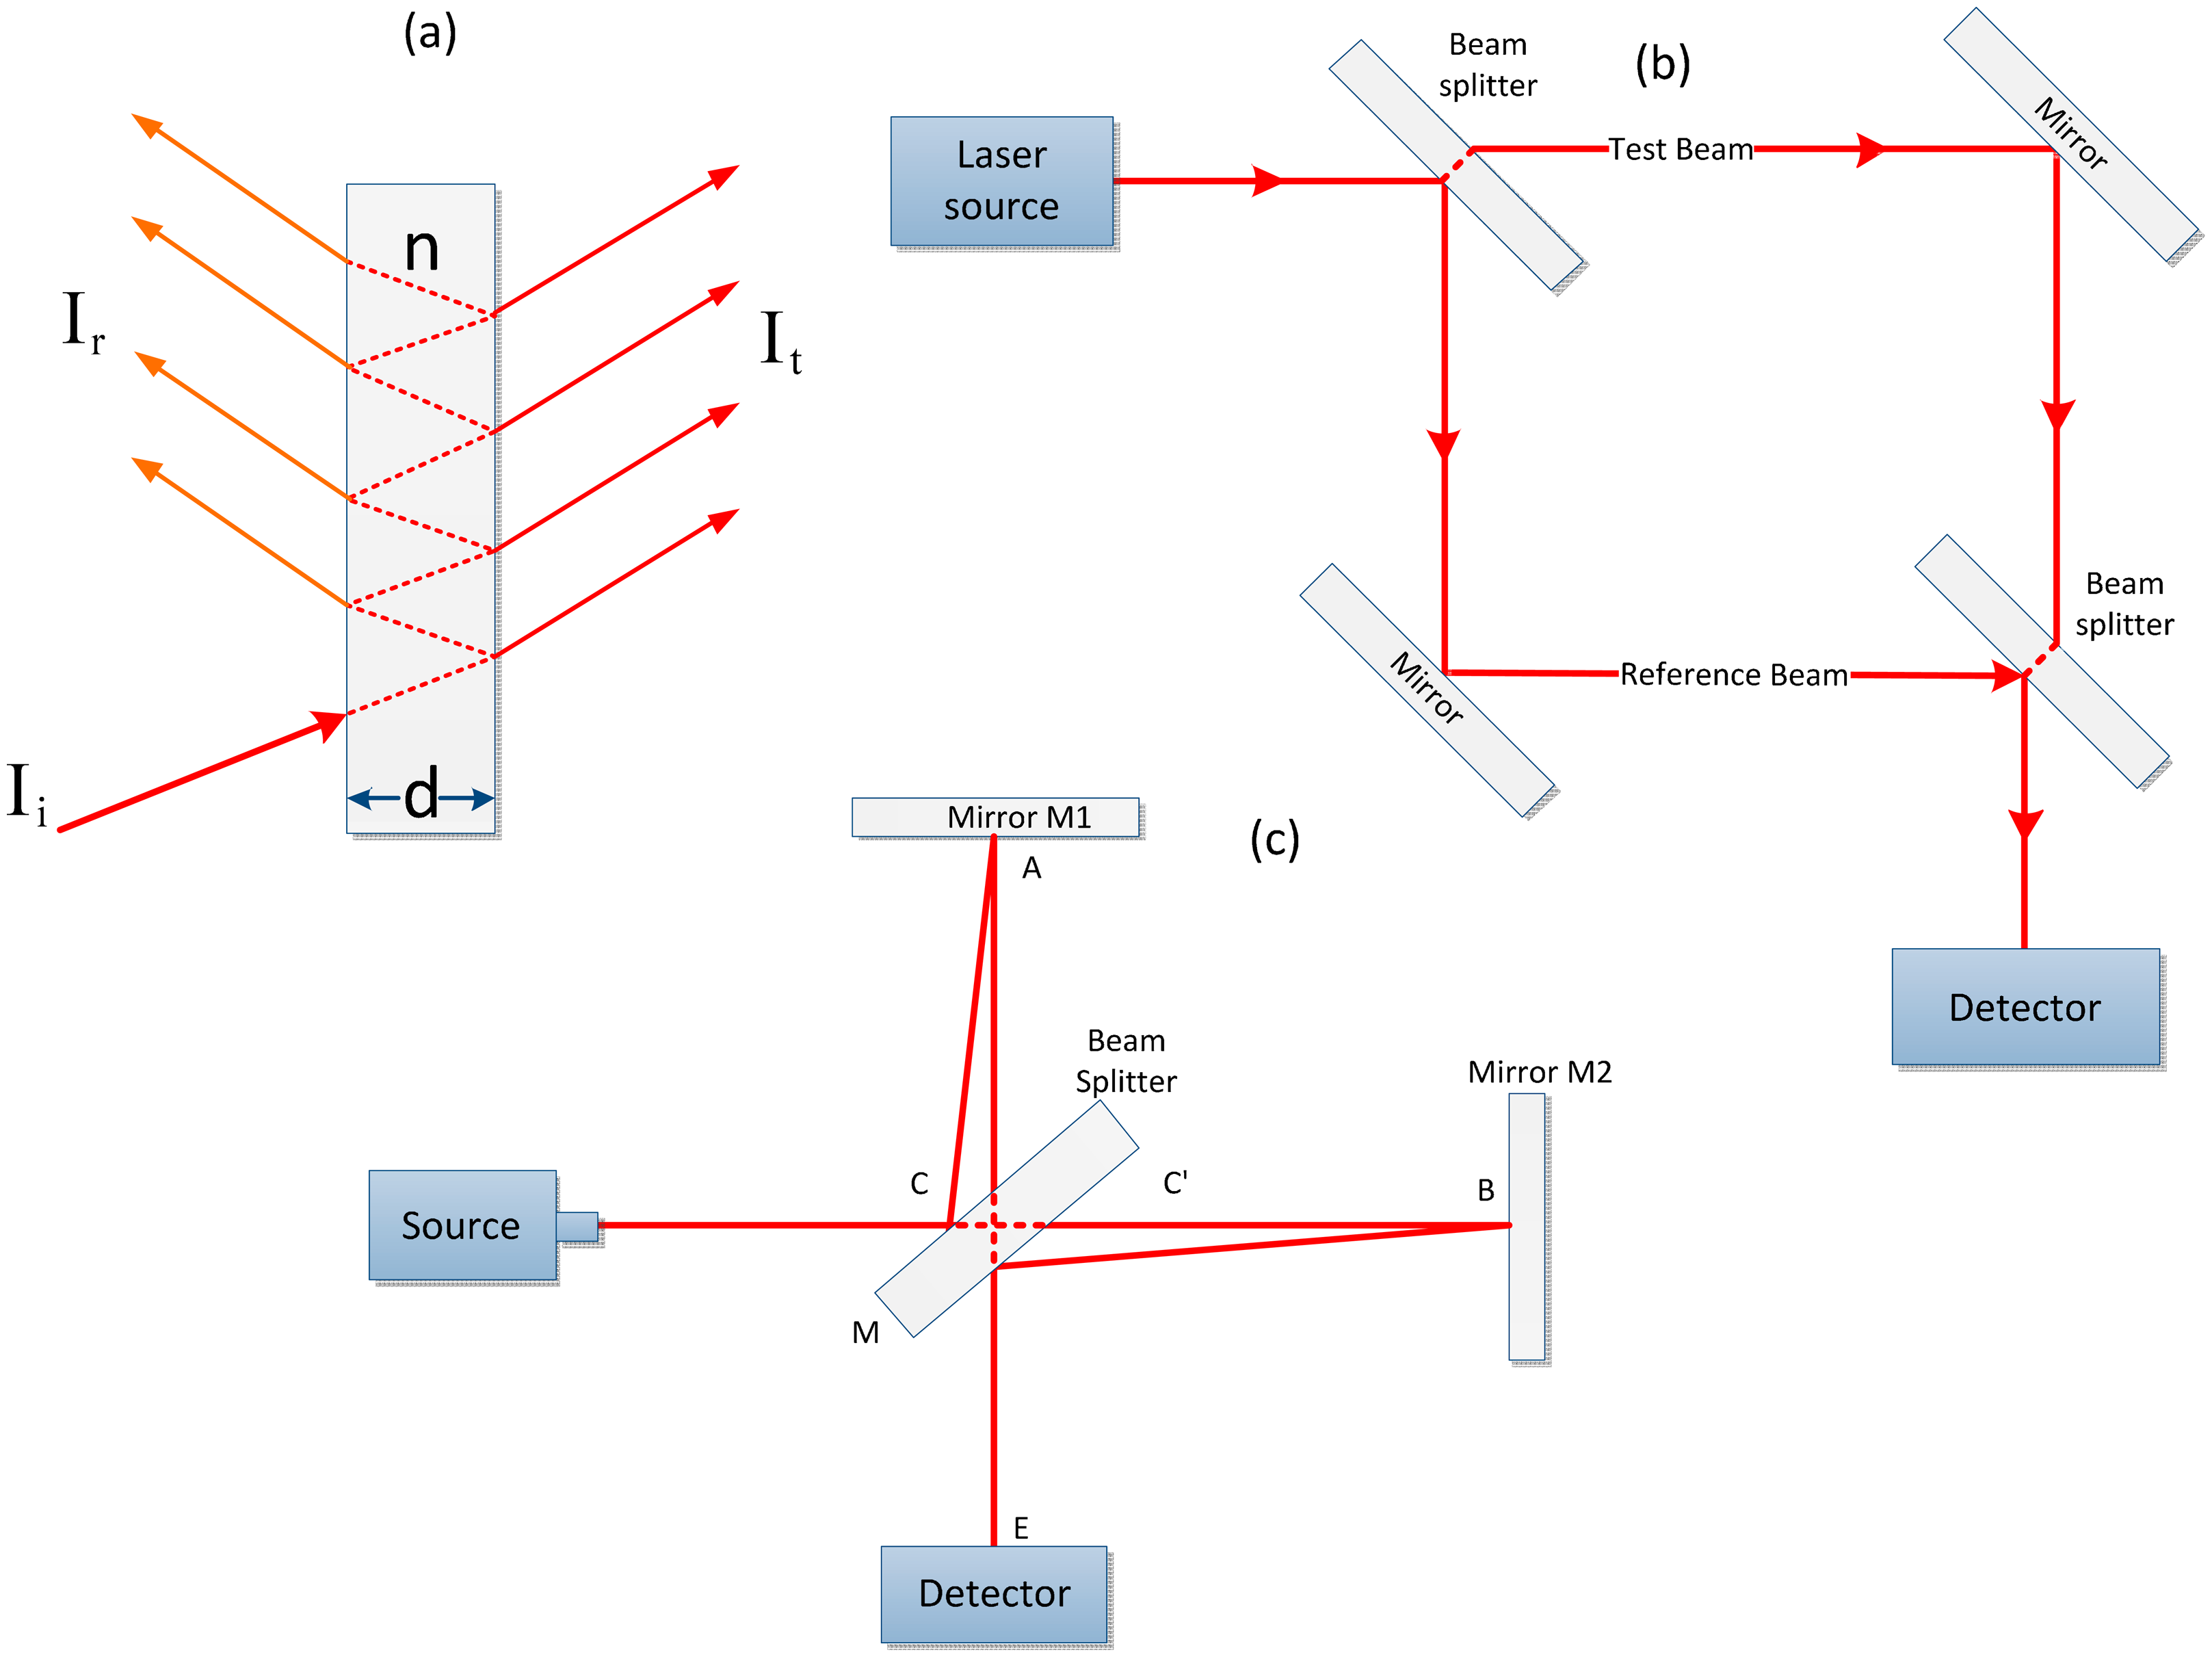
A FPI normally consists of a transparent plate with two highly reflective surfaces and multiple beam interference. The transmission spectrum is a function of the wavelength that shows peaks of large transmission. The light is partially transmitted through the interferometer, and the remaining portion of the light is reflected back [56]. The Fabry-Perot setup can be used to determine the n, temperature, wavelength and control light wavelengths or to measure geometrical properties [57,58]. The geometric features are defined by many properties, i.e., n, thickness and beam direction.
A FPI is highly sensitive with respect to geometric properties for which small changes can be measured [59,60]. The main advancement in the Fabry-Perot setup is a nanostructured FPI, which is more sensitive than a conventional FPI configuration [61]. The basic principles of operation of the device are shown in Figure 3a. Light enters the cavity and the nanopores in between the two plates, undergoes multiple internal reflections and causes interferences in the cavity and nanopores. Next, transducing signals are generated as reflected or transmitted interference fringes from the FPI. For this FPI device, the reflected signal is used as the sensing signal. If the pressure changes due to the presence of biochemicals, then the effective n will change inside the FPI cavity and nanopores, causing the reflected interference fringes to shift [62]. These sensitive parameters are used for various optical applications. A Fabry-Perot device can be used in a laser resonator to obtain single longitudinal modes. The most significant application of FPI is in high resolution optical spectroscopy. The geometric properties of FPI are related to the wavelength variations, and these variations can be adjusted using divergent light [56].
A MZI is a frequently used interferometer due to its flexibility, ease of use, ease of miniaturization, accessibility and appropriateness [63]. The MZI is a simple device for presenting interference using division of amplitude. First, a beamsplitter is used to split light from a light source into two components, which are recombined by a second beamsplitter. The relative phase difference is measured by the beam along the two paths, and the second beamsplitter will display the beam with an efficiency varying from 0% to 100% [61]. This device can be further miniaturized with integrated optics for the scheme shown in Figure 3b. In a Mach-Zehnder interferometer, the s-polarization light is used as a reference for certain applications. The s-polarization and p-polarization light beams are recombined to interfere and generate a set of interference fringes after passing over the sample arm. The interference fringe shows a path difference of 2π radians between the reference and the sample light beam. If there is an alteration in the sample value that causes a change, the phase shifts, and thus the position of the fringes shifts [53].
A Michelson interferometer consists of a monochromatic light source that strikes the beam splitter and is reflected back from two 100% mirrors (M1 & M2) that are placed 90° apart from the beam splitter, as shown in a Figure 3c. Because the beam splitter is partially silvered, one beam is reflected at nearly 90° at point C, and the second is transmitted through the beam splitter from point C′. After reflection from their respective mirrors, both beams are recombined by the beam splitter at a different point C′, and an interference pattern is visible through the detector to the observer at point E. The observed effects are identical to those formed by placing surfaces B′ and A at point E. The path lengths are carefully equalized due to the short coherence length (micrometers) of the light requirement with the use of white light. The beam splitter simultaneously combines the effect of both the M1 and M2 reflected light beams to produce interference that can be determined by a detector [64].
4. SPR Phase Detection via Interferometry Schemes
To enhance the detection and sensing capability of an SPR sensor, interferometric techniques are used for SPR phase measurement. The SPR sensor sensitivity is increased in a precise manner when two beams are multiplexed via interferometry, and the information is extracted from the interference patterns to indicate the phase of the reflected light wave [65]. Three different interferometric techniques (FPI, MZI and Michelson interferometer) integrated with the SPR architecture for phase detection will be discussed. The phase SPR interferometry detection schemes are used to develop proper phase-sensitive SPR sensors with higher throughput and the ability to detect smaller molecules [66]. The optical scheme and electronics that define the minimal phase difference can be fixed using SPR interferometry techniques. The SPR interferometer provides spatial phase resolution that can consider the characteristics of the n distribution on the surface of the measureand [43]. Therefore, three different interferometry techniques are discussed for SPR phase detection together with applications.
4.1. SPR Phase Detection via Fabry-Perot Interferometer
Recent progress towards a FPI for practical imaging is represented by a differential phase multi-pass SPR biosensor. This sensor consists of a multi-layer structure with improved algorithm. In recent years, the SPR sensors have achieved popularity among the biosensing community. The SPR phase is measured by a FPI in such way that the signal light passes through the sensor many times to obtain the SPR phase commutative effect, therefore amplifying the SPR phase [67]. The system is based on a differential SPR phase scheme incorporated into the FPI configuration as shown in Figure 4.
Experimental results acquired from protein-DNA and antibody-antigen binding reactions using a FPI with a contribution to the Michelson configurations indeed provide phase amplification factors of 2.26 and 2, respectively, compared with the conventional MZI configuration. Therefore, the sensitivity is enhanced, and the resolution is improved by a factor of at least two due to the phase amplification effect [68].
4.2. SPR Phase Detection via Mach-Zehnder Interferometer
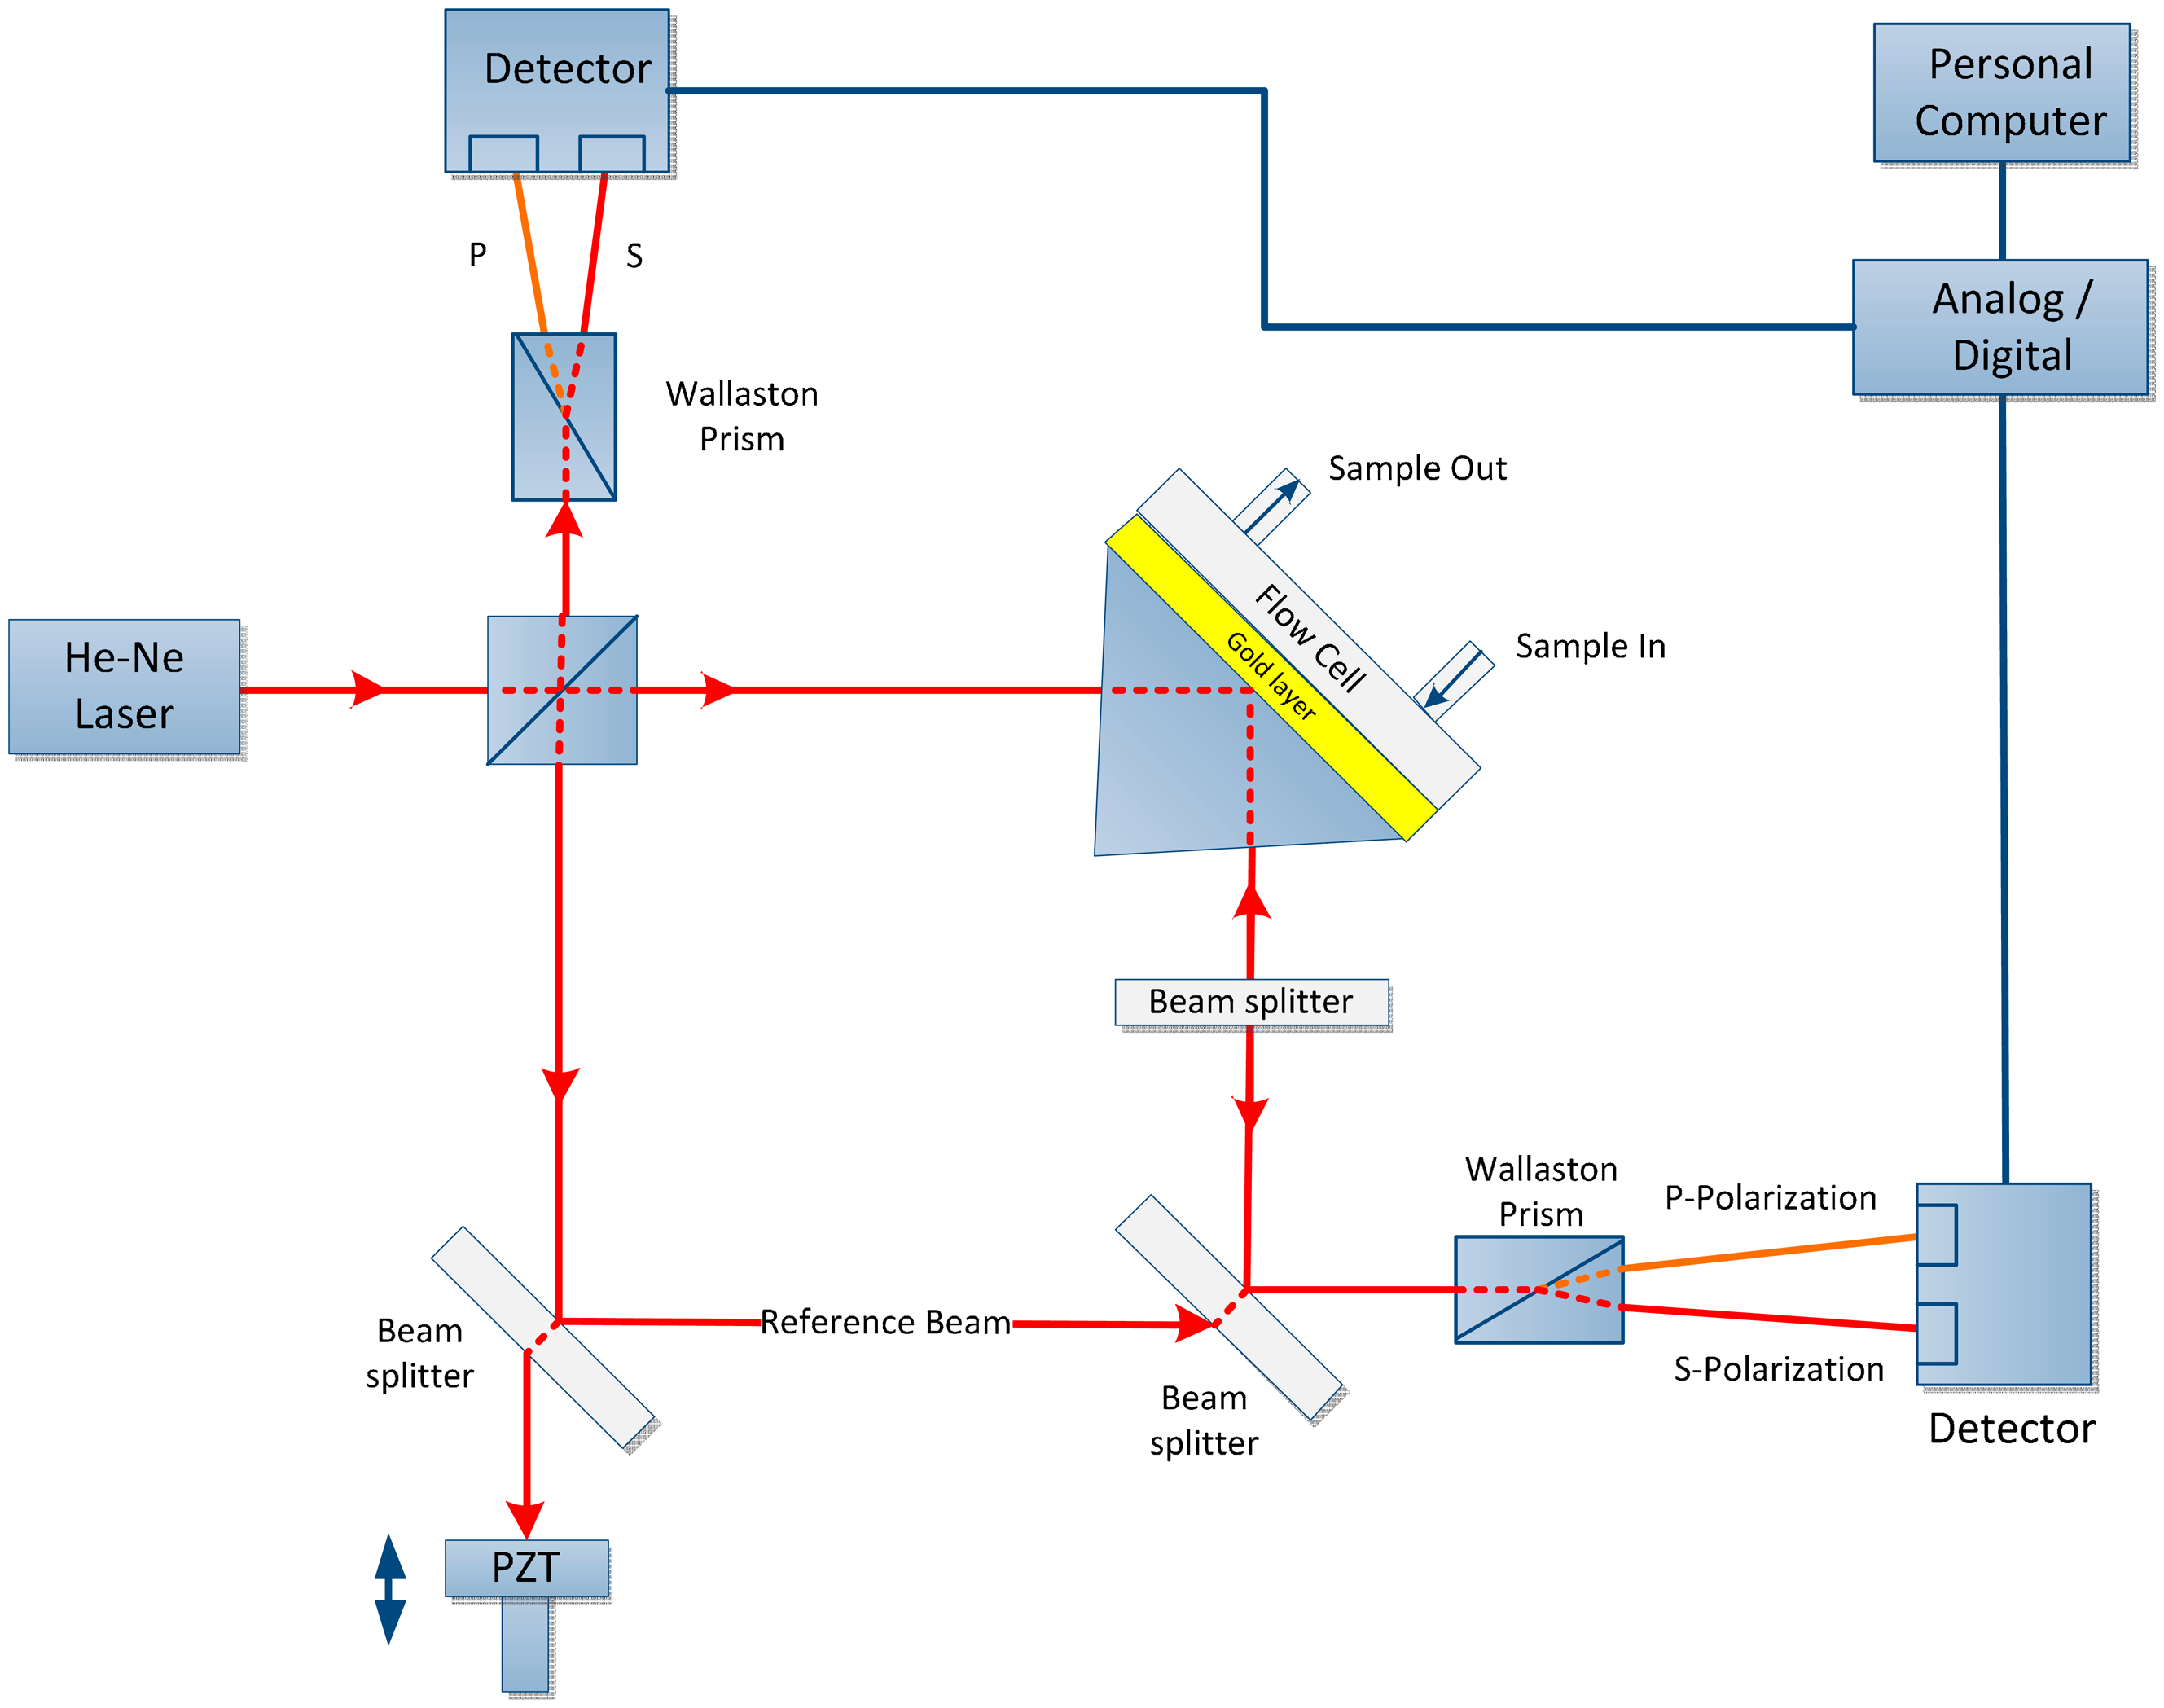
The main purpose of MZI to determine the phase changes when SPR occurs and also examine the threshold sensitivity of MZI as the n changes to Δn [43]. A highly sensitive SPR biosensor is presented using the MZI design. The unique feature of this setup is the incorporation of a Wollaston prism that is used to interrogate the s- and p-polarizations simultaneously to measure the phase, as shown in Figure 5. Because SPR only affects the p-polarization, the s-polarization is employed as the reference signal. Therefore, the phase noise due to common path can be removed by taking the phase difference between the s- and p-polarization but retain the phase changes due to the SPR. A sensitivity of 5.5 × 10⁻⁸ refractive index units (RIU) can be obtained from this experimental setup using glycerin/water mixtures. A significant improvement can be achieved with the use of gold as the sensor surface. Such a sensitivity improvement can be highly useful in biological and chemical sensing and may enable potential replacement of conventional biosensing techniques [69].
A double-pass SPR biosensor is a combination of MZI and Michelson interferometer with differential phase interrogation is a new scheme that provides enhanced sensitivity detection of up to a factor of two due to phase amplification effect, as shown in Figure 6. This approach enables an improvement in sensitivity compared with that of the conventional Mach-Zehnder setup without compromising the system complexity. This configuration is useful for detecting low-molecular-weight biomolecules [70].
The MZI can be miniaturized to form a nanostructured sensor with an ultra-compact size and high sensitivity. The sensor was assembled using a flexible nanofiber with a diameter of 700 nm. The detection n limit is nearly 1.8 × 10⁻⁶. Although the nanosensor construction is simple, low-cost and compact, it is highly sensitive [71].
SPR Phase Detection via Optical Heterodyne Interferometry
In SPR sensors, an amplitude measurement is collected in a straightforward manner because the photodetector directly determines the intensity. The direct phase measurement is difficult because due to high intensity oscillations of a light in the range of 1014 Hz that cannot be captured by the detectors. Therefore, low frequency signal can be produced and measured for the phase measurement by using a detector. The optical heterodyne technique is used for SPR phase measurement in sensors and is one of the earliest techniques. Two laser beams are generated with a minor difference in frequencies and positioned to produce interference, resulting in a beat frequency that is the result of frequency difference between the beams. The beat signal is compared with a reference signal to get the phase difference using a phase meter [66].
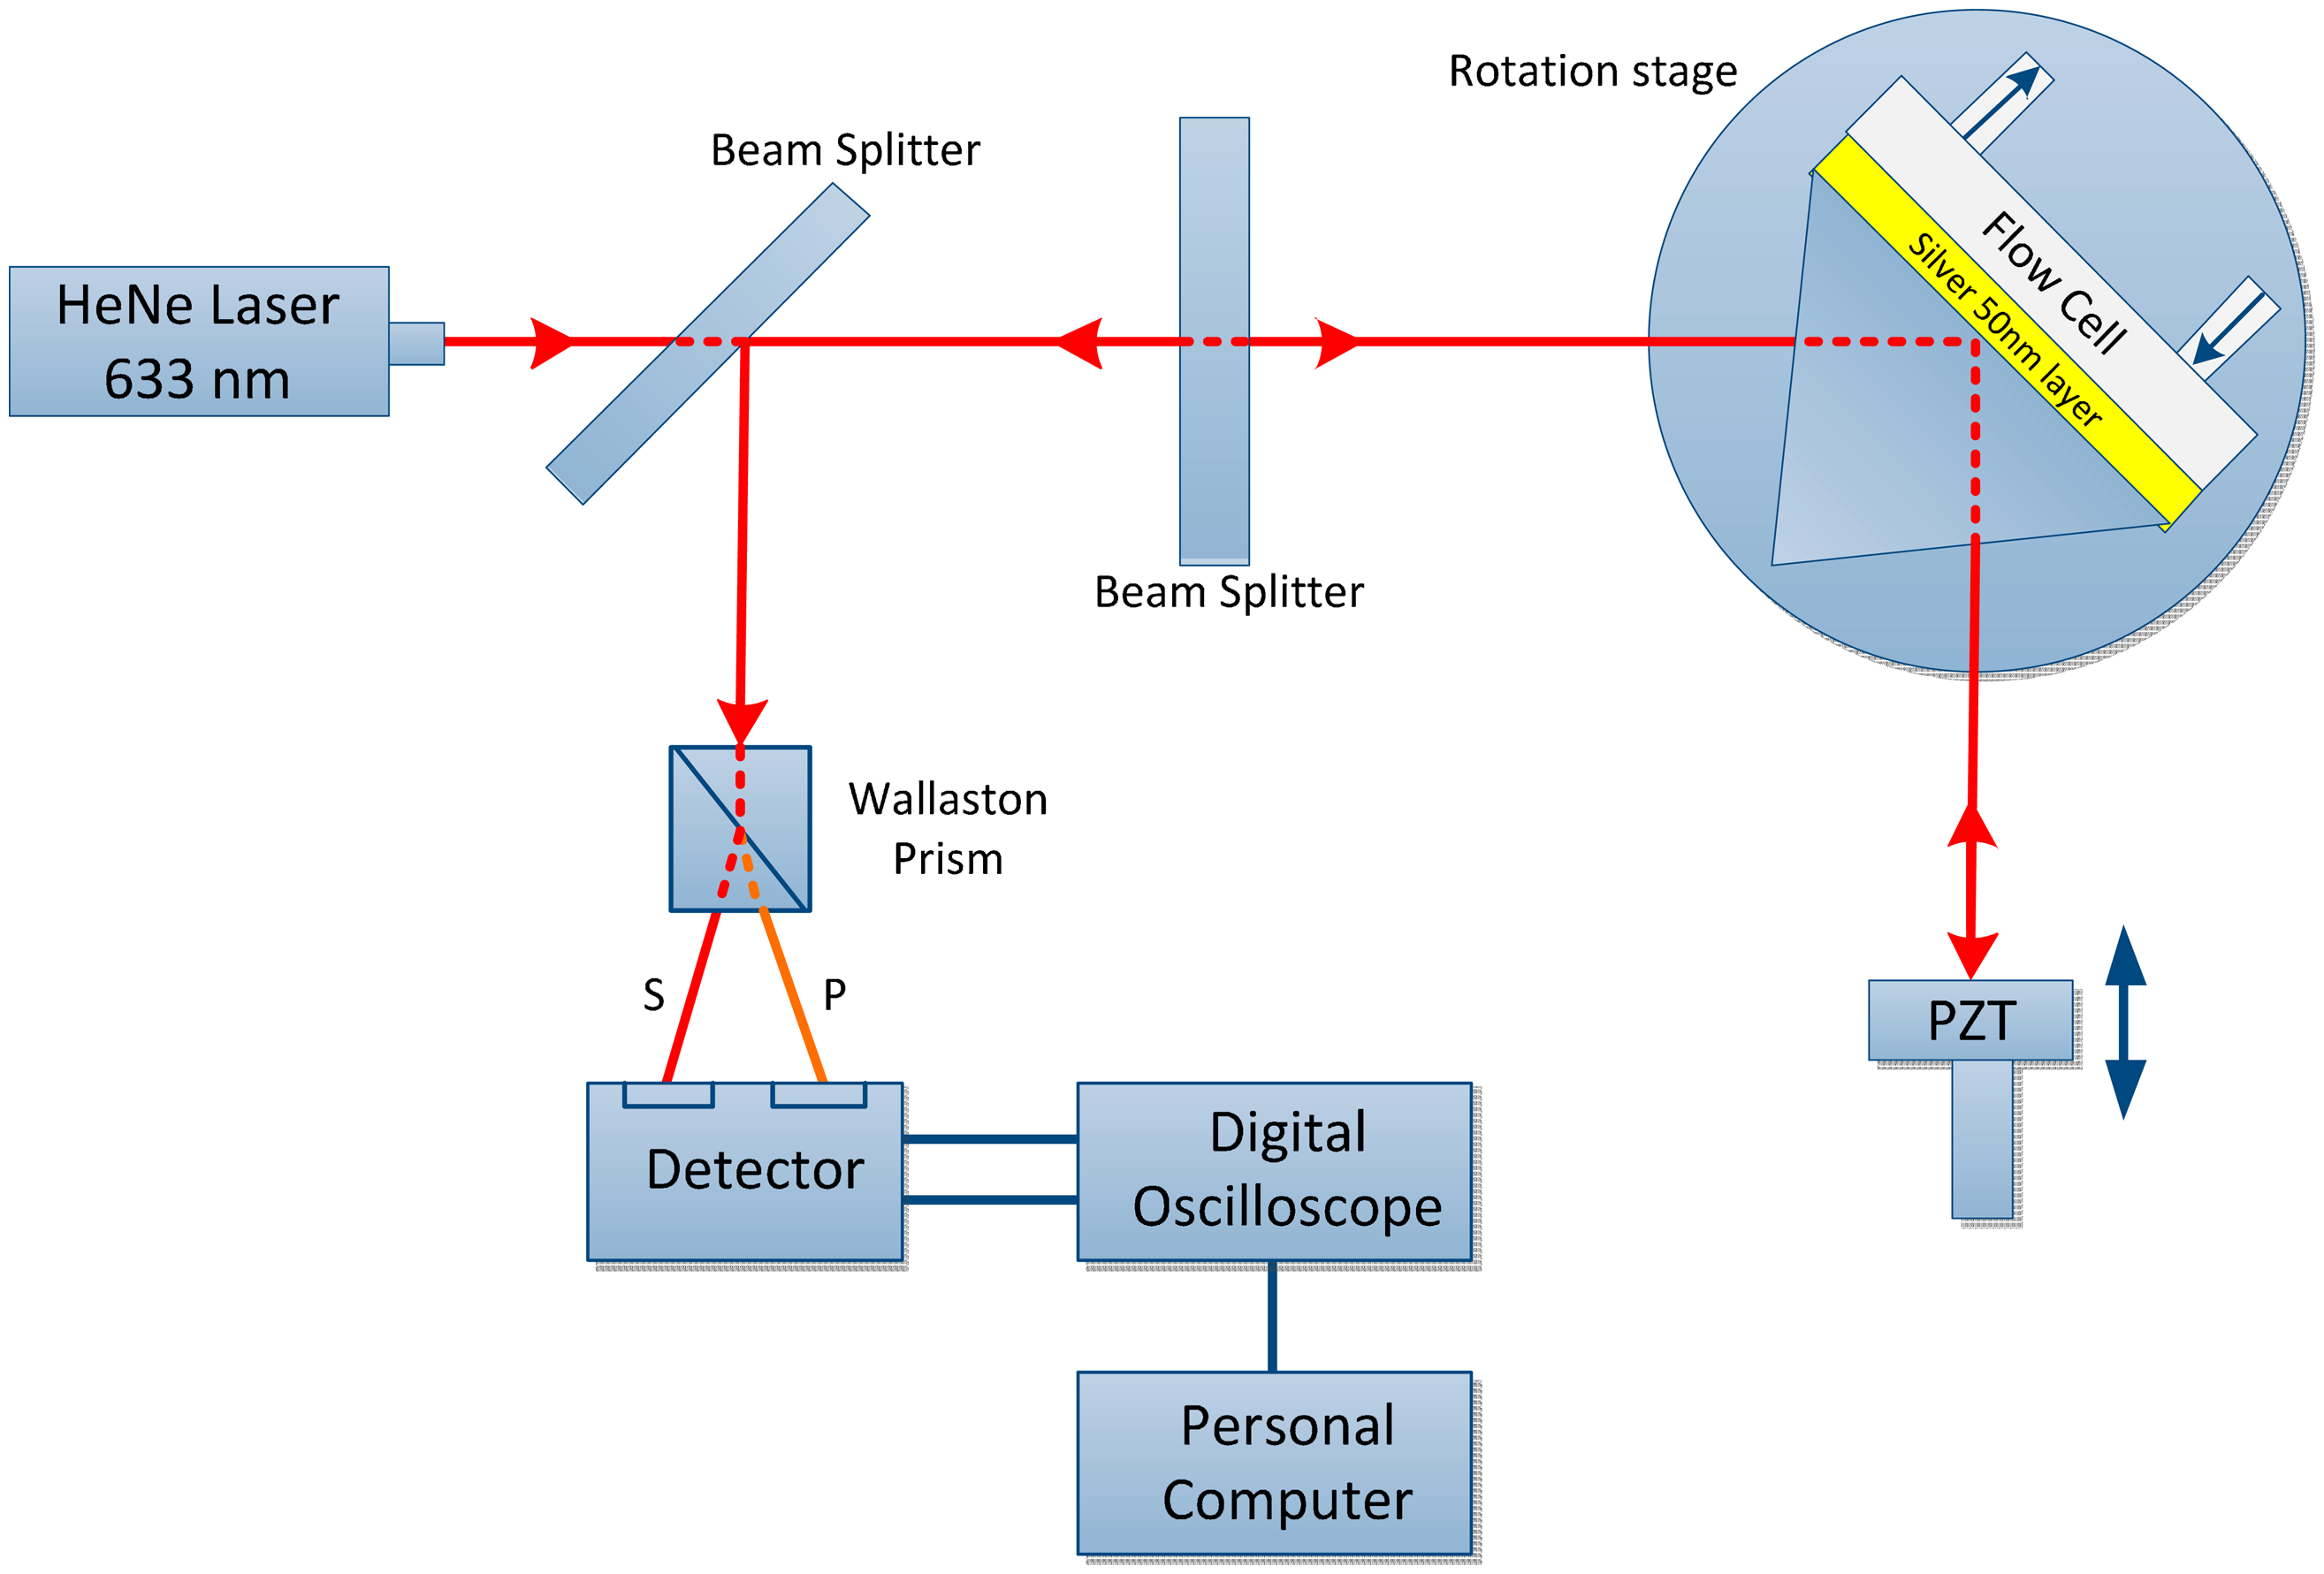
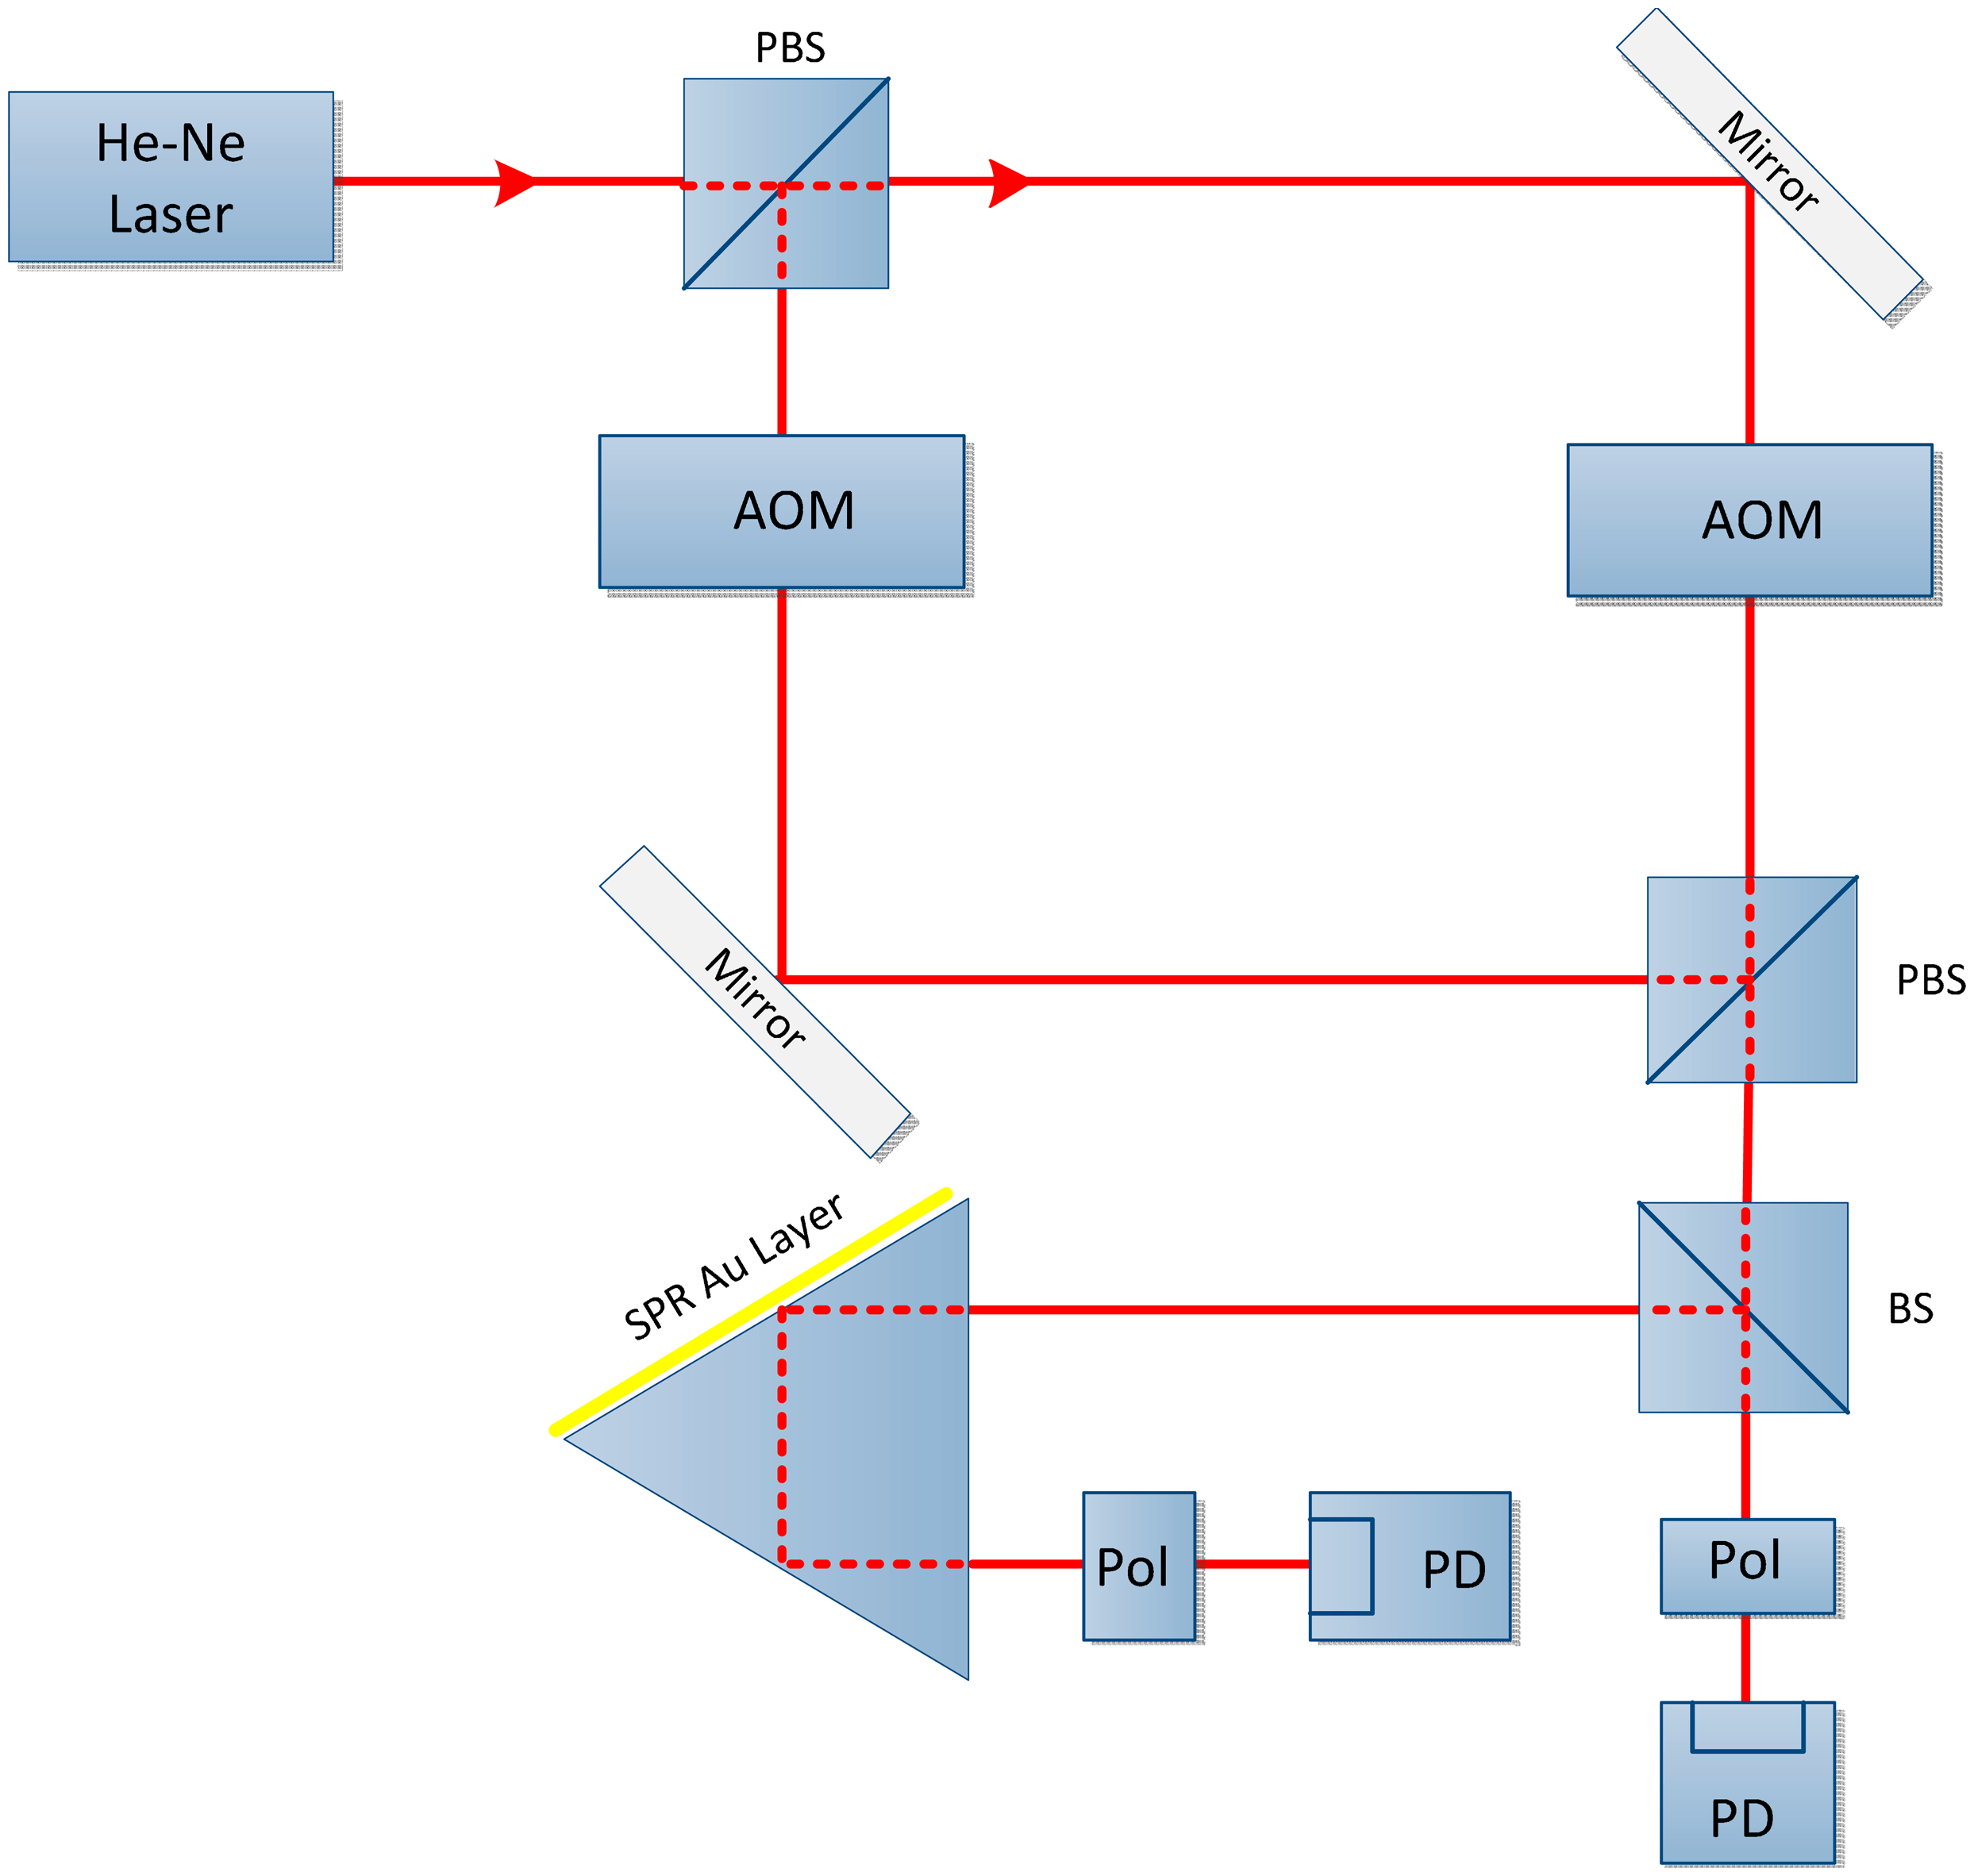
In 1996, Nelson and co. described an SPR phase sensor that used optical heterodyne detection. These researchers generated two light beams with a difference of 140 MHz using an acousto-optic modulator (AOM). The beam polarizing splitter was used to split the beam into a reference component and a signal component. The two components were rejoined with a help of linear polarizer and subsequently received by a photodetector as shown in Figure 7. A 140 MHz beat frequency signal was obtained by passing it through low-pass filter and oscillator was used to recombine the signal again at 140.01 MHz but for convenient manipulation, the frequency was reduced to 10 kHz. The two signal portions were subjected to the same procedure to incorporate a phase shift between the two polarizing component, except for passing through an SPR sensor. An accurate measurement of the SPR-induced phase shift was acquired by comparing the 10 kHz signal and the reference beams via the phase detection circuit. The optical heterodyne technique is insensitive to environmental noise and amplitude perturbations. The proposed setup was slightly complicated by limitations of the hardware due to unavailability of the proper frequency-shifting and phase detection instruments [72].
In 2001, Xing Long and his team built an immune sensor that based on the optical heterodyne technique. A transverse Zeeman laser was incorporated in the immune sensor with a minimum 30 kHz frequency difference in order to produce phase subdivision and improved resolution. The measurement accuracy for phase detection is enhanced by AC detection method for intensity instead of DC detection in order to avoid any shift [73]. A highly sensitive SPR biosensor was constructed using a same-path heterodyne interferometric system. A beam combiner was used to combine the He-Ne modulated s-wave and p-wave into a heterodyne light source with a frequency difference of 60 kHz. Use of the heterodyne interferometric common-path system to obtain the phase shift difference between the two waves offers the advantage of high sensitivity and real-time phase detection for monitoring of molecular interactions. This SPR biosensor was used to observe the interactions between sheep IgG covalently immobilized at the sensor chip surface and anti-sheep IgG in the running buffer [74].
A sensitive tunable optical heterodyne sensor, i.e., a noise can be reduced significantly by using p- and s- polarizations from the surroundings. A quarter-wave-plate (QWP) is placed in front of and back of the sensor. The SPR sensor strongly absorbs the p-wave if the orientation of QWP is accurate. This effort provides the high sensitivity as well as the response curve optimization. With this new design, the sensor performance can be improved and it provides the highest sensitivity irrespective of the room temperature, and optimized thickness of the metal film and a reduced standard deviation [75].
4.3. SPR Phase Detection via Michelson Interferometer
A fiber-optic sensor based on a Michelson interferometer was developed to determine the liquid n. To fix the reference point, the fiber ends are dipped in the solution to have contact with the sample and the solvent, and the difference in interference fringes are used to find the n of the solution. The Michelson interferometer sensor offers a resolution of approximately 9.6 × 10⁻⁶ RIU in the measurement region and provides high resolution where the concentration of the solution is low. The sensor performance can be enhanced by increasing the fringe difference through use of a polarizer coupler instead of normal coupler [76].
This alteration results in a novel SPR biosensor with a wide dynamic range based on differential phase Michelson interferometry as shown in Figure 8. A white light source was utilized to measure the corresponding phase changes at the optimized value of a wavelength. Because the induced phase change is highly wavelength dependent with a fixed incident angle, ultra-high sensitivity can be achieved for phase-sensitive detection. This system provides an extended dynamic measurement range and optimal sensitivity while uncompromising the phase resolution, compared with that of existing laser-based phase detection setups [77]. The results obtained from sodium chloride solutions have 2.6 × 10⁻⁷ RIU detection limit with a n span of 10−2 RIU, that is comparatively broader than the current laser based method [78].
5. Interferometry Schemes and Trade-Offs
The sensitivity, fabrication, reproducibility, detection accuracy and operating range are the parameters that must be compared with those of other SPR interferometry schemes as summarized in Table 2. The best SPR sensor is one that combines a long operating range, the ability to reproduce results, ease of fabrication, and high detection accuracy and sensitivity [79].
The fabrication of an optical sensor consists of a FPI with better detection sensitivity of molecules that adsorbed on a gold surface. The SPR sensor with one reflective layer consists of a gold film with a local SPR. The sensor sensitivity can be further enhanced by depositing Au nanoparticles on the layer [80].
A new optical FP cavity technique that incorporates the SPR is examined theoretically. This improved and modified model of the FP has better impact on the phase response as compared to conventional phase-detection technique that is based on the Kretschmann configuration (MZI and Michelson interferometer). This high resolution FP cavity technique only requires the values of the power spectrum for the measurement of phase response over a narrow wavelength span. Therefore, this configuration is more attractive for highly sensitive sensing applications [81]. The prism-based SPR sensing arrangements (MZI and Michelson interferometer) have a number of disadvantages, such as the presence of several mechanical (moving) and optical components and bulky size. Furthermore, the prism-based SPR sensors cannot be used for remote sensing applications [79]. The FPI has certain drawbacks that restrict its use, and the main disadvantages of a Fabry-Perot are the highly complex and multiple steps involved in the fabrication process, low mechanical strength, surface imperfections affected by the removal of material and the need for special splicing programs; integration on a chip is also difficult due to its facets. Therefore, this setup requires a rather sophisticated fabrication tool and a sophisticated material growth procedure [82]. Another disadvantage is the low finesse intensity reflection [83,87]. Therefore, due to these problems, the overall system complexity is increased, and the performance and robustness of the interferometers are compromised [88].
Together with the increasingly fine and delicate nanoscale device manufacturing technologies, the accompanied sensing approaches are becoming more important for detection of small changes in the parameters used in the biochemical area. Several experimental schemes exist to measure the phase change of the SPR excitation, i.e., phase shifting interferometry (PSI), which includes the Michelson & FPIs, and heterodyne interferometry (HI), which includes the MZI. Still, PSI suffers from certain disadvantages because it is not invulnerable to environmental noise, mechanical vibration and temperature with limited sensitivity. The HI is an optical modulation technique that yields higher sensitivity than PSI due to noise suppression from environmental disturbances, and the phase difference produced by the photodetector is amplified by a lock-in amplifier [84].
The Michelson interferometer is the most commonly used optical interferometry configuration. This instrument has a prime field of view for a specified wavelength, is relatively simple in operation and the tuning of wave plates can be carried out by mechanical rotation compared with the voltage control of Lithium Niobate optical modulators or piezoelectric crystals. However, Michelson interferometers have their own disadvantages; they have a restricted wavelength range, pre-filters are required (which restrict transmittance) and the conventional Michelson interferometer method has a narrow field of view [85].
6. Comparison of Phase with Angle, Wavelength and Intensity
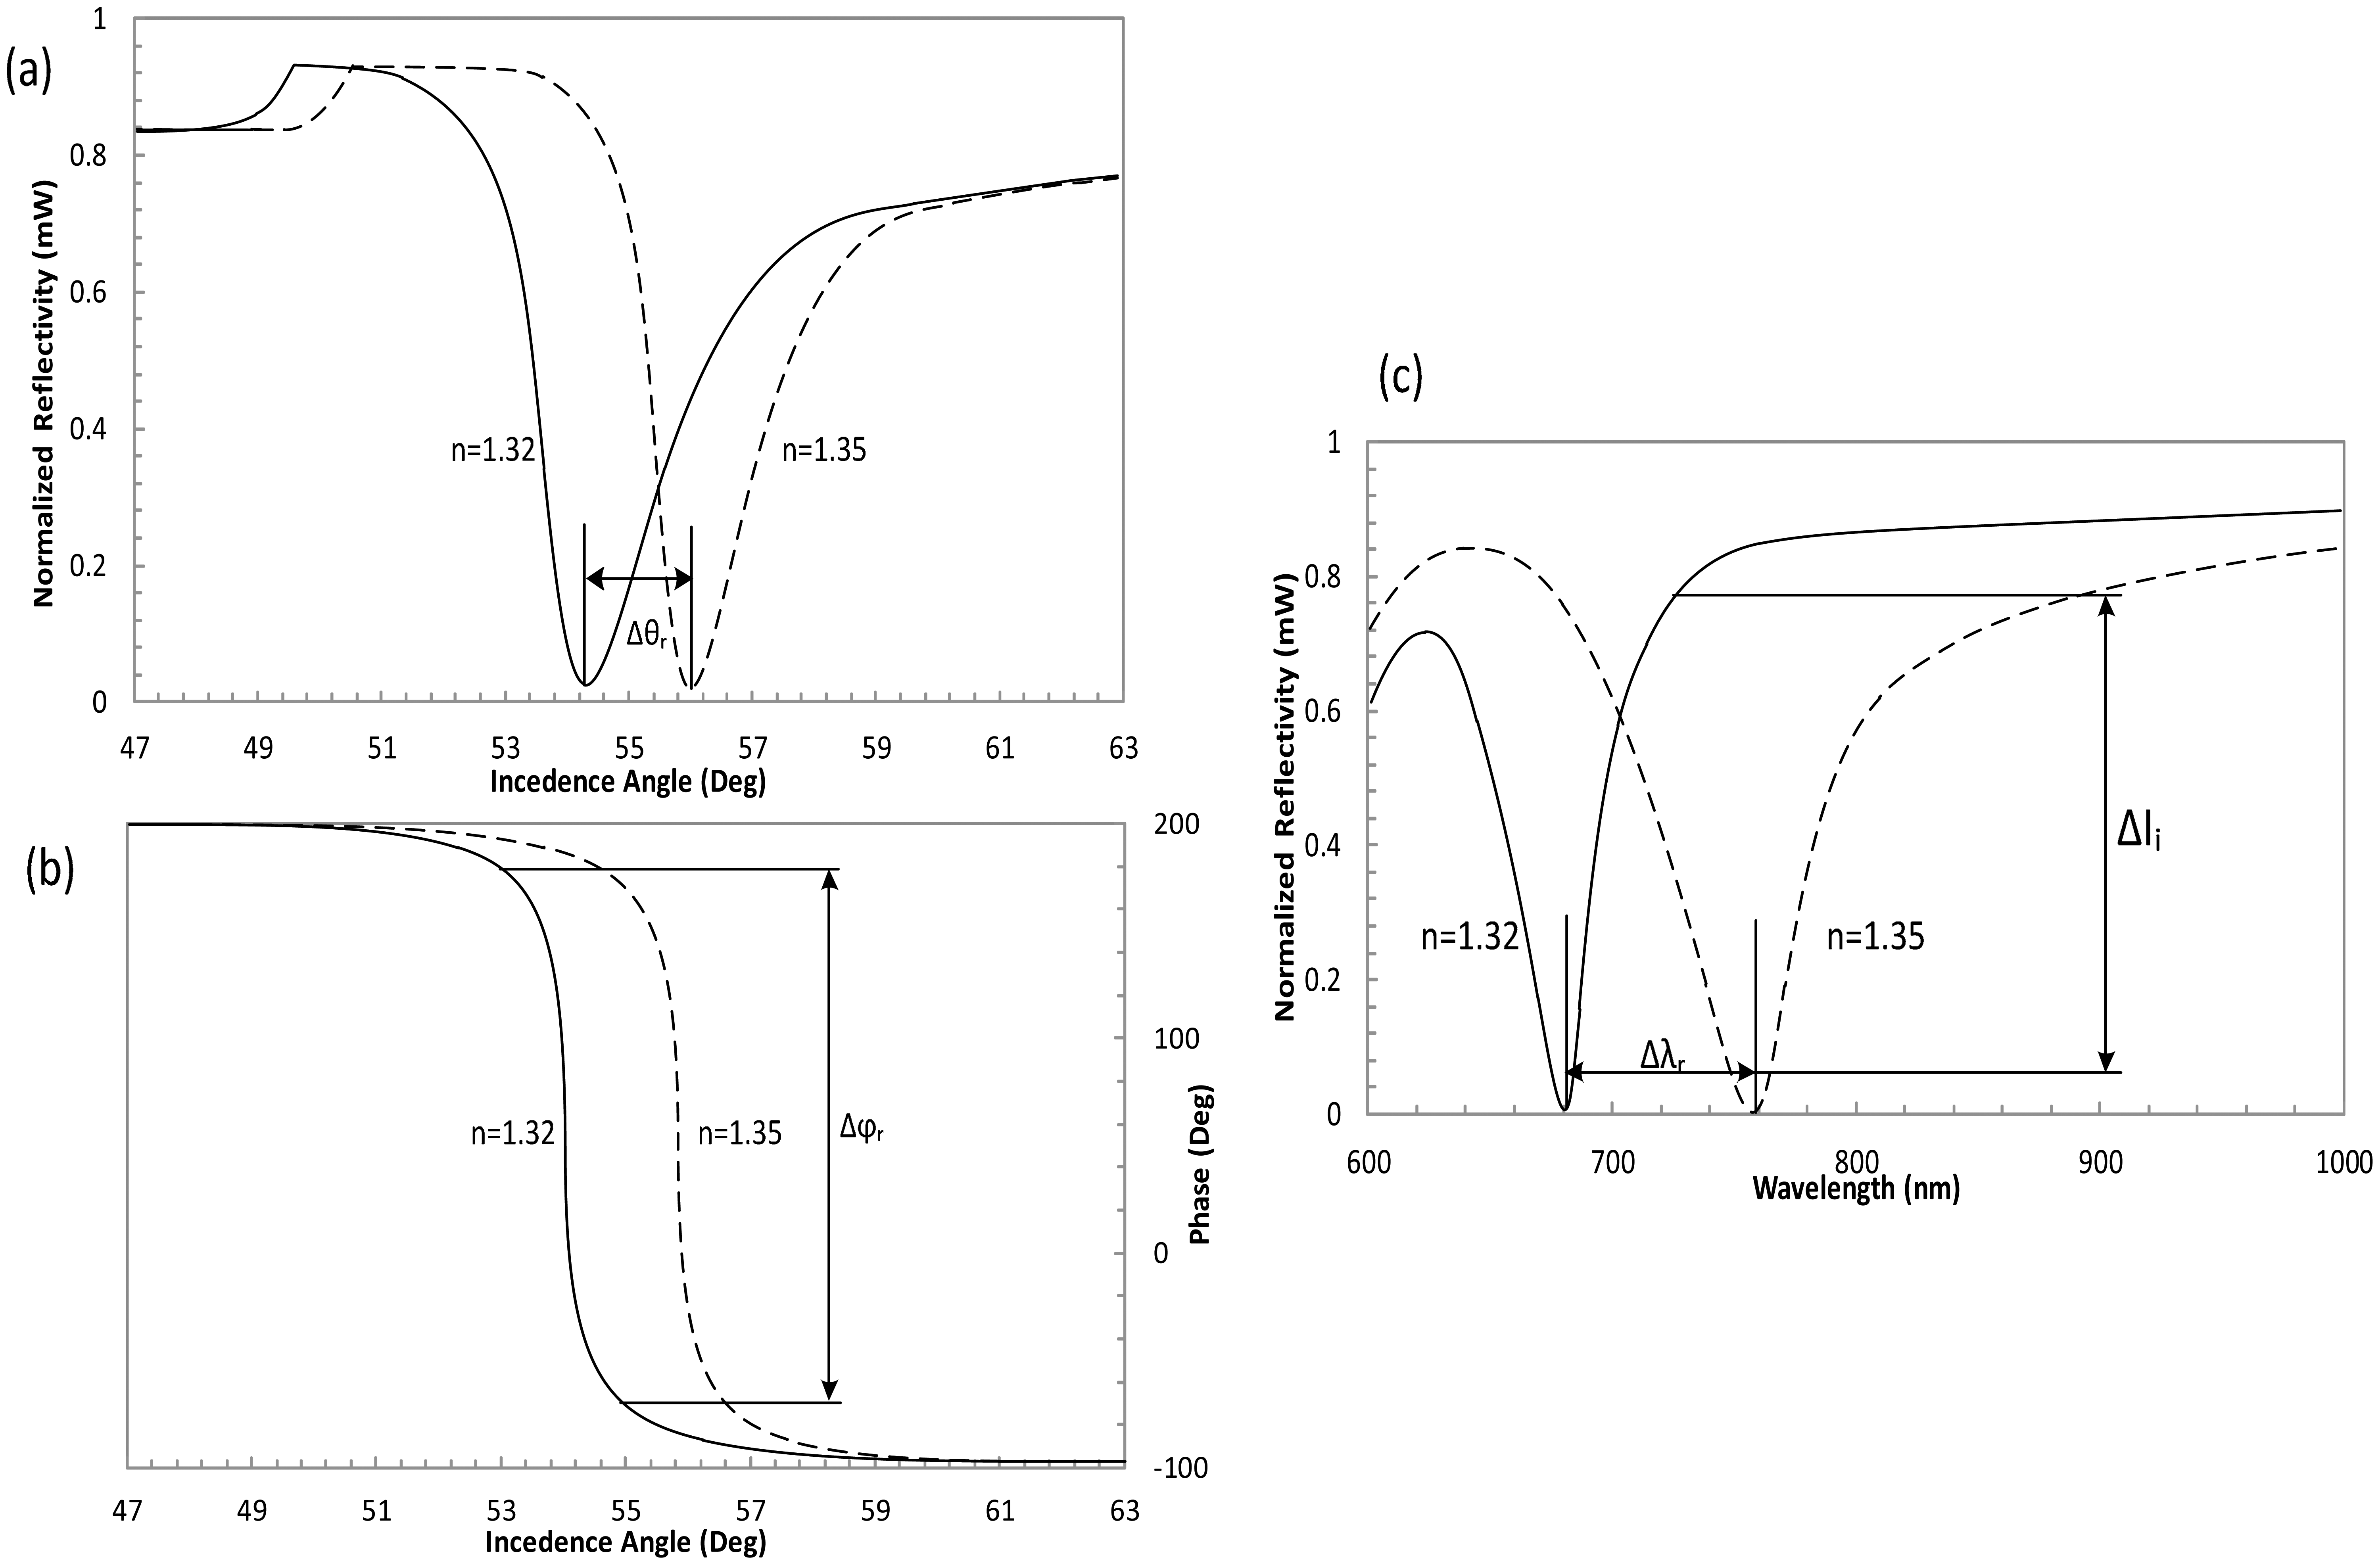
SPR biosensors were investigated with an aim to produce a portable and cheap substitute to conventional setups for “real-time” analysis of complete cell-ligand interactions. Four approaches are used to measure SPR and their comparison is given in Table 3. The first approach is a wavelength-dependent SPR setup, i.e., fiber optic based SPR biosensors, in which SPR sensor interrogates the trace on the basis of wavelength was developed to ensure continuous real-time data monitoring. The second approach is an integrated angle-based SPR biosensor with reflecto-meter that was improved to facilitate the biosensing community and its applications [89]. The third approach is an intensity measurement for SPR corresponding to n change with fixed values of angle and wavelength [90]. The last approach consists of a highly sensitive phase detection method used to determine the phase change with respect to changes in n of the sensing material compared with the wavelength, intensity and angle parameters [91–93]. In SPR experimental setup using Kretschmann configuration for angle modulation, the Δθr is the change in the incidence angle of the reflected light at fixed wavelength for two different n of the dielectric (n = 1.32 and n = 1.35). The change in phase Δϕr of the reflected light when using phase modulation at fixed wavelength and angle of incidence, Δli is the change in the reflected light intensity at fixed value of an incidence angle and the wavelength, for wavelength modulation technique the Δλr is the change at fixed angle of incidence for SF14 glass prism with 50 nm gold film as depicted by Figure 9 [9]. The dynamic range of the phase measurements has a much stronger response to the n change compared with that of the intensity-sensitive SPR [94]. Therefore, the sensitivity is at least 50 times greater than that of the conventional intensity-based SPR configurations [95]. The detection limit of the phase SPR sensor is 100 times lower than the intensity interrogation [96]. The result from the interferogram shows that the phase of the beam has a notably steep slope at the resonance angle compared with that of intensity sensing [97]. It is observed that the phase can change more abruptly than the intensity of the thickness of thin metal film or the n of the media on the sensor surface, and therefore, this method has become an attractive sensing technology [84].
The high sensitivity of the SPR phase detection method is obtained from the resonant dependency on the parameters of a laser light reflected from a metal surface, as a result of changes in the n of the adjacent medium [43,98]. Furthermore, phase resolution provides the possibility of examination of a medium with the use of a thin film [99]. Therefore, the latest research tell us that SPR phase has the ability to attain a lower detection limit and higher efficiency [100]. In this paper, we have reviewed various SPR phase detection schemes and configurations, especially phase detection via interferometry.
7. Applications of SPR Interferometry
In recent years, SPR interferometry has been increasingly used in the field of biological and chemical sensing and has replaced the traditional methods. The SPR interferometry is particularly suitable for measurement of interaction partners, i.e., nucleic acids [101], cells [102], proteins [103], antigens [104] and hormones [105]. For example, in chemical sensing, an impurity of glycerol in water with a level of 10 percent of volume was determined, which relates to a resolution of 10 RIU. This value is the minimum concentration level that can be determined by relative changes in the interference patterns [106]. The surface roughness of several dielectric materials with different deposition methods were determined via an SPR interferometer in the visible near infrared region (NIR). The dielectric values and the surface roughness at several deposition rates of thin Au film were also determined [65].
In biological sensing, SPR interferometry has made it possible to monitor the binding kinetics in less than 1300 spots in a protein microarray with a detection limit of ∼0.3 ng/cm2 and a 1 s time resolution. Such a setup should capture the high-throughput binding kinetics of small (∼200 Da) ligands on large protein microarrays and provide the absolute binding stoichiometry and bound amount as well [14]. The SPR microscopy setup dramatically decreases the appearance of speckles by producing high quality images of protein spots on the Au surface. The image size was 1280 × 1024 with a 18 × 18 pixel area selected for image analysis [107]. The SPR approach is recommended for initial kinetic measurements due to the spot sensing ability. This system is used to adsorb lipase from Thermomyces lanuginosus on a surface. The adsorption saturates at 1.30–1.35 mg/m2 with Thermomyces lanuginosus concentrations of 1000 nM [108]. Novel SPR biosensors based on Ag-graphene nanohybrids and Au-graphene nanohybrids were developed for the detection of mouse IgG. The SPR biosensors based on Ag-graphene nanohybrids and Au-graphene nanohybrids show good results with mouse IgG in a concentration range of 0.15–40.00 μg·mL−1 and 0.30–40.00 μg·mL−1, respectively [109].
8. Conclusions
This review paper provides an overview of the recent development in SPR sensors using interferometry and phase detection technique as well as certain drawbacks of the interferometry schemes. Additionally, certain solutions intended to increase the overall performance of SPR interferometry type sensors are covered.
Improving the performance of the SPR sensor is the main objectives in development for clinical applications. The theory shows that the performance of an SPR sensor depends predominantly on the noise properties of the detector and light source [110]. The sensitivity of a SPR biosensor is a fundamental feature for such applications. An improvement in sensitivity can be achieved if gold nanoparticles are exploited to functionalize the interacting surface. The gold nanoparticles are immobilized on a gold thin film surface of the SPR sensor [111–113]. The sensitivity enhancement of a SPR biosensor that includes a graphene layer on top of the gold layer has been demonstrated experimentally [114]. The performance of the SPR graphene biosensor was numerically and theoretically examined in terms of adsorption efficiency and sensitivity under changing conditions, including the number of graphene layers, the thickness of the biomolecule layer and the operating wavelength [115]. The utility of different bimetallic nanoparticle alloy combinations in SPR sensors based on this scheme is investigated in different approaches [116,117]. Silver, gold, copper and aluminum are selected for this analysis. The performances of the SPR sensors with different layers of bimetals or combinations of nanoparticle alloy are evaluated. The performance can be evaluated in comparison to three parameters: SNR, sensitivity and sensing layer operating range with respect to n values. The best bimetallic alloy combinations can be selected based on comparison and the selected logical criteria. The higher values of sensitivity, SNR and operating range can be achieved by using combination of bimetallic nanoparticle alloy [50]. The SPR phase technique is very popular measurement technique that can be modified further by adjusting the incident angle as indicated by a simulation and white Gaussian-beam light as a super continuum light source is used instead of LED light. Additionally, the gold-silver combination can be used for sensing so that the detected spectral phase signal can be significantly improved [78].
Acknowledgments
This work has been supported by the University Kebangsaan, Malaysia, under the Research University Grant (GUP-2013-048).
Author Contributions
All authors contributed extensively to the work presented in this review paper and preparing the manuscript. Muhammad Kashif and Ahmad Ashrif A. Bakar were the main responsible of the bibliographic search and analysis while Muhammad Kashif wrote the paper and worked on each section of the present manuscript. A. Ashrif A. Bakar was the scientific coordinator of the study. Norhana Arsad and Sahbudin Shaari have provided progressive detailed feedback to improve the manuscript contents.
Conflicts of Interest
The authors declare no conflict of interest.
References
- Baklanov, M.; Mogilnikov, K.; Polovinkin, V.; Dultsev, F. Determination of pore size distribution in thin films by ellipsometric porosimetry. J. Vac. Sci. Technol. B. 2000, 18, 1385–1391. [Google Scholar]
- Halthur, T.J.; Elofsson, U.M. Multilayers of charged polypeptides as studied by in situ ellipsometry and quartz crystal microbalance with dissipation. Langmuir 2004, 20, 1739–1745. [Google Scholar]
- Wang, Z.-H.; Jin, G. Covalent immobilization of proteins for the biosensor based on imaging ellipsometry. J. Immunol. Methods 2004, 285, 237–243. [Google Scholar]
- Tennyson, A.G.; Rosen, E.L.; Collins, M.S.; Lynch, V.M.; Bielawski, C.W. Bimetallic N-Heterocyclic Carbene-Iridium Complexes: Investigating Metal-Metal and Metal-Ligand Communication via Electrochemistry and Phosphorescence Spectroscopy. Inorg. Chem. 2009, 48, 6924–6933. [Google Scholar]
- Gaft, M.; Reisfeld, R.; Panczer, G. Modern Luminescence Spectroscopy of Minerals and Materials; Springer: Berlin/Heidelberg, Germany, 2005. [Google Scholar]
- Lakowicz, J.R. Principles of Fluorescence Spectroscopy; Springer: New York, NY, USA, 2007. [Google Scholar]
- Notingher, I. Raman spectroscopy cell-based biosensors. Sensors 2007, 7, 1343–1358. [Google Scholar]
- Fan, X.; White, I.M.; Shopova, S.I.; Zhu, H.; Suter, J.D.; Sun, Y. Sensitive optical biosensors for unlabeled targets: A review. Anal. Chim. Acta 2008, 620, 8–26. [Google Scholar]
- Homola, J. Present and future of surface plasmon resonance biosensors. Anal. Bioanal. Chem. 2003, 377, 528–539. [Google Scholar]
- Homola, J.; Yee, S.S.; Gauglitz, G. Surface plasmon resonance sensors: Review. Sens. Actuators B Chem. 1999, 54, 3–15. [Google Scholar]
- Daghestani, H.N.; Day, B.W. Theory and applications of surface plasmon resonance, resonant mirror, resonant waveguide grating, and dual polarization interferometry biosensors. Sensors 2010, 10, 9630–9646. [Google Scholar]
- Homola, J. Surface plasmon resonance sensors for detection of chemical and biological species. Chem. Rev. 2008, 108, 462–493. [Google Scholar]
- Brolo, A.G.; Gordon, R.; Leathem, B.; Kavanagh, K.L. Surface plasmon sensor based on the enhanced light transmission through arrays of nanoholes in gold films. Langmuir 2004, 20, 4813–4815. [Google Scholar]
- Campbell, C.T.; Kim, G. SPR microscopy and its applications to high-throughput analyses of biomolecular binding events and their kinetics. Biomaterials 2007, 28, 2380–2392. [Google Scholar]
- Torreri, P.; Ceccarini, M.; Macioce, P.; Petrucci, T.C. Biomolecular interactions by surface plasmon resonance technology. Ann. Ist. Super. Sanita 2005, 41, 437–441. [Google Scholar]
- Caldow, M.; Stead, S.L.; Day, J.; Sharman, M.; Situ, C.; Elliott, C. Development and validation of an optical SPR biosensor assay for tylosin residues in honey. J. Agric. Food Chem. 2005, 53, 7367–7370. [Google Scholar]
- Gustavsson, E.; Sternesjo, A. Biosensor analysis of beta-lactams in milk: Comparison with microbiological, immunological, and receptor-based screening methods. J. AOAC Int. 2004, 87, 614–620. [Google Scholar]
- Haughey, S.A.; Baxter, G.A. Biosensor screening for veterinary drug residues in foodstuffs. J. AOAC Int. 2006, 89, 862–867. [Google Scholar]
- Wang, K.; Yin, Y.-G. Research on salmonella rapid detection by SPR Biosensor. Food Sci. Technol. 2007, 9, 69. [Google Scholar]
- Minunni, M.; Tombelli, S.; Mariotti, E.; Mascini, M. Biosensors as new analytical tool for detection of Genetically Modified Organisms (GMOs). Fresenius J. Anal. Chem. 2001, 369, 589–593. [Google Scholar]
- McWhirter, A.; Wahlström, L. The Benefits and Scope of Surface Plasmon Resonance-Based Biosensors in Food Analysis. In Handbook of Surface Plasmon Resonance; The Royal Society of Chemistry: London, UK, 2008; pp. 333–352. [Google Scholar]
- Neumann, T.; Junker, H.D.; Schmidt, K.; Sekul, R. SPR-based fragment screening: advantages and applications. Curr. Top. Med. Chem. 2007, 7, 1630–1642. [Google Scholar]
- Sepúlveda, B.; Carrascosa, L.G.; Regatos, D.; Otte, M.A.; Farina, D.; Lechuga, L.M. Surface plasmon resonance biosensors for highly sensitive detection in real samples. Proceedings of the SPIE NanoScience+ Engineering, International Society for Optics and Photonics, San Diego, CA, USA, 2 August 2009; pp. 73970Y–73970Y-11.
- Saulnier, G.J.; Liu, N.; Tamma, C.; Xia, H.; Kao, T.-J.; Newell, J.; Isaacson, D. An electrical impedance spectroscopy system for breast cancer detection. Proceedings of the 29th Annual International Conference of the IEEE, Engineering in Medicine and Biology Society (EMBS), Lyon, France, 22–26 August 2007; pp. 4154–4157.
- Wasisto, H.S.; Merzsch, S.; Waag, A.; Uhde, E.; Salthammer, T.; Peiner, E. Airborne engineered nanoparticle mass sensor based on a silicon resonant cantilever. Sens. Actuators B Chem. 2013, 180, 77–89. [Google Scholar]
- Cho, K.; Peng, S. Carbon nanotube sensors. U.S. Patent No. 7,057,402,B2, 6 June 2006. [Google Scholar]
- Satishkumar, B.; Brown, L.O.; Gao, Y.; Wang, C.-C.; Wang, H.-L.; Doorn, S.K. Reversible fluorescence quenching in carbon nanotubes for biomolecular sensing. Nat. Nanotech. 2007, 2, 560–564. [Google Scholar]
- Islam, M.S.; Kouzani, A.Z.; Dai, X.J.; Michalski, W.P. Investigation of the effects of design parameters on sensitivity of surface plasmon resonance biosensors. Biomed. Signal Process. Control 2011, 6, 147–156. [Google Scholar]
- Drafts, B. Acoustic wave technology sensors. IEEE Trans. Microw. Theory Tech. 2001, 49, 795–802. [Google Scholar]
- Schroder, J.; Borngraber, R.; Lucklum, R.; Hauptmann, P. Network analysis based interface electronics for quartz crystal microbalance. Rev. Sci. Instrum. 2001, 72, 2750–2755. [Google Scholar]
- Roh, S.; Chung, T.; Lee, B. Overview of the characteristics of micro- and nano-structured surface plasmon resonance sensors. Sensors 2011, 11, 1565–1588. [Google Scholar]
- Akowuah, E.K.; Gorman, T.; Haxha, S. Design and optimization of a novel surface plasmon resonance biosensor based on Otto configuration. Opt. Express 2009, 17, 23511–23521. [Google Scholar]
- Lavine, B.K.; Westover, D.J.; Oxenford, L.; Mirjankar, N.; Kaval, N. Construction of an inexpensive surface plasmon resonance instrument for use in teaching and research. Microchem. J. 2007, 86, 147–155. [Google Scholar]
- Ruffato, G.; Zacco, G.; Romanato, F. Innovative Exploitation of Grating-Coupled Surface Plasmon Resonance for Sensing. Plasmonics-Principles Appl. 2012, 2012, 419–444. [Google Scholar]
- Wu, C.-M.; Jian, Z.-C.; Joe, S.-F.; Chang, L.-B. High-sensitivity sensor based on surface plasmon resonance and heterodyne interferometry. Sens. Actuators B Chem. 2003, 92, 133–136. [Google Scholar]
- Lin, W.B.; Jaffrezic-Renault, N.; Gagnaire, A.; Gagnaire, H. The effects of polarization of the incident light-modeling and analysis of a SPR multimode optical fiber sensor. Sens. Actuators A Phys. 2000, 84, 198–204. [Google Scholar]
- Shen, S.; Liu, T.; Guo, J. Optical phase-shift detection of surface plasmon resonance. Appl. Opt. 1998, 37, 1747–1751. [Google Scholar]
- Ho, H.P.; Lam, W.W. Application of differential phase measurement technique to surface plasmon resonance sensors. Sens. Actuators B Chem. 2003, 96, 554–559. [Google Scholar]
- Schasfoort, R.B.; Tudos, A.J. Handbook of Surface Plasmon Resonance; Royal Society of Chemistry: London, UK, 2008. [Google Scholar]
- Nikitin, P.; Beloglazov, A.; Kochergin, V.; Valeiko, M.; Ksenevich, T. Surface plasmon resonance interferometry for biological and chemical sensing. Sen. Actuators B Chem. 1999, 54, 43–50. [Google Scholar]
- Kabashin, A.V.; Patskovsky, S.; Grigorenko, A.N. Phase and amplitude sensitivities in surface plasmon resonance bio and chemical sensing. Opt. Express 2009, 17, 21191–21204. [Google Scholar]
- Naraoka, R.; Kajikawa, K. Phase detection of surface plasmon resonance using rotating analyzer method. Sen. Actuators B Chem. 2005, 107, 952–956. [Google Scholar]
- Kabashin, A.V.; Nikitin, P.I. Surface plasmon resonance interferometer for bio- and chemical-sensors. Opt. Commun. 1998, 150, 5–8. [Google Scholar]
- Guo, J.; Keathley, P.D.; Hastings, J. Dual-mode surface-plasmon-resonance sensors using angular interrogation. Opt. Lett. 2008, 33, 512–514. [Google Scholar]
- Gwon, H.R.; Lee, S.H. Spectral and angular responses of surface plasmon resonance based on the Kretschmann prism configuration. Mater. Trans. 2010, 51, 1150–1155. [Google Scholar]
- Yuk, L.S.; Ha, K.-S. Analysis of immunoreactions on protein arrays by using wavelength-interrogation-based surface plasmon resonance sensors. J. Korean Phys. Soc. 2004, 45, 1104–1108. [Google Scholar]
- Wang, T.-J.; Tu, C.-W.; Liu, F.-K.; Chen, H.-L. Surface plasmon resonance waveguide biosensor by bipolarization wavelength interrogation. IEEE Photonic. Tech. Lett. 2004, 16, 1715–1717. [Google Scholar]
- Huang, Y.; Gao, L.-X.; Su, W.-L.; Li, S.-Q.; Ye, H.-A. Realization of Surface Plasmon Resonance sensor based on wavelength modulation by using 50 nm broadband light source. Proceedings of the 2010 10th Russian-Chinese Symposium on Laser Physics and Laser Technologies (RCSLPLT) and 2010 Academic Symposium on Optoelectronics Technology (ASOT), Harbin, China, 28 July–1 August 2010; pp. 182–185.
- Hu, C.; Liu, D. High-performance Grating Coupled Surface Plasmon Resonance Sensor Based on Al-Au Bimetallic Layer. Mod. Appl. Sci. 2010, 4, 8–13. [Google Scholar]
- Anuj, K.S.; Gerhard, J.M. On the performance of surface plasmon resonance based fibre optic sensor with different bimetallic nanoparticle alloy combinations. J. Phys. D Appl. Phys. 2008, 41, 055106. [Google Scholar]
- Al-Qazwini, Y.; Noor, A.S.M.; Arasu, P.T.; Sadrolhosseini, A.R. Investigation of the performance of an SPR-based optical fiber sensor using finite-difference time domain. Curr. Appl. Phys. 2013, 13, 1354–1358. [Google Scholar]
- Nan-Fu, C.; Wei-Che, L.; Ting-Shiuan, J. Constructing a Novel Asymmetric Dielectric Structure toward the Realization of High-Performance Surface Plasmon Resonance Biosensors. IEEE Sens. J. 2013, 13, 3483–3489. [Google Scholar]
- Ince, R.; Narayanaswamy, R. Analysis of the performance of interferometry, surface plasmon resonance and luminescence as biosensors and chemosensors. Anal. Chim. Acta 2006, 569, 1–20. [Google Scholar]
- Hariharan, P. Optical Interferometry. Rep. Prog. Phys. 1991. [Google Scholar] [CrossRef]
- Yu, X.L.; Wang, D.X.; Wei, X.; Ding, X.; Liao, W.; Zhao, X.S. A surface plasmon resonance imaging interferometry for protein micro-array detection. Sens. Actuators B Chem. 2005, 108, 765–771. [Google Scholar]
- Betzler, K. Elektronische Messdatenverarbeitung. Ph.D. Thesis, Universität Osnabrück, Osnabrück, Germany, 2001. [Google Scholar]
- Wei, T.; Lan, X.; Xiao, H.; Han, Y.; Tsai, H.-L. Optical fiber sensors for high temperature harsh environment sensing. Proceedings of the 2011 IEEE, Instrumentation and Measurement Technology Conference (I2MTC), Binjiang, China, 10–12 May 2011; pp. 1–4.
- Wei, T.; Han, Y.; Tsai, H.-L.; Xiao, H. Miniaturized fiber inline Fabry-Perot interferometer fabricated with a femtosecond laser. Opt. Lett. 2008, 33, 536–538. [Google Scholar]
- Wei, T.; Han, Y.; Tsai, H.-L.; Xiao, H. Miniaturized fiber inline Fabry-Pérot interferometer for chemical sensing. Proceedings of the SPIE Defense, Security, and Sensing, International Society for Optics and Photonics, Orlando, FL, USA, 13 April 2009; pp. 73220F–73220F-5.
- Wei, T.; Han, Y.; Li, Y.; Tsai, H.-L.; Xiao, H. Temperature-insensitive miniaturized fiber inline Fabry-Perot interferometer for highly sensitive refractive index measurement. Opt. Express 2008, 16, 5764–5769. [Google Scholar]
- Tianhua, Z.; Karandikar, S.; Zhongcheng, G.; Giorno, R.; Long, Q. Label-free biosensing using a nanostructured Fabry-Perot interferometer. Proceedings of the 2010 IEEE, Sensors, Kona, HI, USA, 1–4 November 2010; pp. 2065–2068.
- Zhang, T.; Gong, Z.; Giorno, R.; Que, L. A nanostructured Fabry-Perot interferometer. Opt. Express 2010, 18, 20282–20288. [Google Scholar]
- Liu, Q.; Tu, X.; Kim, K.W.; Kee, J.S.; Shin, Y.; Han, K.; Yoon, Y.-J.; Lo, G.-Q.; Park, M.K. Highly sensitive Mach-Zehnder interferometer biosensor based on silicon nitride slot waveguide. Sens. Actuators B Chem. 2013, 188, 681–688. [Google Scholar]
- Hariharan, P. Basics of interferometry. Available online: http://www.sciencedirect.com/science/book/9780123735898 (accessed on 22 February 2014).
- Lepage, D.; Carrier, D.; Jiménez, A.; Beauvais, J.; Dubowski, J.J. Plasmonic propagations distances for interferometric surface plasmon resonance biosensing. Nanoscale Res. Lett. 2011, 6, 1–7. [Google Scholar]
- Huang, Y.; Ho, H.; Wu, S.; Kong, S. Detecting phase shifts in surface plasmon resonance: A review. Adv. Opt. Technol. 2012, 2012, 471957. [Google Scholar]
- Ho, H.P.; Wong, C. Imaging Differential Phase Surface Plasmon Resonance Biosensors. Proceedings of the 19th Annual Meeting of the IEEE, Lasers and Electro-Optics Society, Montreal, Canada, 29 October 2– November 2006; pp. 675–676.
- Ho, H.P.; Yuan, W.; Wong, C.L.; Wu, S.Y.; Suen, Y.K.; Kong, S.K.; Lin, C. Sensitivity enhancement based on application of multi-pass interferometry in phase-sensitive surface plasmon resonance biosensor. Opt. Commun. 2007, 275, 491–496. [Google Scholar]
- Wu, S.Y.; Ho, H.P.; Law, W.C.; Lin, C.; Kong, S.K. Highly sensitive differential phase-sensitive surface plasmon resonance biosensor based on the Mach-Zehnder configuration. Opt. Lett. 2004, 29, 2378–2380. [Google Scholar]
- Yuan, W.; Ho, H.P.; Wong, C.; Kong, S.K.; Lin, C. Surface Plasmon Resonance Biosensor Incorporated in a Michelson Interferometer With Enhanced Sensitivity. IEEE Sens. J. 2007, 7, 70–73. [Google Scholar]
- Yu, H.; Xiong, L.; Chen, Z.; Li, Q.; Yi, X.; Ding, Y.; Wang, F.; Lv, H.; Ding, Y. Ultracompact and high sensitive refractive index sensor based on Mach-Zehnder interferometer. Opt. Laser Eng. 2014, 56, 50–53. [Google Scholar]
- Nelson, S.G.; Johnston, K.S.; Yee, S.S. High sensitivity surface plasmon resonace sensor based on phase detection. Sen. Actuators B Chem. 1996, 35, 187–191. [Google Scholar]
- Yu, X.; Zhao, L.; Jiang, H.; Wang, H.; Yin, C.; Zhu, S. Immunosensor based on optical heterodyne phase detection. Sen. Actuators B Chem. 2001, 76, 199–202. [Google Scholar]
- Joe, S.F.; Hsieh, L.Z.; Chang, L.B.; Hsieh, C.C.; Wu, C.M. Heterodyne interferometric surface plasmon resonance biosensor. J. Med. Biol. Eng. 2006, 26, 149–153. [Google Scholar]
- Wu, C.-M.; Pao, M.-C. Sensitivity-tunable optical sensors based on surface plasmon resonance and phase detection. Opt. Express 2004, 12, 3509–3514. [Google Scholar]
- Meng, H.; Shen, W.; Zhang, G.; Wu, X.; Wang, W.; Tan, C.; Huang, X. Michelson interferometer-based fiber-optic sensing of liquid refractive index. Sen. Actuators B Chem. 2011, 160, 720–723. [Google Scholar]
- Ng, S.-P.; Wu, C.-M. L.; Wu, S.-Y.; Ho, H.-P.; Kong, S.K. Differential spectral phase interferometry for wide dynamic range surface plasmon resonance biosensing. Biosens. Bioelectron. 2010, 26, 1593–1598. [Google Scholar]
- Ng, S.P.; Wu, C.M.L.; Wu, S.Y.; Ho, H.P. White-light spectral interferometry for surface plasmon resonance sensing applications. Opt. Express 2011, 19, 4521–4527. [Google Scholar]
- Gupta, B.D.; Verma, R.K. Surface plasmon resonance-based fiber optic sensors: Principle, probe designs, and some applications. J. Sens. 2009, 2009, 979761. [Google Scholar]
- Lu, G.; Cheng, B.; Shen, H.; Zhou, Y.; Chen, Z.; Yang, G.; Tillement, O.; Roux, S.; Perriat, P. Fabry-Perot type sensor with surface plasmon resonance. Appl. Phys. Lett. 2006, 89, 223904–223904-3. [Google Scholar]
- Xiao, F.; Li, G.; Alameh, K.; Xu, A. Fabry-Perot-based surface plasmon resonance sensors. Opt. Lett. 2012, 37, 4582–4584. [Google Scholar]
- Villatoro, J.; Finazzi, V.; Coviello, G.; Pruneri, V. Photonic-crystal-fiber-enabled micro-Fabry-Perot interferometer. Opt. Lett. 2009, 34, 2441–2443. [Google Scholar]
- Taghavi, L.S. Theory, Fabrication and Applications of A Novel Archetype Semi-Ring Fabry-Perot (SRFP) Resonator, and New Tiltmeters. Ph.D. Thesis, California Institute of Technology, Pasadena, CA, USA, 2006. [Google Scholar]
- Chen, B.-H.; Wang, Y.-C.; Lin, J.-H. High sensitivity of phase-based surface plasmon resonance in nano-cylinder array. PIERS Online 2008, 4, 746–750. [Google Scholar]
- Leisawitz, D.; Frey, B.J.; Leviton, D.B.; Martino, A.J.; Maynard, W.L.; Mundy, L.G.; Rinehart, S.A.; Teng, S.H.; Zhang, X. The Wide-Field Imaging Interferometry Testbed I: purpose, testbed design, data, and synthesis algorithms. Astrophysics 2002, 0210005. [Google Scholar]
- Bird, J.; Shepherd, G.; Tepley, C. Comparison of lower thermospheric winds measured by a polarizing Michelson interferometer and a Fabry-Perot spectrometer during the AIDA campaign. J. Atmos. Terr. Phys. 1993, 55, 313–324. [Google Scholar]
- Taghavi-Larigani, S.; VanZyl, J. An Archetype Semi-Ring Fabry-Perot (SRFP) Resonator. Proceedings of the 2009 Joint with the 22nd European Frequency and Time forum, Frequency Control Symposium, Besancon, France, 20–24 April 2009; pp. 1169–1172.
- Ravindra, B.; Banyal, R.K. A Dual Fabry-Perot Based Imaging Spectrometer for the National Large Solar Telescope. Tech. Rep. Ser. 2010, 2010, IIA-TRS-0110. [Google Scholar]
- Quinn, J.G.; O'Neill, S.; Doyle, A.; McAtamney, C.; Diamond, D.; MacCraith, B.D.; O'Kennedy, R. Development and application of surface plasmon resonance-based biosensors for the detection of cell-ligand interactions. Anal. Biochem. 2000, 281, 135–143. [Google Scholar]
- Kusko, M. Design of low cost surface plasmon resonance sensor. Proceedings of the International, Semiconductor Conference (CAS), Sinaia, Romania, 15–17 October 2012; pp. 251–254.
- Li, B. Application of Surface Plasmon Resonance in Chemical/Biological. Available online: http://www.phyast.pitt.edu/∼libin/pdf_papers/spr.pdf (accessed on 15 August 2014).
- Yang, T.; Ho, H.P. A phase-sensitive surface plasmon resonance sensor based on the enhanced light transmission through arrays of nanoholes in gold films. Proceedings of the IEEE International Conference on Electron Devices and Solid-State Circuits, Hong Kong, China, 8–10 December 2008; pp. 1–4.
- Chiang, H.-P.; Lin, J.-L.; Chang, R.; Su, S.-Y.; Leung, P.T. High-resolution angular measurement using surface-plasmon-resonance via phase interrogation at optimal incident wavelengths. Opt. Lett. 2005, 30, 2727–2729. [Google Scholar]
- Yu, X.; Ding, X.; Liu, F.; Deng, Y. A novel surface plasmon resonance imaging interferometry for protein array detection. Sens. Actuators B Chem. 2008, 130, 52–58. [Google Scholar]
- Markowicz, P.P.; Law, W.C.; Baev, A.; Prasad, P.N.; Patskovsky, S.; Kabashin, A.V. Phase-sensitive time-modulated surface plasmon resonance polarimetry for wide dynamic range biosensing. Opt. Express 2007, 15, 1745–1754. [Google Scholar]
- Halpern, A.R.; Chen, Y.; Corn, R.M.; Kim, D. Surface plasmon resonance phase imaging measurements of patterned monolayers and DNA adsorption onto microarrays. Anal. Chem. 2011, 83, 2801–2806. [Google Scholar]
- Ran, B.; Lipson, S.G. Comparison between sensitivities of phase and intensity detection in surface plasmon resonance. Opt. Express 2006, 14, 5641–5650. [Google Scholar]
- Yu, X.L.; Wang, D.X.; Yan, Z.B. Simulation and analysis of surface plasmon resonance biosensor based on phase detection. Sens. Actuators B Chem. 2003, 91, 285–290. [Google Scholar]
- Liu, J.F.; Ding, X.; Yu, X.L.; Wang, D.S. Data analysis of surface plasmon resonance biosensor based on phase detection. Sens. Actuators B Chem. 2005, 108, 778–783. [Google Scholar]
- Patskovsky, S.; Meunier, M.; Prasad, P.N.; Kabashin, A.V. Self-noise-filtering phase-sensitive surface plasmon resonance biosensing. Opt. Express 2010, 18, 14353–14358. [Google Scholar]
- Pan, S.; Xu, J.; Shu, Y.; Wang, F.; Xia, W.; Ding, Q.; Xu, T.; Zhao, C.; Zhang, M.; Huang, P. Double recognition of oligonucleotide and protein in the detection of DNA methylation with surface plasmon resonance biosensors. Biosens. Bioelectron. 2010, 26, 850–853. [Google Scholar]
- Peterson, A.W.; Halter, M.; Tona, A.; Bhadriraju, K.; Plant, A.L. Using surface plasmon resonance imaging to probe dynamic interactions between cells and extracellular matrix. Cytom. Part A 2010, 77, 895–903. [Google Scholar]
- Teramura, Y.; Iwata, H. Label-free immunosensing for alpha-fetoprotein in human plasma using surface plasmon resonance. Anal. Biochem. 2007, 365, 201–207. [Google Scholar]
- Zhang, H.; Sun, Y.; Wang, J.; Zhang, J.; Zhang, H.; Zhou, H.; Song, D. Preparation and application of novel nanocomposites of magnetic-Au nanorod in SPR biosensor. Biosens. Bioelectron. 2012, 34, 137–143. [Google Scholar]
- Treviño, J.; Calle, A.; Rodríguez-Frade, J.M.; Mellado, M.; Lechuga, L.M. Determination of human growth hormone in human serum samples by surface plasmon resonance immunoassay. Talanta 2009, 78, 1011–1016. [Google Scholar]
- Nikitin, P.I.; Grigorenko, A.N.; Beloglazov, A.A.; Valeiko, M.V.; Savchuk, A.I.; Savchuk, O.A.; Steiner, G.; Kuhne, C.; Huebner, A.; Salzer, R. Surface plasmon resonance interferometry for micro-array biosensing. Sens. Actuators A Phys. 2000, 85, 189–193. [Google Scholar]
- Thariani, R.; Yager, P. Novel, high-quality surface plasmon resonance microscopy. Sens. Actuators B Chem. 2008, 130, 765–770. [Google Scholar]
- Sonesson, A.W.; Callisen, T.H.; Brismar, H.; Elofsson, U.M. A comparison between dual polarization interferometry (DPI) and surface plasmon resonance (SPR) for protein adsorption studies. Colloid Surf. B 2007, 54, 236–240. [Google Scholar]
- Zhang, H.; Song, D.; Gao, S.; Zhang, J.; Zhang, H.; Sun, Y. Novel SPR biosensors based on metal nanoparticles decorated with graphene for immunoassay. Sens. Actuators B Chem. 2013, 188, 548–554. [Google Scholar]
- Piliarik, M.; Homola, J. Í. Surface plasmon resonance (SPR) sensors: Approaching their limits? Opt. Express 2009, 17, 16505–16517. [Google Scholar]
- Ermini, M.L.; Scarano, S.; Minunni, M. Surface nanostructuring for Surface Plasmon Resonance imaging. Proceedings of the 2011 International Workshop on BioPhotonics, Parma, Italy, 8–10 June 2011; pp. 1–3.
- Yen, H.S.; Lai, W.H.; Lay, G.T.; Hao, E.H.; Min, H.H. How the Optical Properties of Au Nanoparticles are Affected by Surface Plasmon Resonance. Proceedings of IEEE International Conference on Semiconductor Electronics, Kuala Lumpur, Malaysia, 29 October–1 December 2006; pp. 138–141.
- Hutter, E.; Fendler, J.; Roy, D. Surface plasmon resonance studies of gold and silver nanoparticles linked to gold and silver substrates by 2-aminoethanethiol and 1, 6-hexanedithiol. J. Phys. Chem. B 2001, 105, 11159–11168. [Google Scholar]
- Islam, M.S.; Kouzani, A.Z.; Dai, X.J.; Michalski, W.P.; Gholam Hosseini, H. Comparison of performance parameters for conventional and localized surface plasmon resonance graphene biosensors. Proceedings of Annual International Conference of the IEEE, Engineering in Medicine and Biology Society (EMBC), Boston, MA, USA, 30 August– 3 September 2011; pp. 1851–1854.
- Salah, N.H.; Jenkins, D.; Panina, L.; Handy, R.; Pan, G.; Awan, S. Self-Sensing Surface Plasmon Resonance for the Detection of Metallic Nanoparticles. Smart Nanosyst. Eng. Med. 2012, 2, 9–21. [Google Scholar]
- Luo, X.-F.; Han, L. A universal model of surface plasmon resonance characteristics for isotropic multilayer films. Proceedings of the 2010 IEEE Youth Conference on Information Computing and Telecommunications (YC-ICT), Beijing, China, 28–30 November 2010; pp. 263–266.
- Kuryoz, P.Y.; Poperenko, L.V.; Kravets, V.G. Correlation between dielectric constants and enhancement of surface plasmon resonances for thin gold films. Phys. Status Solidi (a) 2013, 210, 2445–2455. [Google Scholar]


| Performance Parameters | Description |
|---|---|
| Sensitivity | The ratio of the change in the sensor output (y) (e.g., wavelength, intensity, angle of incidence, phase, and polarization of a light that interact with a surface plasmon wave) with respect to the change in n of the medium (e.g., analyte concentration) [49]. S = Δn/Δy |
| SNR | The ratio between the output intensity (PO) of the light to the input intensity (PI) of the light beam, and a high value of SNR is preferred for better results [31]. SNR = PO/PI |
| Accuracy | The degree of the sensor output provides the true value of the quantity to be measured (analyte concentration) [50]. |
| Precision | The manner in which the results give the same reading when the repetitive measurements are carried out without any reference to the true value [51,52]. |
| Repeatability | The capability of a sensor to reproduce same output over a certain interval of time while operating under a constant environmental condition [9]. |
| Minimum Detection Limit | The lowest concentration level of an analyte that can be determined by the sensor [53]. |
| SPR Interferometr | Fabry-Perot [67,80–83] | Mach-Zehnder [43,69,84] | Michelson [78,79,85,86] |
|---|---|---|---|
| Advantages | High sensitivity, small size, high resolution. | Simple setup, good sensitivity, can be modified by adding other components. | Simple in operation and tuning, good sensitivity |
| Disadvantages | Highly complex fabrication, low mechanical strength, temperature limitation, low finesse intensity reflection. | Bulky size, moving mechanical parts, high cost. | Restricted wavelength range, required pre-filters, environmental noise, and mechanical vibrations. |
| Sensitivity | 2.3 × 10⁻⁸ RIU | 5.5 × 10⁻⁸ RIU | 2.2 × 10⁻⁷ RIU |
| System Size | Small | Medium-Large | Medium |
| Applications | SPR intensity image of the 15 sensor sites covered by different salt water mixture. The Ag, BaTiO3, and Au layers are deposited on a quartz substrate to develop the Fabry-Perot sensor for measuring 1,6-hexanedithiol on the Au surface. | Measuring of the bovine serum albumin (BSA) binding reaction with its antibodies by SPR Mach-Zehnder Setup. The MZI setup is used to determine significant phase changes by replacing the 100% gas to 100% Ar gas. | The the addition of 10% NaCl solution into the pure water measured by SPR Michelson interferometer. |
| SPR Schemes | Intensity | Angular Interrogation | Wavelength Interrogation | Phase Detection |
|---|---|---|---|---|
| Resolution | 10−5 RIU | 5 × 10⁻⁵ RIU | 10−6 RIU | 4 × 10⁻⁸ RIU |
| Dynamic range | 0.05 RIU | 0.1 RIU | >0.1 RIU | 5 × 10⁻⁴ RIU |
| SPR imaging | Convenient | Difficult | Difficult | Convenient |
© 2014 by the authors; licensee MDPI, Basel, Switzerland. This article is an open access article distributed under the terms and conditions of the Creative Commons Attribution license ( http://creativecommons.org/licenses/by/3.0/).
Share and Cite
Kashif, M.; Bakar, A.A.A.; Arsad, N.; Shaari, S. Development of Phase Detection Schemes Based on Surface Plasmon Resonance Using Interferometry. Sensors 2014, 14, 15914-15938. https://doi.org/10.3390/s140915914
Kashif M, Bakar AAA, Arsad N, Shaari S. Development of Phase Detection Schemes Based on Surface Plasmon Resonance Using Interferometry. Sensors. 2014; 14(9):15914-15938. https://doi.org/10.3390/s140915914
Chicago/Turabian StyleKashif, Muhammad, Ahmad Ashrif A. Bakar, Norhana Arsad, and Sahbudin Shaari. 2014. "Development of Phase Detection Schemes Based on Surface Plasmon Resonance Using Interferometry" Sensors 14, no. 9: 15914-15938. https://doi.org/10.3390/s140915914