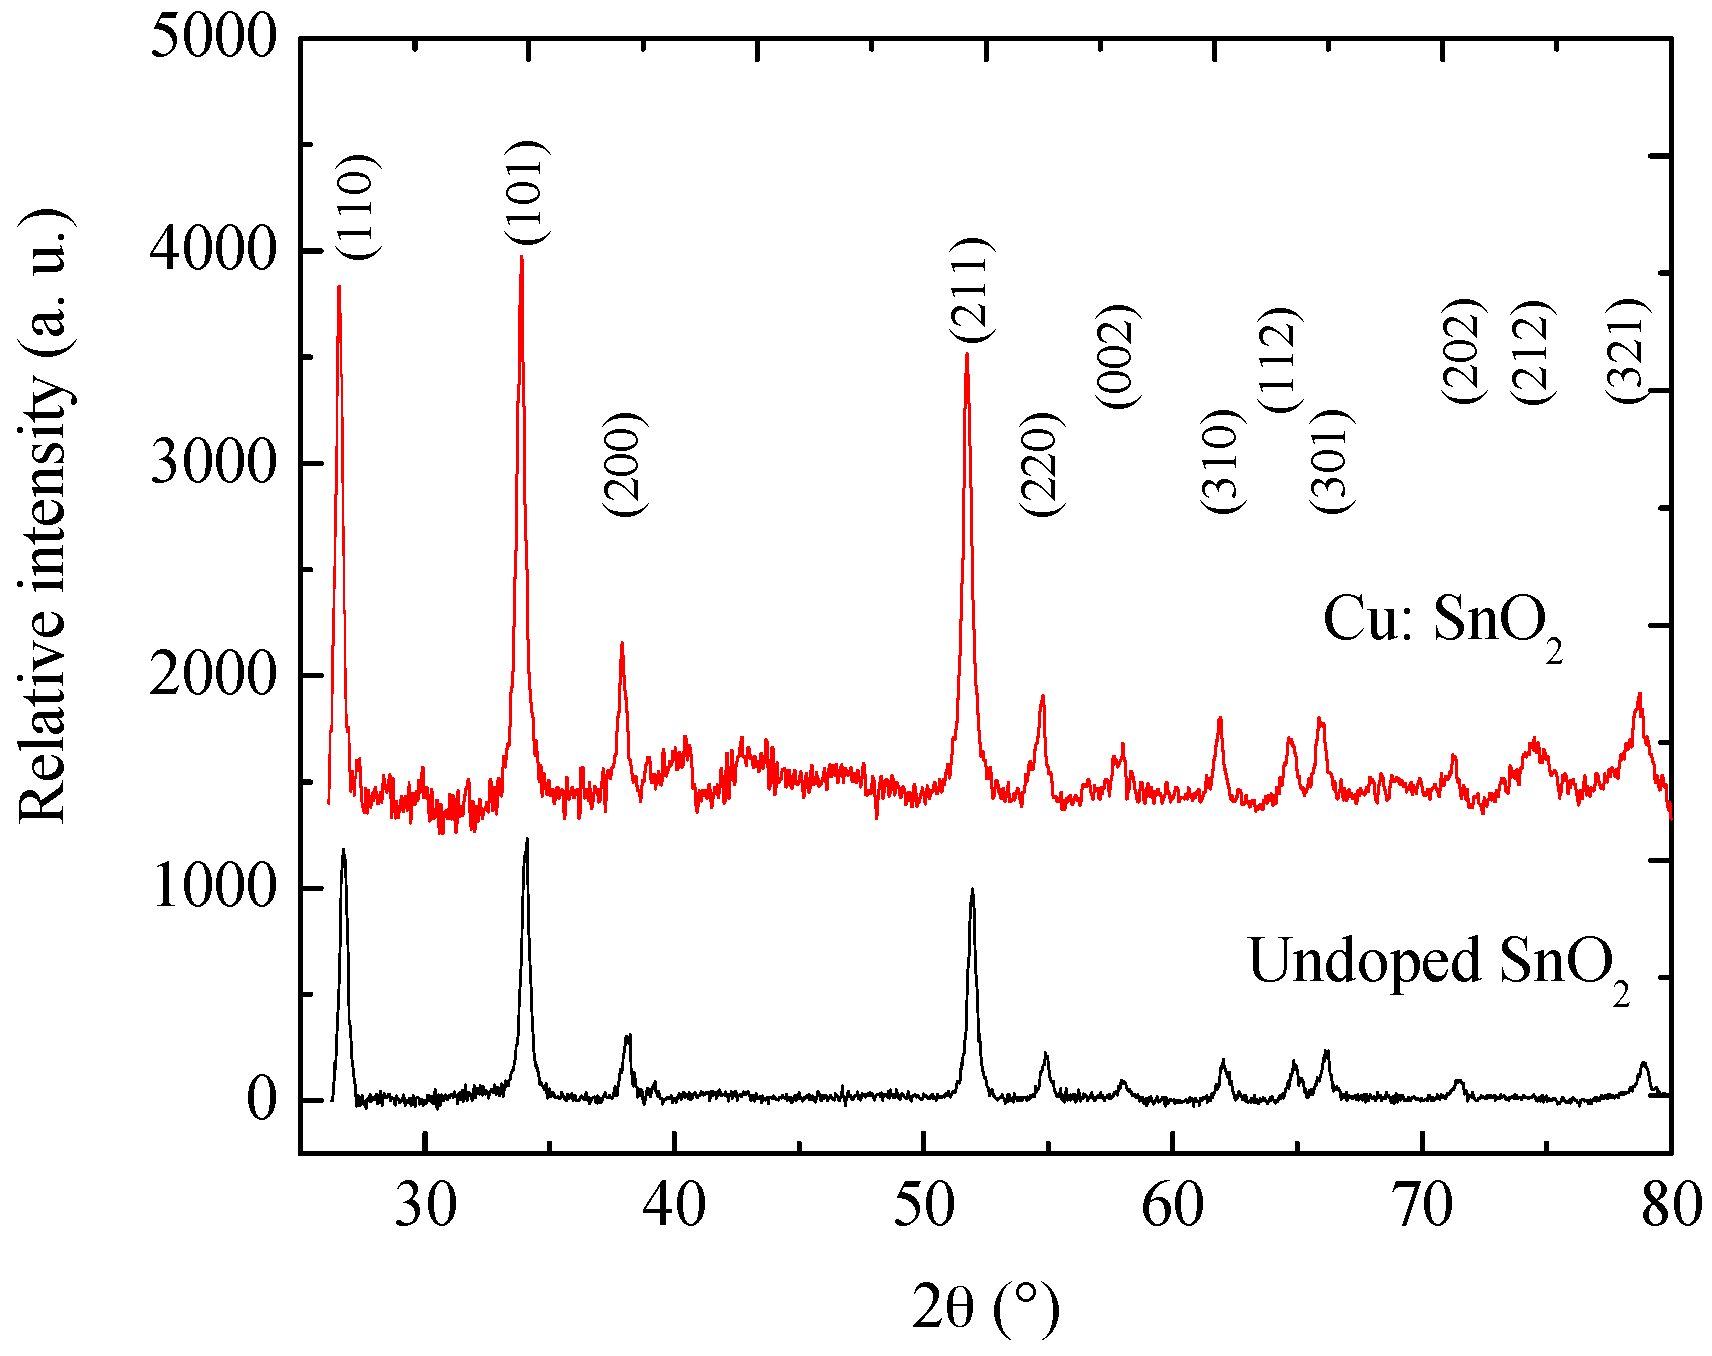
4.1. X-ray Diffraction Analysis
In this work, pure and Cu-incorporated SnO
2 nano-crystals were synthesized.
Figure 2 depicts the XRD patterns obtained for the pure and Cu-incorporated SnO
2 powders. For both pure and incorporated SnO
2 powders, the signal associated with (110), (101), and (211) planes prevailed over the rest of the encountered reflections, although slightly higher in the (200), (220), (002), (310), (112), (301), (202), (212) and (321) signals that were observed for the Cu-incorporated SnO
2 films. However, the peak intensities represent the quantity of powders during the measurement. Additionally, it is evident that all of these peaks exhibit the pure tetragonal rutile phase of SnO
2, according to JCPDS Card 077-0450 [
13]. All pure and incorporated calcined powders synthesized showed a well-defined crystallinity, and no other peaks, like Sn, SnO, Sn
2O
3, Sn
3O
4, or products related to Cl (which confirms the removal of Cl during the centrifugation) can be identified; therefore, mono-phase, pure SnO
2 powders are synthesized. Additionally, in the case of Cu-incorporated SnO
2 powders, no other Cu or oxides of Cu peaks were observed in the patterns. This may be due to the utilization of a low amount of metallic ions during incorporation (1 wt %).
From
Figure 2 it is observed that the XRD peak intensities of the incorporated powders show an upper shift in the peak positions compared to those of pure powders. In general, the peak intensity depends on two factors: one is the quantity of powder utilized during the analysis and another is lattice structure discrepancies [
14]. Since Cu has a comparable ionic radius as Sn, the replacement of Sn with Cu and the ball milling process resulting in a compressive strain in the lattice, which would have caused an upper shift in the XRD peaks for the Cu-incorporated SnO
2 powders. In order to ascertain the effect of Cu on the structural characteristics, crystallite size (D), lattice constants (a and c), crystal volume (V), porosity (P) [
15], and texture coefficient (T
C(hkl)) were calculated by using Equations (2)–(7) and reported in
Table 1:
whereas λ is the wavelength of incident X-ray (λ = 0.15418 nm), β is full width at half maximum (FWHM) intensity, θ is the Bragg’s diffraction angle in radians, a and c are lattice parameters, m and v are the mass and volume of the samples, n is the number of molecules per unit cell, M is the molecular weight, and N is Avogadro’s number.
The preferred orientation of SnO
2 crystal planes can be quantitatively evaluated using the texture coefficient, T
C (hkl), which has been determined from expression [
16], shown in Equation (7), whereas I (hkl) is the relative intensity of a plane (hkl), and I
O (hkl) is the standard intensity of the plane (hkl) taken from the JCPDS data [
13]. T
C (hkl) = 1 implies that the sample presents random crystallites; whereas T
C values lower than 1 means that there are an lack of grains oriented with that (hkl) direction.
By comparing
Table 1 and
Figure 2, we observe a minute increment in the lattice parameters and crystallite size of Cu-incorporated SnO
2 powders compared to the pure powders. This can explain the lack of any peak shifts in the XRD patterns. This increase is due to the increase in the ionic radii of the catalyst. In case of Cu, as it replaces a Sn atom due to it its higher ionic radius, the crystal distance increases which, in turn, increases the lattice parameters of the unit cell, crystallite size and, further, the volume. An increase in the volume theoretically decreases the density of the particles on the surface, which results in a porous surface. From
Table 1 we can observe that the porosity value was increased around 40% for Cu-incorporated SnO
2. In general, with the increase in the porosity the sensitivity of a gas sensor also increases.
Additionally, T
C values calculated for the maximum peak emission, which correspond to the orientation (101) of SnO
2,
Table 1, it is observed that the values of T
C (101) for both Cu-incorporated and undoped SnO
2 are less than 1, which means that the orientation (101) is not preferential and Cu-incorporated SnO
2 powders show lesser T
C (see
Table 1) compared to pure SnO
2 powders, which confirms that Cu incorporation worsens the crystallinity. In addition to porosity, particle size, surface morphology, and measuring temperature sensitivity also depend on crystallinity.
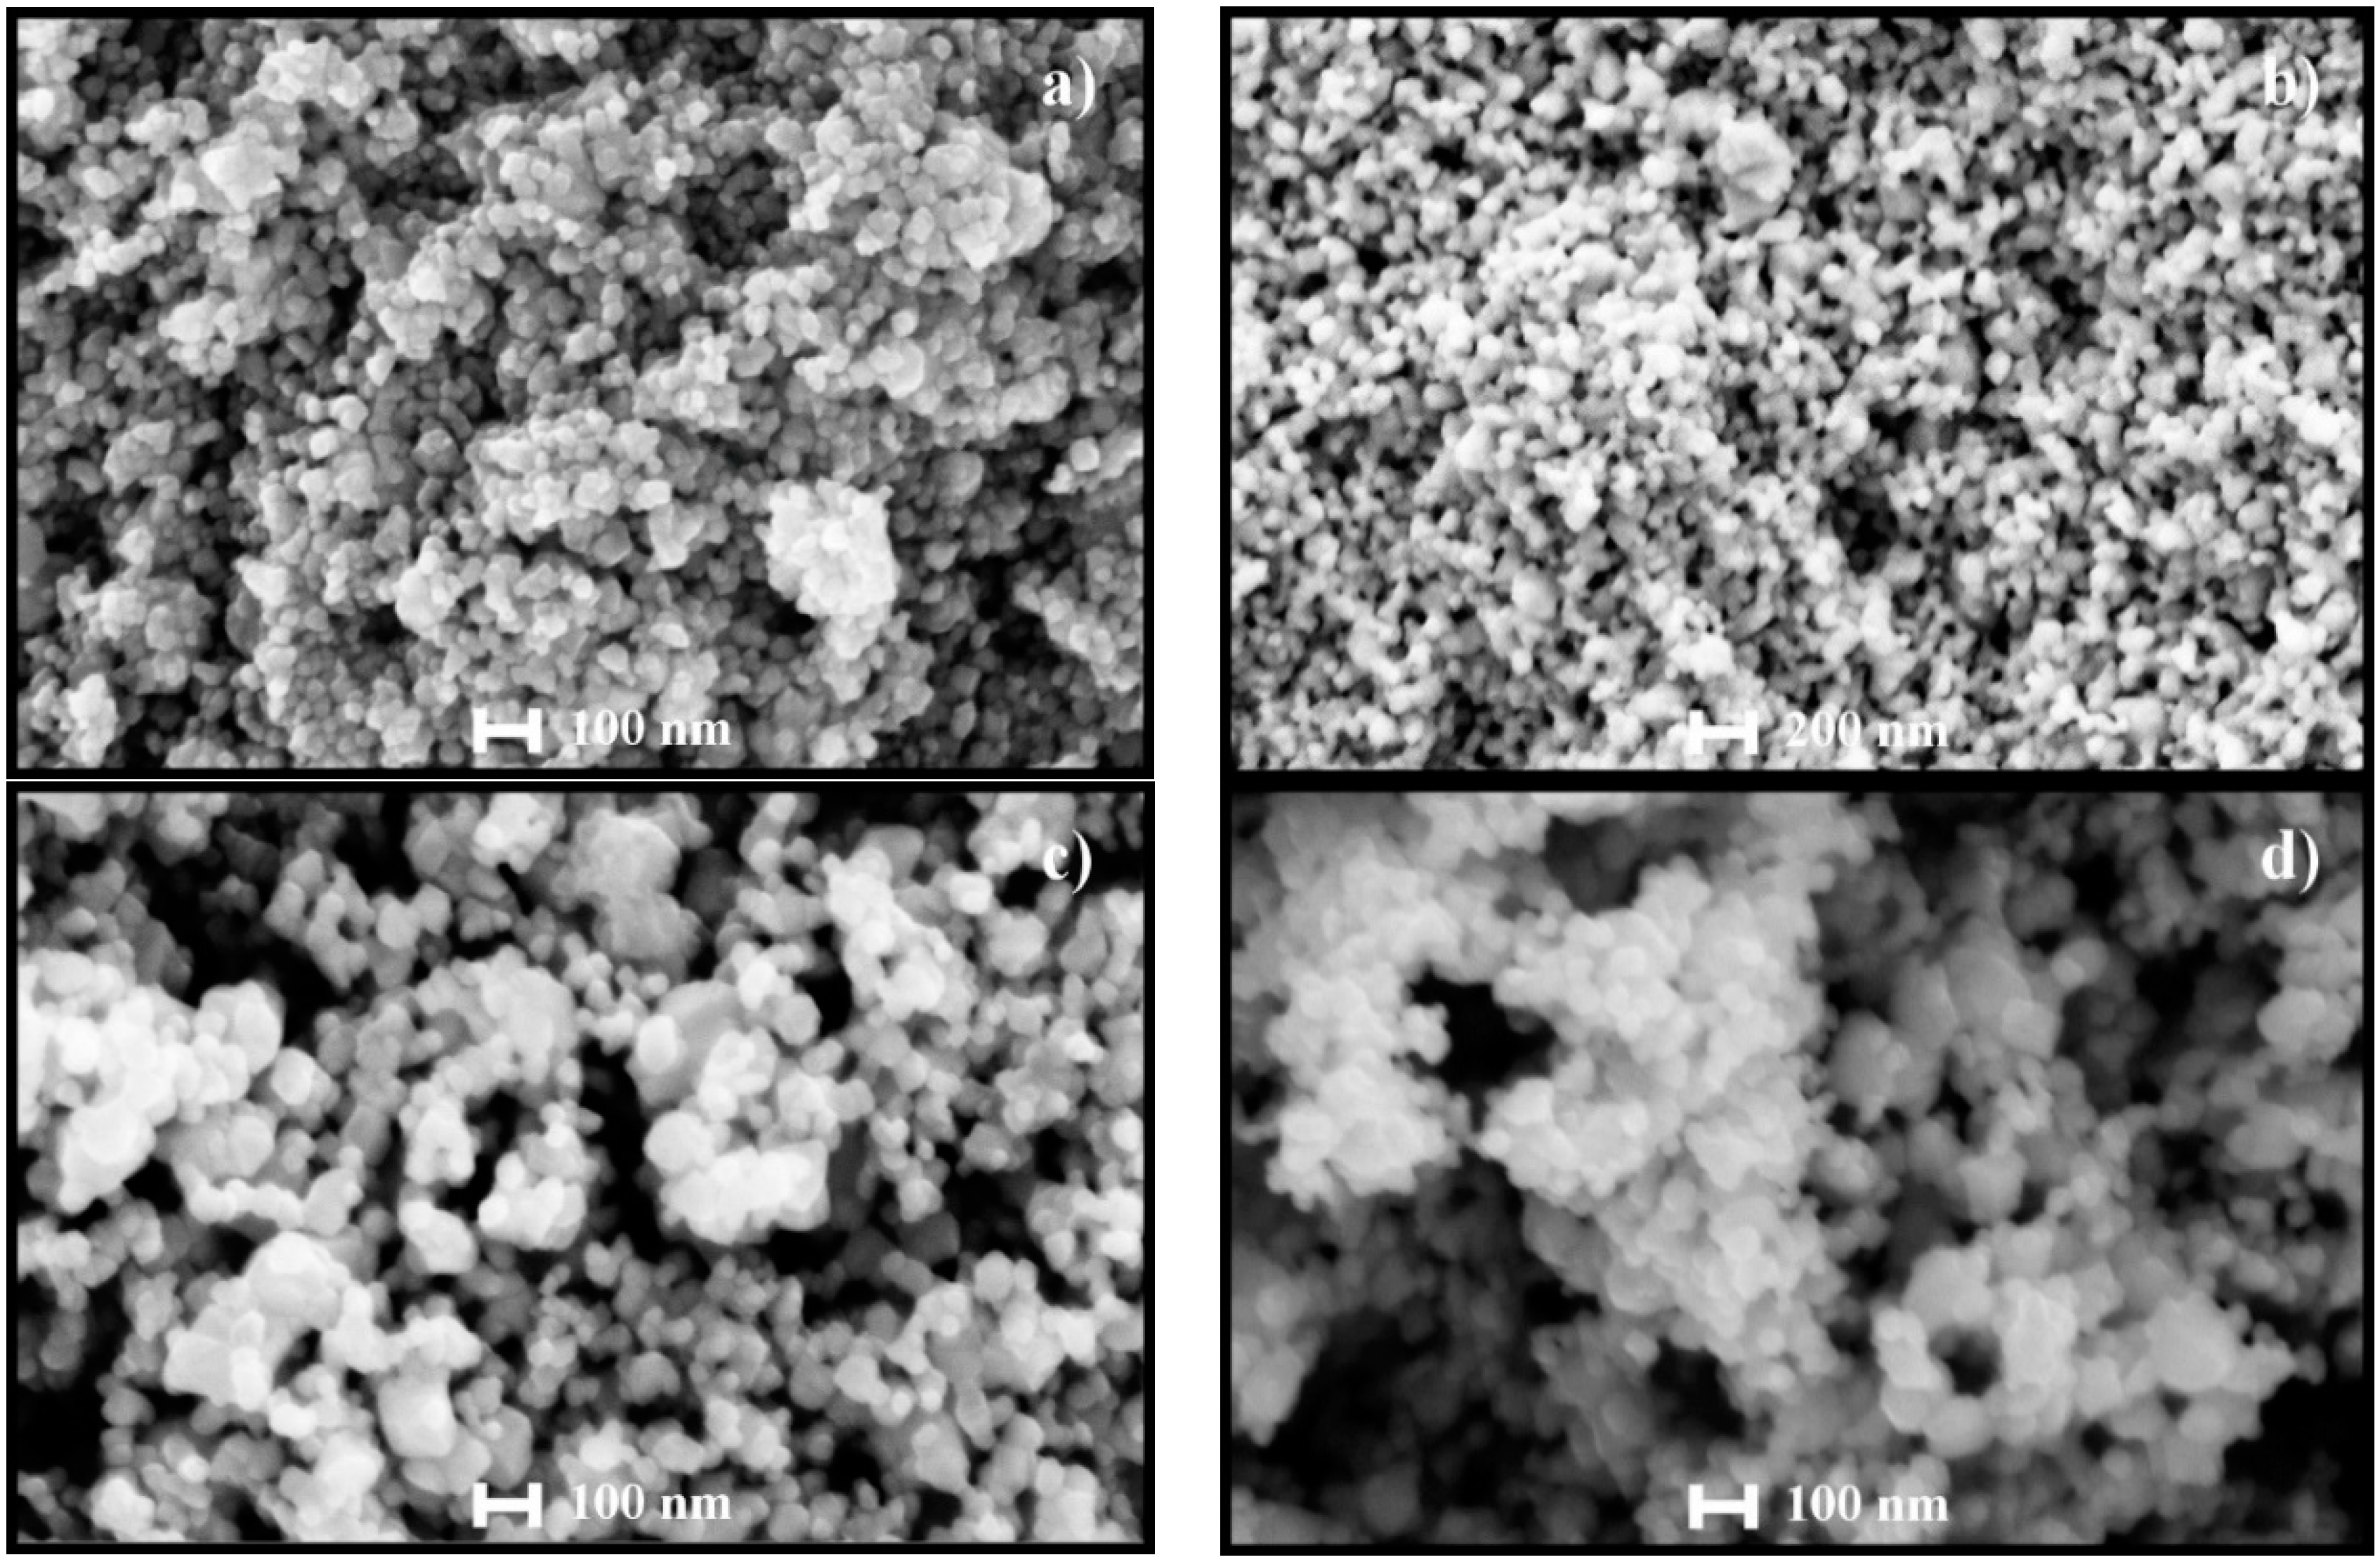
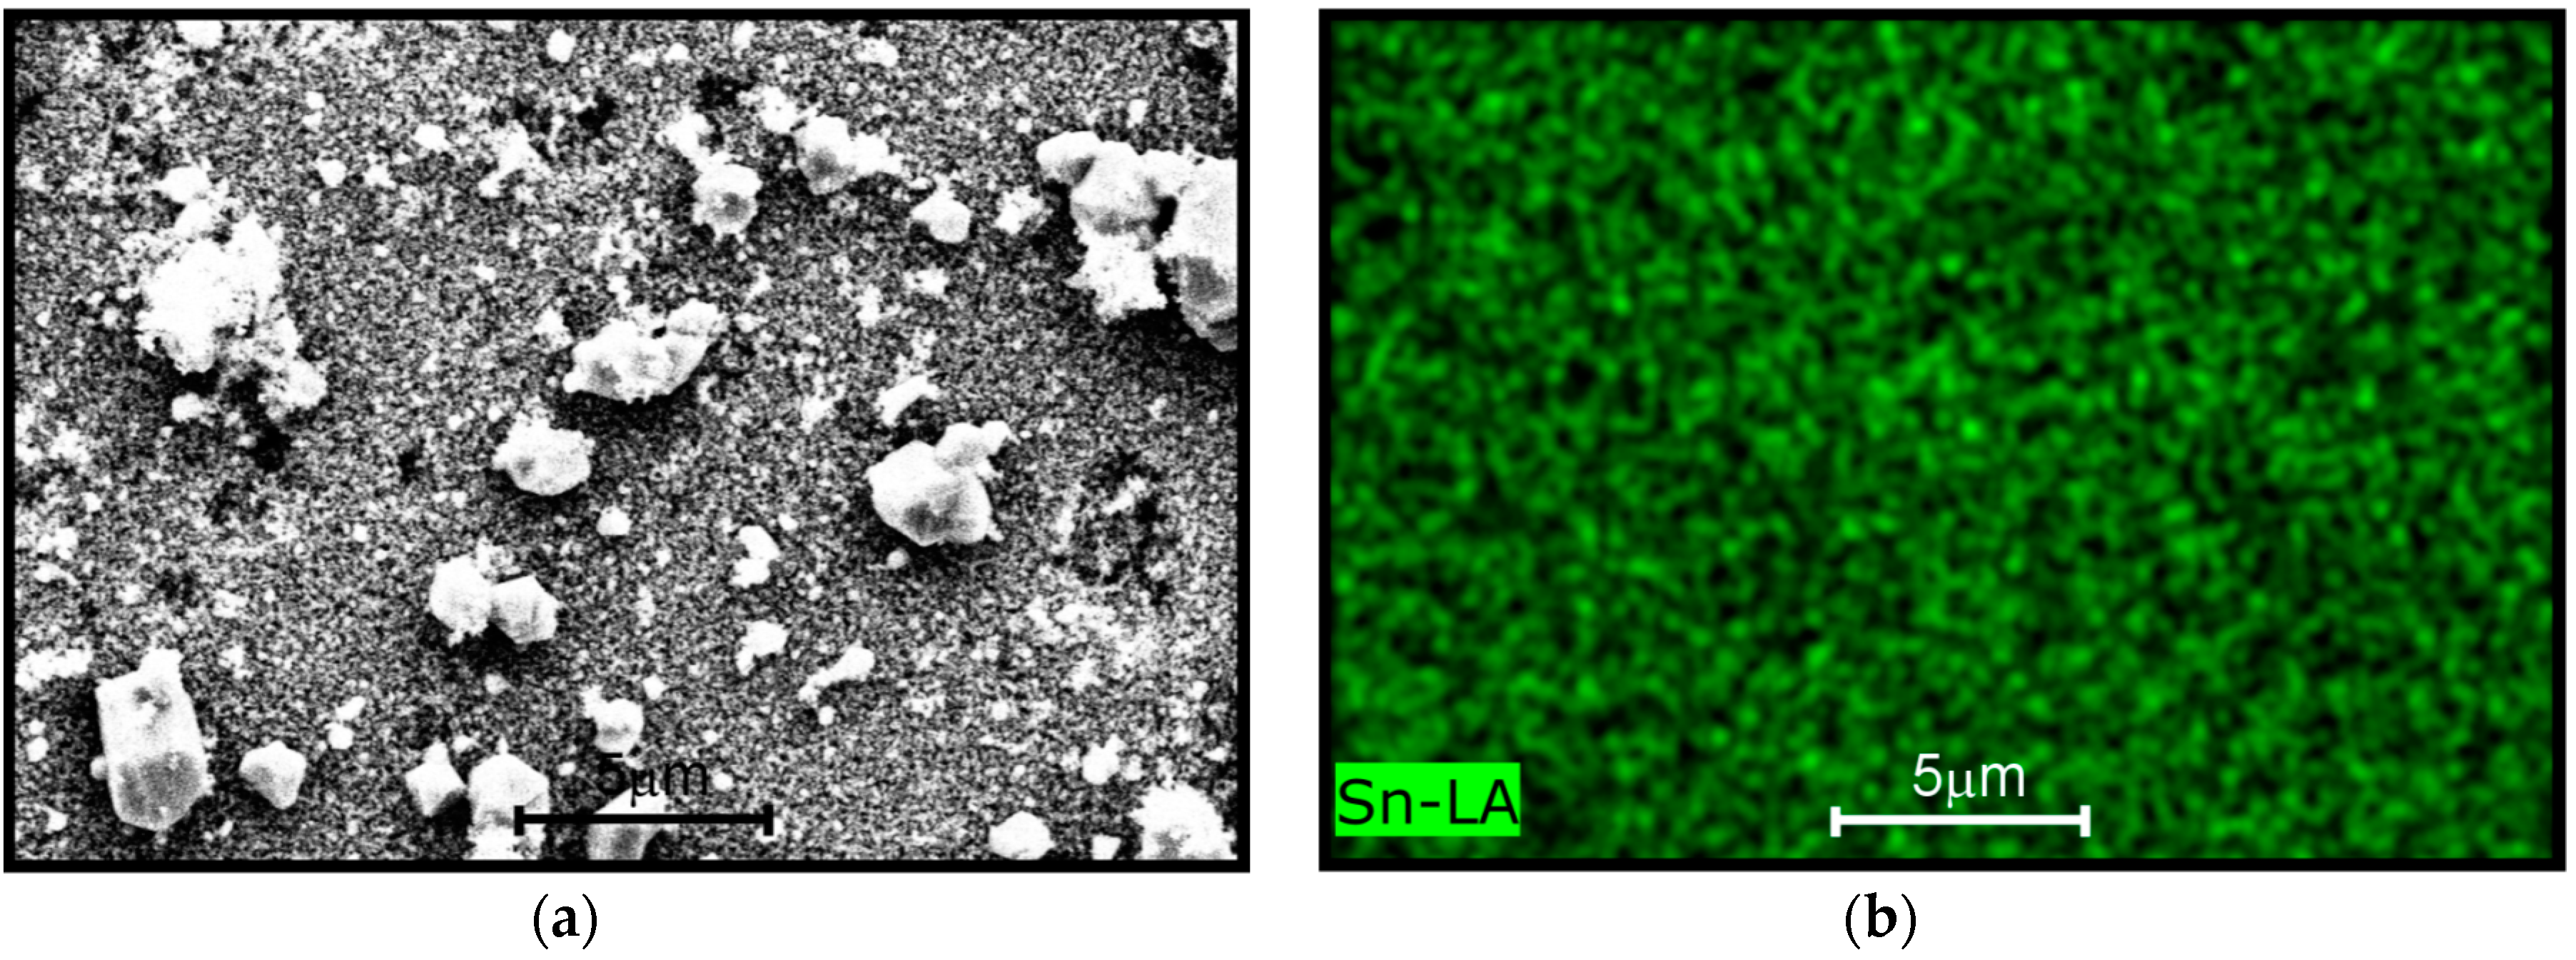
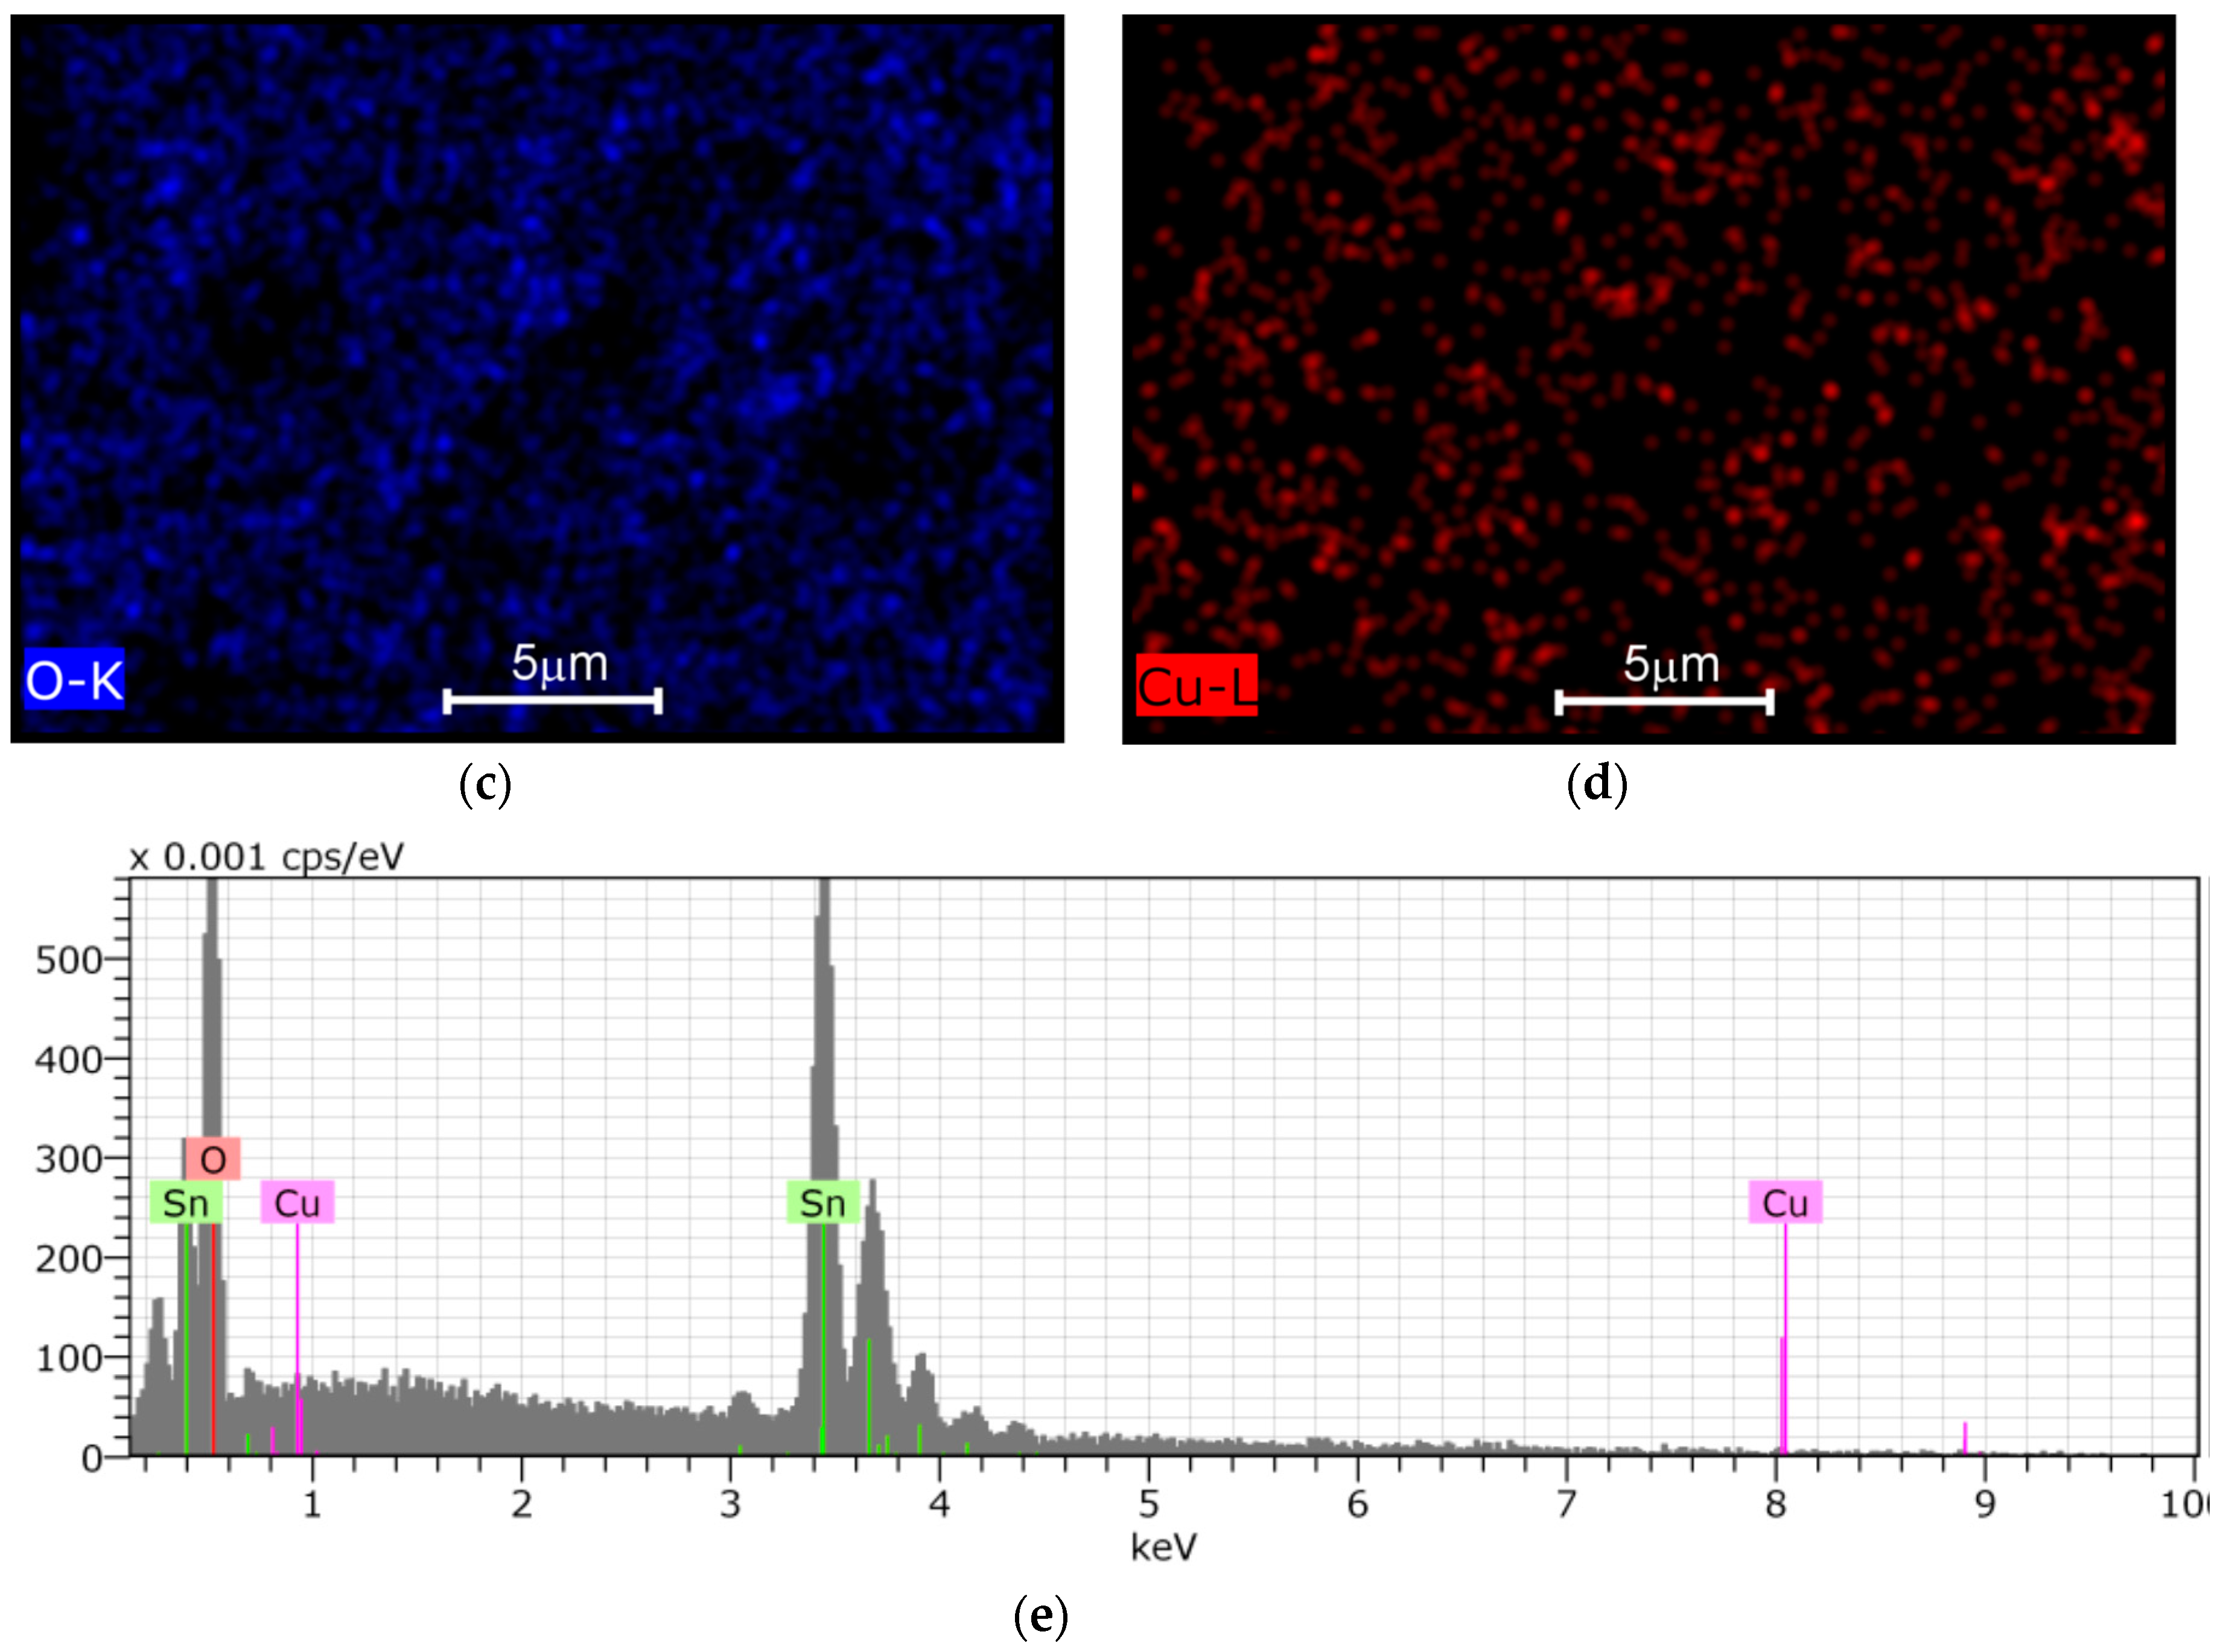
4.2. SEM Analysis
The surface morphology of the pure and Cu-incorporated SnO
2 powders, with respect to the effect of ball milling, is shown in
Figure 3.
Figure 3a,b correspond to pure SnO
2 powders, before and after ball milling, respectively. From these micrographs we can observe that, the powders before ball milling consists of agglomerated small particles, most of which are smaller than 50 nm. However, the powders after the ball milling consist of particles with sizes around 100 nm, with the exception of some particles as small as 50 nm in diameter. This increase in the particle size is due to the solid state reactions of SnO
2 species, promoted by the heat produced in the jar during the high energy grinding process. We also observe that, for the ball-milled powders, all particles were connected to each other through neck formation. During the ball milling process, the heat produced in the jar acts as an additional heat treatment process. As the particle size reduces during the milling process, the smaller particles have higher driving forces to transfer the atoms in the solid state, which results in the formation of the necks between the particles [
17]. According to Weaver et al. [
17], the surface atoms of a particle gain the kinetic energy with the additional heat treatment, therefore, particles primarily adhere to each other and finally result in the formation of the necks. The neck formation is a good sign for the gas sensitivity, because the necks act as channels between particles to increase the conductivity of the pellet.
Figure 3c,d reveal the morphology of the Cu-incorporated SnO
2 powders. Primarily, the particle size has increased slightly compared to the pure powders, in both milled and un-milled powders. This is in good agreement with the theoretically-calculated crystallite sizes of the pure and incorporated powders from the XRD data (refer to
Table 1). The particle size obtained was around 30–80 nm for the incorporated powders. We can also observe that there is neither particle size change nor the neck formation, like in pure powders, after the ball milling. Since we have employed chemical doping methods to incorporate Cu, in which the additives are added during the synthesis process, they can be incorporated into the lattice or reside on the surface of metal oxide [
10]. An inhibition of the coalescence for Cu-incorporated powders is observed. The catalysts reside on the surface and further inhibit the particle size and further coalescence [
18].
Another important detail observed from
Figure 3 is that the incorporated powders are more porous compared to the pure powders. Due to incorporation or presence of catalysts on the surface, the particle size and porosity are increased. More porous structures facilitate the gas to interact with 2–3 monolayers of the pellet, which results in higher sensitivity of the pellets. In order to have detailed structural analysis of the Cu incorporation, HRTEM analysis was performed.
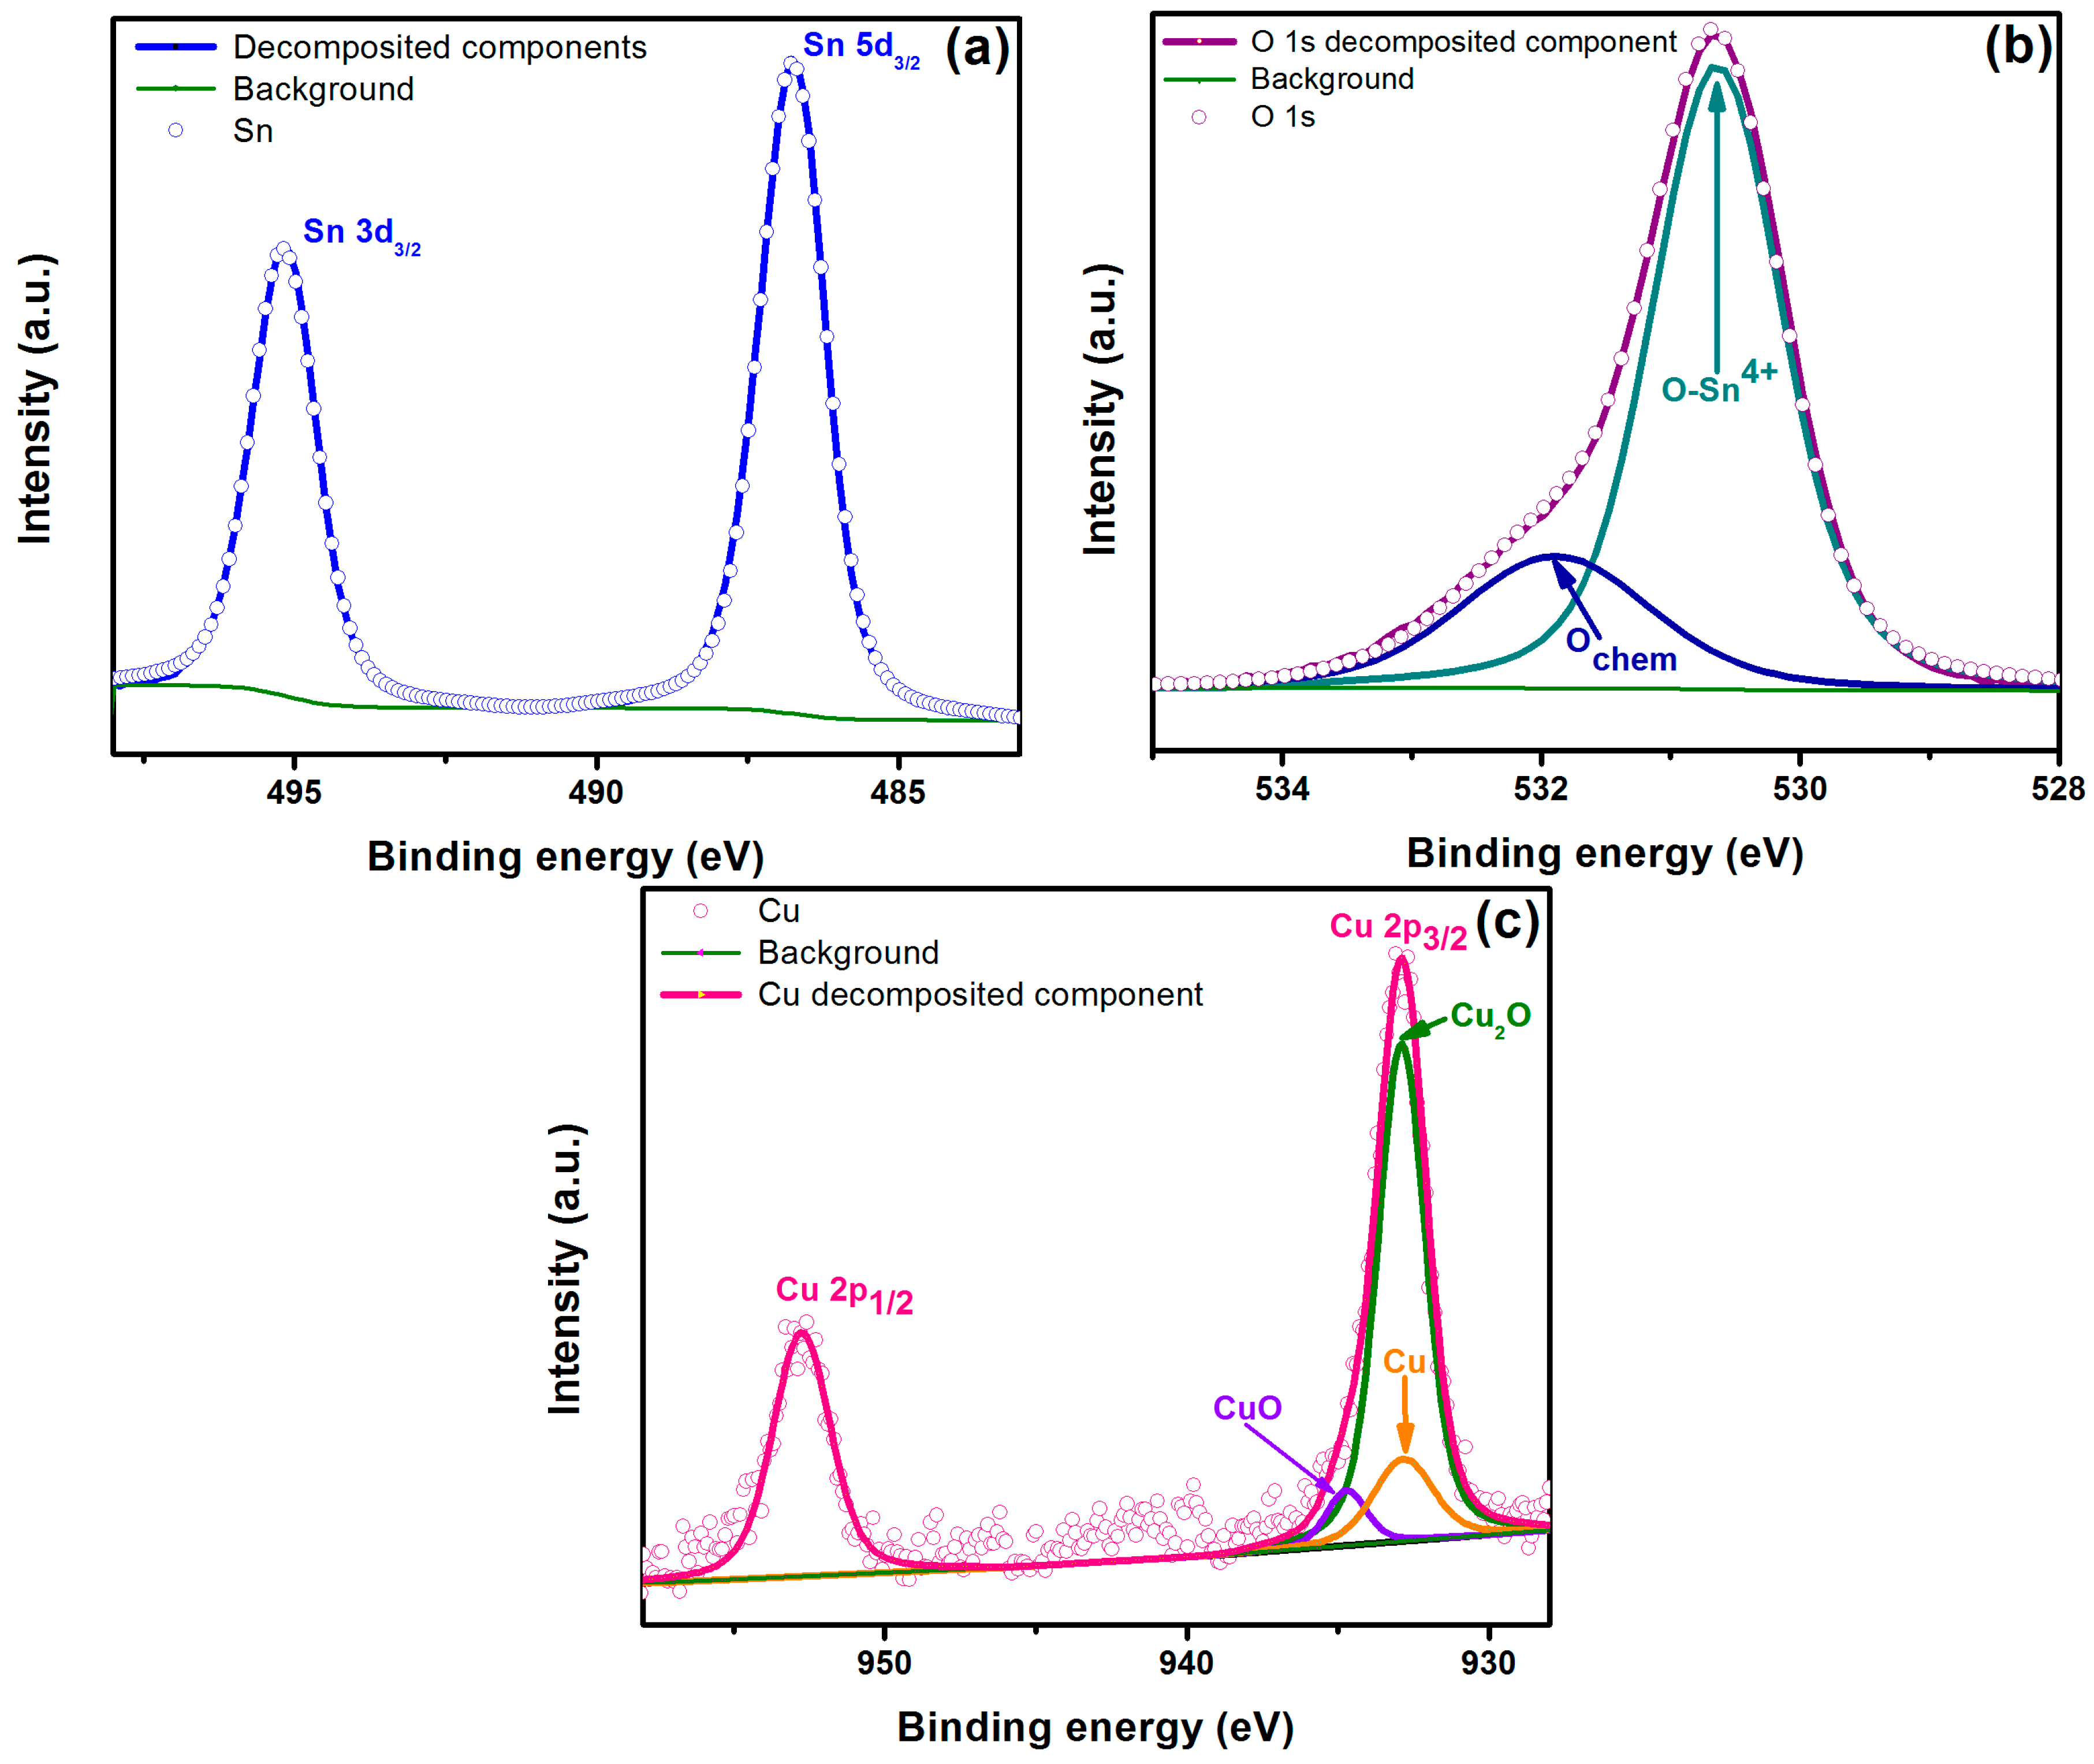
4.4. XPS Analysis
To gain more insight into the chemical composition of the dopant in Cu:SnO
2 powders, we also carried out XPS measurements on the fabricated Cu:SnO
2 pellets. The two strong peaks at around 486.5 and 495 eV displayed in
Figure 5a can be attributed to Sn 3d3/2 and 3d5/2, respectively [
19]. In
Figure 5b the XPS O1s line of a Cu:SnO
2 pellet is presented. In this case, the primary spectrum of the XPS O1s peak shows that it is wide, asymmetrical, and exhibits an evident shoulder at the high binding energy side of the spectrum, which confirms the components corresponding adsorbed oxygen or hydroxide (OH) components resulted due to the precursors utilized [
20]. The Cu 2p peak in the XPS spectrum is shown in
Figure 5c; the two peaks centered at 933.5 and 953.2 eV were assigned to Cu 2p3/2 and Cu 2p1/2 of Cu
2O, respectively, and the three smaller peaks, obtained by deconvolution of the major peak Cu 2p3/2, appearing at 932.7, 932.8, and 952.2 eV correspond to Cu
2O, Cu, and CuO [
21]. The curve fit results of the Cu 2p core level XPS measured on the surface of the pellet reveal that the predominant phase was Cu
2O, constituting about 80% on the surface. During the sensing measurements, at higher temperatures Cu
2O changes to Cu or CuO when reacted with CO or O (refer Equations (8) and (9), respectively). During the decrease in the temperature, CuO returns back to the Cu
2O phase due to the oxygen desorption (refer Equation (10)), whereas the Cu remains metallic, which is also confirmed by XPS (refer
Figure 5c) [
22].
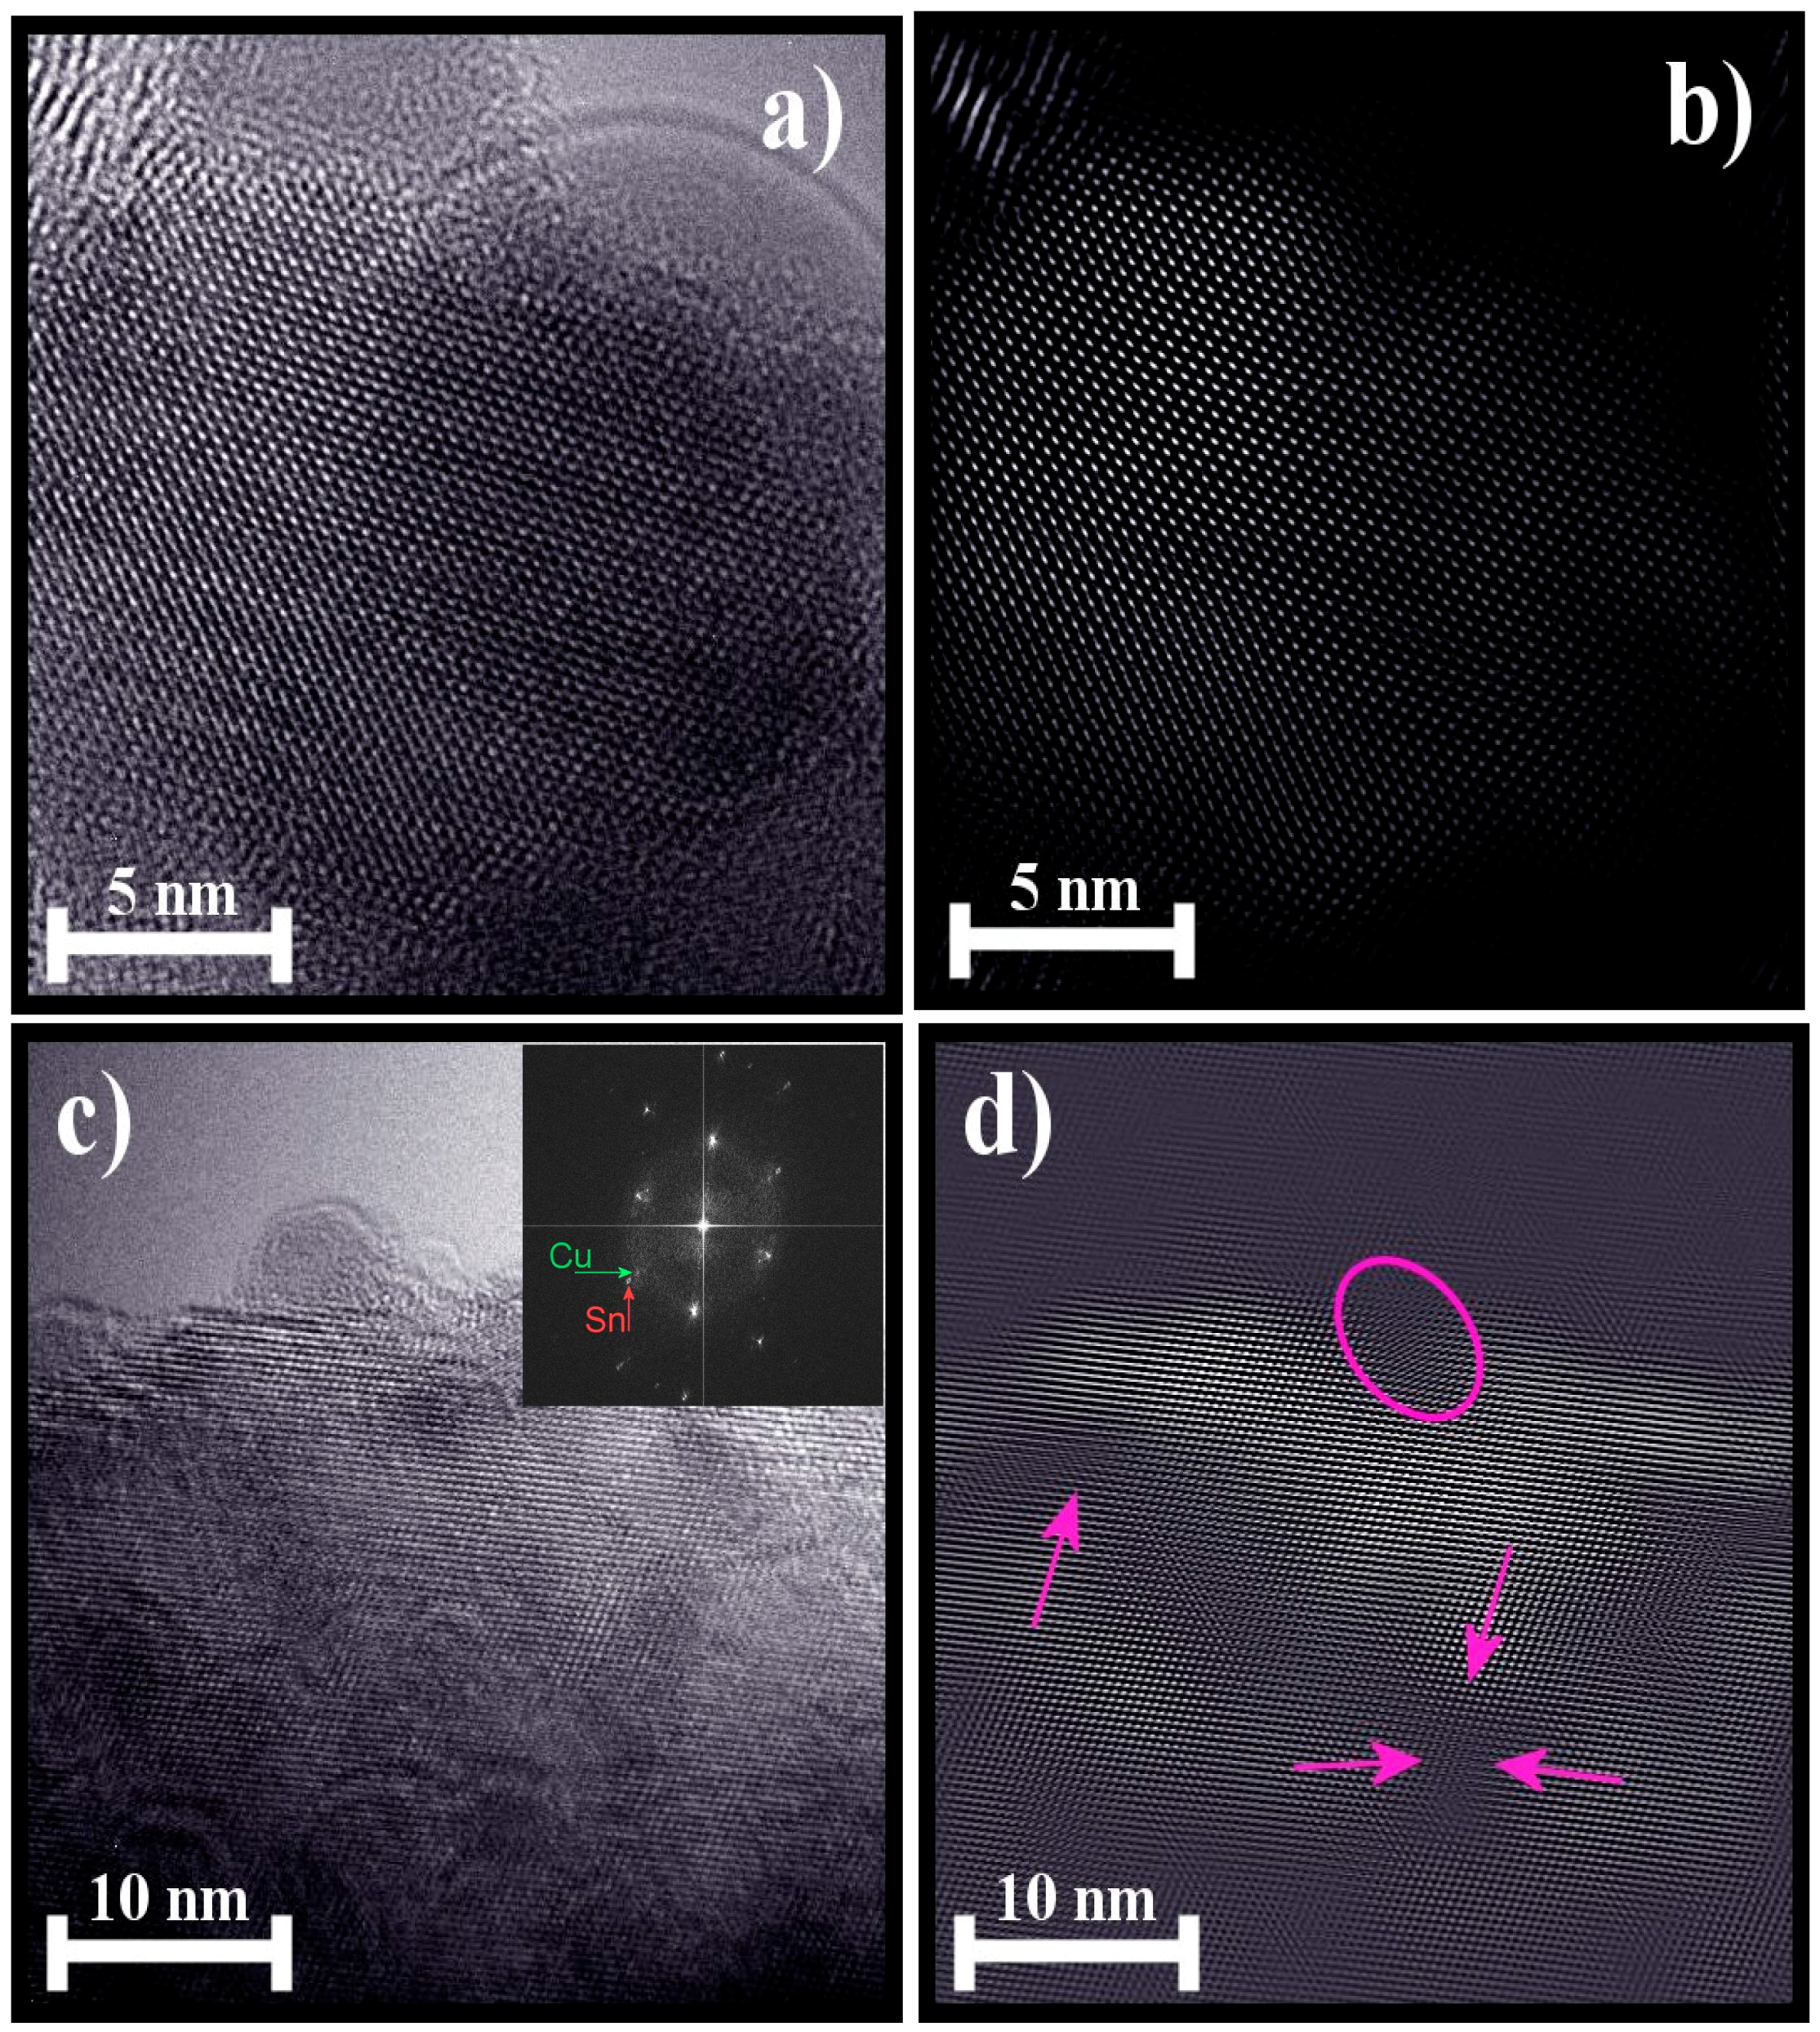
4.5. HRTEM Analysis
Figure 6a,c show the pure and Cu-incorporated SnO
2 particle surfaces, respectively. Their corresponding reconstructed images are show in
Figure 6b,d. The insets in
Figure 6a,c are the corresponding selected-area electron diffraction (SAED) patterns.
Figure 6a shows that all of the atomic planes were well defined without any discrepancies and correspond to SnO
2 crystal planes. The d-spacings measured from the reconstructed image (
Figure 6b) are in good agreement with those of the (110) plane of cassiterite SnO
2 (JCPDS Card 077-0450 card) [
13], corresponding to the tetragonal rutile crystal structure (space group = P42/mnm). From
Figure 6c, we can observe that various smaller particles around 5 nm were beneath the focused particle.
In order to observe more clearly the effect of the catalyst, the image is reconstructed by masking and shown in
Figure 6d. Localization of Cu on the surface (pink circle) and various stacking faults, like surface undulations (pink arrows), were highlighted in the reconstructed image (
Figure 6d). It is confirmed that some amount of catalyst (Cu) is localized on the surface of the SnO
2 particle. By considering the amount of catalyst (1 wt %) utilized, which is very low, a few identities of catalyst were observed. The inter-plane distance measured for the copper particle corresponds to the (111) plane of cubic Cu (JCPDS Card 00-004-0836) [
23].
Additionally, primarily, the (110) inter-plane distance is estimated to be 0.335 and 0.337 nm for the pure and Cu-incorporated powders, respectively. This increase in the lattice parameter suggests an increase of the unit cell volume for the incorporated powder. Secondarily, we can observe the copper undulations on the SnO2 crystal, which are highlighted with pink arrows. From these two factors, it can be considered that the Cu insertion in the host (SnO2) matrix is possible.
The precise position of copper’s presence is shown in the SEAD patterns (
Figure 6c inset). The estimated lattice spacing values from the HRTEM are in consistent with the calculated XRD data. Therefore, it can be stated from the HRTEM and XRD analysis that a part of the catalysts utilized were induced into the SnO
2 matrix and have created stacking faults like undulations in the SnO
2 lattice, whereas small Cu clusters of catalyst, residing on the surface of the SnO
2 grains were also formed. SnO
2 crystals with a Sn excess can show defects as stacking faults. Electronic effects were produced due to Sn excess, which enhances the bulk conductivity and, subsequently, gas sensitivity [
24]. Additionally, the metal clusters assure the possibility of a spill-over mechanism of gas sensing [
25].
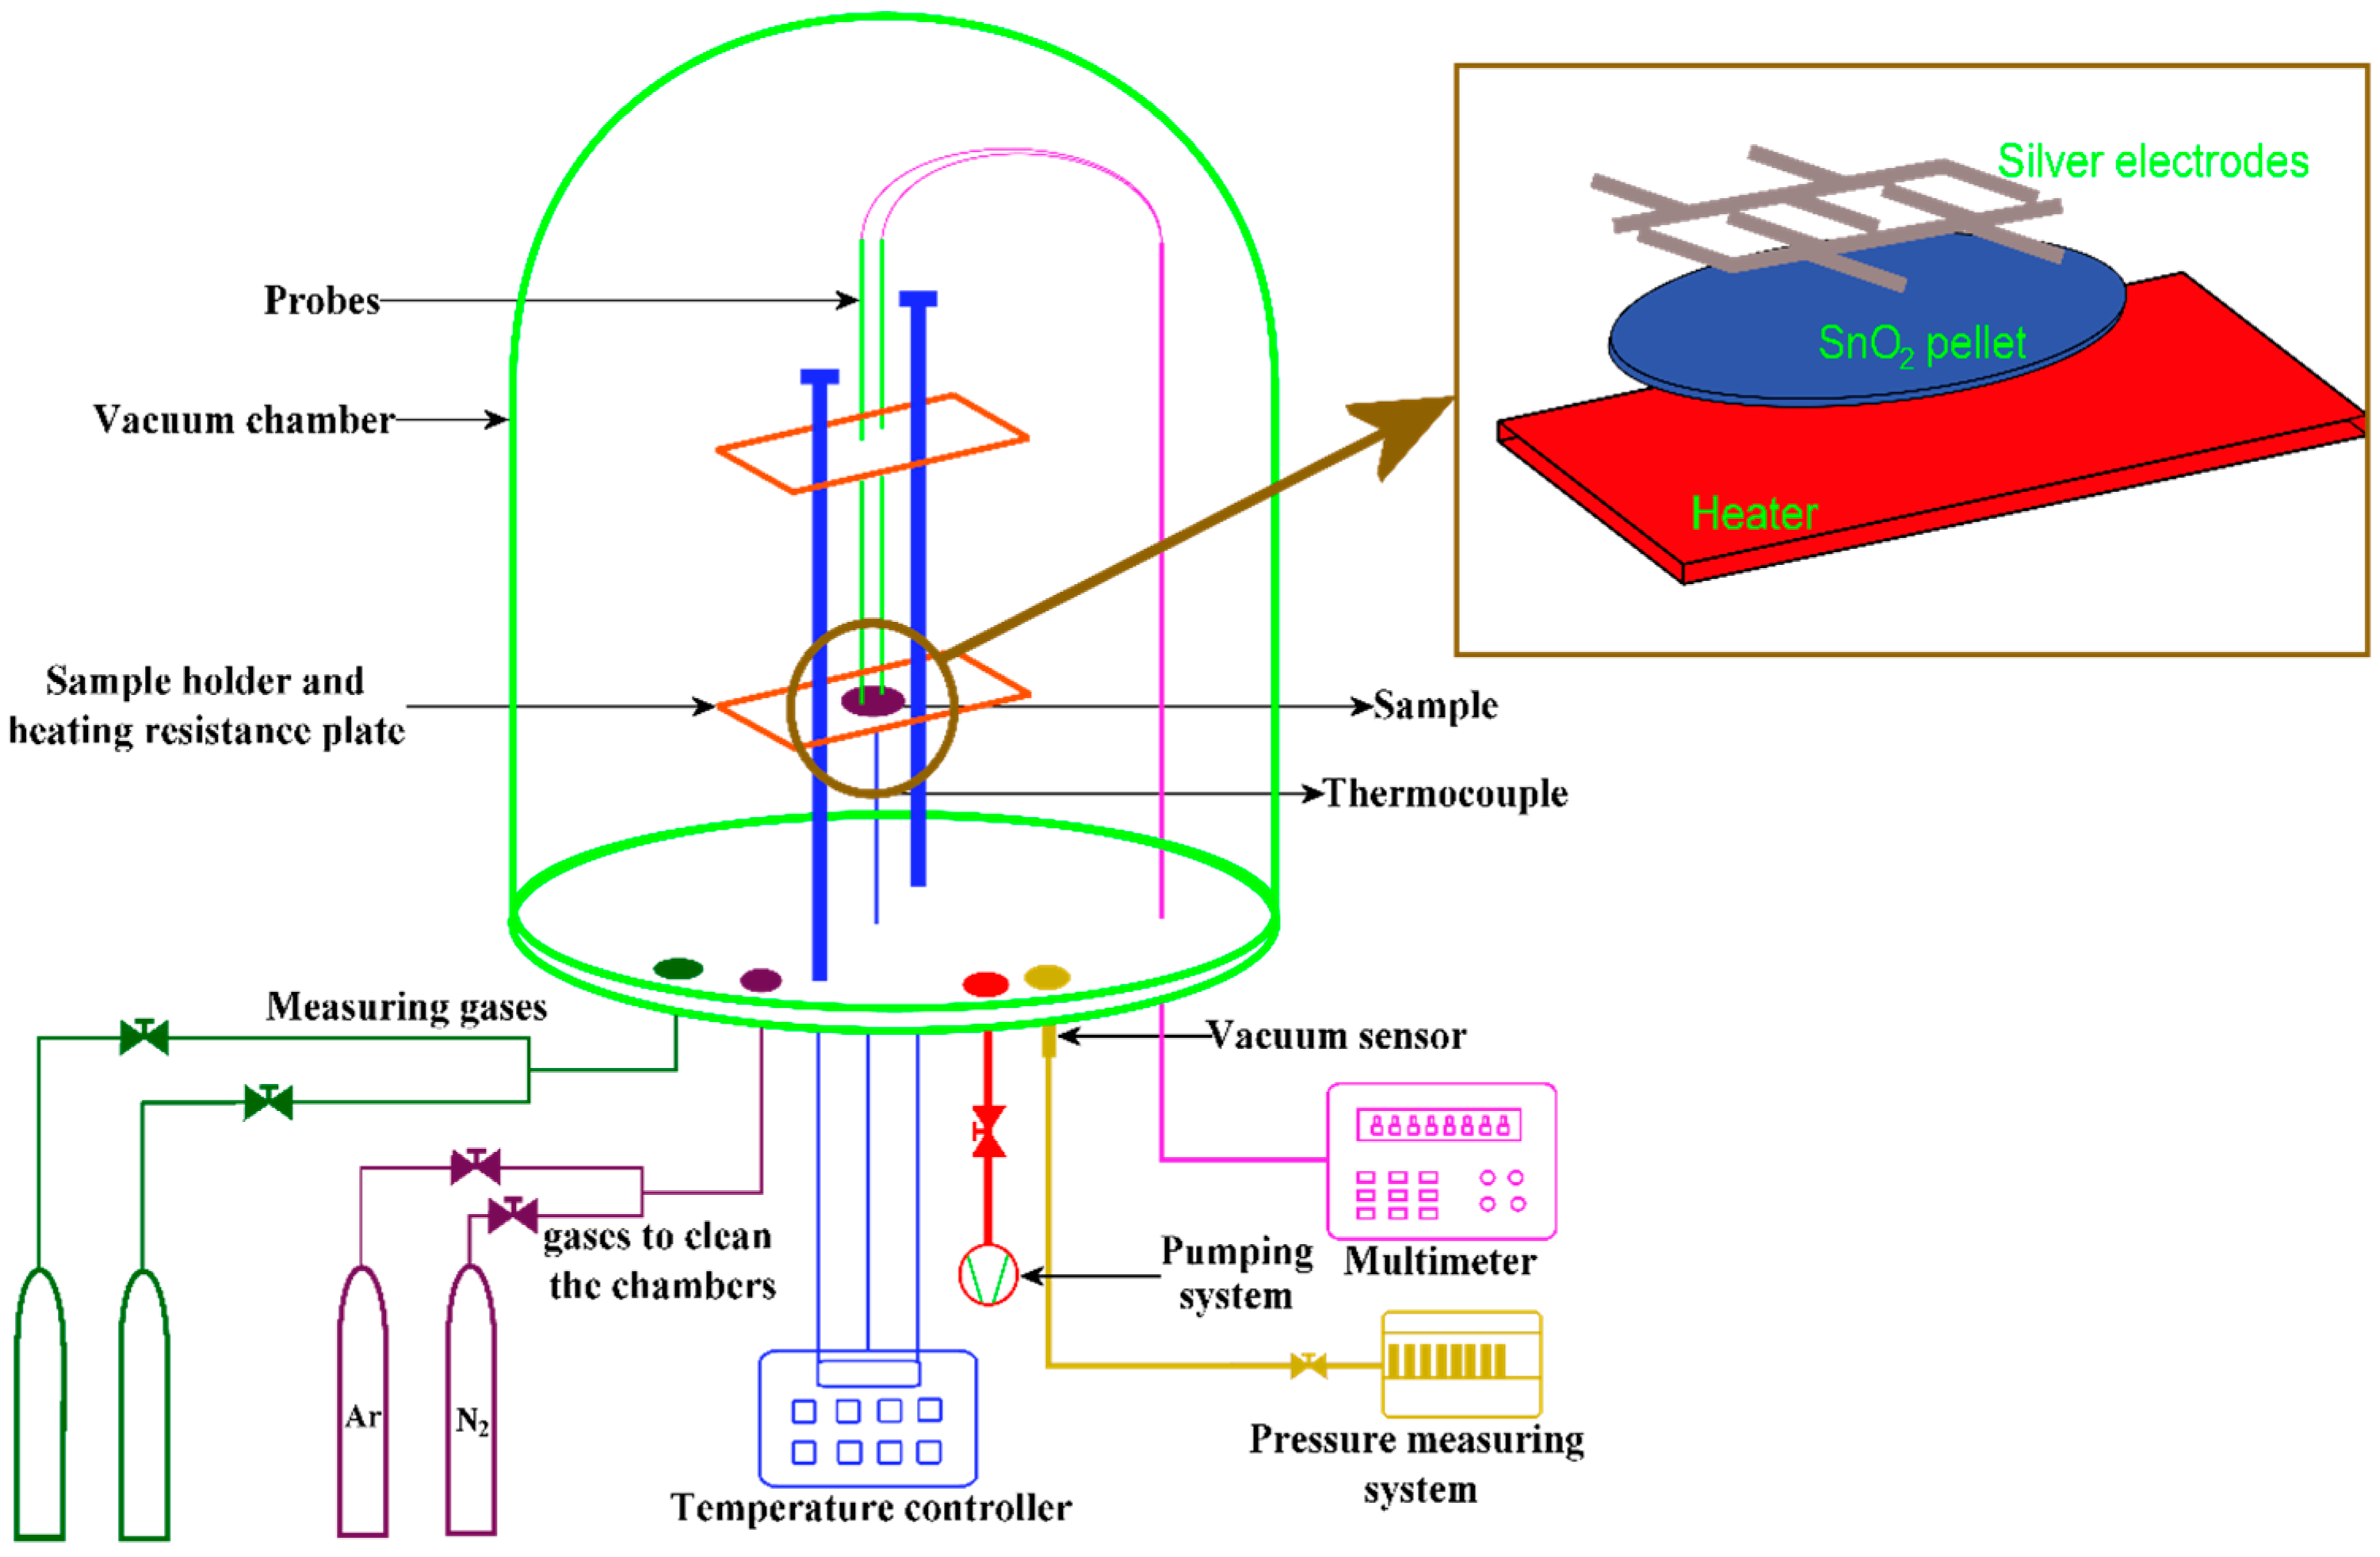
4.6. Gas Sensing Properties
In order to characterize the performance of the sensors composed of pure and Cu-incorporated SnO
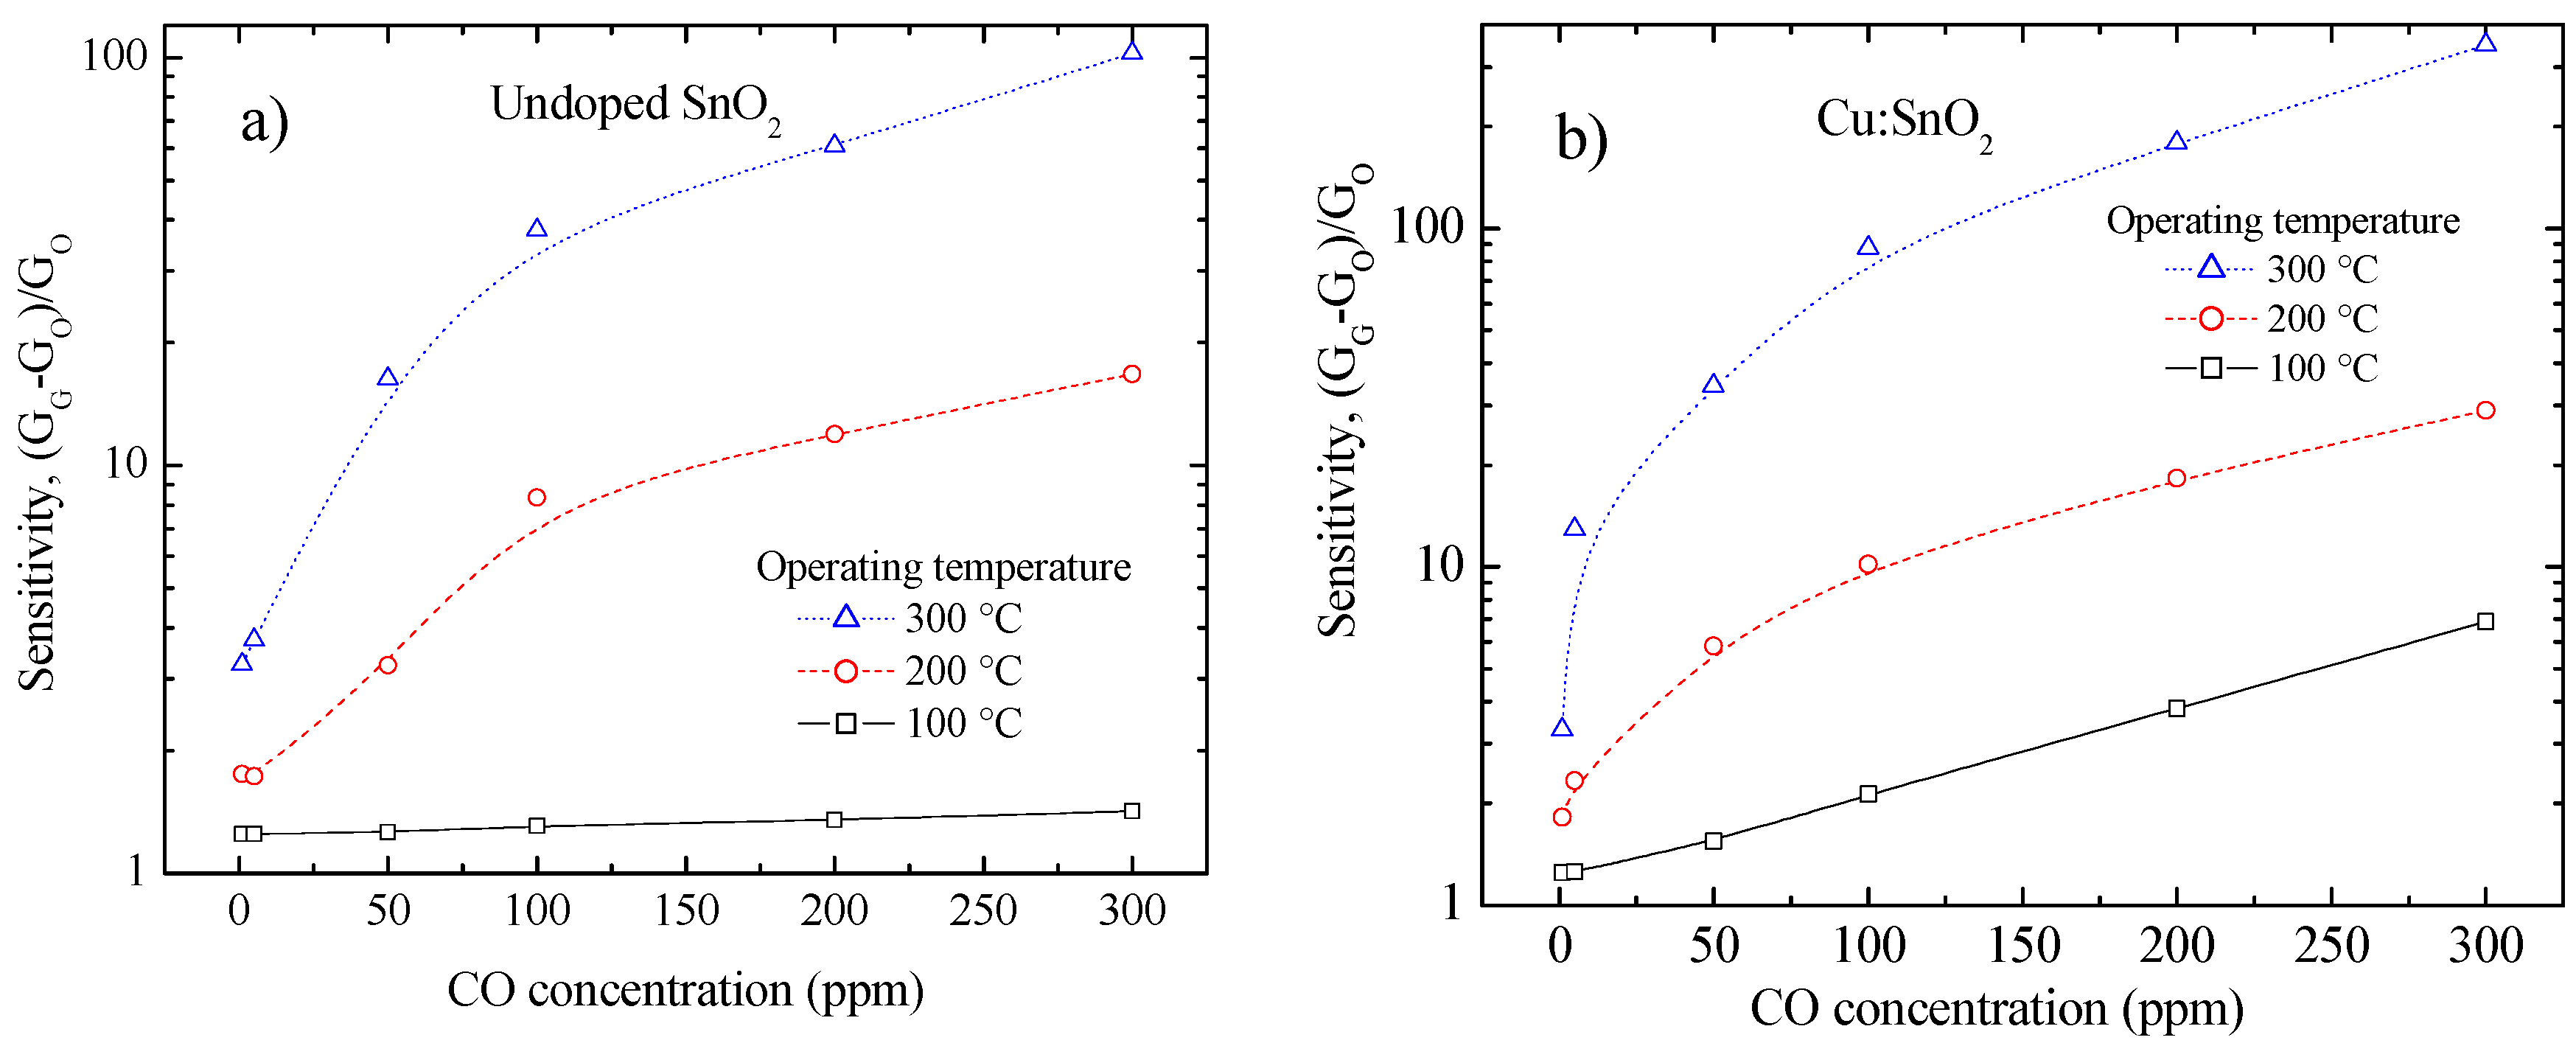
2 pellets, the sensors were exposed to a range of CO gas concentrations (0–300 ppm) at various temperatures (100, 200 and 300 °C).
Figure 7a,b show the typical sensor responses of pure and Cu-incorporated SnO
2 composites. The sensing behavior of both sensors was similar to that of a typical n-type oxide semiconductor (i.e., a decrease in electrical resistance by a reducing gas). The responses of both sensors monotonically increased with increasing CO gas concentration and temperature. Reaction of carbon monoxide molecules with adsorbed oxygen can be expressed in Equation (8) [
26]:
As the gas concentration increases, the number of molecules reacting with the surface increases, which increases the sensitivity [
27]. When the operating temperature of the gas sensor increases, the oxygen adsorbed is more reactive (O
− or O
2−) with the reducing gas, which increases the sensitivity [
28].
Notably, Cu-incorporated pellets exhibited greater sensing responses than the pure SnO
2 at all temperatures, even to very small amounts of CO (1 ppm). The maximum gas sensing response of pure and Cu-incorporated SnO
2 pellets were 102.5 and 348.4, respectively, to 300 ppm of CO gas at 300 °C (
Figure 7a,b). More association between the particles (refer
Figure 3) and the surface undulations (refer
Figure 6) have improved the surface conductivity and oxygen adsorption respectively of the incorporated pellets, which successively ensued in higher sensitivities than the pure pellets. Low temperature (at 100 °C) sensitivities were also obtained (refer to
Figure 7) for Cu-incorporated SnO
2 pellets, and such composite devices can be used as cost effective, VLSI-integrable CO
2 sensors, operational at relatively low temperatures.
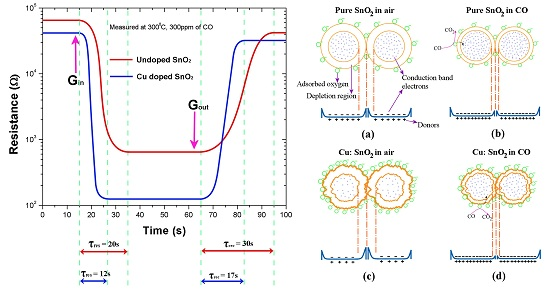
4.7. Response and Recovery Times
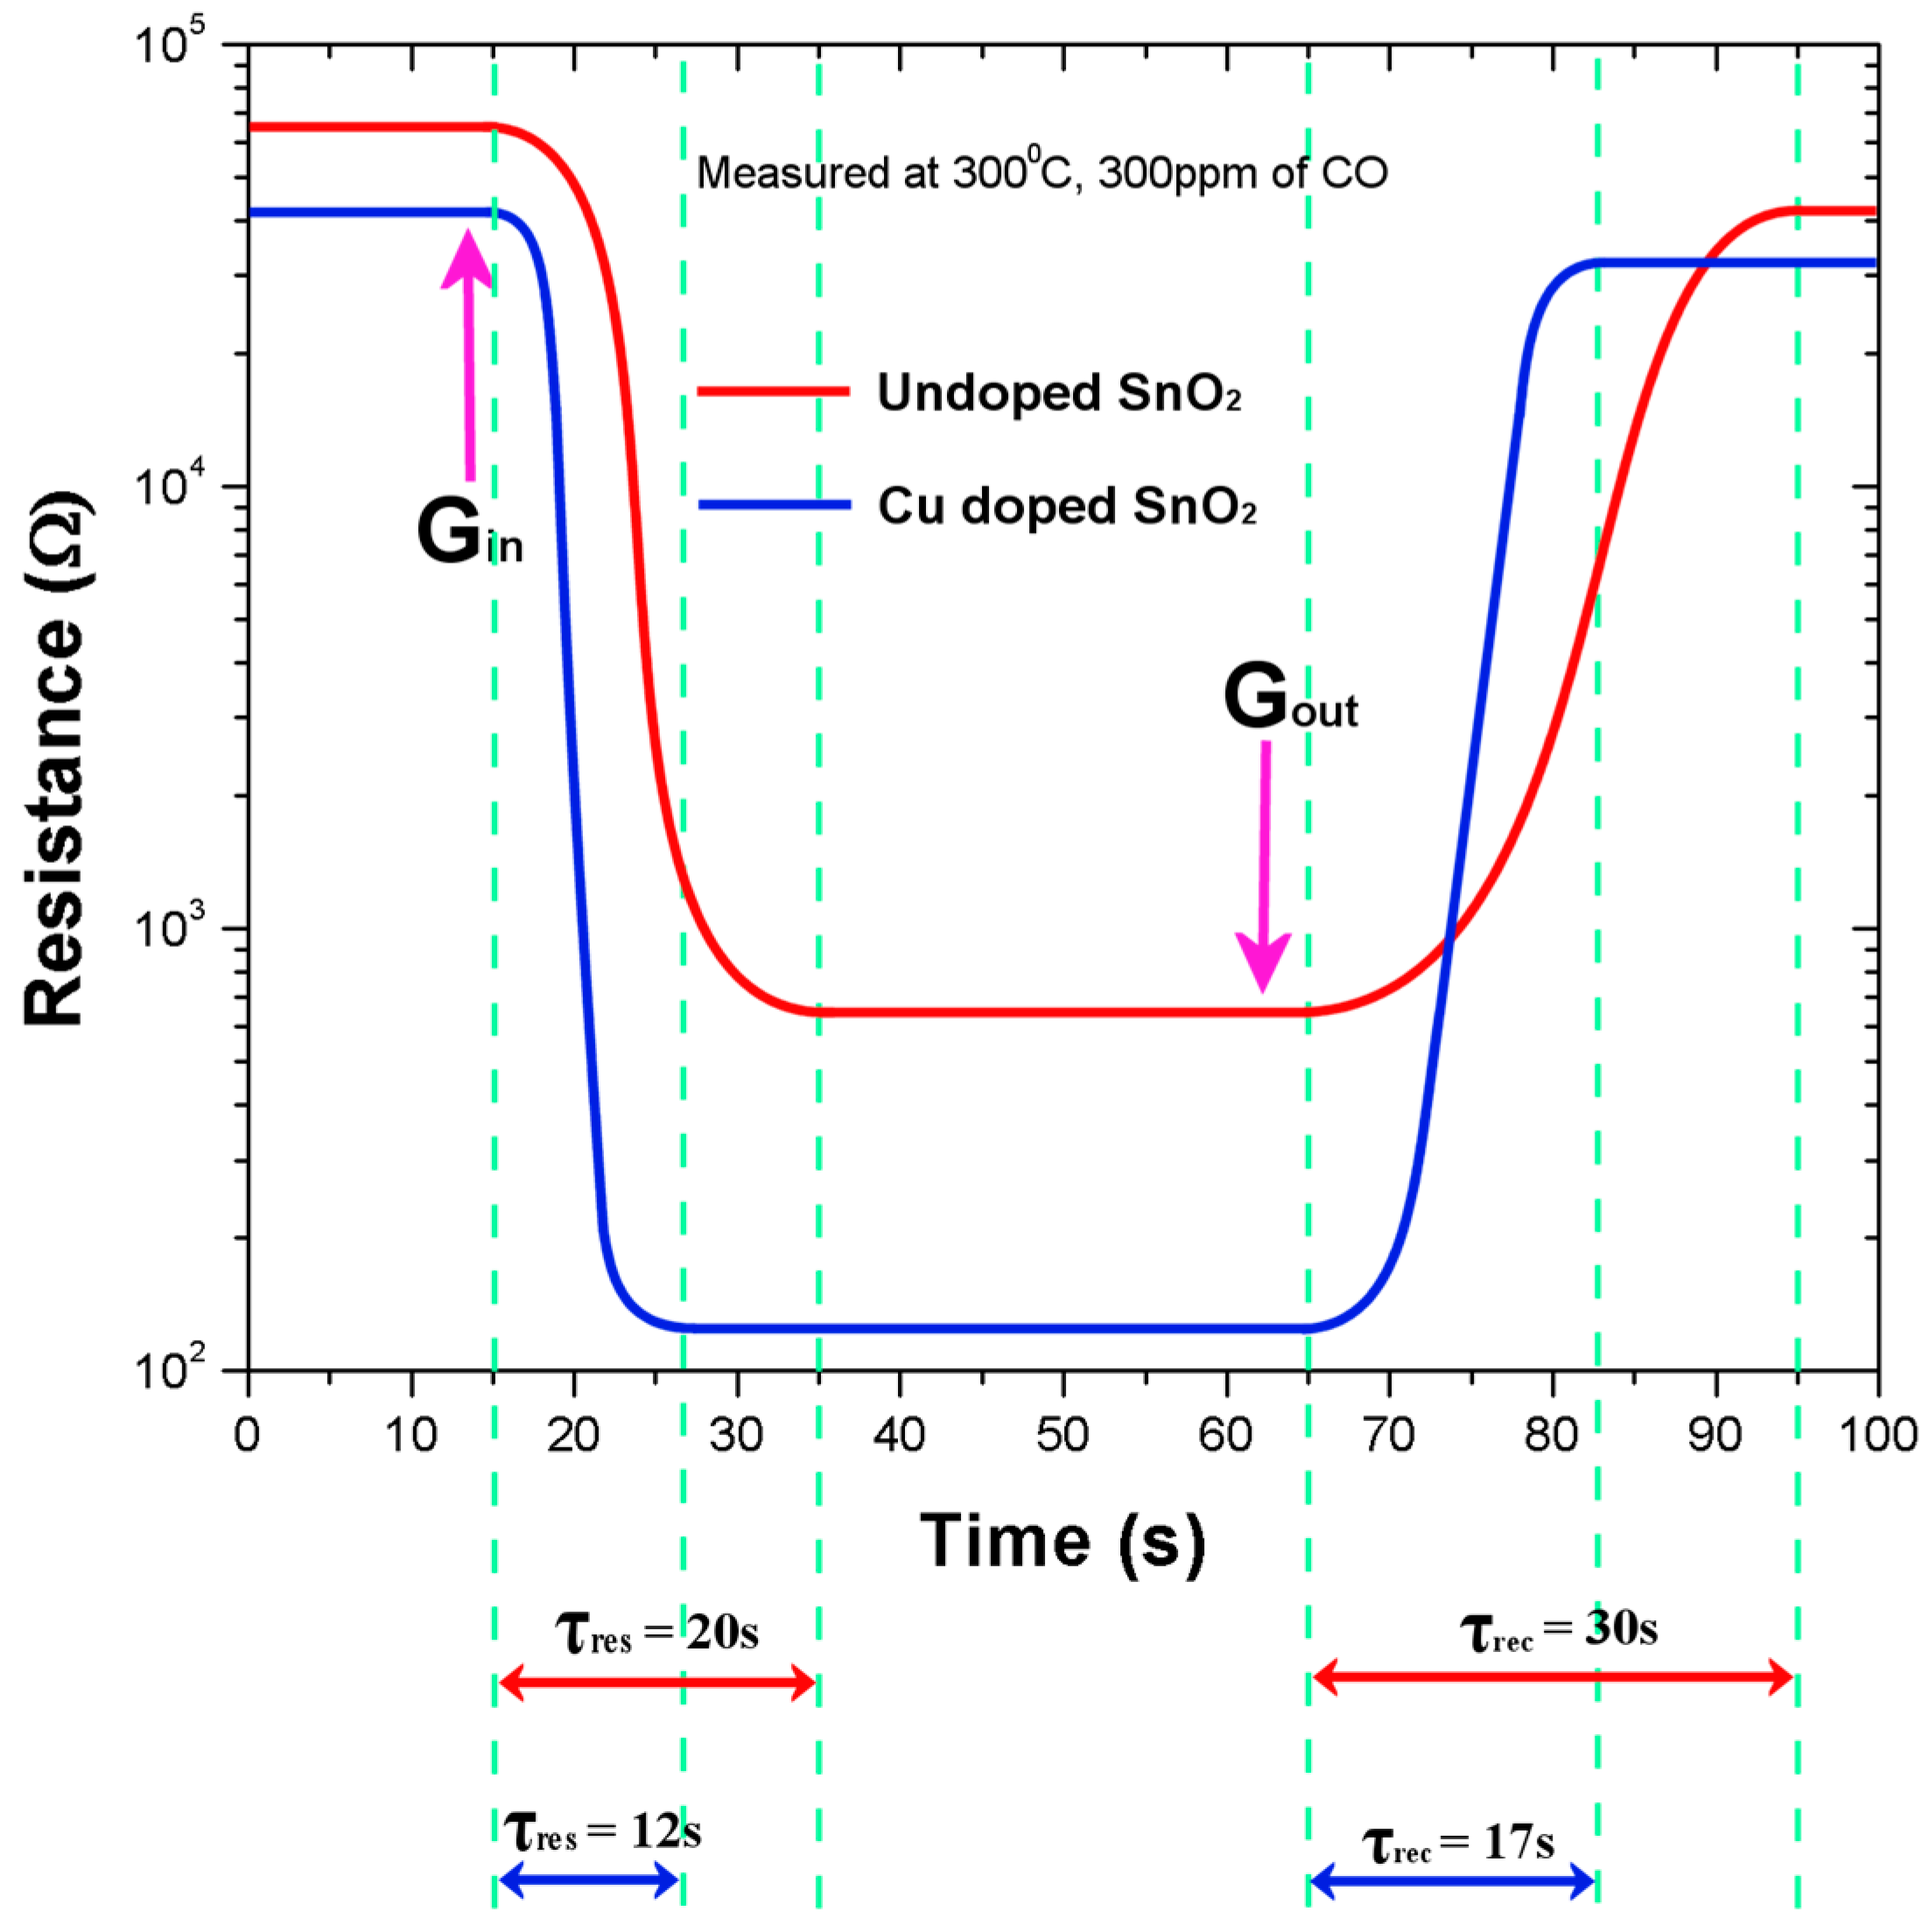
The time required for attaining 90% of the final electrical resistance with the test gas is referred to the sensor response time (τres), and the time taken to retrieve 10% of the saturation electrical resistance in the absence of the test gas is referred to sensor recovery time (τrec). In addition to having higher sensitivities, it is significant to have shorter response and recovery times for an acceptable sensor.
Figure 8 below shows the response and recovery times of the pure and copper-incorporated SnO
2 pellets measured at 300 °C and for 300 ppm of CO gas concentration. The response and recovery times of Cu:SnO
2 have reduced by an order of 2. Response and recovery times with their corresponding sensitivities are summarized in
Table 2. The reason for the increase in the sensitivity and decrease in the response and recovery times is due to the structural and morphological changes occurring in the Cu-incorporated SnO
2 powders.
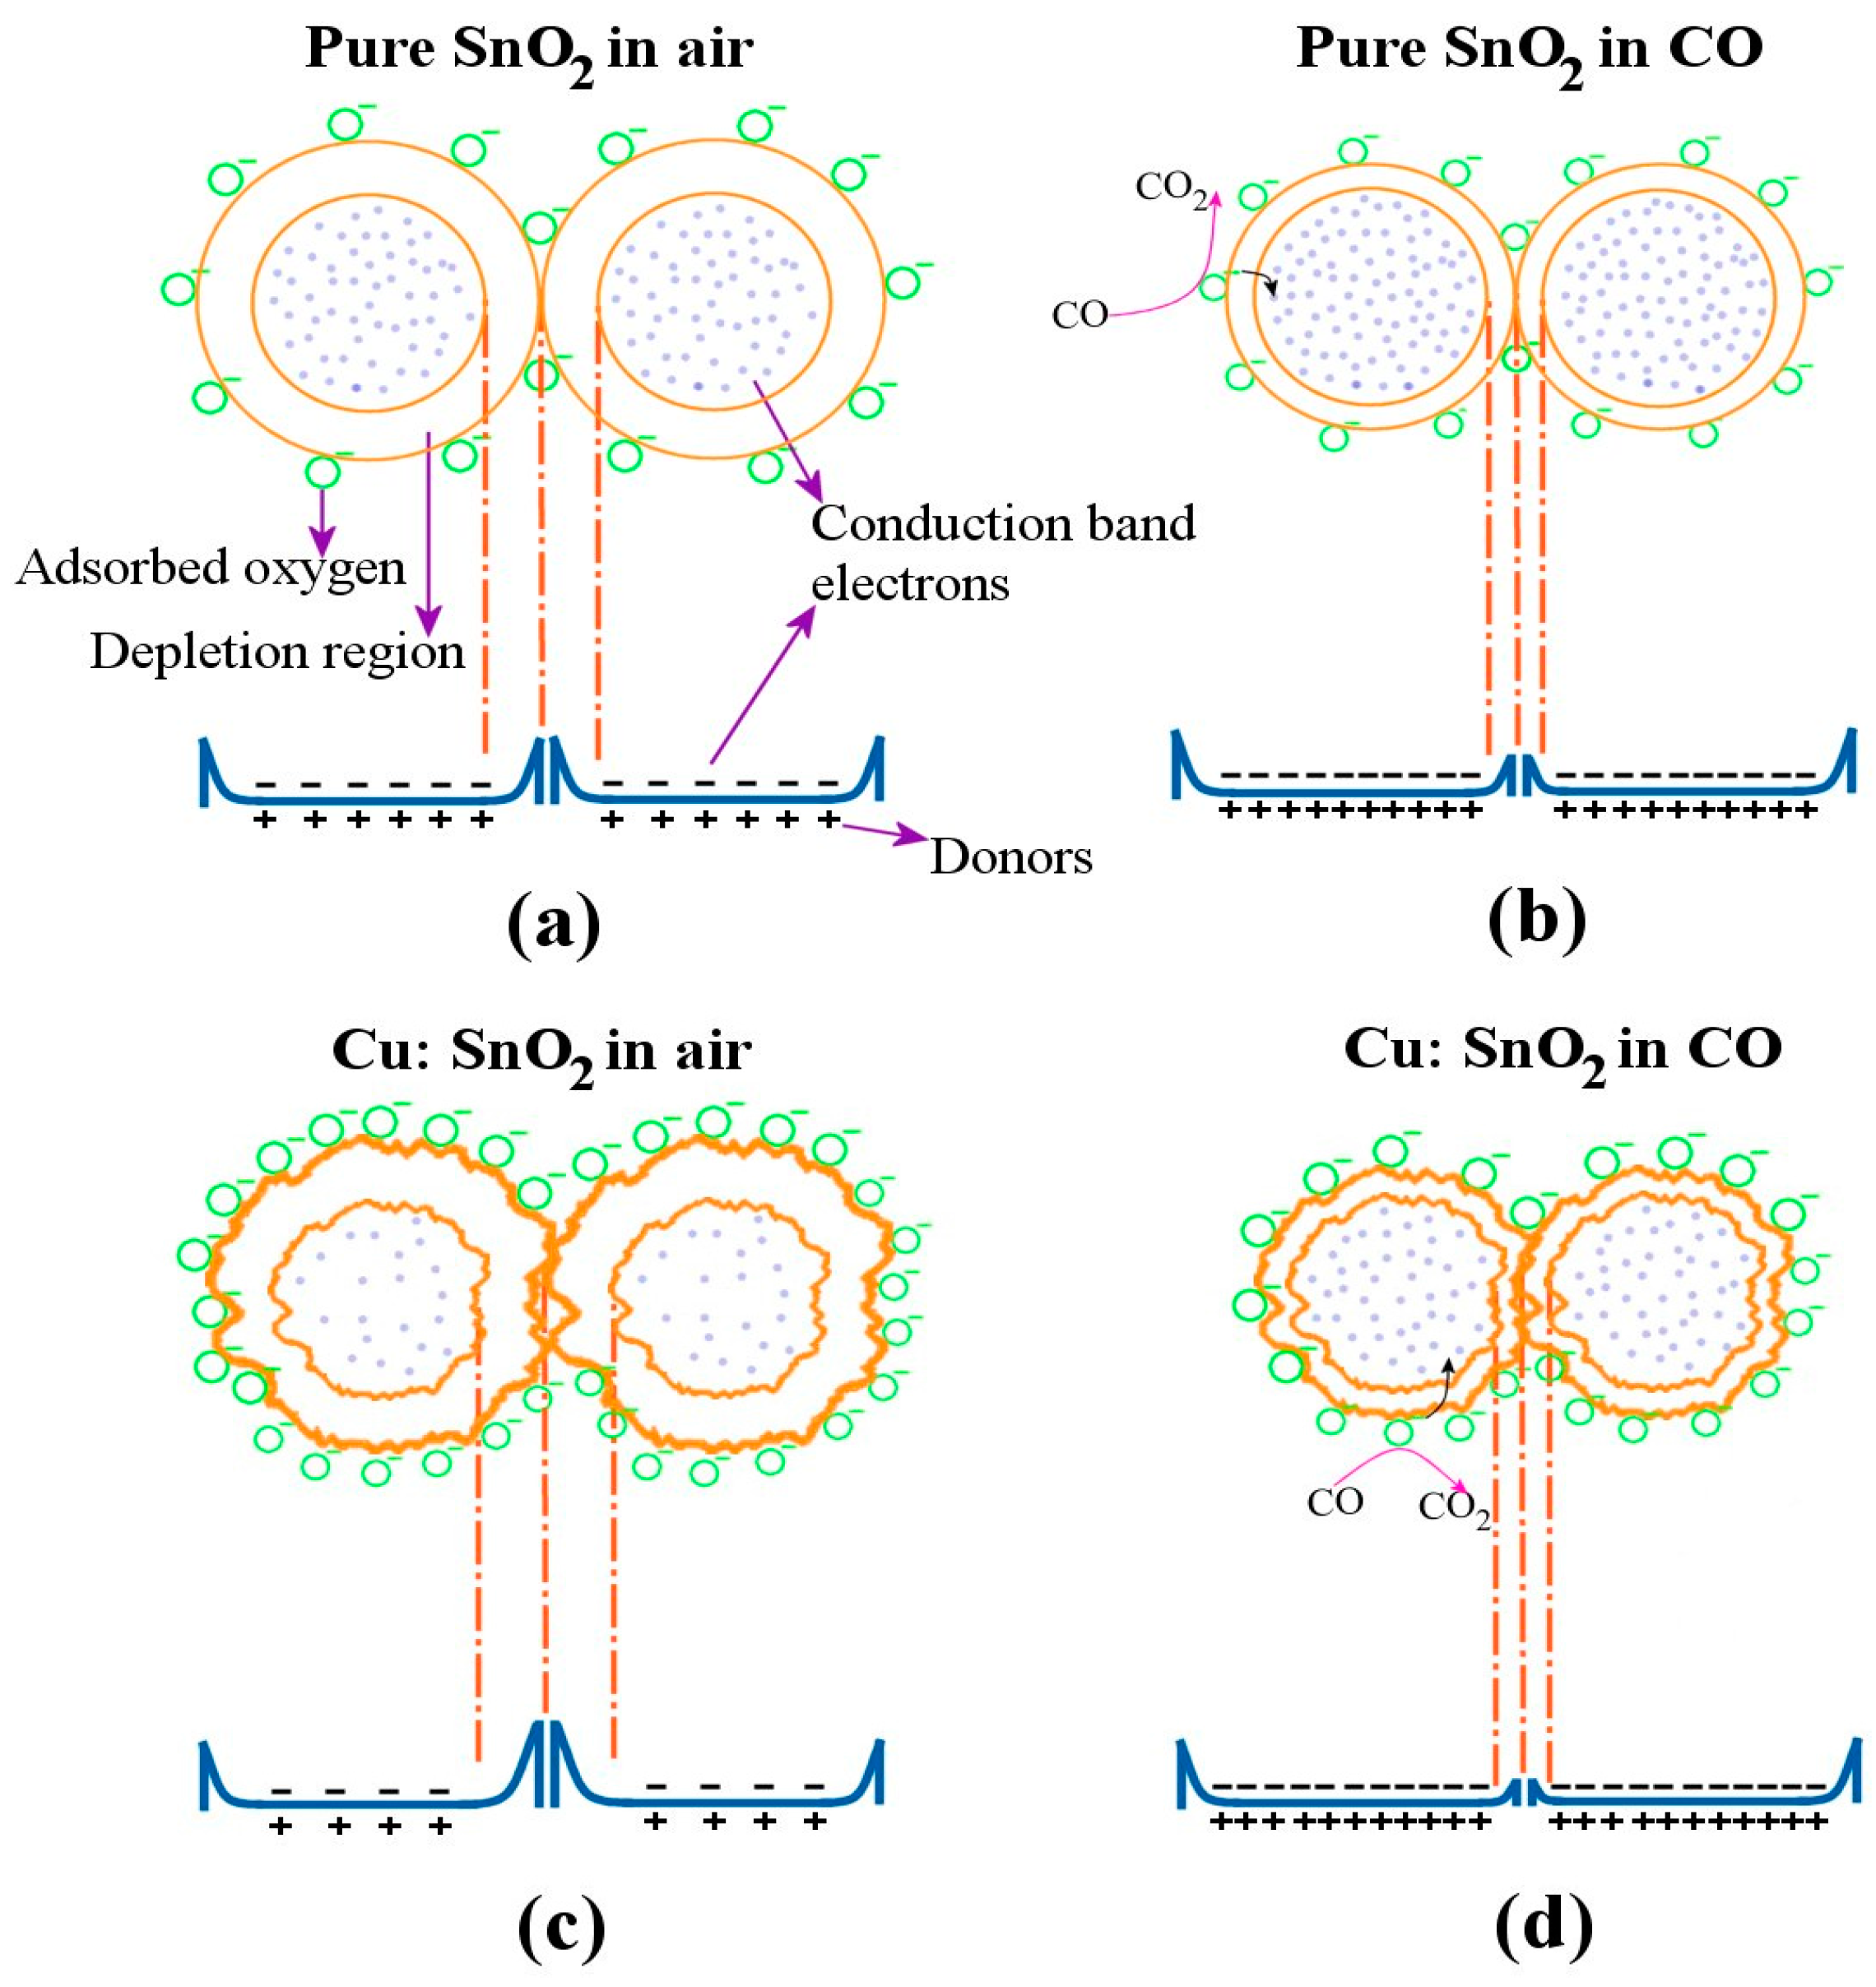
Figure 9 illustrates the gas-sensing concept in Cu:SnO
2 and pure SnO
2 powders.
Figure 9a,b shows the pure SnO
2 grains’ reaction with the air and CO, respectively. The depletion region decreases (
Figure 9b) as the CO reacts with the adsorbed oxygen, which results in the decrease in the barrier height and a further increase in sensitivity in the presence of gas. Whereas, for the pellets manufactured with Cu:SnO
2, the surface of the grains is rougher (
Figure 9c) due to the undulations resulting from the copper incorporation (
Figure 6). This increased surface roughness increases the oxygen adsorption and further CO sensitivity. The decrement in the barrier height observed in the presence of the gas is higher than the former case. This, besides increasing sensitivity, accelerates the adsorption and desorption surface reactions, such as the rate of chemical reaction between CO molecules and chemisorbed O
−. Furthermore, copper does not change its free energy in chemical reactions, but decreases the activation energy which, subsequently, increases the sensor’s response time [
29].


 ,
, 


