1. Introduction
Activity monitoring and detection is essential, e.g., in designing context-aware environments and physical therapies. Quantification of the intensity and type of the physical activities helps with understanding the individual’s lifestyle and facilitating the process of behavior change [
1]. Lack of sufficient physical activity is directly related to higher risk of stress, cardiovascular disorders, diabetes and musculoskeletal disorders [
2]. In the case of elderly adults, activity monitoring can play a key role in detection of long inactive time periods or fall events [
3]. Inability to recover from a fall can lead to debilitation and even fatal outcomes [
4]. Therefore, real-time activity recognition systems that are sensitive enough in detecting such critical time points are required [
5].
For many years, wearable inertial measurement units (IMUs) have been used to detect human activities. However, in many studies, researchers have tested multi-sensor configuration or less compliant measurement sites such as hip, ankle, chest and waist, which are not practical for long-term use [
6]. Wrist-based activity recognition using currently available smartwatches and wristbands seems more feasible and user friendly for long-term applications [
3]. Detecting physical activities by means of wrist-worn devices is, however, more challenging due to the wide degree of freedom of hand gesticulations [
6]. That is, the movement pattern of the hand varies widely and may look similar while different types of activities are carried out. For example, drinking while sitting reflects a similar hand movement pattern as drinking while standing. Such similarities in hand movement patterns hinder accurate activity recognition. This problem can be alleviated by providing additional information about the context. One of the available options is equipping the wrist-worn IMUs with heart rate (HR) sensors. HR can be measured using wrist-worn photoplethysmography (PPG) sensors. If triaxial accelerometers are also embedded, the device can be probably used for activity recognition purposes with better accuracies compared to conventional wrist-worn triaxial accelerometers. Hereafter, the PPG-ACC wristband refers to such wrist-worn devices that can acquire both PPG-based HR and acceleration (ACC) signals.
In this paper, we are aiming to present a comprehensive assessment of a human activity recognition (HAR) framework that will be suitable for both real-time and non-real-time applications. The framework covers some of the principal building blocks required for an activity monitoring system that works only based on a single PPG-ACC wristband. The system operates based on a well-known supervised classification algorithm, random forest (RF) [
7], which has been widely tested in the literature [
2,
8,
9]. The data processing comprised of label correction, signal segmentation, feature extraction, parameter examinations and feature reduction is comprehensively explained, and the corresponding strengths and weaknesses are discussed. We report the effect of window length, number of trees in the RF, effect of HR features, the optimal number of features and the most important HR and ACC features. Confusion matrices and the percentage of weighted mean accuracies (weighted standard deviations) are the criteria for benchmarking the goodness of the results.
To obtain the best parameter choices, a dataset of activities performed by 20 subjects was used. Two levels of cycling, different types of sitting, a series of household activities and standing still were successfully recognized and classified. For each parameter, a set of values was inputted to the RF, and the results were observed by leave-one-subject-out cross-validation (LOOCV). Having such a kind of comprehensive examination, the future implementations of the RF algorithm for wrist-based activity recognition become easier and more efficient. To the best of our knowledge, this is the first time that such a comprehensive activity recognition framework based on a single PPG-ACC wrist-worn sensor has been presented. Having both HR and ACC data simultaneously helps with recognizing varying intensities of the same activity, as will be shown in the upcoming sections.
The rest of the paper is structured as follows.
Section 2 is comprised of the literature review and related work. Materials and methods are presented in
Section 3. Experimental results are described in
Section 4. In
Section 5, we discuss the results. Finally, in
Section 6, we present the conclusions.
2. Related Work
Wrist-based activity recognition became popular since the wrist-worn IMUs with enough battery and memory were designed. For instance, the survey of National Health and Nutrition Examination (NHANES) changed the location of accelerometer measurements from the hip to the wrist in 2011 [
10]. One of the most prominent advantages of using wrist-worn sensors for activity recognition is better compliance compared to other measurement locations [
9].
GENEActiv, a wrist-worn triaxial accelerometer, is one of the most popular wrist-worn activity tracking sensors and has been used in a number of relevant studies. In the Pavey et al. study [
2] in which GENEActiv was deployed, sedentary, walking, running and stationary activities were classified with 93% accuracy. Using the same device, Zhang et al. could achieve accuracies as high as 97% deploying support vector machines (SVM) and decision trees [
11]. There, the recognized activities were sedentary, household activities, walking and running. In a recent study, Mannini et al. reported a recognition rate of 89% for a group of youths and adults using wrist-worn sensors [
12]. They declared that using triaxial Wocket accelerometers and the SVM algorithm, sedentary and ambulatory activities were properly differentiated in both youths and adults. GENEActiv was also used in another experiment made by Garcia-Ceja et al., where shopping, showering, working with a computer, eating meal, commuting, sports activities and brushing teeth were successfully classified with a maximum rate of 77% accuracy. There, the Hidden Markov model (HMM) and conditional random field were deployed for classification [
13].
Ellis et al. successfully classified household activities, walking, jogging and stairs using a wrist-worn ActiGraph GT3X+ accelerometer complemented by HR measured by Polar RS400 with 88% accuracy utilizing the RF classifier [
8]. The same author presented another wrist-based activity recognition framework in which they used the same device, but a multilevel classification approach using RF and HMM. They reached an 85% accuracy in classifying sitting, standing, walking/running and riding in a vehicle [
9]. ActiGraph GT3X+ was also exploited in the study done by Trost et al. in which an average classification accuracy of 88% was achieved for activities including sitting, standing, walking, playing basketball, lying down, running and dancing. The regularized logistic regression model was used as the classification algorithm in that work [
14].
Machine learning techniques have been widely used for activity monitoring [
15]. Depending on the nature of the task, supervised or unsupervised algorithms can be employed. Supervised learning has been selected in the majority of the studies mostly because of the heterogeneity of human movement patterns. Supervised classification algorithms are hence suitable for activity recognition given that enough training data are available. Nowadays, collecting data is not an issue since numerous wearable IMUs are on the market with lower than ever prices.
In this work, we are aiming to show how accurately a single PPG-ACC wristband can detect different home-specific activities and in particular activities with varying intensities, but similar wrist motion patterns. There have not been many studies in which fusion of wrist-based HR and ACC were studied for detecting activities such as stationary cycling with varying intensity levels. Moreover, we present a framework comprised of the best pre-processing and parameter choices for an RF classifier. The framework can then be replicated by other researchers and practitioners in the future.
3. Materials and Methods
3.1. Data Collection
A PulseOn CLOUD PPG-based heart rate monitoring wristband (PulseOn, Espoo, Finland) with an embedded triaxial accelerometer (range ±8g) was worn on the dominant wrist of the participants. The device collects both HR and ACC measurements with a 25-Hz sampling frequency. The wristband connects with mobile phones via Bluetooth connection for both real-time visualization of the HR and ACC values and data storage. The data can then be exported from the connected mobile phone in the form of relational databases.
Twenty-five healthy male adults (age = 28.1 ± 3.8 (years), body mass index (BMI) = 24.8 ± 3.4 (kg/m2)) participated in the study from which five were excluded from final analysis. Most of the recruited subjects were students at Tampere University of Technology, Finland. The excluded subjects had problems in either data storage (N = 3) or lack of adherence to the pre-trial instructions (N = 2). Inclusion criteria were having at least eighteen years of age and being ambulatory. Written informed consent was collected from all subjects before participation. Ethical clearance was obtained from The Academic Ethics Committee of the Tampere Region (Statement 35/2016).
The study protocol consisted of a single testing session in a furnished home-like apartment in which a set of typical home-specific activities were performed. The activities are described in
Table 1.
3.2. Data Pre-Processing and Feature Extraction
After completion of the laboratory protocol, class labels were added to each subject’s data according to the time points that were recorded by the laboratory instructor during the tests. The time points at which each activity started and ended were written down by the laboratory instructor during the tests. Labels were then assigned to every sample of the data whose timestamp fell between the mentioned beginning and end time points. To correct the potentially inaccurate labels at the times of transitions from one task to another, the laboratory instructor visually inspected the graphs of ACC and HR signals and interactively adjusted the times at which the transitions occurred.
Although window length for ACC signals has been widely tested in the literature, there was not much evidence about the window length effect when features of HR and ACC signals are combined. Hence, the pre-processed data were segmented into 1-, 3-, 5-, 7-, 9-, 11-, 13-, 15-, 17-, 19- and 21-s time windows with 90% overlap. To recognize the activities on a real-time basis, the HAR system must deliver the labels of activities frequently enough. This is the reason for having 90% overlap between every two adjacent windows in this study. Apart from that, Janidarmian et al. [
15] showed that their HAR system achieved the highest recognition accuracies when 90% overlap was deployed.
From ACC signals, both time and frequency domain features were extracted. In the time domain, features were the mean and standard deviation of the absolute value of each axis. Absolute values were used since the subjects were wearing the device on either the left or right wrists depending on which one was their dominant hand. From the three ACC axes, signal magnitude area (SMA), mean, standard deviation, median, mean absolute deviation and the median absolute deviation of signal magnitude vector (SMV), as well as correlations between each pair of the three axes were calculated [
6]. In the frequency domain, the relative energy of each axis in different frequency bands
Hz) was computed for each window using short-time Fourier transform (STFT). In addition, the dominant frequency and its magnitude in the whole frequency range (0–12.5 Hz) of each axis in each window were computed.
From the HR signal, time domain features including mean, standard deviation, mean difference of consecutive windows, mean difference of every second window, mean absolute deviation and median absolute deviation were extracted [
6].
To remove the redundancies and potentially correlated features in the feature set, pair-wise Pearson correlation coefficients of all the features were computed, and from the pairs whose coefficients were greater than or equal to 0.95, one feature was excluded from the whole feature set. At the end, 4 pairs of correlated features were recognized, and from each pair, one of the features was excluded from the feature set. Altogether, 62 features were present in the final feature set.
All the signal segmentation and feature extraction work was done using R Version 3.1.2 [
17].
3.3. Classification Algorithm: Random Forest
Random forest is a statistical learning algorithm employing a large ensemble of decision trees [
7] used for both regression and classification tasks. Remarkable classification performance along with relatively simple training and tuning are the strengths of the RF algorithm [
18].
In the case of classification, the RF algorithm employs a set of classification trees, while each tree is built on a bootstrapped sample of the original data [
7]. The classification trees are built based on recursive binary splits, as for each split, a randomly-chosen subset of input variables is used to find the best binary split [
19]. In each tree, the best splits are determined using the Gini index values [
19].
The RF algorithm can be used for feature selection, as well [
7]. This is done via measuring the mean decrease of accuracy when a particular feature is removed from the set of features in the trees. If the accuracy deterioration after feature exclusion is negligible, the feature is less important and vice versa. The RF algorithm assigns the importance score to each feature using the aforementioned concept. The importance scores of the features in the RF classifier [
7,
20] can therefore be evaluated and used as a feature selection criterion.
The function "RandomForestClassifier" [
21] in the Python Scikit Learn package [
22] was used for constructing the RF classifier in this study.
3.4. Analysis Framework
We designed four experiments in which the effect of window length, forest size, HR features and the utility of each single feature in classification performance were comprehensively analyzed. Under the Results Section, in Experiment 1, the effect of window length on classification performance is presented. Next, in Experiment 2, the relation between the number of trees in the forest and the classification performance of the RF classifier is shown, considering that it is computationally favorable to deploy as few trees as possible. In Experiment 3, the utility of HR features in the performance of the classifier is demonstrated. Finally, in Experiment 4, the importance of each feature and its effect on the classification performance is investigated.
The hyper-parameters of the RF classifier [
22] were all constant throughout the analysis except the ones with which we were experimenting. The values of hyper-parameters were as follows. Gini index values were used for selecting the best split. The maximum number of features considered for identifying the best split was set to the square root of the total number of features in the feature set. The maximum allowed depth of the trees in the forest was set to either pure leaves or all leaves having less than 2 samples, which was the minimum number of samples required to split an internal node. The minimum number of samples required to split an internal node was set to 2. The minimum number of samples at a leaf node was set to 1. Bootstrap samples were used for building the trees. Tree-specific balanced class weights were deployed to alleviate the effect of the imbalance of the class sizes when a bootstrap sample was selected for each tree.
In all stages of the analysis, the weighted mean value of LOOCVs was used as the performance metric. The weighted mean was exploited to account for the imbalance of the class sizes. The experiments were all done by the Anaconda distribution of Python 3.6.0. The following section includes the four above-mentioned experiments.
5. Discussions
In this study, a set of human activities recorded by a single PPG-ACC wrist-worn sensor was classified deploying an RF classifier. The aim of the study was to comprehensively examine (1) how accurately the human activities can be classified; (2) how the signal segmentation affects the overall classification results; (3) the optimum number of RF trees required for HAR purposes; (4) the effect of HR features on classification results and in particular recognition rates of varying intensities of a same activity type; and (5) the optimal number of features by which the peak performance can be achieved.
The recognized activities were typical home-specific daily tasks including: (1) sitting (sitting still, sitting and drinking and sitting and doing math without pen and paper); (2) standing still; (3) household activities (two types of dish washing and two types of table cleaning); (4) low-intensity stationary cycling at 60 rpm; and (5) and high-intensity stationary cycling at 90 rpm [
6]. All the activities were performed in a home-like apartment, which provided more realistic results over laboratory environments.
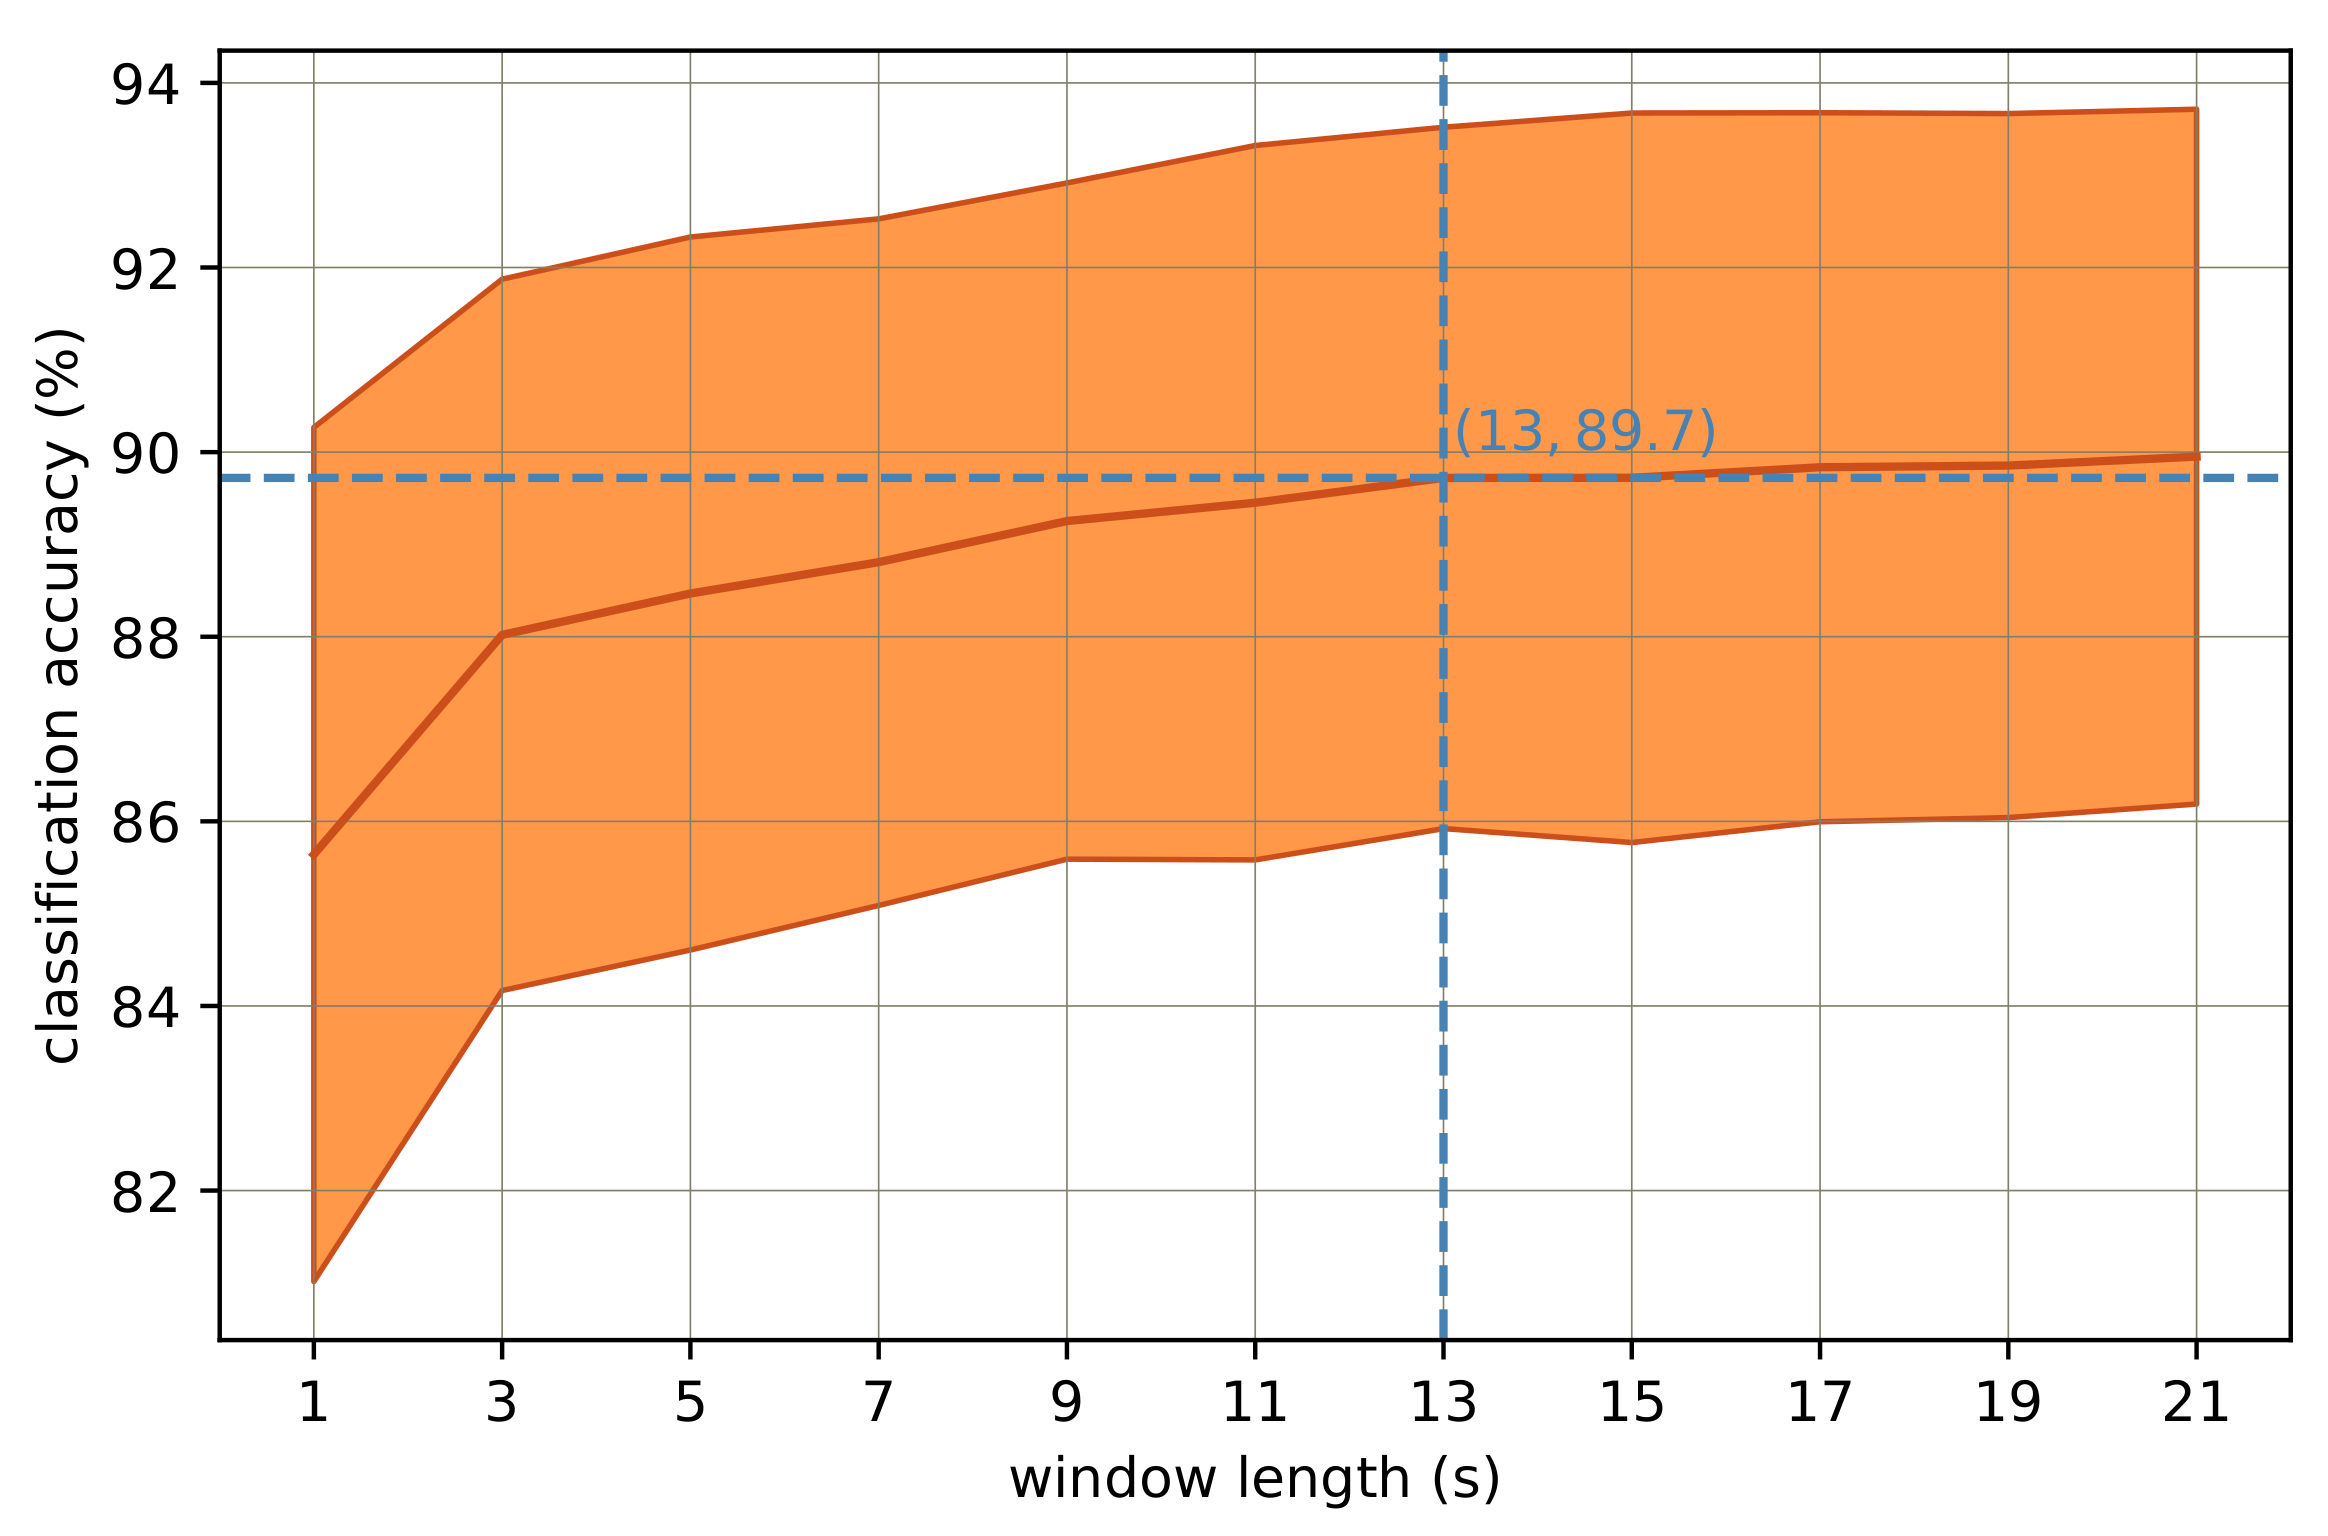
The effect of signal segmentation (or window length) on activity classification was addressed by assessing a range of different window length values. The window length values were 1, 3, 5, …, 21 s. According to
Figure 1, the maximum classification accuracy could be obtained by the 13-s signal segments. In this study, the adjacent signal segments had 90% overlap. Such a high overlap value was selected because in a real-time activity recognition system, the activity labels must be delivered as frequently as possible. Although deploying overlapping windows results in more training samples, in practice, not much improvement is made in the overall performance due to the correlation of the data [
24]. Deploying 90% overlapped segments for short window lengths (e.g., less than 5 s), is not required however; because the time duration between every two labels would not be much and the labels are delivered frequent enough. However, there is no harm in deploying overlapping windows from the classification point of view, although it is computationally more expensive. Thus, we tended to keep the pre-processing approach the same for all signal segment lengths despite the burden of computational complexity.
The signal segmentation effect was extensively studied in many papers. Mannini et al. reported an 85% LOOCV recognition accuracy using a non-overlapping 12.8-s window length for wrist-based ACC signals. In the same work, non-overlapping 4-s windows were also tested and showed an 84% LOOCV classification accuracy, which is only 0.05% less than the case with 12.8-s windows [
24]. Mannini et al. proposed 4-s windows for real-time activity recognition purposes as the 4-s latency is tolerable for real-time applications. Zhang et al. deployed non-overlapping 12.8-s windows and obtained 96% and 97% overall 10-fold cross-validation accuracies for left and right wrists [
11]. The best window length obtained in the aforementioned two works is considerably similar to what has been presented in this work, stating that a 13-s window length could provide the best classification results. Deploying longer time windows may however lead to better results when HR features are also taken into account, mainly because of the latency of the cardiovascular system in stabilizing HR after transiting from one task to another. Lengthening the signal segments beyond 13 s may, however, lead to overlooking the short-lasting activities and therefore less accuracy. Concerning the classification accuracies, Mannini et al. tended to impose as little instruction as possible on the study participants [
24]. They were able to achieve moderately high accuracy levels, but still not as good as what has been presented by our work in this paper. Zhang et al. got significantly higher accuracy rates; however, they did not tend to discriminate varying levels of the same activity type as they stacked all the same activity types into one broad category [
11]. On the other hand, 10-fold cross-validation was deployed for the validation of their models, which is in principle subject dependent and normally produces higher classification rates compared to LOOCV.
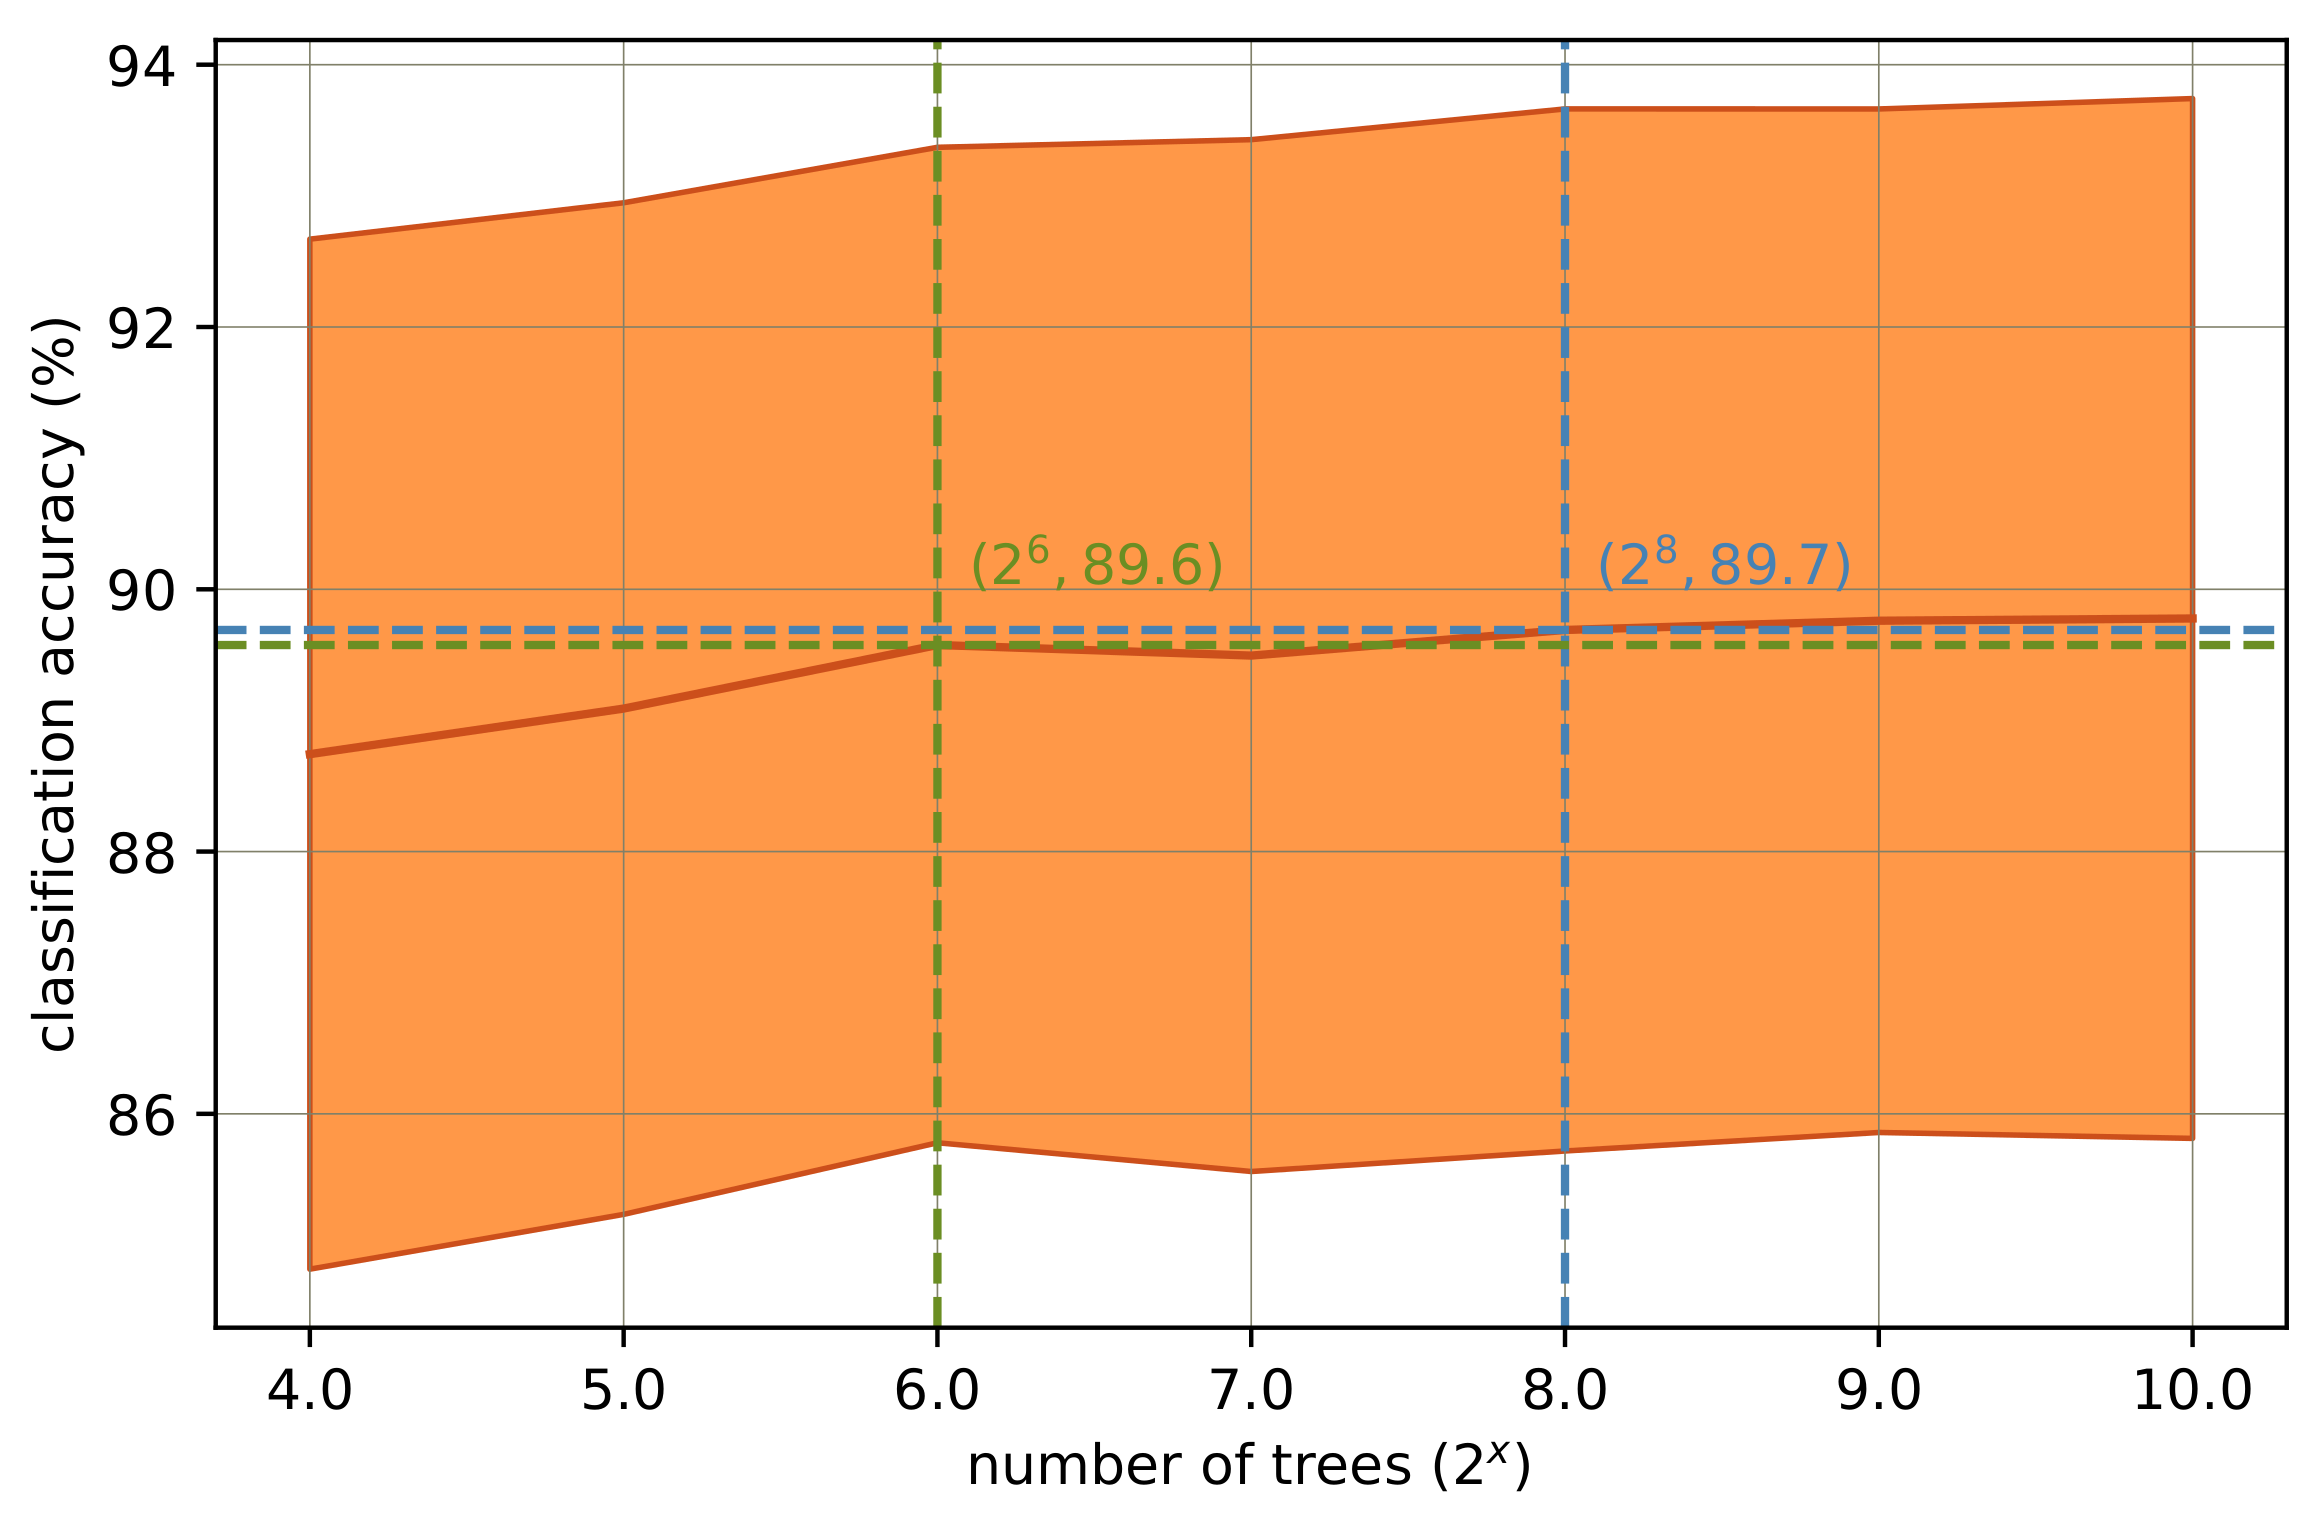
The forest size was assessed in this study comprehensively after the determination of the best window length. Different number of trees from the set of 16, 32, 64, …, 1024 were tested, and the results are shown in
Figure 2. The best results were obtained using 256 trees, whilst almost as good results could also be acquired using 64 trees. A fewer number of trees is preferred as it ends up with less computational complexity [
23].
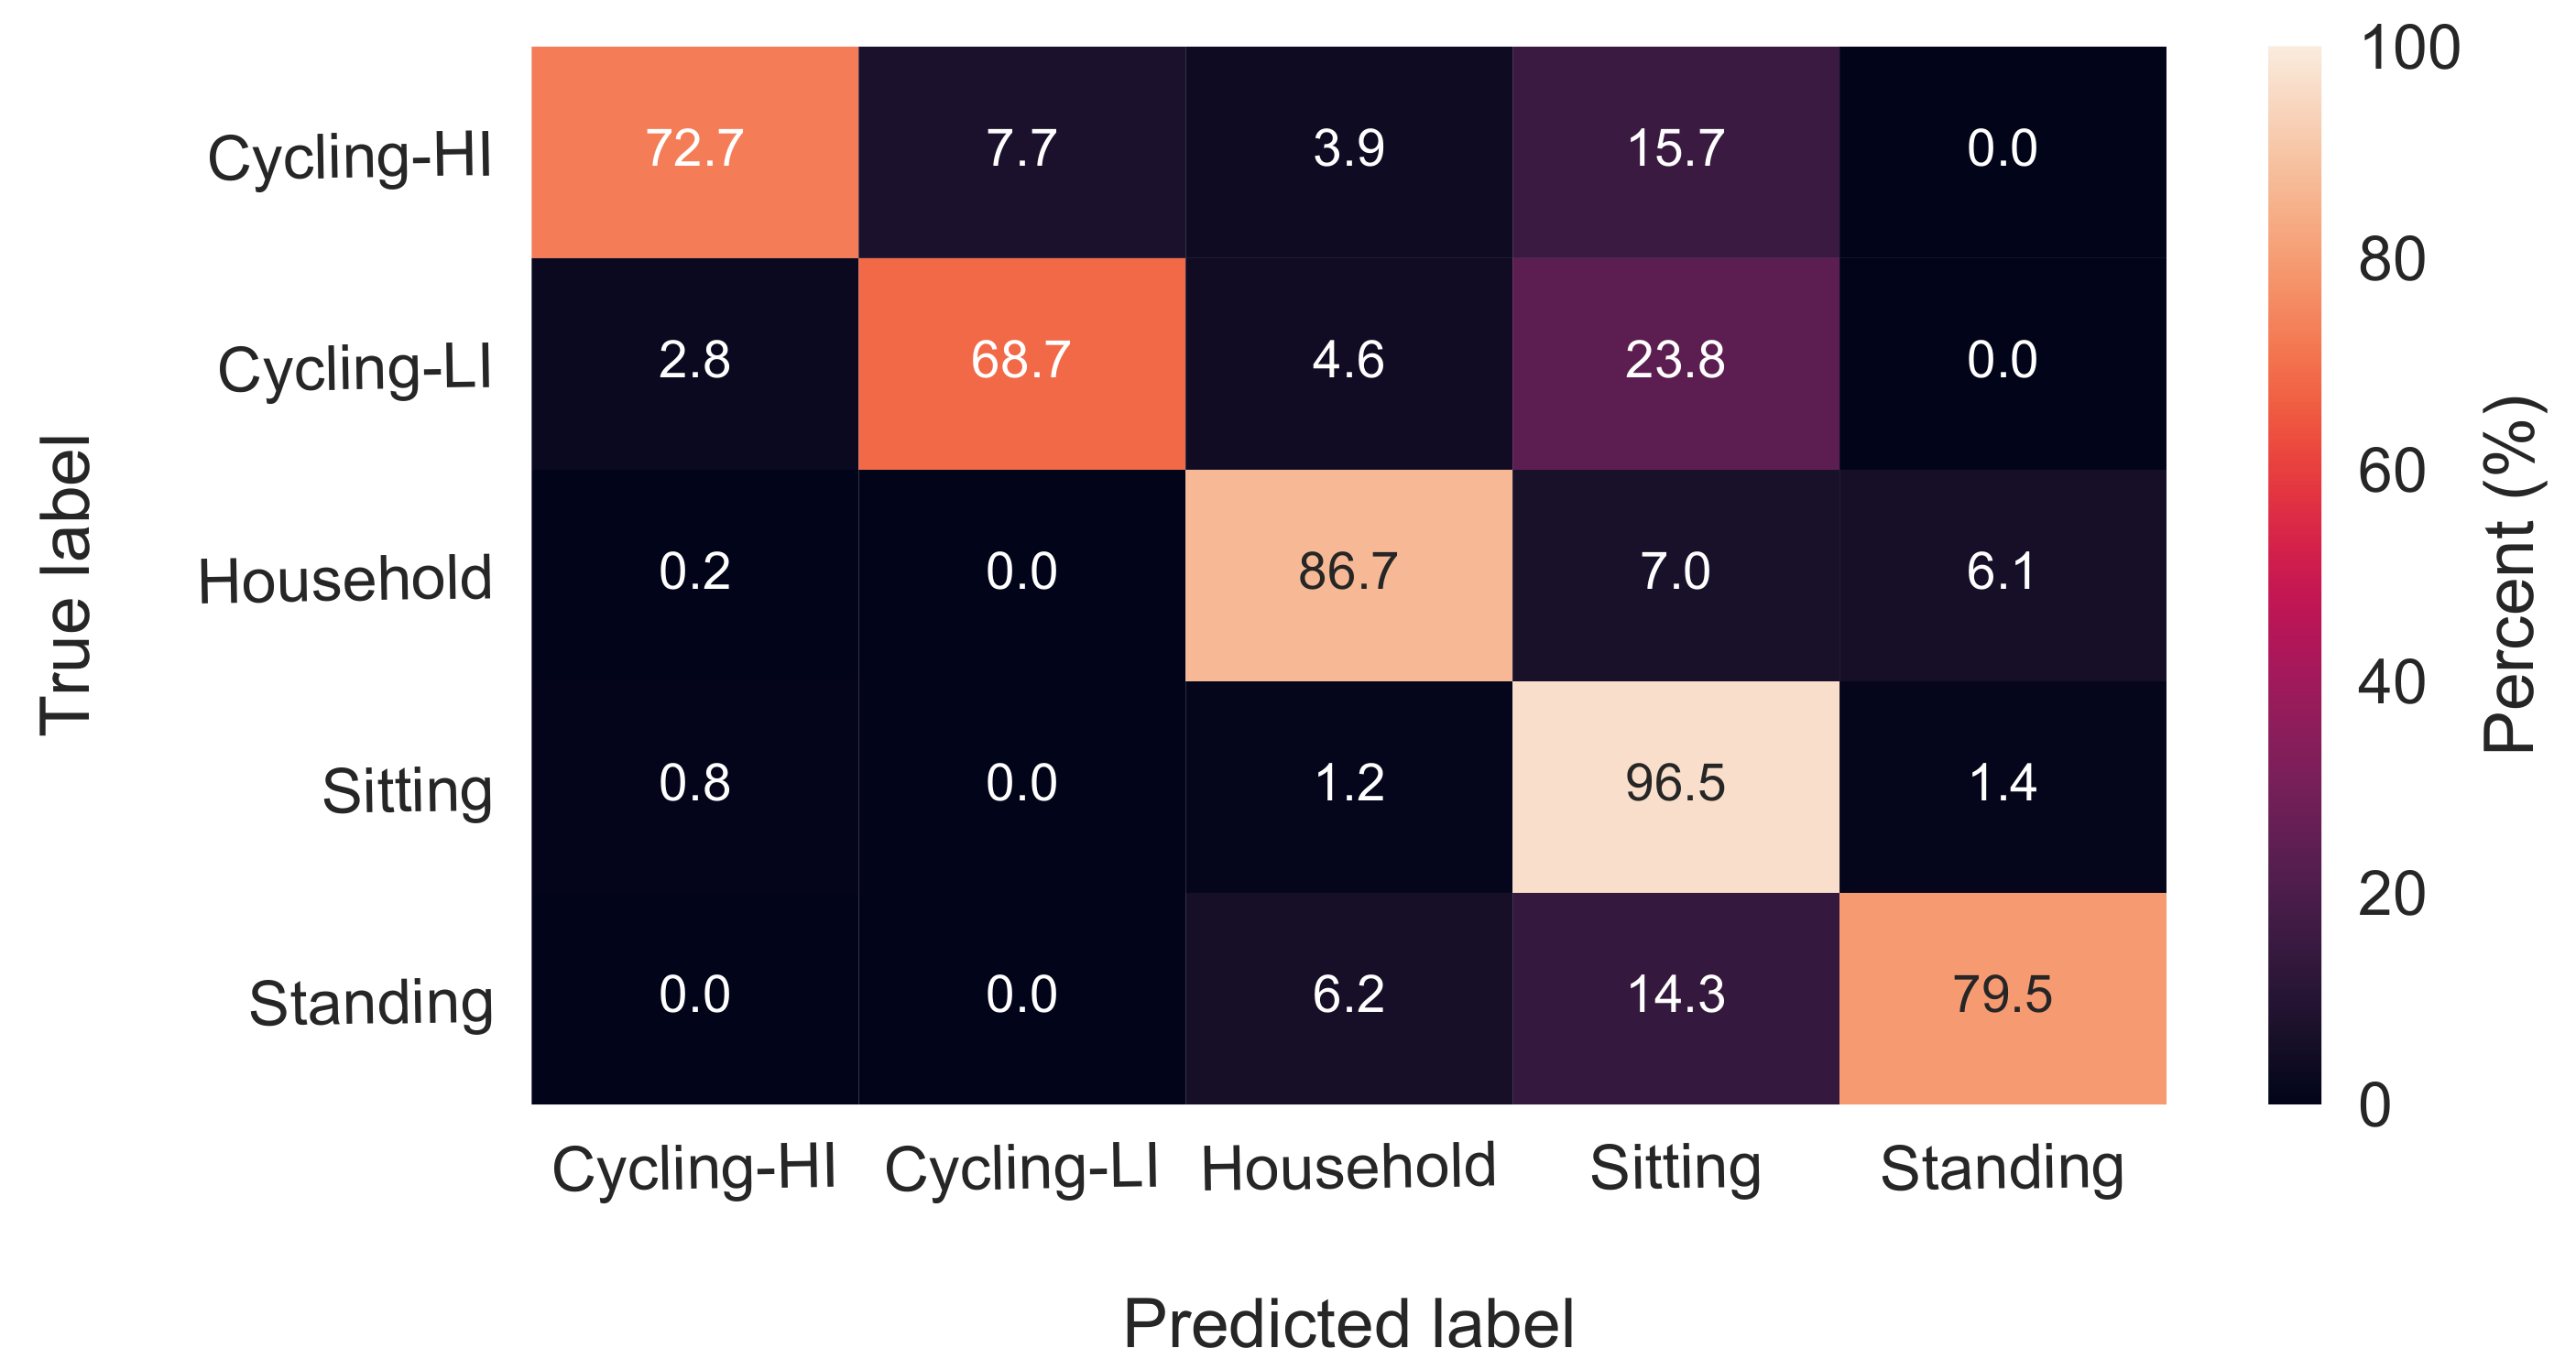
The effect of HR features was revealed when the RF classifier was trained once with and once without HR features. There was no effect on the recognition rates of household activities, sitting, standing and low-intensity cycling, while the high-intensity cycling was classified with almost 7% less accuracy when HR features were excluded. Ellis et al. stated that the effect of HR in activity recognition is not significant [
8], although their study did not include tasks having different intensities, but similar hand motions, such as cycling with different intensities in this study. In the studies of Rosenberger et al. [
25] and Mannini et al. [
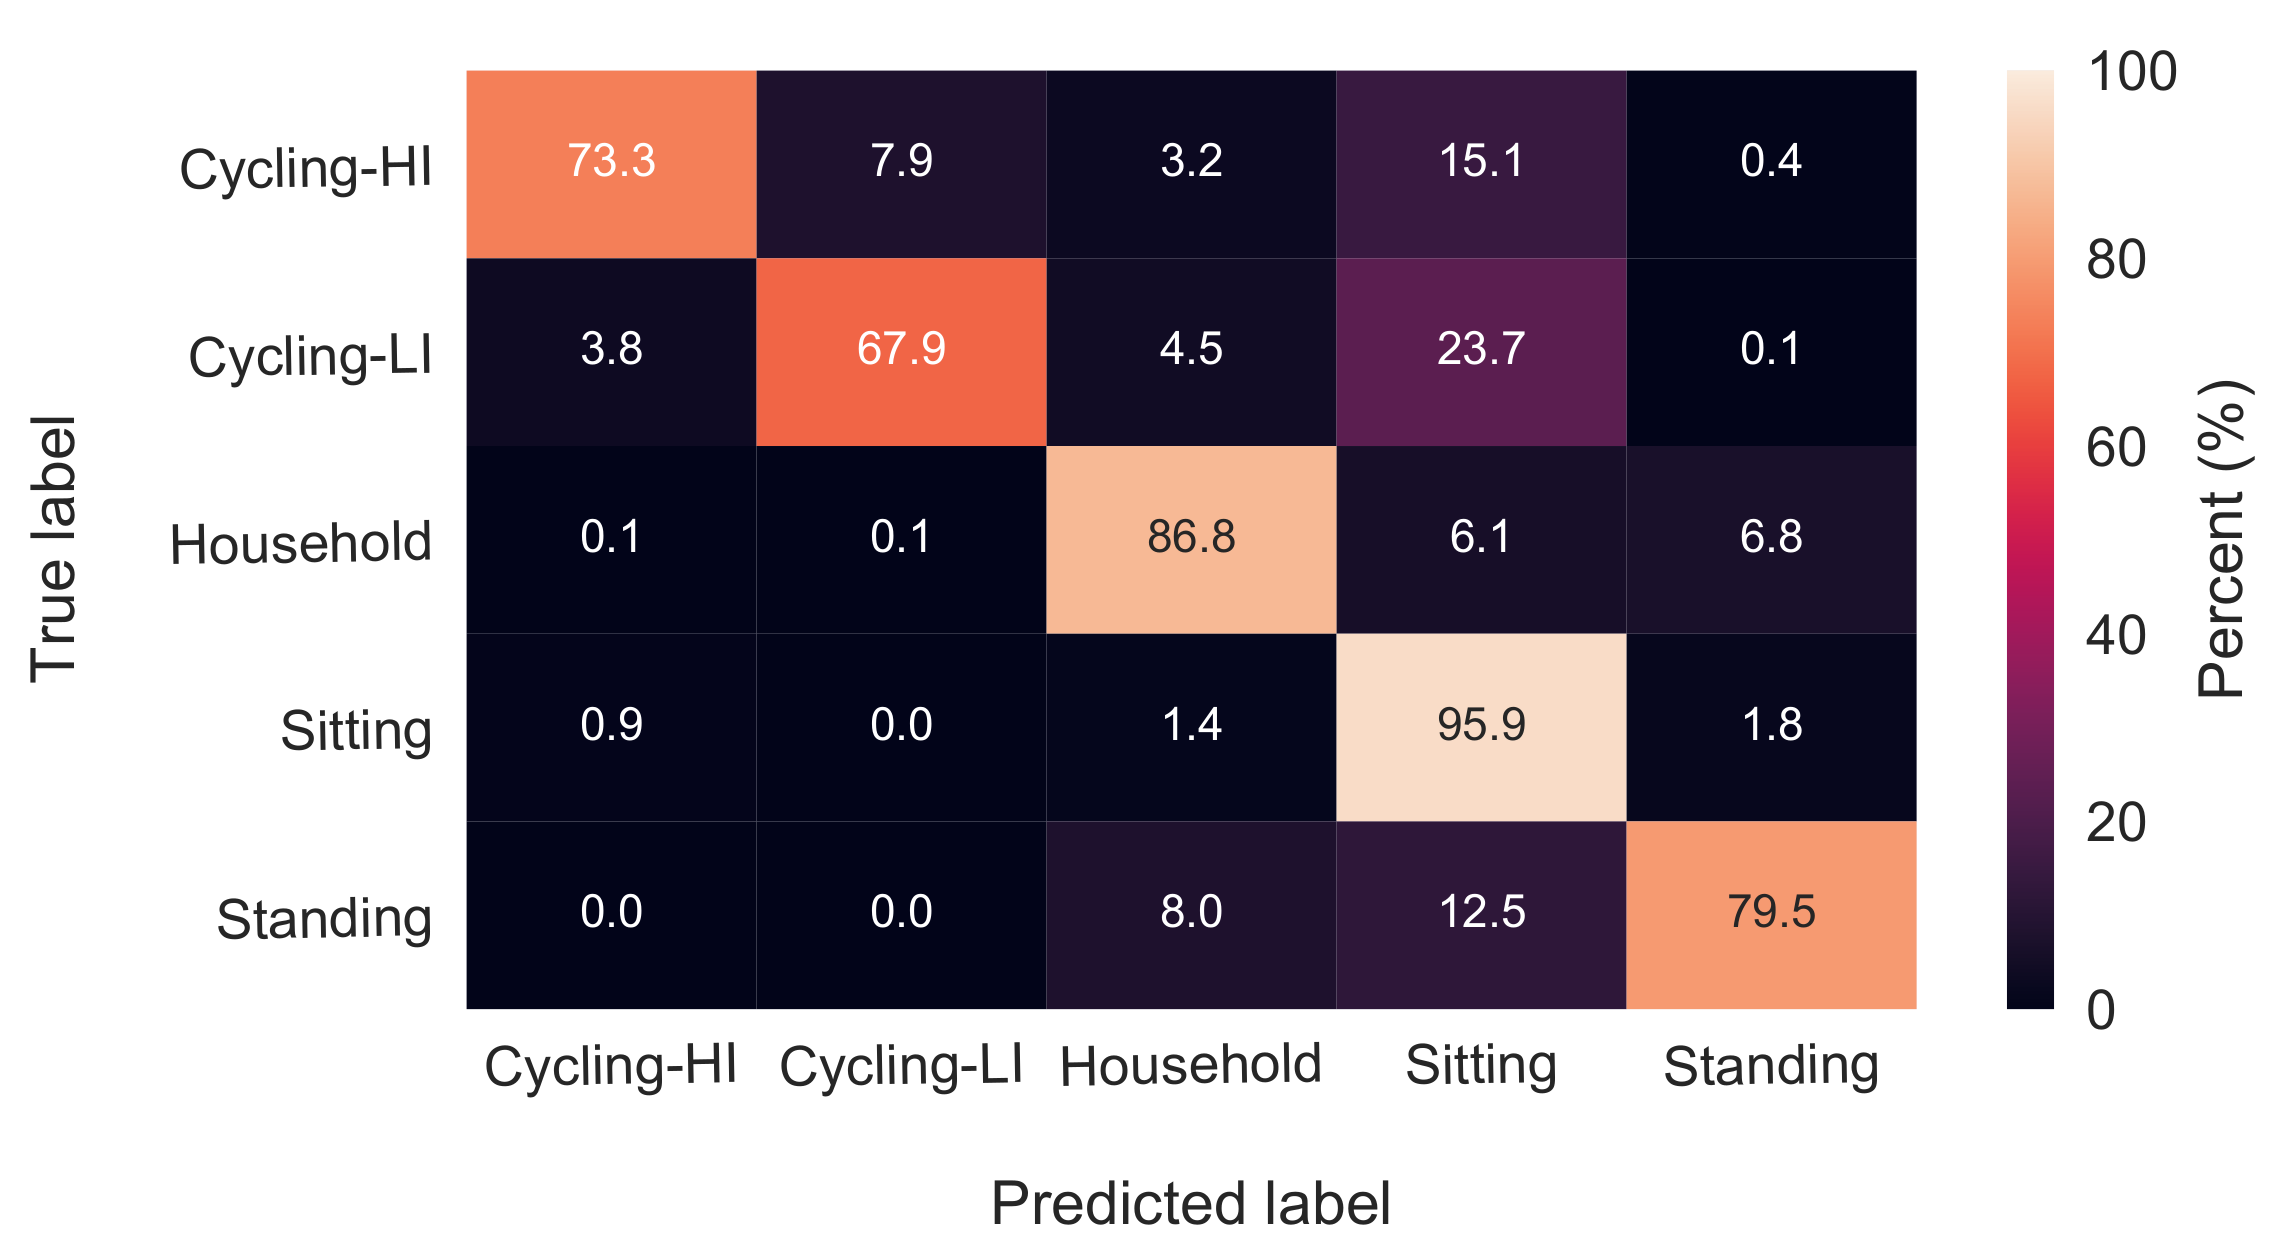
24], the most difficult task to classify was cycling mostly due to the stationary position of the hands on the bike handle bar, which resembles sedentary activities. By introducing HR features to the classification algorithm in our study, not only the cycling tasks were reasonably identified, but also their intensities were recognized with almost 70% accuracy as shown in
Figure 3. According to
Table 2, the mean value of HR was the third most important feature among all the extracted features. However, activity recognition may not be done solely based on HR due to the latency of the cardiovascular system in responding/recovering to/from changes in the activities. For instance, HR recovers slowly after some minutes of moderate exercise [
26]. Such a latency in HR recovery is probably the reason for it being not the most important feature in
Table 2.
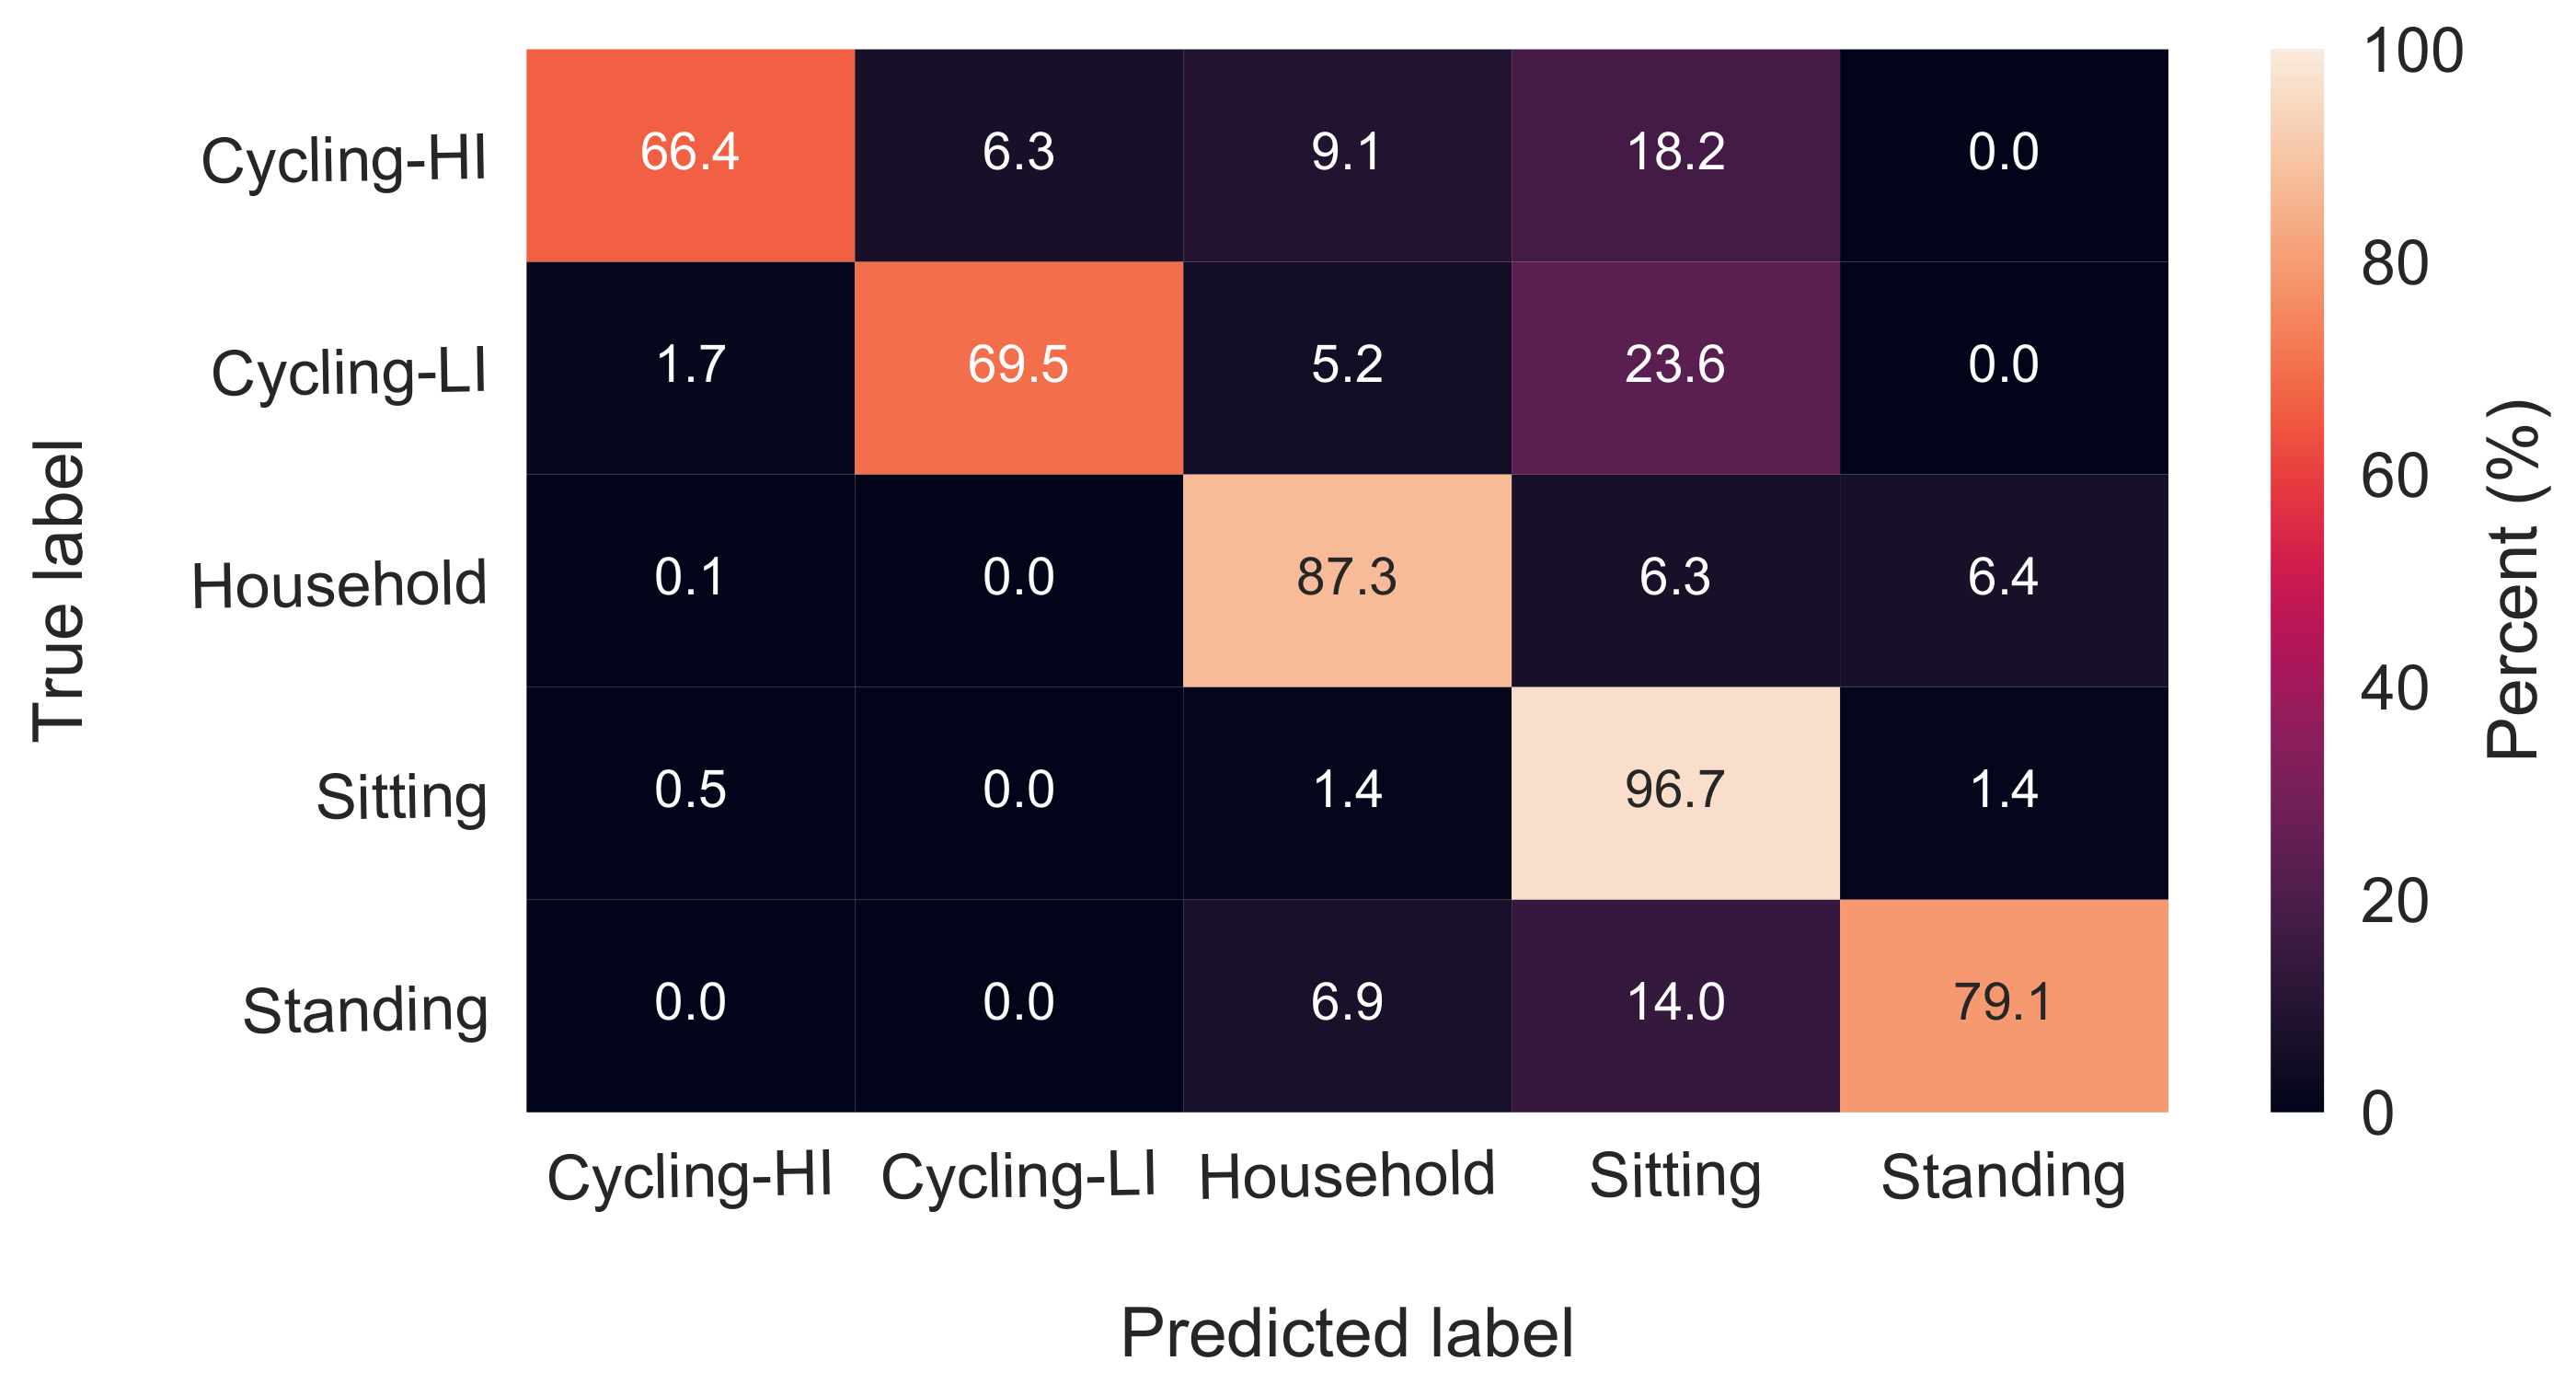
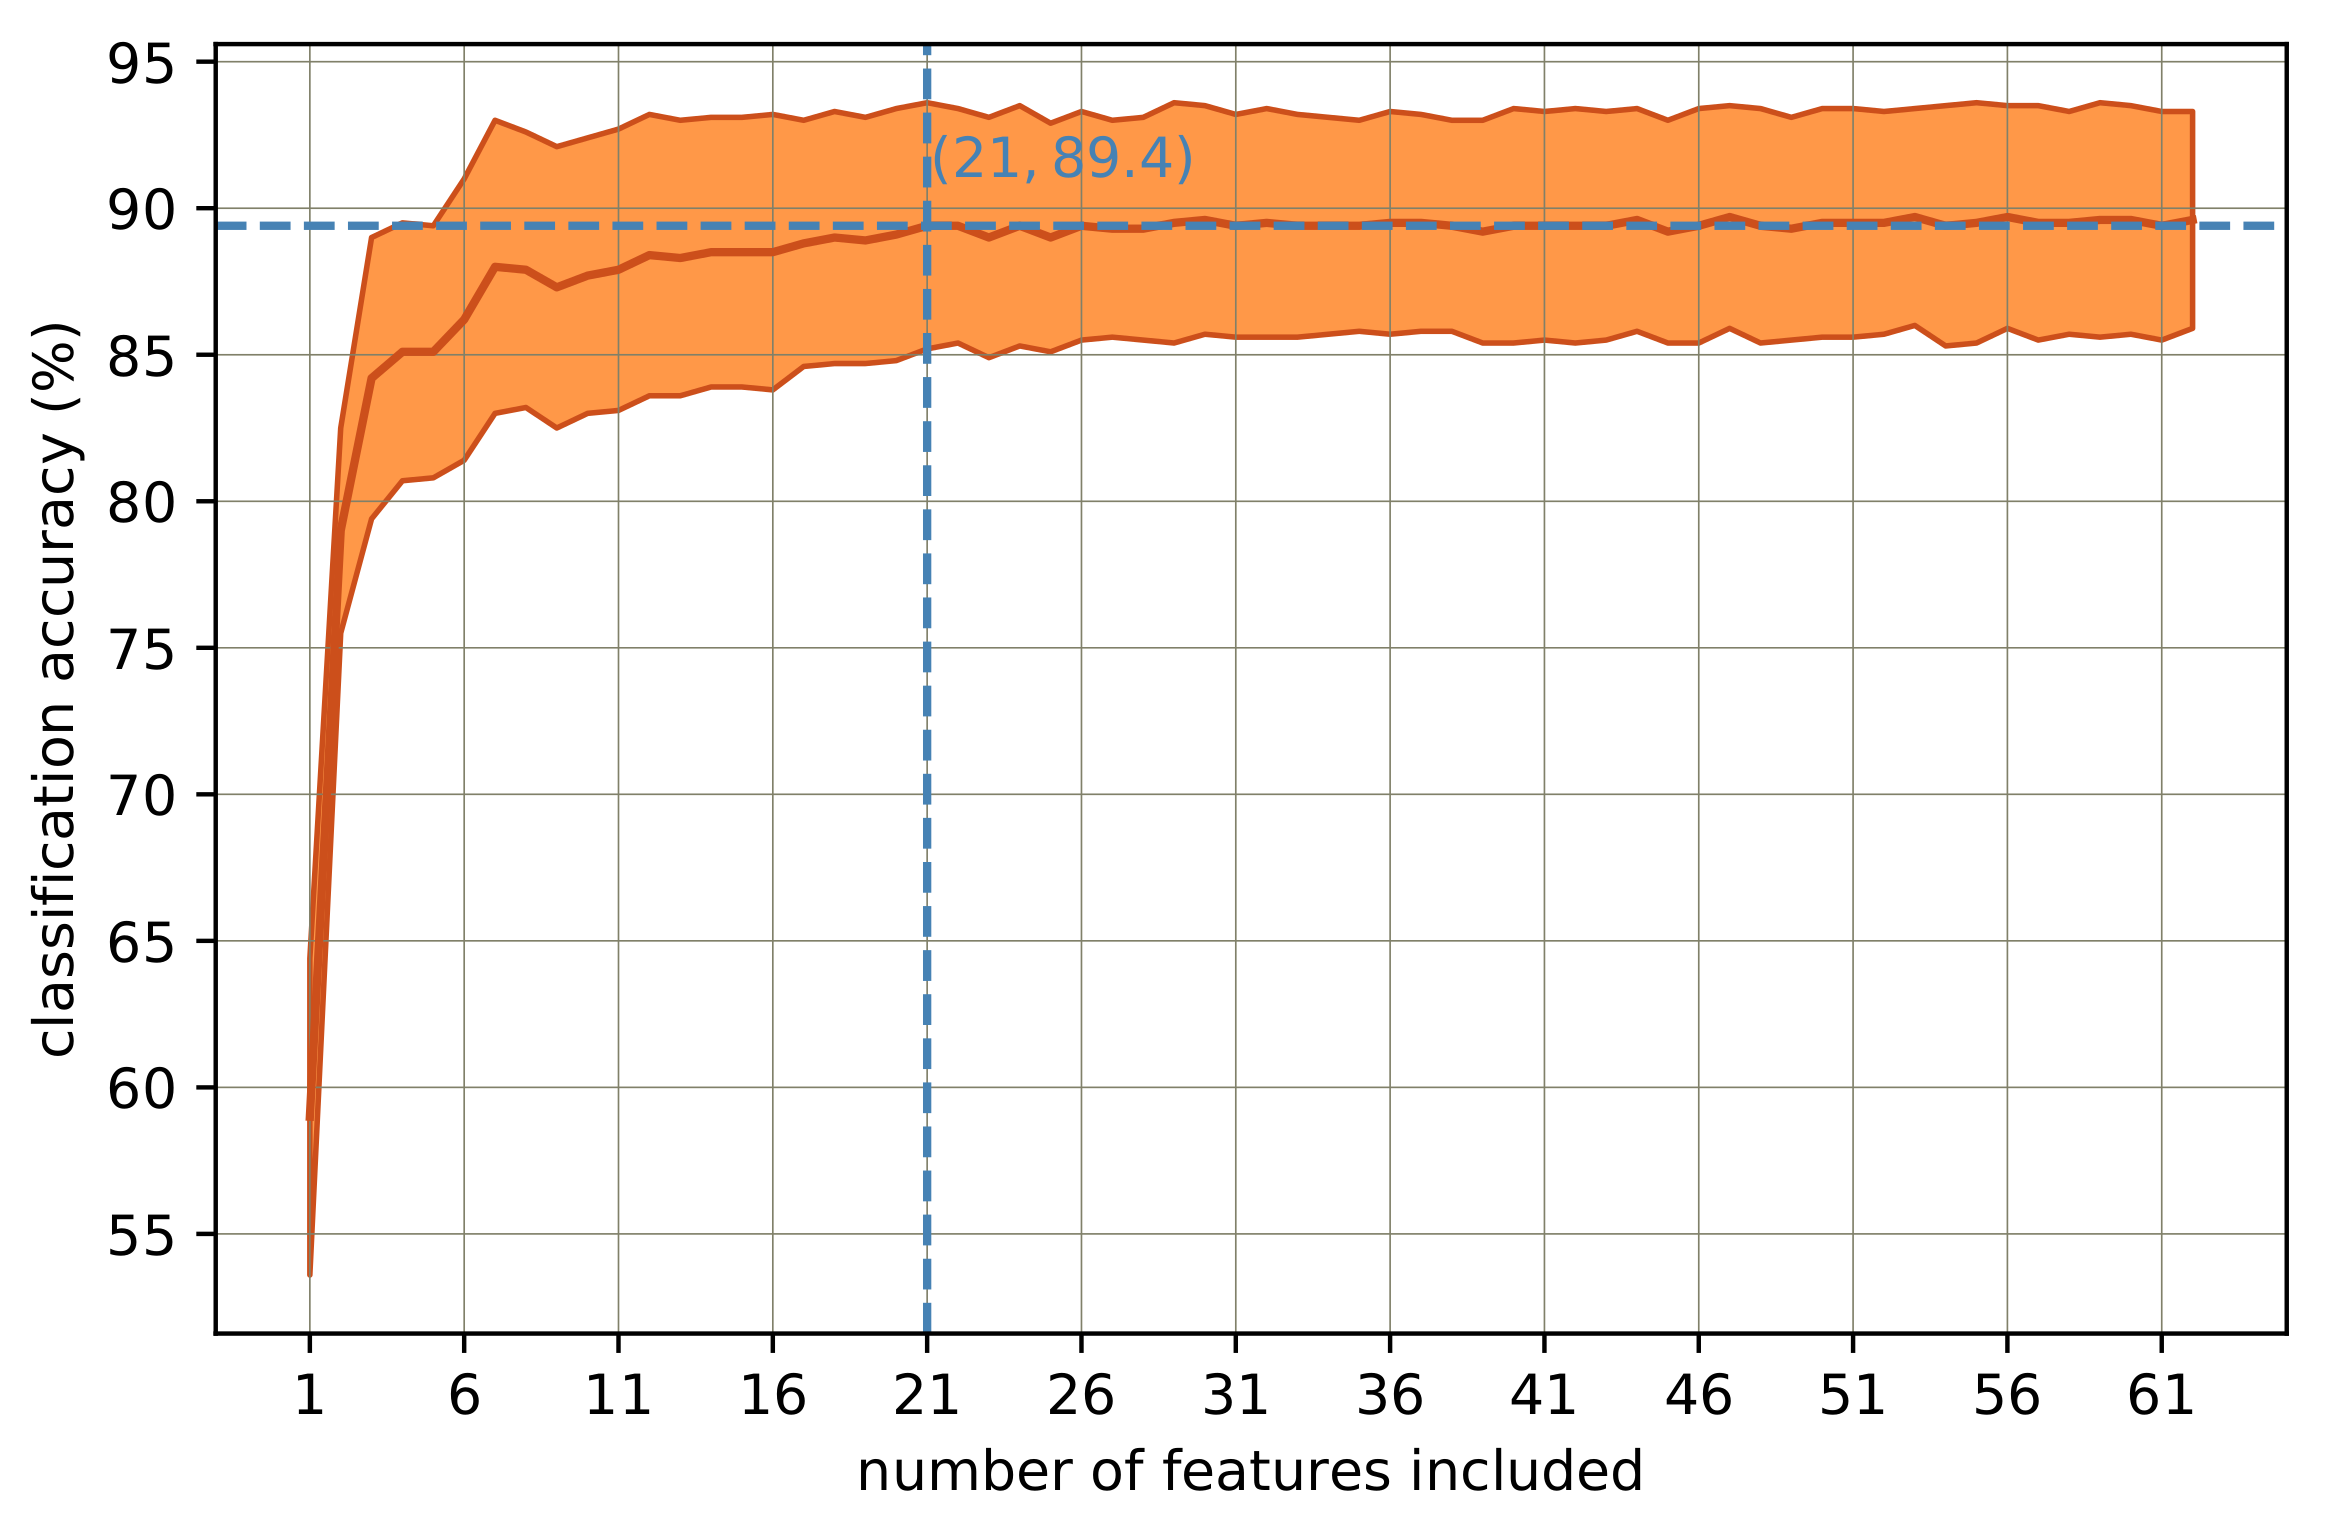
In order to manage feature reduction, the feature importance score of the RF classifier was used. To avoid biased scores [
7,
20], first highly correlated pairs of features were identified, and from each pair, one feature was excluded from the feature set. Next, a huge forest with 10,000 trees was trained on the data [
7]. It should be noted that there was no categorical variable in the feature set, which would have biased the scores. All the features were transformed to zero-mean and unit-variance prior to training the classifier. Using the importance scores, a shrunken feature set of only 21 features was obtained. The confusion matrix of classification with the selected 21 features is depicted in
Figure 6. Comparing the confusion matrices in
Figure 3 and
Figure 6, there is no considerable accuracy deterioration owing to feature reduction. The 21 features presented in
Table 2 can be therefore replicated for similar purposes.
Weaknesses, Strengths and Future Work
One of the weaknesses of this study is having a homogeneous and relatively small sample of young subjects. Moreover, the study protocol is lacking activities such as walking and running mostly due to the fact that the primary aim of the study was testing a set of home-specific activities. Classification rates could benefit from second-by-second labels instead of one label for the whole duration of each activity. Activities like dish-washing and table cleaning are composed of short segments of standing still, as well. Having second-by-second labels would allow reducing the misclassifications of these kinds of activities.
The strengths of the study include data collection in a real home environment with very little administrative restrictions on the users. This has led to closer to reality data and more generalizable results. The reproducibility of the study is quite high as the activity recognition was done exploiting only one off-the-shelf wrist-worn device. No data cleaning or filtering of any kind was done on the data before signal segmentation. Such an approach requires less computation and therefore lower latency for real-time applications. In plenty of similar studies, the data at the beginning and the end of the tasks were discarded, while in this study, we tended to keep all of the data, which makes the classification more challenging. The results shown in this study were all acquired with leave-one-subject-out cross-validation, which is an unbiased validation approach that provides subject independent validations.
The future work could include implementing an adaptive window length selection approach that shortens the signal segments at the time of transitions from one task to another. This will probably lead to higher classification rates. In addition, the classification accuracy could benefit from employing different window lengths for different parameters, as the ACC and HR features have quite different dynamics. Furthermore, in the future, it would be worth trying to implement and test the proposed framework on embedded systems and observing the performance when it is used for real-time activity recognition.


