Structural Health Monitoring of a Composite Panel Based on PZT Sensors and a Transfer Impedance Framework


Air Force Institute of Technology, ul. Ks, Boleslawa 6, 01-494 Warszawa, Poland
*
Author to whom correspondence should be addressed.
Sensors 2018, 18(5), 1521; https://doi.org/10.3390/s18051521
Submission received: 13 March 2018
/
Revised: 7 May 2018
/
Accepted: 8 May 2018
/
Published: 11 May 2018
(This article belongs to the Special Issue Sensor Technologies for Health Monitoring of Composite Structures)
Abstract
:One of the ideas for development of Structural Health Monitoring (SHM) systems is based on excitation of elastic waves by a network of PZT piezoelectric transducers integrated with the structure. In the paper, a variant of the so-called Transfer Impedance (TI) approach to SHM is followed. Signal characteristics, called the Damage Indices (DIs), were proposed for data presentation and analysis. The idea underlying the definition of DIs was to maintain most of the information carried by the voltage induced on PZT sensors by elastic waves. In particular, the DIs proposed in the paper should be sensitive to all types of damage which can influence the amplitude or the phase of the voltage induced on the sensor. Properties of the proposed DIs were investigated experimentally using a GFRP composite panel equipped with PZT networks attached to its surface and embedded into its internal structure. Repeatability and stability of DI indications under controlled conditions were verified in tests. Also, some performance indicators for surface-attached and structure-embedded sensors were obtained. The DIs’ behavior was dependent mostly on the presence of a simulated damage in the structure. Anisotropy of mechanical properties of the specimen, geometrical properties of PZT network as well as, to some extent, the technology of sensor integration with the structure were irrelevant for damage indication. This property enables the method to be used for damage detection and classification.
1. Introduction
Application of elastic waves is one of the most universal approach to non-destructive testing of materials [1]. For excitation and detection of elastic waves, materials which exhibit piezoelectric properties need to be used [2]. Commonly applied as elastic waves actuators and sensors are transducers based on lead-zirconate-titanate (PZT) ceramics, i.e., PZT transducers [3,4]. Also, for over two decades now, PZT transducers have been applied to Structural Health Monitoring [5,6,7]. Elastic waves can interact with damages of different types [8], also they can propagate over long distances from their source, e.g., a PZT actuator. Therefore, sparse networks of PZT transducers can be used for monitoring relatively large structures, independently of the material used for manufacturing the structure. Due to those properties, PZT transducers have found a variety of applications in SHM. They can be applied to:
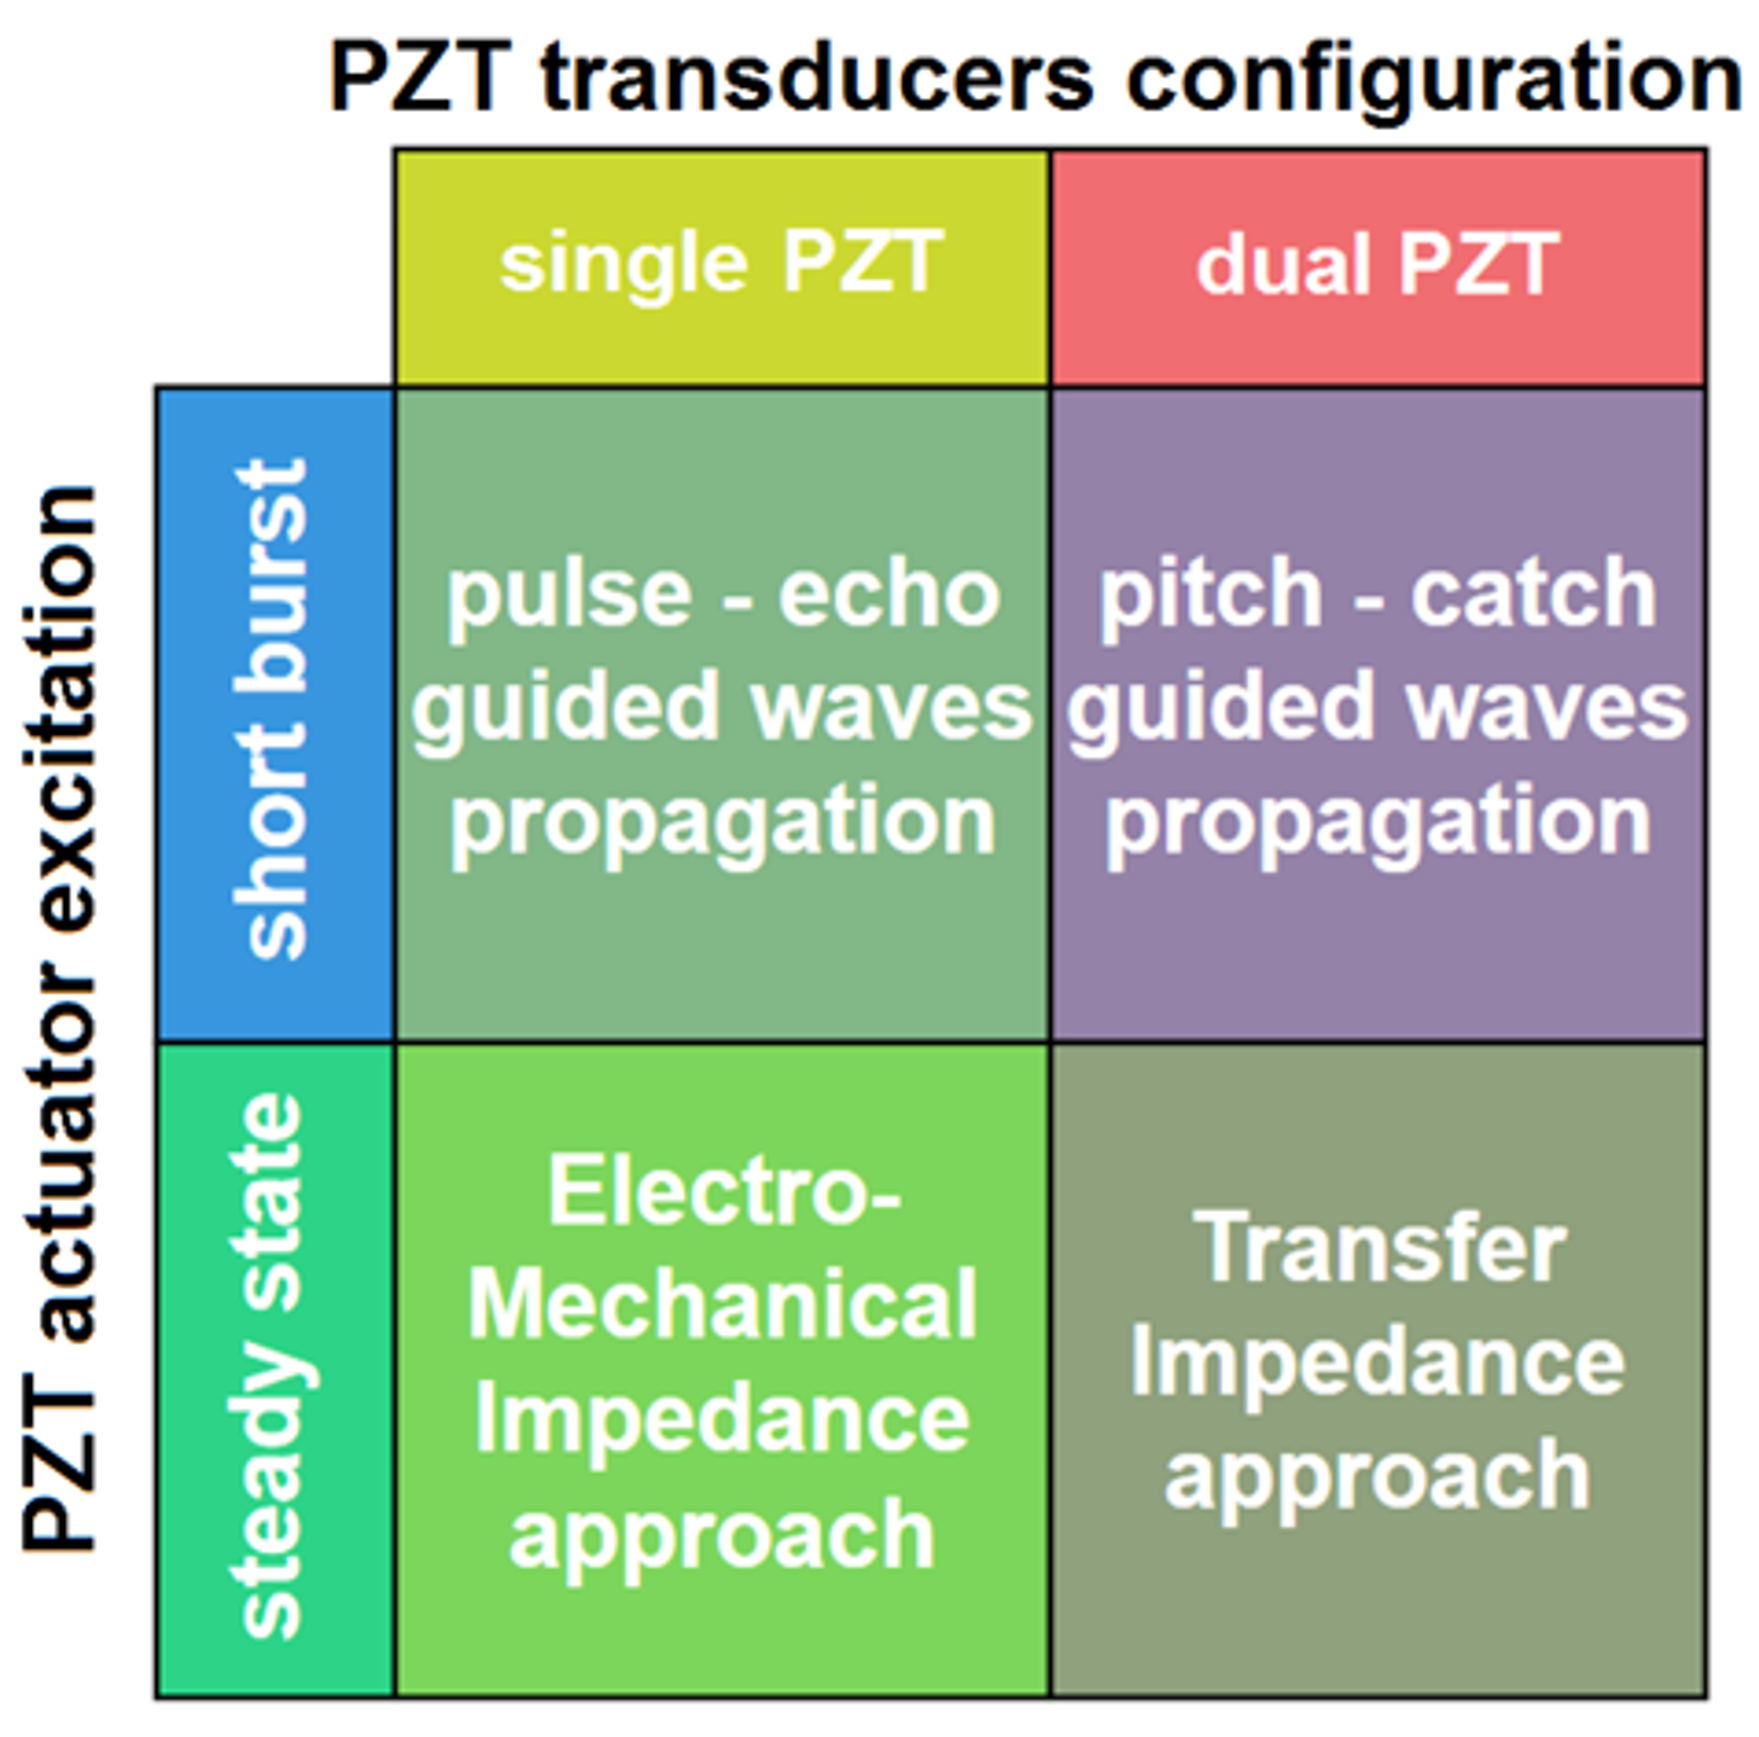
The application of PZT sensors to SHM is always based on the propagation of elastic waves, usually Lamb waves, through a monitored structure [5,6,7,8]. However, four different setups of PZT transducers can be distinguished in applications. There are two factors allowing for distinction between the setups [5,6,38,39]:
- the configuration of the PZT transducers;
- the way how the PZT transducer used for elastic wave excitation, i.e., the PZT actuator, is sourced with voltage.
The terminology of this distinction adopted for the purpose of this article is presented in Figure 1.
The first factor which can be considered when using PZT transducers for SHM purposes is their configuration. First, a single PZT transducer can be used for damage detection of structures [6,10,11,20,21]. The transducer has a dual role then—it is a source of elastic waves, i.e., it is a PZT actuator, but it is also a receiver of waves scattered and reflected from structure discontinuities surrounding the transducer, i.e., it is a PZT sensor. Waves reflected from a damage of a finite size decay with the distance from it [4], therefore whether they can be detected by a PZT transducer depends on the distance of the damage from it. Also, pairs of PZT transducers can be used for structure monitoring—one of the transducers is exciting elastic waves, i.e., it is a PZT actuator, whereas the second one is receiving them, i.e., it is a PZT sensor [5,12,13,15,16,17,18,38]. If pairs of PZT transducers are used, the so called transmission mode of elastic wave interaction with a damage can be utilized in addition to the reflection mode [8]. Elastic waves propagating between PZT actuator and PZT sensor can be distorted during their transmission through the encountered damage. Due to this phenomena, the signal acquired by the PZT sensor can be changed. Signal changes should occur irrespective of the distance between the PZT actuator and the PZT sensor, as long as damage is big enough to cause significant transmission effects.
According to the scheme presented in Figure 1, the second factor which defines the approach to SHM is the type of PZT actuator excitation. The actuator can be sourced with a short pulsed or steady state sinusoidal voltage. In the first case [5,13,14,15,16,23,24,38], the voltage on the PZT sensor is acquired over a certain period. For the pulse-echo wave propagation approach, i.e., a single PZT transducer excited with a short pulsed voltage, the acquired signal is due to waves reflected from structure discontinuities surrounding the transducer. For the pitch-catch wave propagation approach, i.e., if a PZT actuator—PZT sensor pair is used, the voltage on the sensor is induced by waves transmitted directly between PZT transducers as well as waves reflected from structure discontinuities located within the sensing range of the transducers. If a PZT actuator is sourced with a steady state sinusoidal voltage, then the current flow or the induced voltage on PZT sensor are used for structure assessment. Both type of response signals measured on a PZT sensor are of sinusoidal type and have the same frequency as the voltage applied to the PZT actuator. The amplitude ratio and the phase shift between the response signal and the voltage applied to the PZT actuator can be can changed due to interaction of excited elastic waves with a damage, therefore they can be useful for damage detection. The frequency sweep of the PZT actuator excitation is used, in order to obtain response signal characteristics in a broad bandwidth since different type of damage can influence the signal for different frequency range. For the Electro-Mechanical Impedance approach [6,10,11,20,21,22], i.e., when PZT transducer is both the actuator and the sensor, only the current flow can be used as the response signal. For the Transfer Impedance approach [17,40,41,42,43] both types of response signals acquired by the PZT sensor are eligible to be used for structure assessment.
In this article a method of structure monitoring based on the Transfer Impedance (TI) approach is presented. For the purpose of structure assessment, a set of Damage Indices (DIs) is proposed, based on the voltage induced on PZT sensor. The proposed DIs maintain the same information about the structure as the response signal, therefore all of the damage detection capabilities of the TI approach should be preserved by the proposed method. The properties of the proposed DIs were investigated experimentally. In particular, repeatability of damage indication for an anisotropic medium was verified—a GFRP composite panel was used as a test specimen in the experiment. Also, comparison of the methods performance for PZT transducers embedded into the composite structure and attached to the specimen surface is presented in the article.
The rest of the article is organized as follows: in the next section the description of the proposed method for structure monitoring is provided. It is followed by a detailed description of the experimental design, including the equipment used for the study. Then, the main findings of the research and conclusions are presented.
2. Materials and Methods
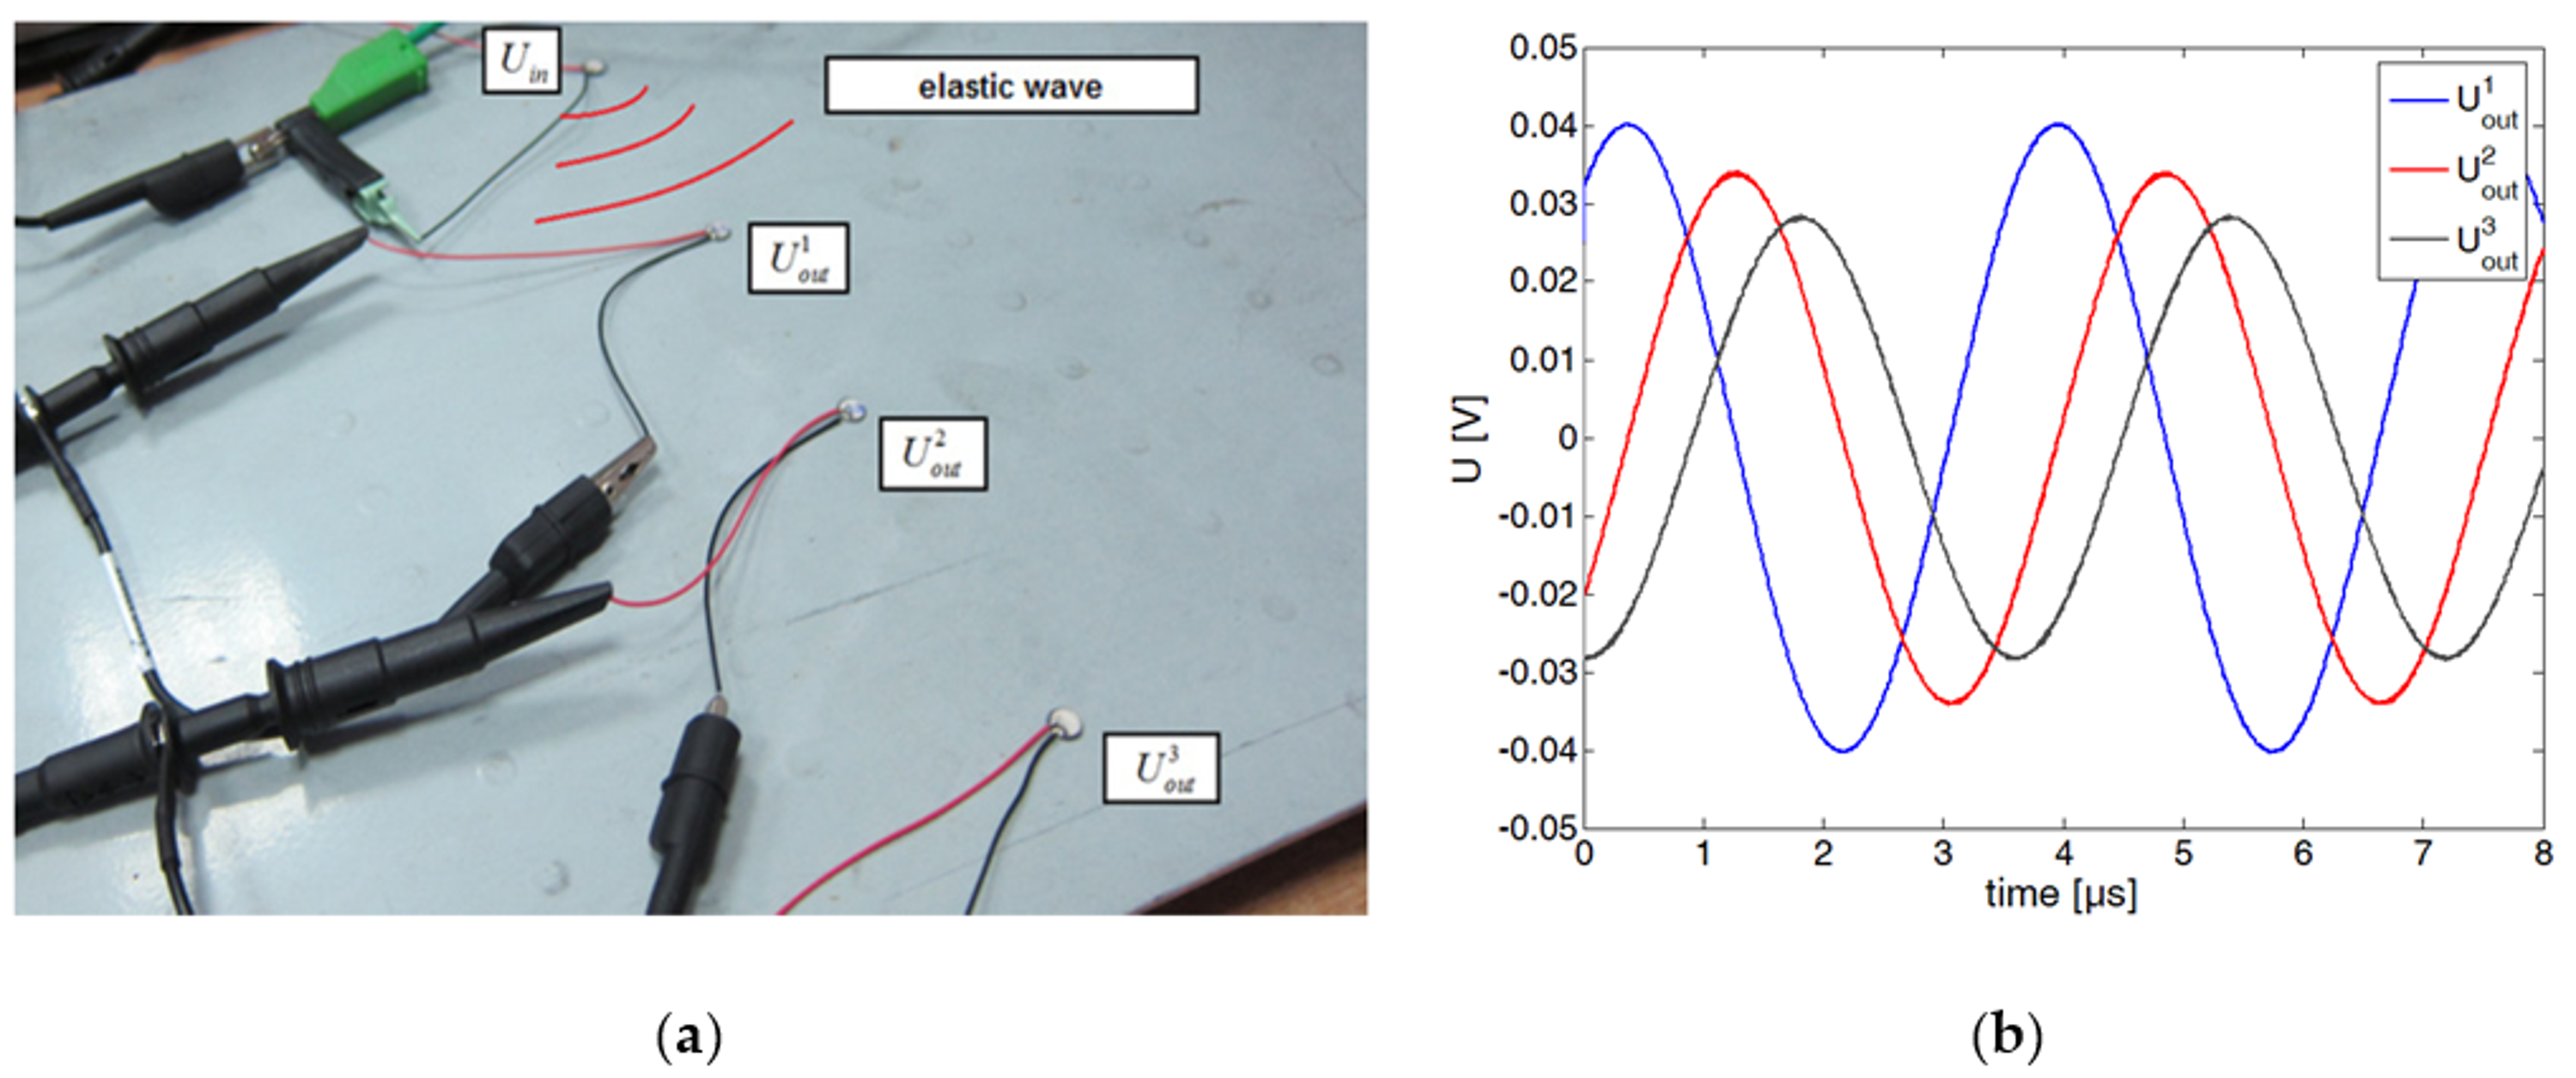
As mentioned in the introduction, one of the methods for PZT transducer application to damage detection is to apply a sinusoidal steady state voltage to a PZT actuator and measure the voltage on a PZT sensor, which is induced by elastic waves propagating between the PZT actuator—PZT sensor pair. In Figure 2, an example of voltage signals , are presented, which were obtained for three different PZT sensors receiving elastic waves excited by an actuator sourced with sinusoidal voltage . If a sinusoidal voltage— is applied to PZT actuator, then the induced voltage on the sensor— is also sinusoidal and has the same frequency as . Thus the ratio:
called the transfer function [17,41], does not depend on time and it can be written in complex form as:
where , denote respectively—the amplitude ratio and the phase difference between output and input signals for a given frequency . Equivalently, the transfer function can be written using its real and imaginary part as:
where:
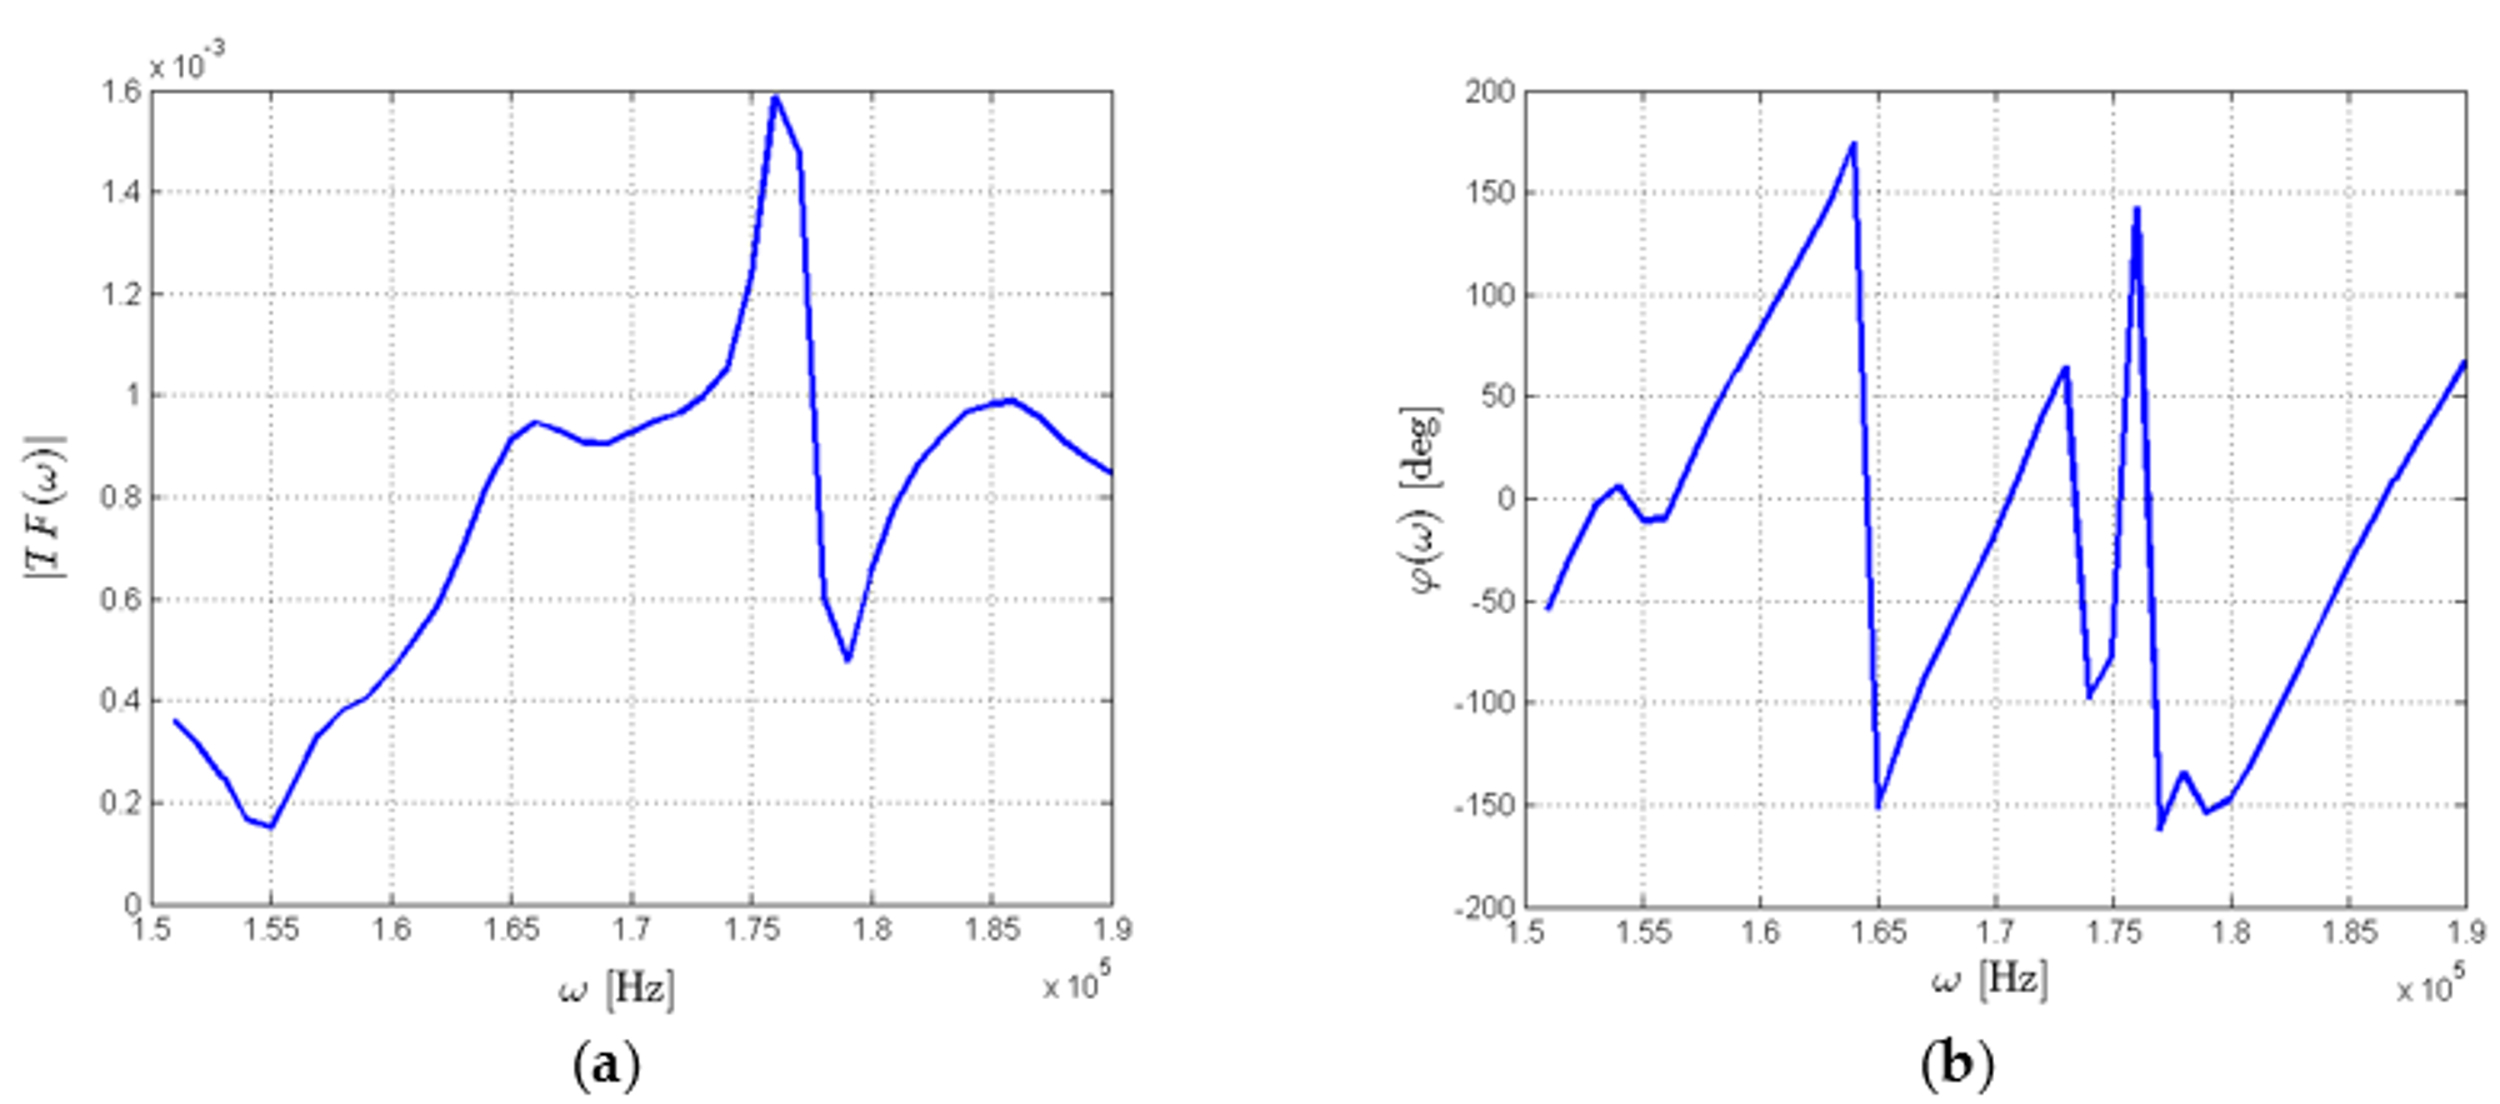
This transfer function is to a large extent invariant with respect to disturbances of the excitation voltage , which is one of its advantages. However, its direct use is of limited usability for structure assessment due to complex dependence of on the frequency of the excitation signal . As an example, components of transmission function obtained for a simple structure are presented in Figure 3.
Both components of —its amplitude and the phase—carry the information about mechanical properties of the structure within the sensing range of a given pair of transducers, but also depend on other factors, e.g., the properties of the PZT transducers used or the distance between them. Taken together, this results in a nontrivial behavior of the transfer function with respect to the frequency of the voltage applied to the PZT actuator.
Therefore, the state of the structure is usually assessed using some comparative signal characteristic, called the Damage Index (DI). DIs measure the difference between transfer function obtained for the actual state of the structure and the baseline transfer function , obtained for the initial state of the structure. Usually, DIs are based on real or imaginary part of transmission functions, e.g., they can be written as [5,6,19,37]:
where Ω is the bandwidth of the excitation signal and denotes the correlation coefficient between real parts of the actual and the baseline transmission functions. Such DIs project all of the information contained in the transmission function to a single value. DI values should represent the scale of difference between transmission functions obtained for the two states of the structure. If there is no change in the signals, values of DIs are usually supposed to be close to zero, whereas if damage is present, their values should be significantly different than zero.
In this paper, it is proposed to intertwine real and imaginary parts of transmission function and to consider the complex quotient as DIs:
where and denote the components of the baseline transfer function . Equivalently, the proposed DIs can be written as:
where:
Assuming, that the voltage on the generator is the same for , , the modulus of DIs satisfies the following relation:
therefore, it describes the ratio between voltage amplitudes induced by elastic waves on the sensor.
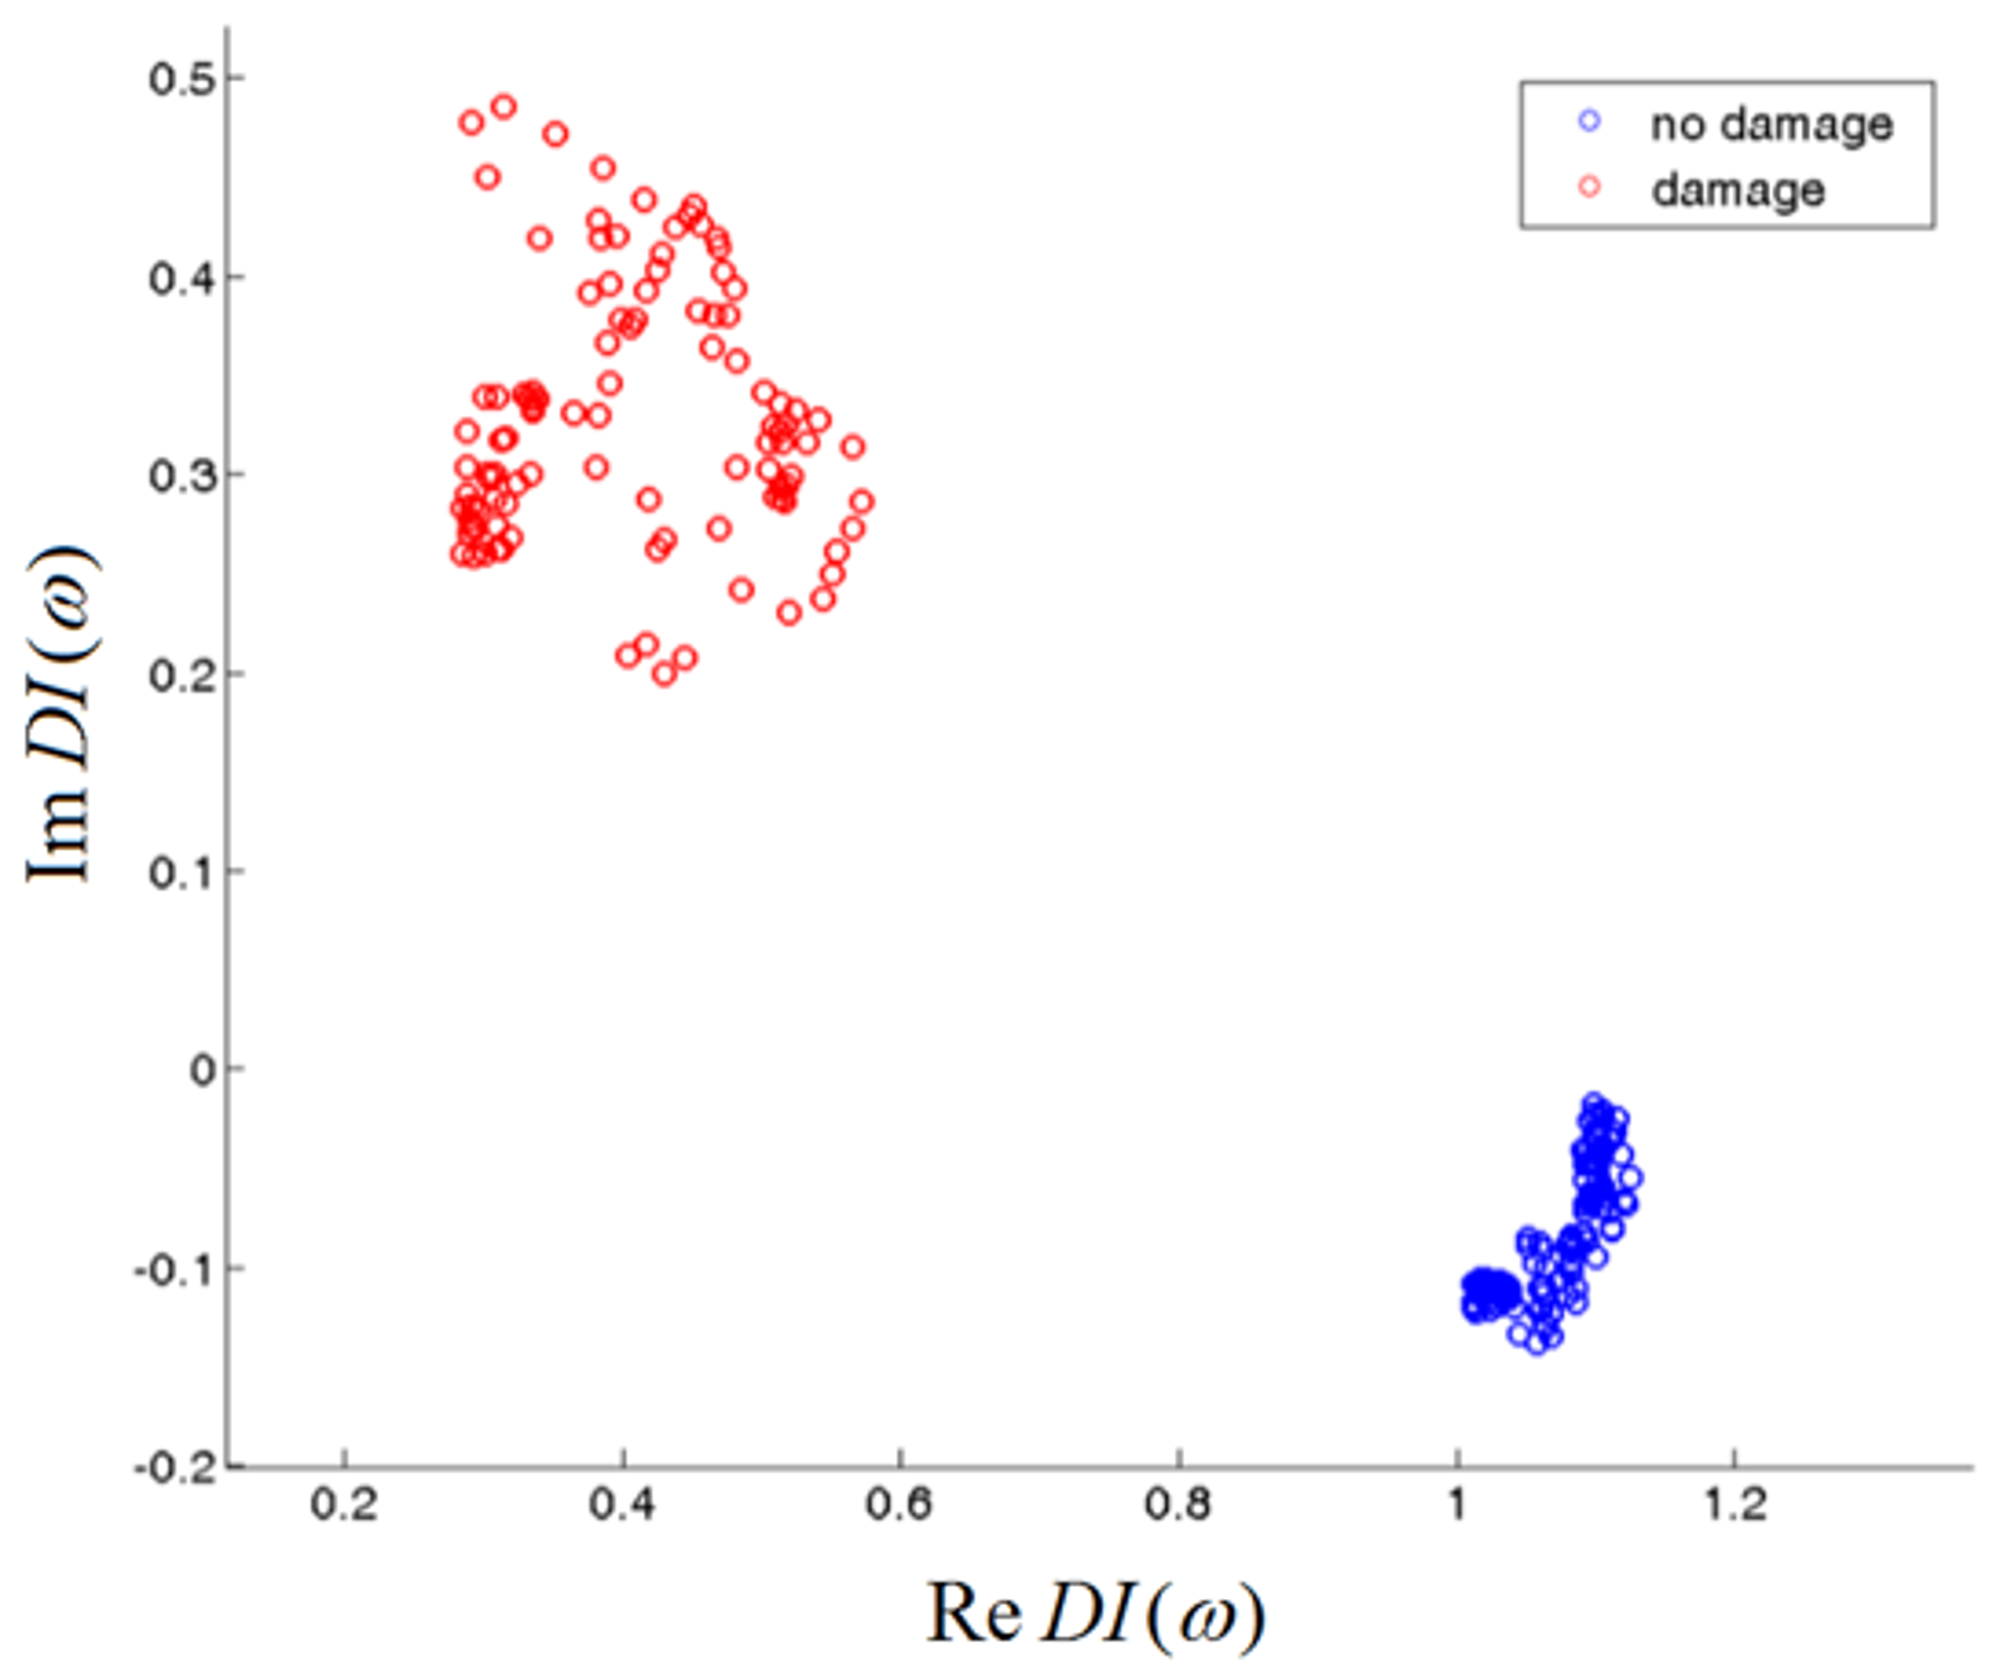
The proposed DIs utilize both components of transmission functions and captures all of the information about the output voltage amplitude and its phase changes. Thus, if a damage of a given type impacts the amplitude of the output voltage or cause its phase shift, it should be captured by the proposed DIs. The type of damage which are detectable by Electro-Mechanical Impedance or Transfer Impedance methods are listed in the introduction. For structure assessment, the DIs obtained for frequencies belonging to a given bandwidth Ω can be represented in the complex plane. In Figure 4 an example of DIs’ behavior obtained for undamaged structure and under damage presence is illustrated. For undamaged structure, the DIs should be concentrated in the vicinity of the point 1 + i0 in the complex plane, irrespectively of the frequency of the excitation. If damage is present, it can change the output voltage amplitude or its phase, therefore DIs should diverge from the point 1 + i0 (Figure 4).
In the presented example all of the frequencies were influenced by a damage, therefore a single frequency could be used for structure assessment in this case. However, it is not necessary to limit the data and to use DI value obtained at a given frequency for the purpose of damage detection. Rather DIs’ behavior obtained for a range of frequencies should be used as it is better suited for damage detection and classification. It is possible that damage of a certain type would affect the DIs only in a limited frequency range. In such case two groups of data would be formed in the complex plane: the DIs obtained for frequencies not sensitive to damage would be close to the point 1 + i0, whereas DIs influenced by damage would be separated from it. In this way optimal range of frequencies for the purpose of damage detection could be established.
Also it is possible that damages of different types could be located at different domains in the complex plane. In this case it would be possible to classify type of damage based on DIs’ behavior using statistical methods of data classification, e.g., nearest neighbor algorithm or linear discriminant classifier [37]. This is hard to achieve using classical DIs, as presented in the Equation (5), since all of the information about the amplitude and the phase changes of the response signal is projected to a single value. A necessary condition for classification methods to work properly, is repeatability of DIs indications. DIs should be located at the same region of the complex plane when comparable damage is present within the sensing range of PZT actuator and PZT sensor. This property of the proposed DIs was verified experimentally for a particular type of damage. The obtained results are presented and discussed further within the text.
3. Design and Preparation of the Experiment
This section provides detailed description of the experiment designed to verify basic properties of the Damage Indices proposed in the paper. The outcome of the experiment was assumed to be:
- verification of indications stability for a given sensing path under certain conditions;
- comparison of indications for different sensing paths under certain conditions;
- comparison of method performance for PZT transducers embedded into the composite structure and attached to its surface;
where the sensing path is defined to be a pair: PZT actuator—PZT sensor.
3.1. Specimen and PZT Network Description
The specimen used for the experiment was a GFRP panel made of 16 plies of HCS2401-015—HEXCEL Fiberglass Prepreg (Hexcel Corp., Stamford, CT, USA). The stacking sequence of the layers was [0/45/0/45/0/45/0/45]s. In the symmetry plane of the specimen, a network of SMD05T04R111 PZT discs made by STEMINC Inc. (Doral, FL, USA) was deployed. The diameter of PZT transducers used for the experiment was 5 mm and their thickness was 0.4 mm. After PZT transducer deployment, the specimen was cured in the autoclave in accordance with technical specification of the material used.
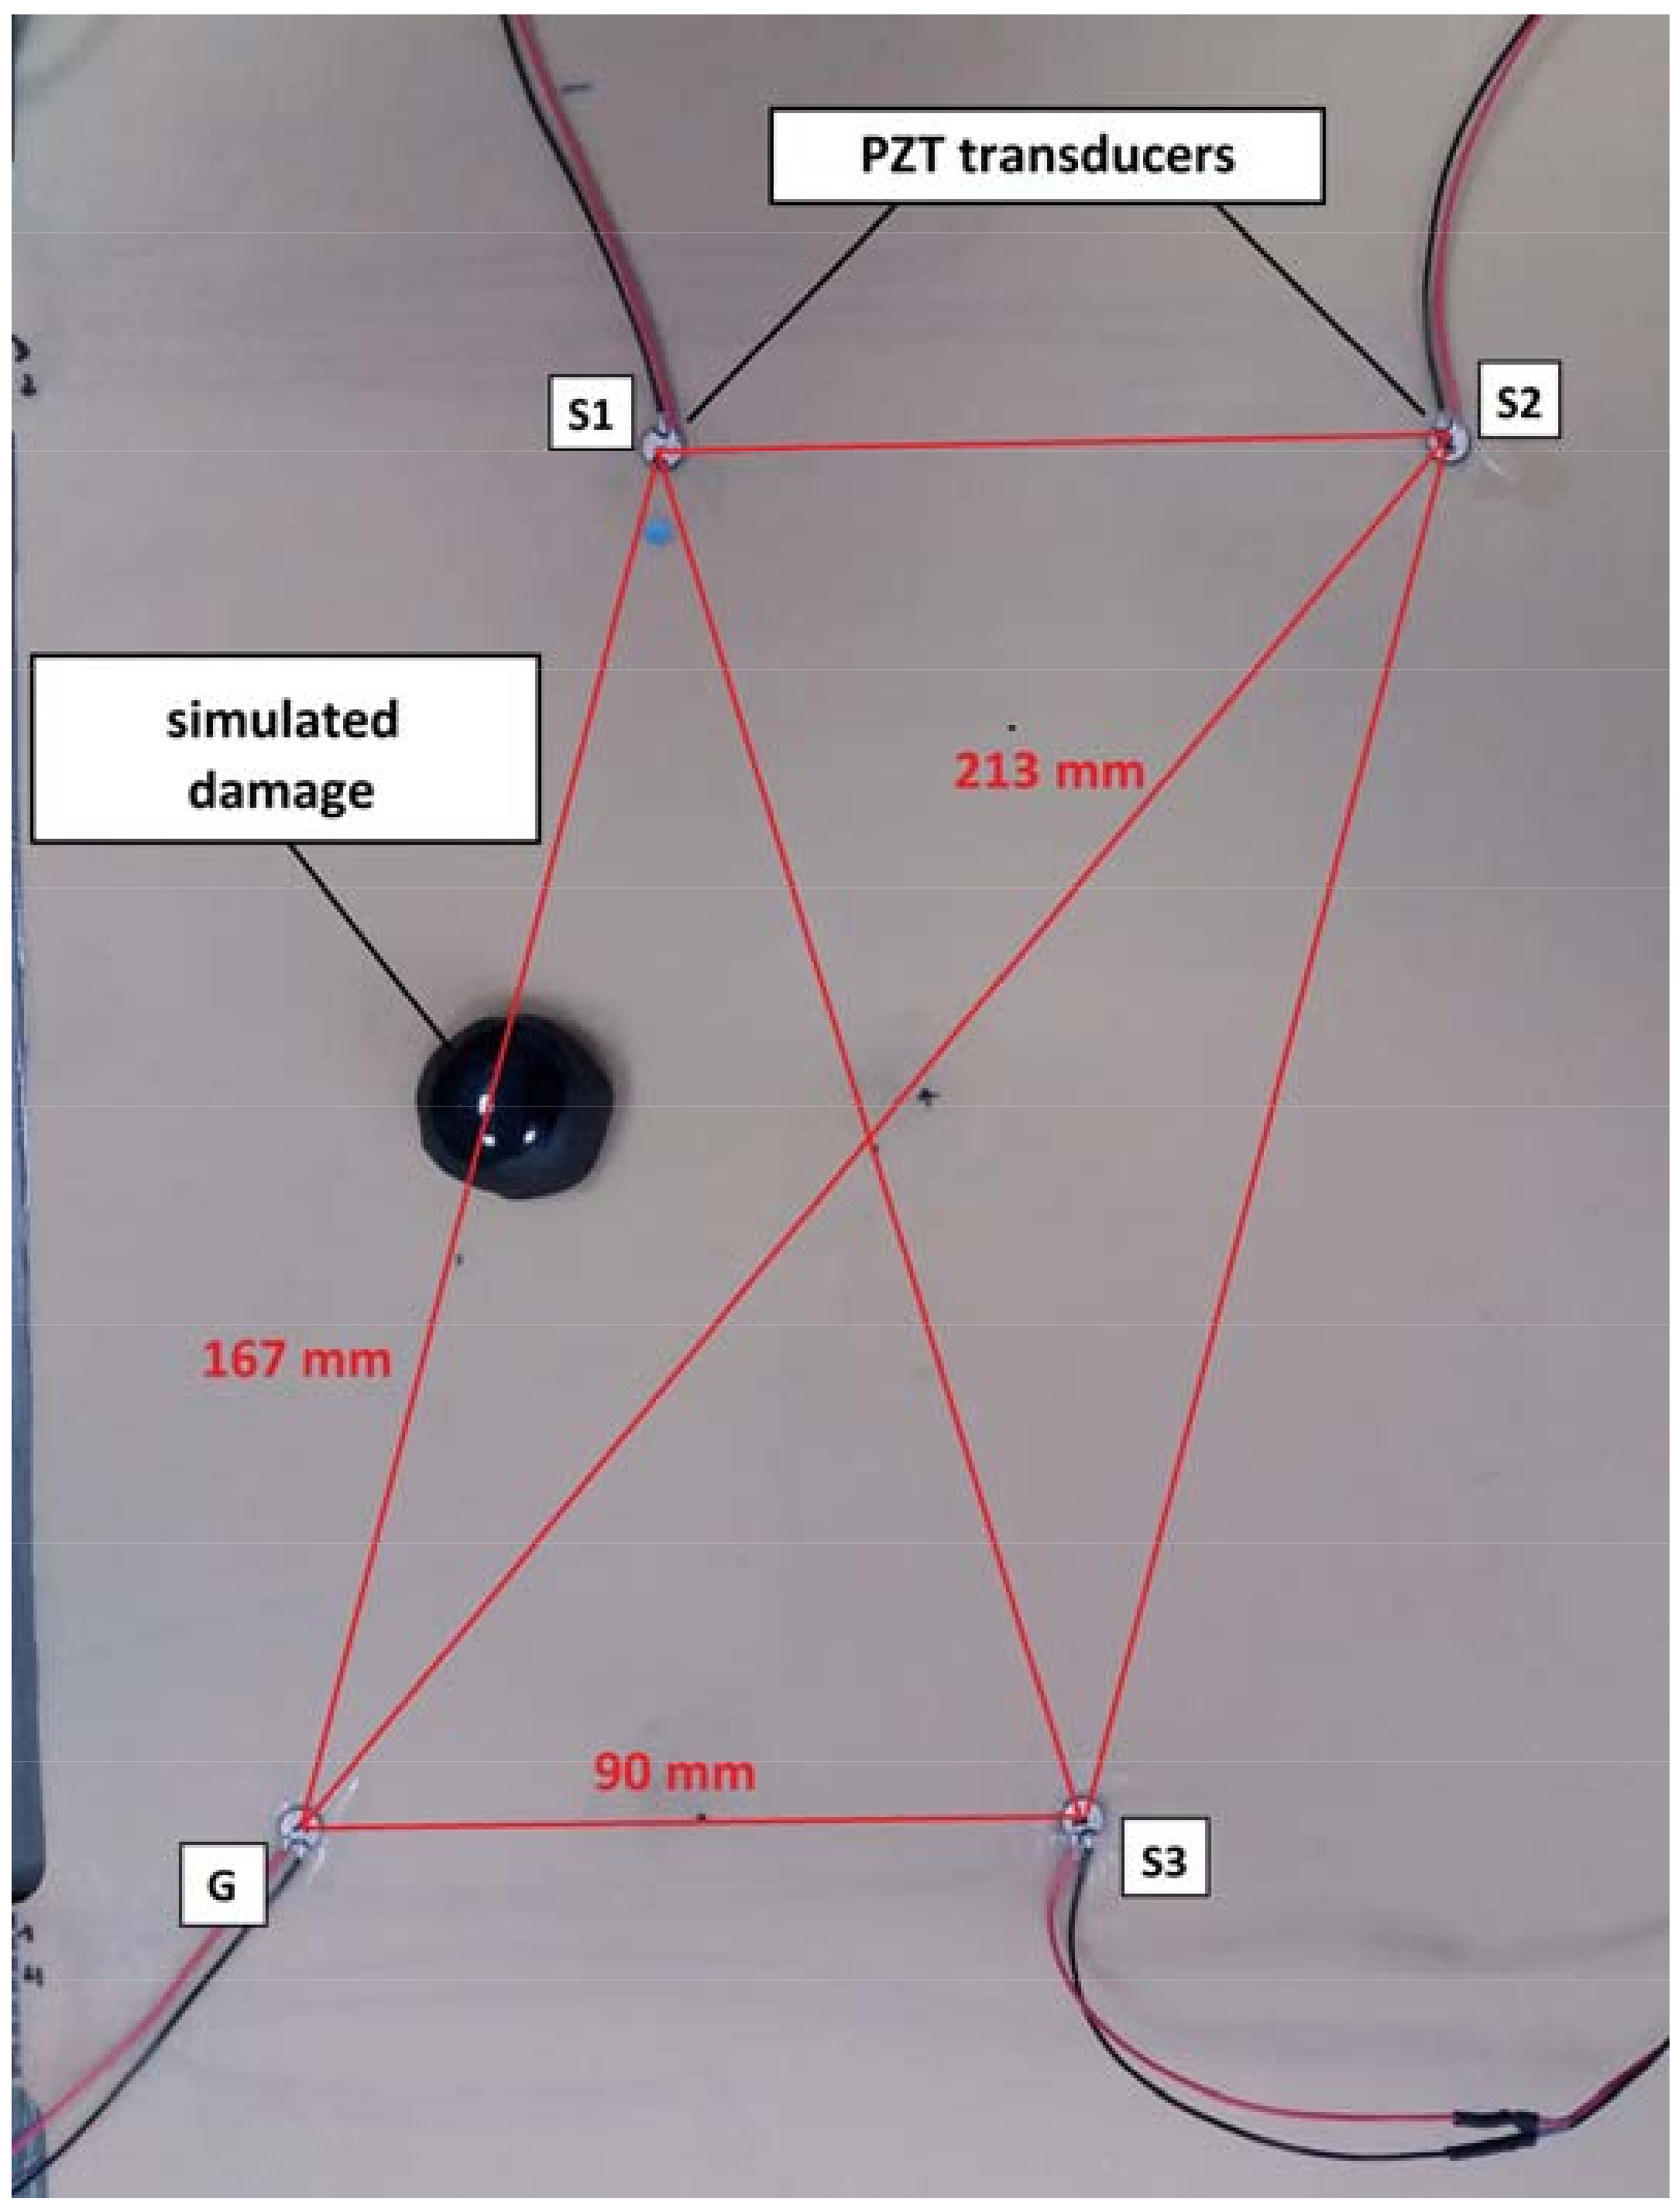
Four PZT transducers of the same type were deployed on the surface of the specimen, precisely above four selected PZT transducers embedded in the specimen structure. The orientation of the attached transducers was maintained the same as for the embedded transducers. In Figure 5 the geometry of the PZT networks is presented. For each network, one of PZT transducers was selected as PZT actuator whereas the remaining three transducers were used as PZT sensors. The positions of the actuator G, and the sensors S1, S2, S3 are indicated in Figure 5. For each network three sensing paths were used (Figure 5):
- G-S1 of the length 167 mm;
- G-S2 of the length 213 mm;
- G-S3 of the length 90 mm.
It is worth noticing that not only the lengths of sensing paths were different in the experiment, but also their orientation with respect to specimens plies and orientation between PZT actuator and PZT sensors. Such configuration of network allows to investigate influence of anisotropy of GFRP specimen and PZT transducers [5] on DIs’ behavior.
3.2. Hardware and Software Description
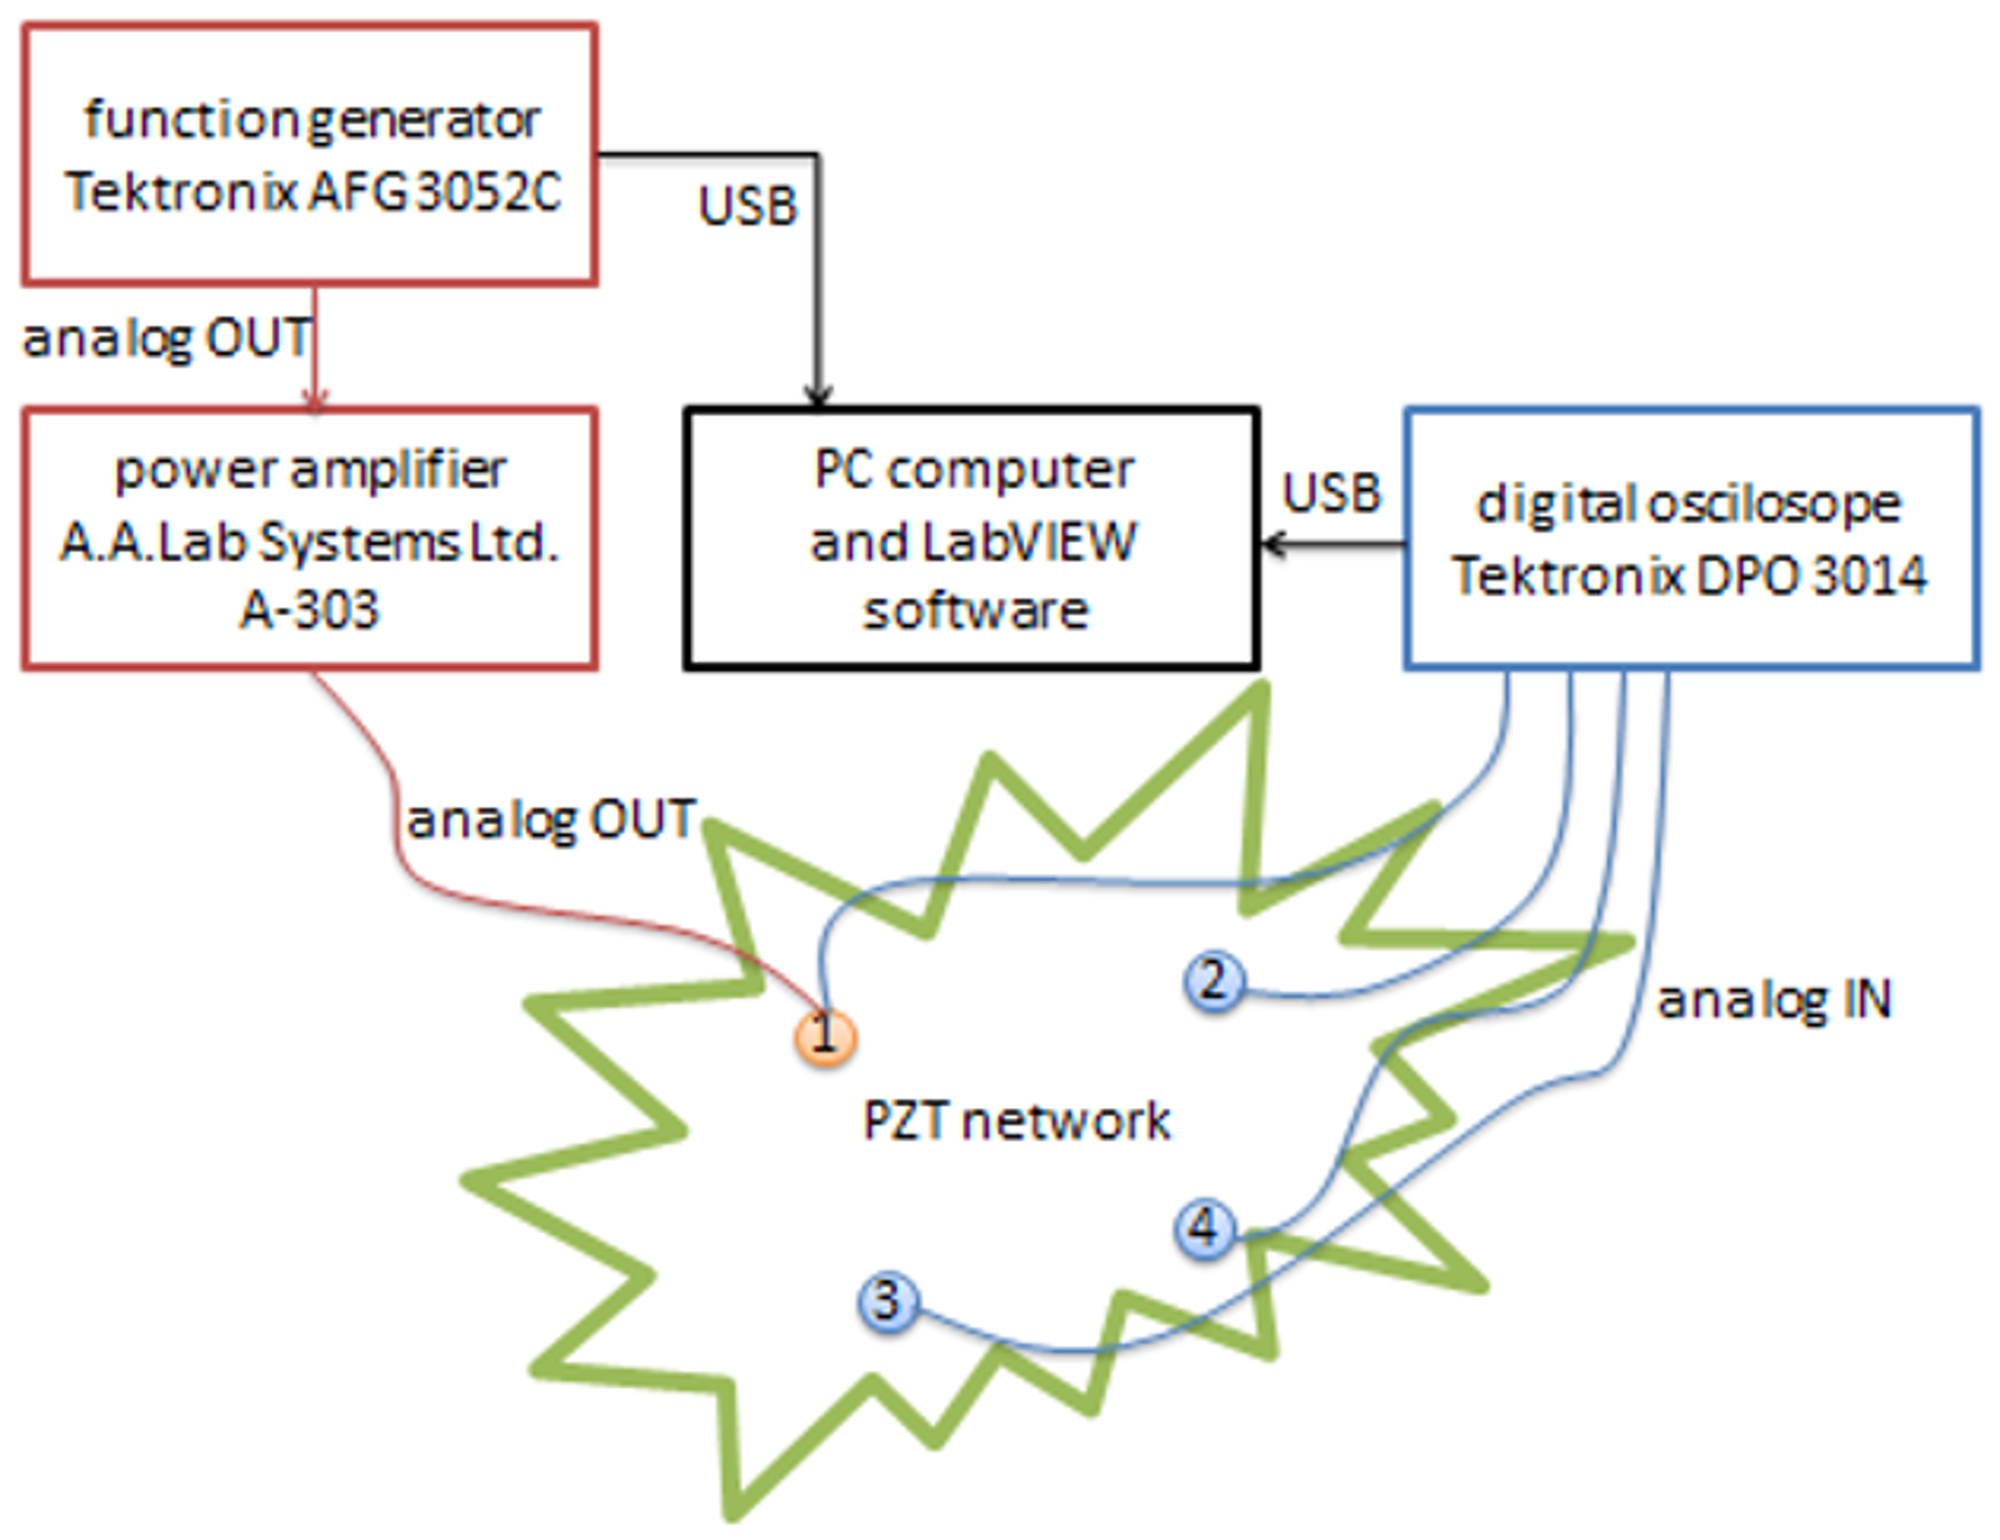
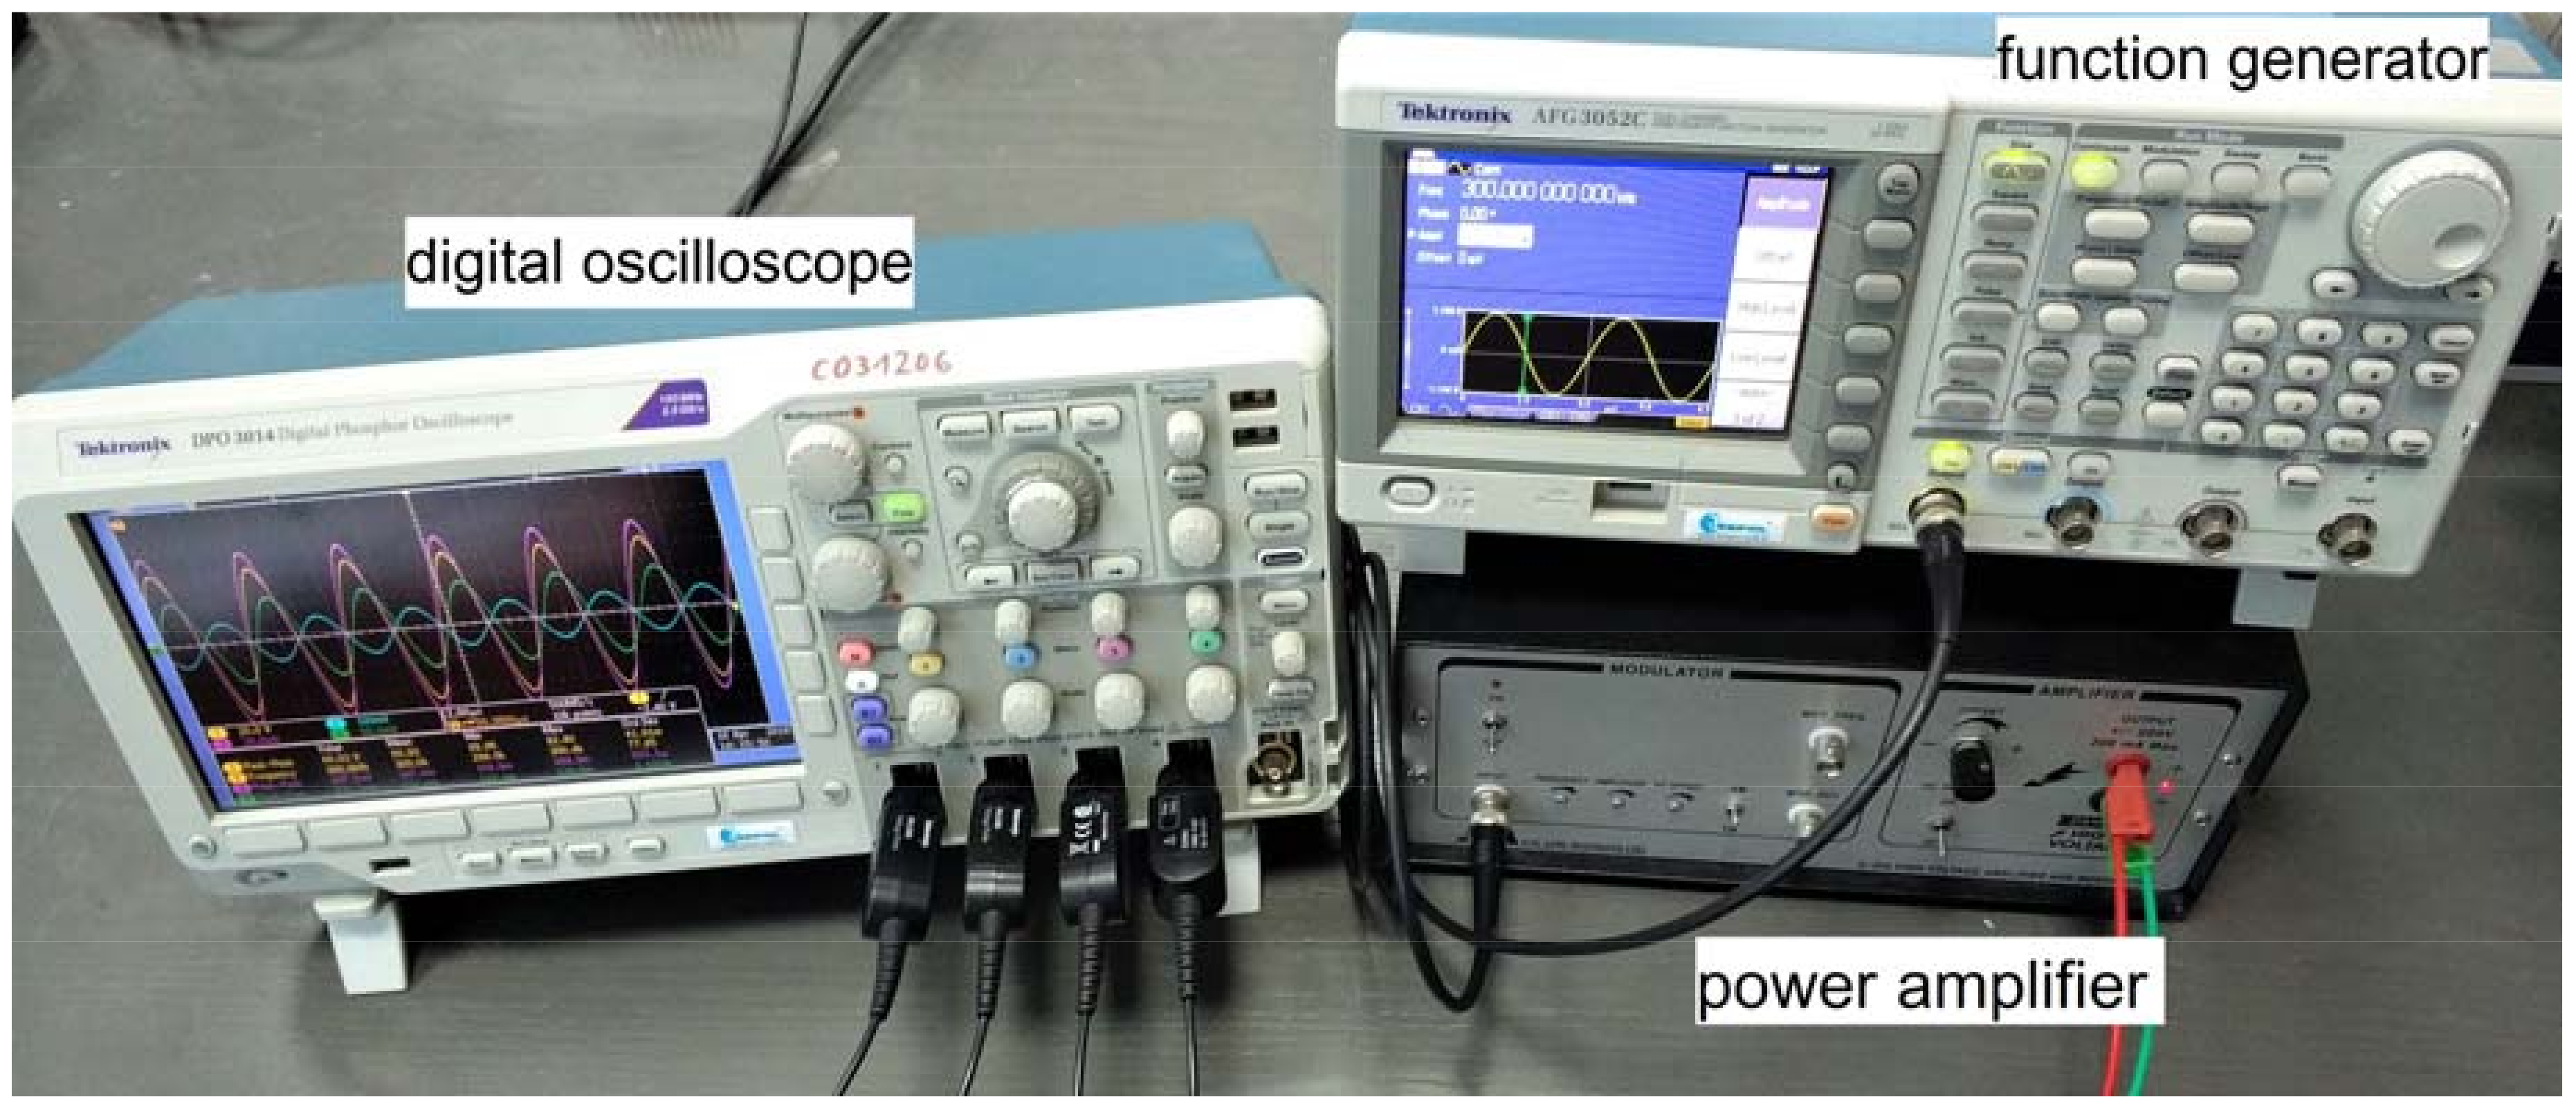
The measurement setup used in the experiment included a PC computer, digital oscilloscope, arbitrary function generator and power amplifier (Figure 6 and Figure 7).
The function generator was used to provide a sinusoidal signal with constant predefined amplitude in a given frequency range. The power amplifier was used for signal conditioning both for the voltage (20×) and for the current (up to 200 mA) in order to operate PZT actuator in the frequency regime where impedance of the actuator is low, i.e., close to the resonant frequency of piezo elements used [2,18]. The digital oscilloscope was used for measuring the excitation voltage on the PZT actuator—G—as well as induced voltage on the three sensors: S1, S2, S3. The devices were connected to a PC computer with an installed LabVIEW environment.
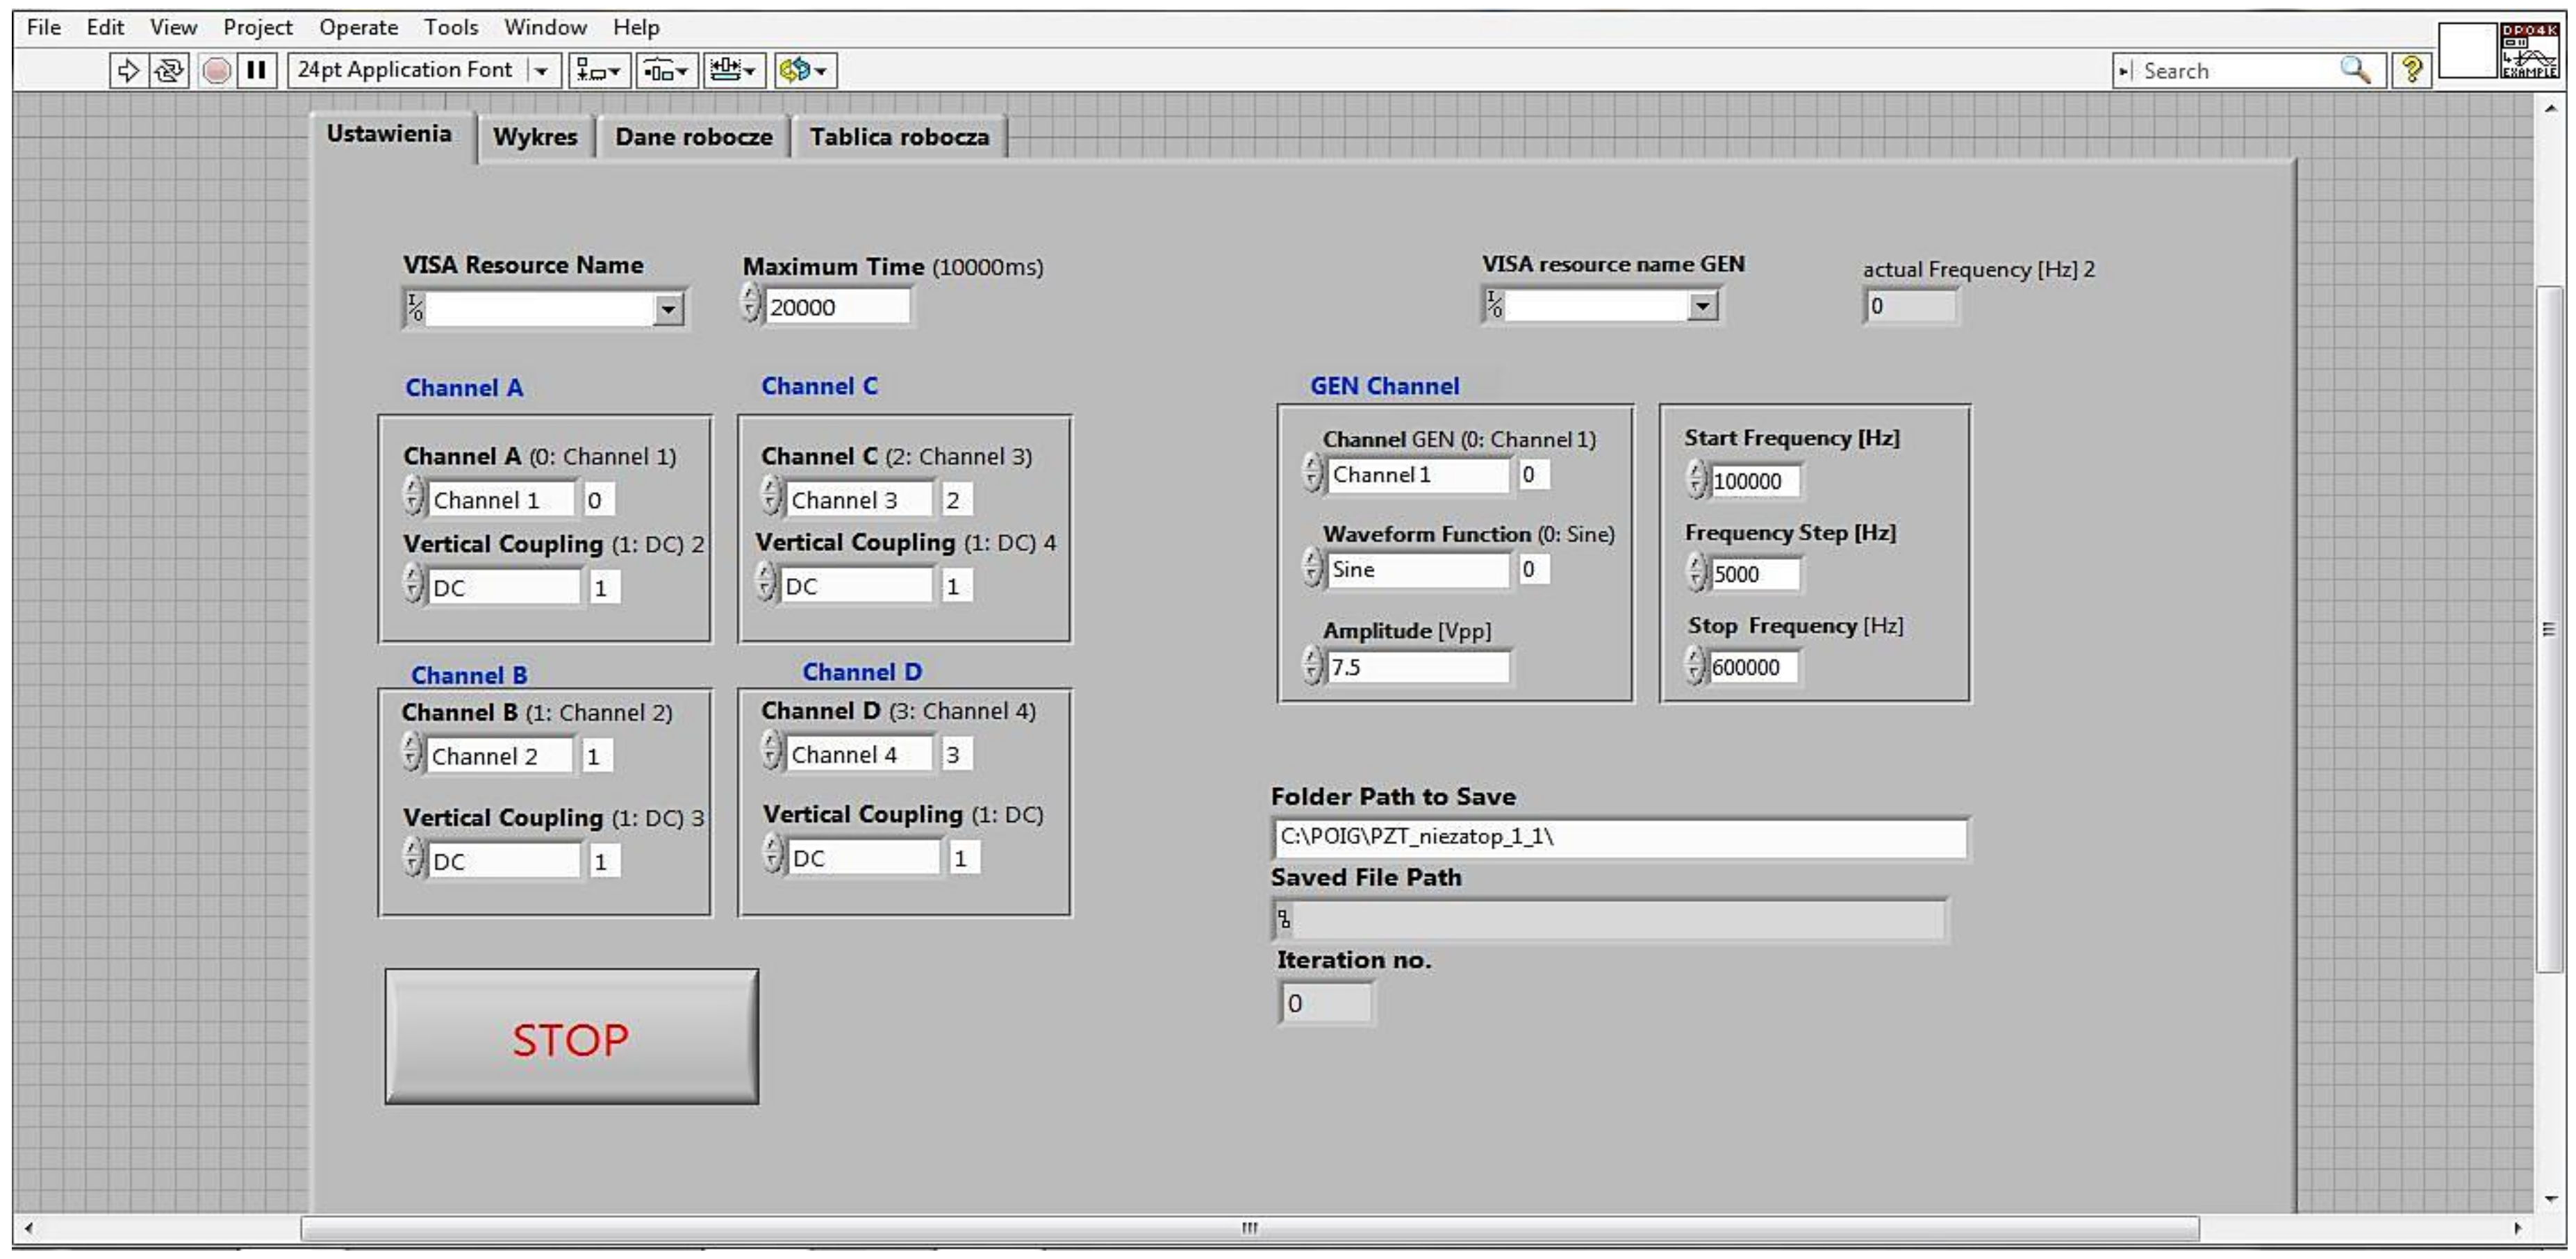
An application in the LabVIEW environment was developed, which allowed automatization of the measurement process, configuration and synchronization of the devices, as well as visualization and storage of the acquired data. In Figure 8, the setup panel of the application is presented.
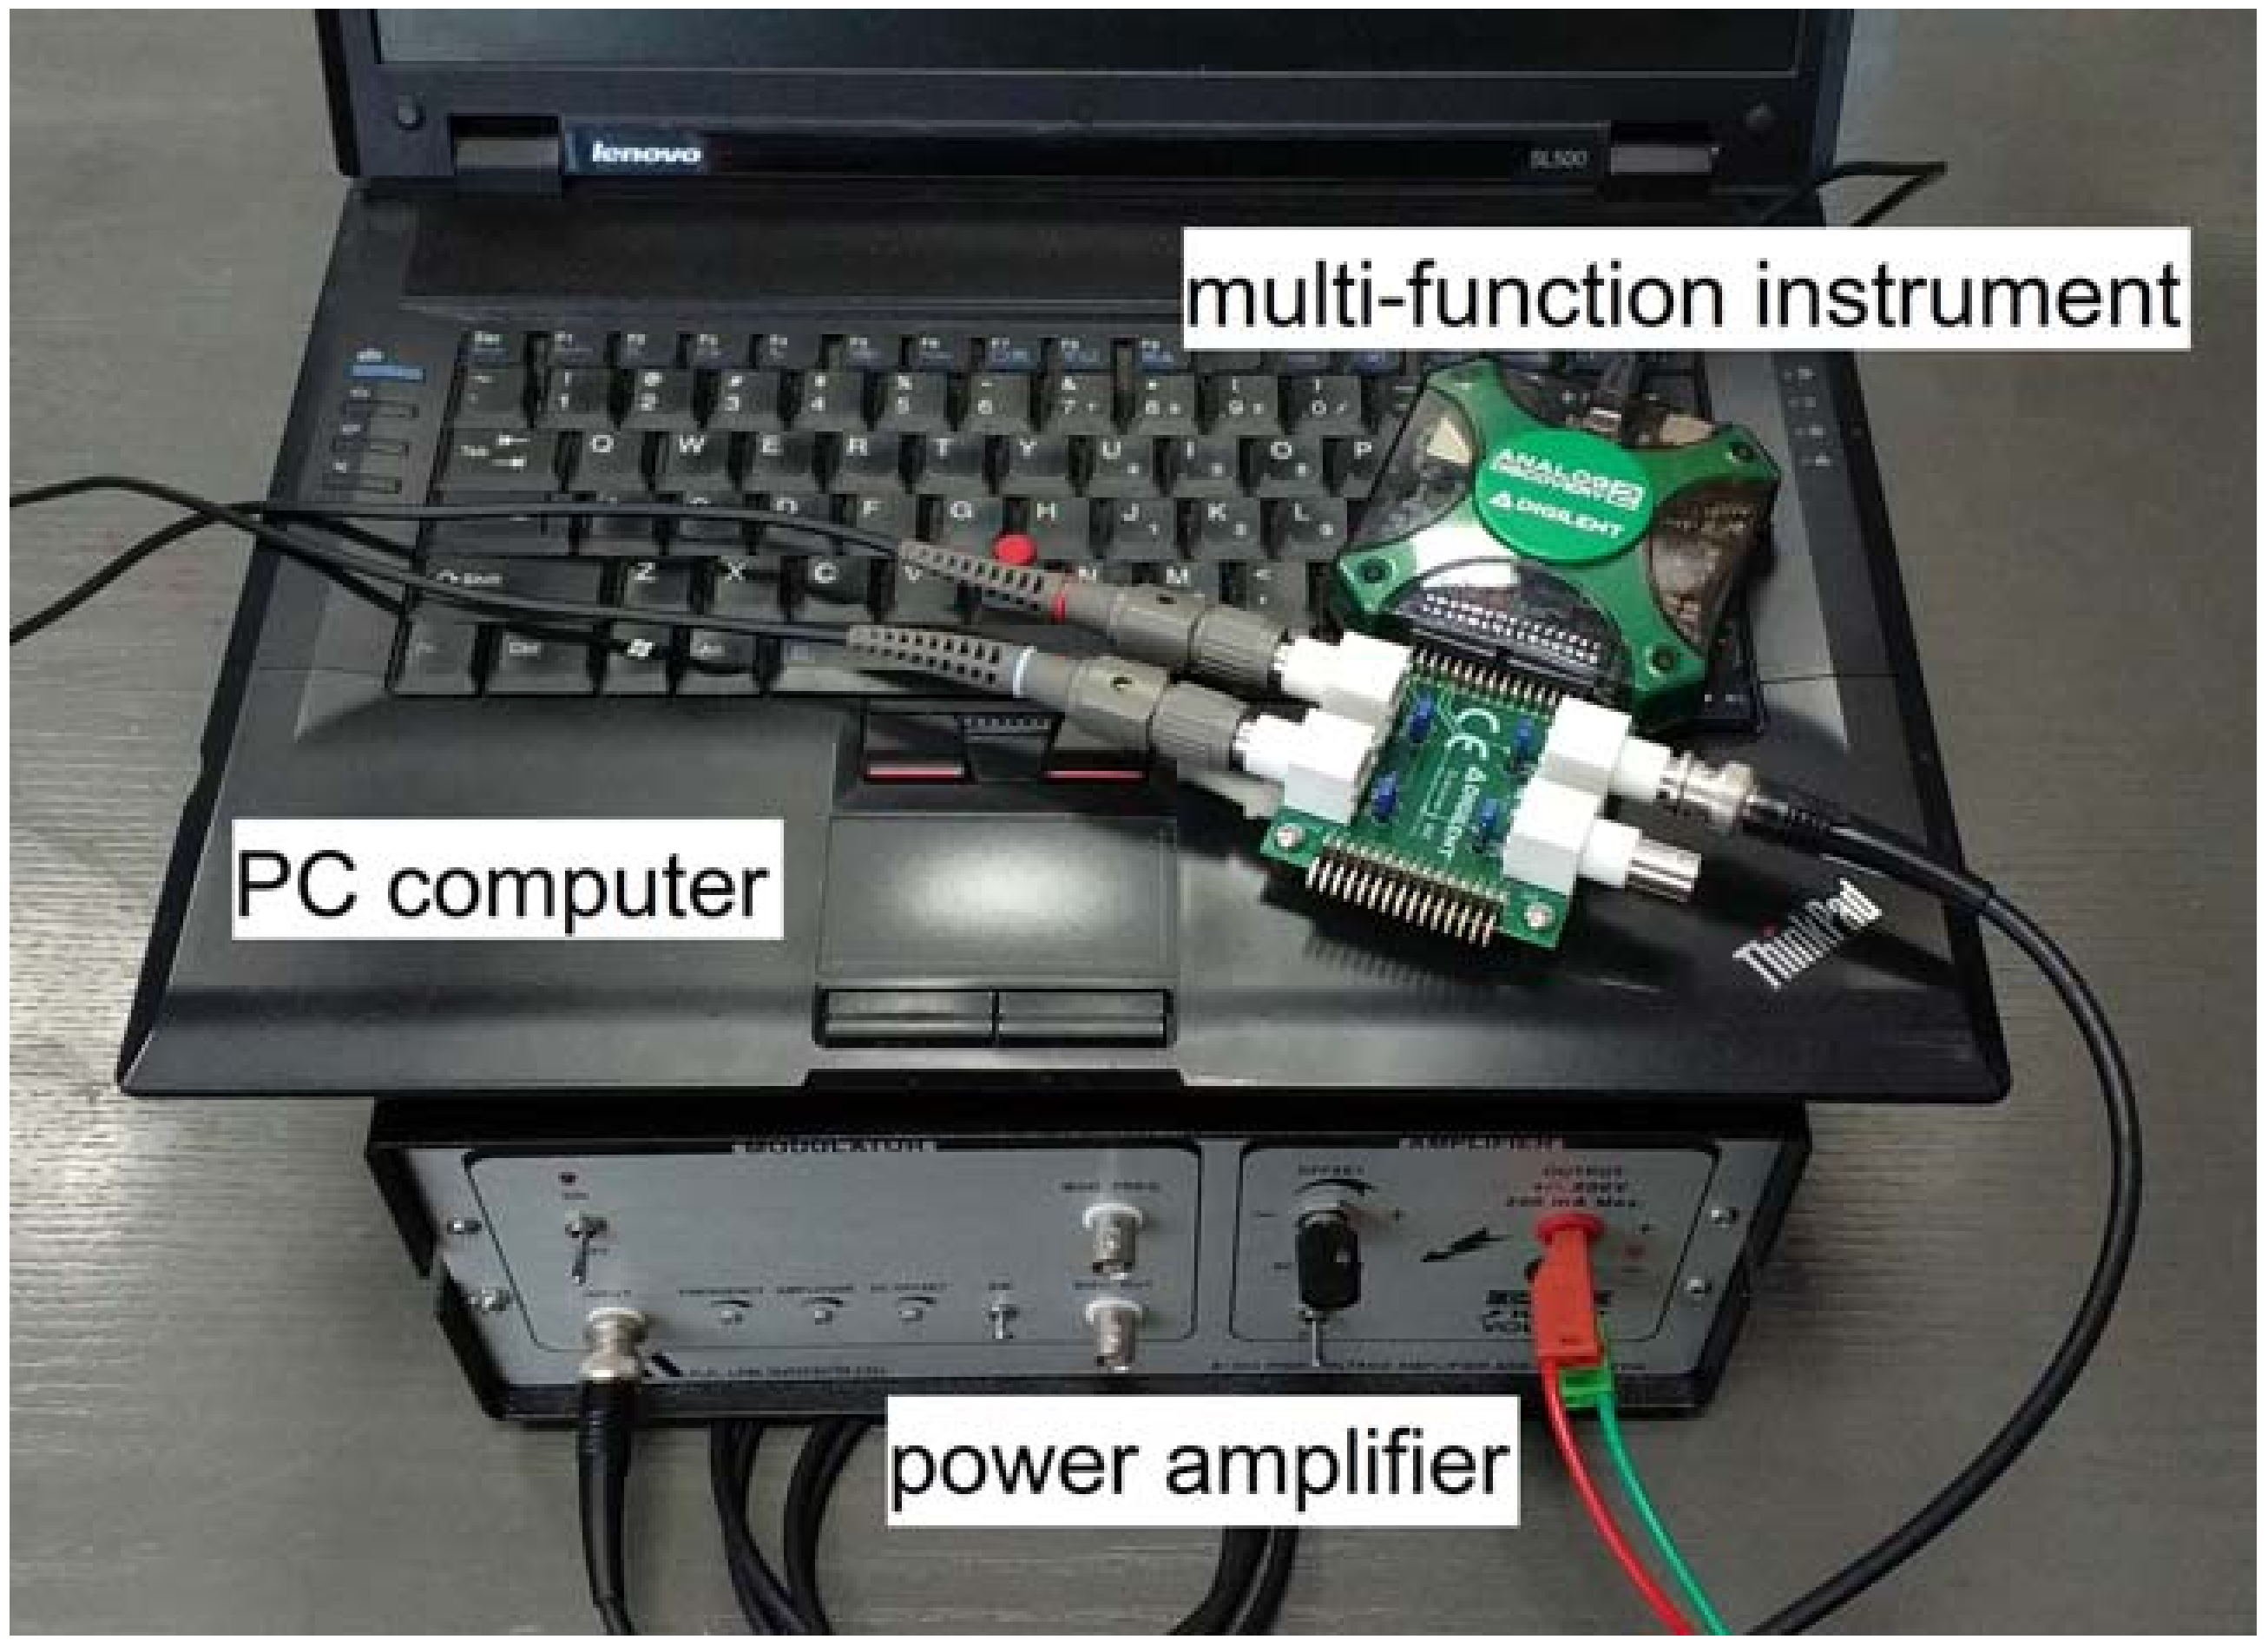
The typical laboratory setup (Figure 6 and Figure 7) was used for convenience. Instead, it is possible to use an integrated measuring device like a Digital Analog Discovery 2 that combines a dual channel oscilloscope and generator functions into one device (Figure 9). It can be connected to a portable computer and controlled from the same LabVIEW application as the main system (Figure 8).
In such a solution the presence of a power amplifier is still required and since fewer input channels are available, an additional module switching active PZT sensor pairs based on external mux module would be also necessary. In addition, this kind of devices allows lower measurement accuracy and poorer configuration capability, but, nevertheless, it significantly limits the dimensions of the measurement system and makes it more portable. Therefore, it improves the applicability of the method in real applications.
3.3. Measurements Scheme
The measurements were performed in the following order:
- (1)
- Measurement for the pristine state of the structure.
- (2)
- Measurement for simulated damage on sensing path G-S1.
- (3)
- Measurement for simulated damage on sensing path G-S2.
- (4)
- Measurement for simulated damage on sensing path G-S3.
The above measurement scheme was repeated six times, thus data from 24 measurements series were obtained for each network.
The damage was simulated by a mass element attached to the specimen in the middle of a given sensing path (Figure 5). The mass diameter was 22 mm. The mass was attached by a bituminous substrate. The total weight of the mass and the substrate was approximately 6.4 g. The mass provided local pressure field which can distort elastic waves propagating underneath, e.g., the speed of wave propagation can be changed locally [5,8]. In addition, the substrate used for the mass attachment can attenuate elastic waves. Therefore both the amplitude and the phase changes of the response signal were expected. The specimen was not permanently damaged, therefore it was possible to simulate similar condition in the subsequent series of measurements. It allowed for the verification of repeatability of DIs indications.
The actuator G was powered with a sinusoidal steady state voltage in the frequency range of 240–350 kHz. The frequency increment step was 1 kHz and peak-to-peak amplitude of the excitation was set to 88 V. The frequency range was selected based on impedance characteristics of PZT sensors used for the study [23]. Usually, PZT transducers have very high impedance for low frequencies, which then decreases to zero when the frequency goes to the so-called resonant frequency. The lower bound of the frequency band was chosen in order to obtain at least 20 mV peak-to-peak voltage amplitude on the sensors S1, S2, S3. This level of signal allowed for proper calculation of the transfer function components, especially the phase difference between voltage induced on PZT sensor and voltage applied to PZT actuator. The upper bound of the frequency interval was selected to be below the current efficiency of the amplifier as well as the resonant frequency of PZT actuator. This allowed to avoid non-linear effects which may occur in this frequency regime. Therefore, the frequency range used in the experiment was as broad as possible, considering limitations of the devices used for the study.
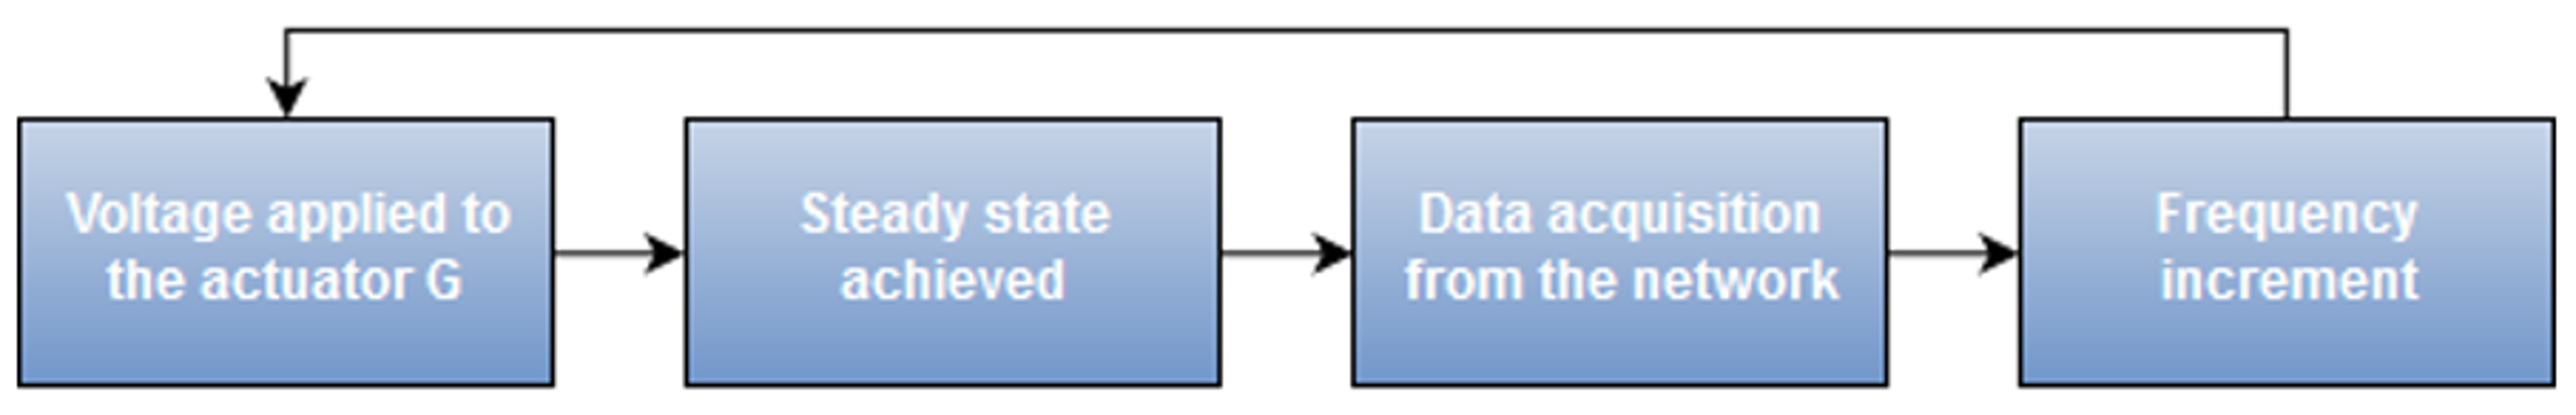
For a given measurements series, the data was collected according to the scheme shown in Figure 10:
Damage Indices for each series of measurements were calculated in accordance with the Equation (6). The first measurement obtained for the pristine state of the structure was selected as the baseline transmission function . For each series of measurements, the two-dimensional median of the DIs was determined, i.e., the median for real and imaginary parts of DIs. In order to avoid outlying observations only 80% of data closest to the point in the complex plane were considered as valid.
4. Results and Discussion
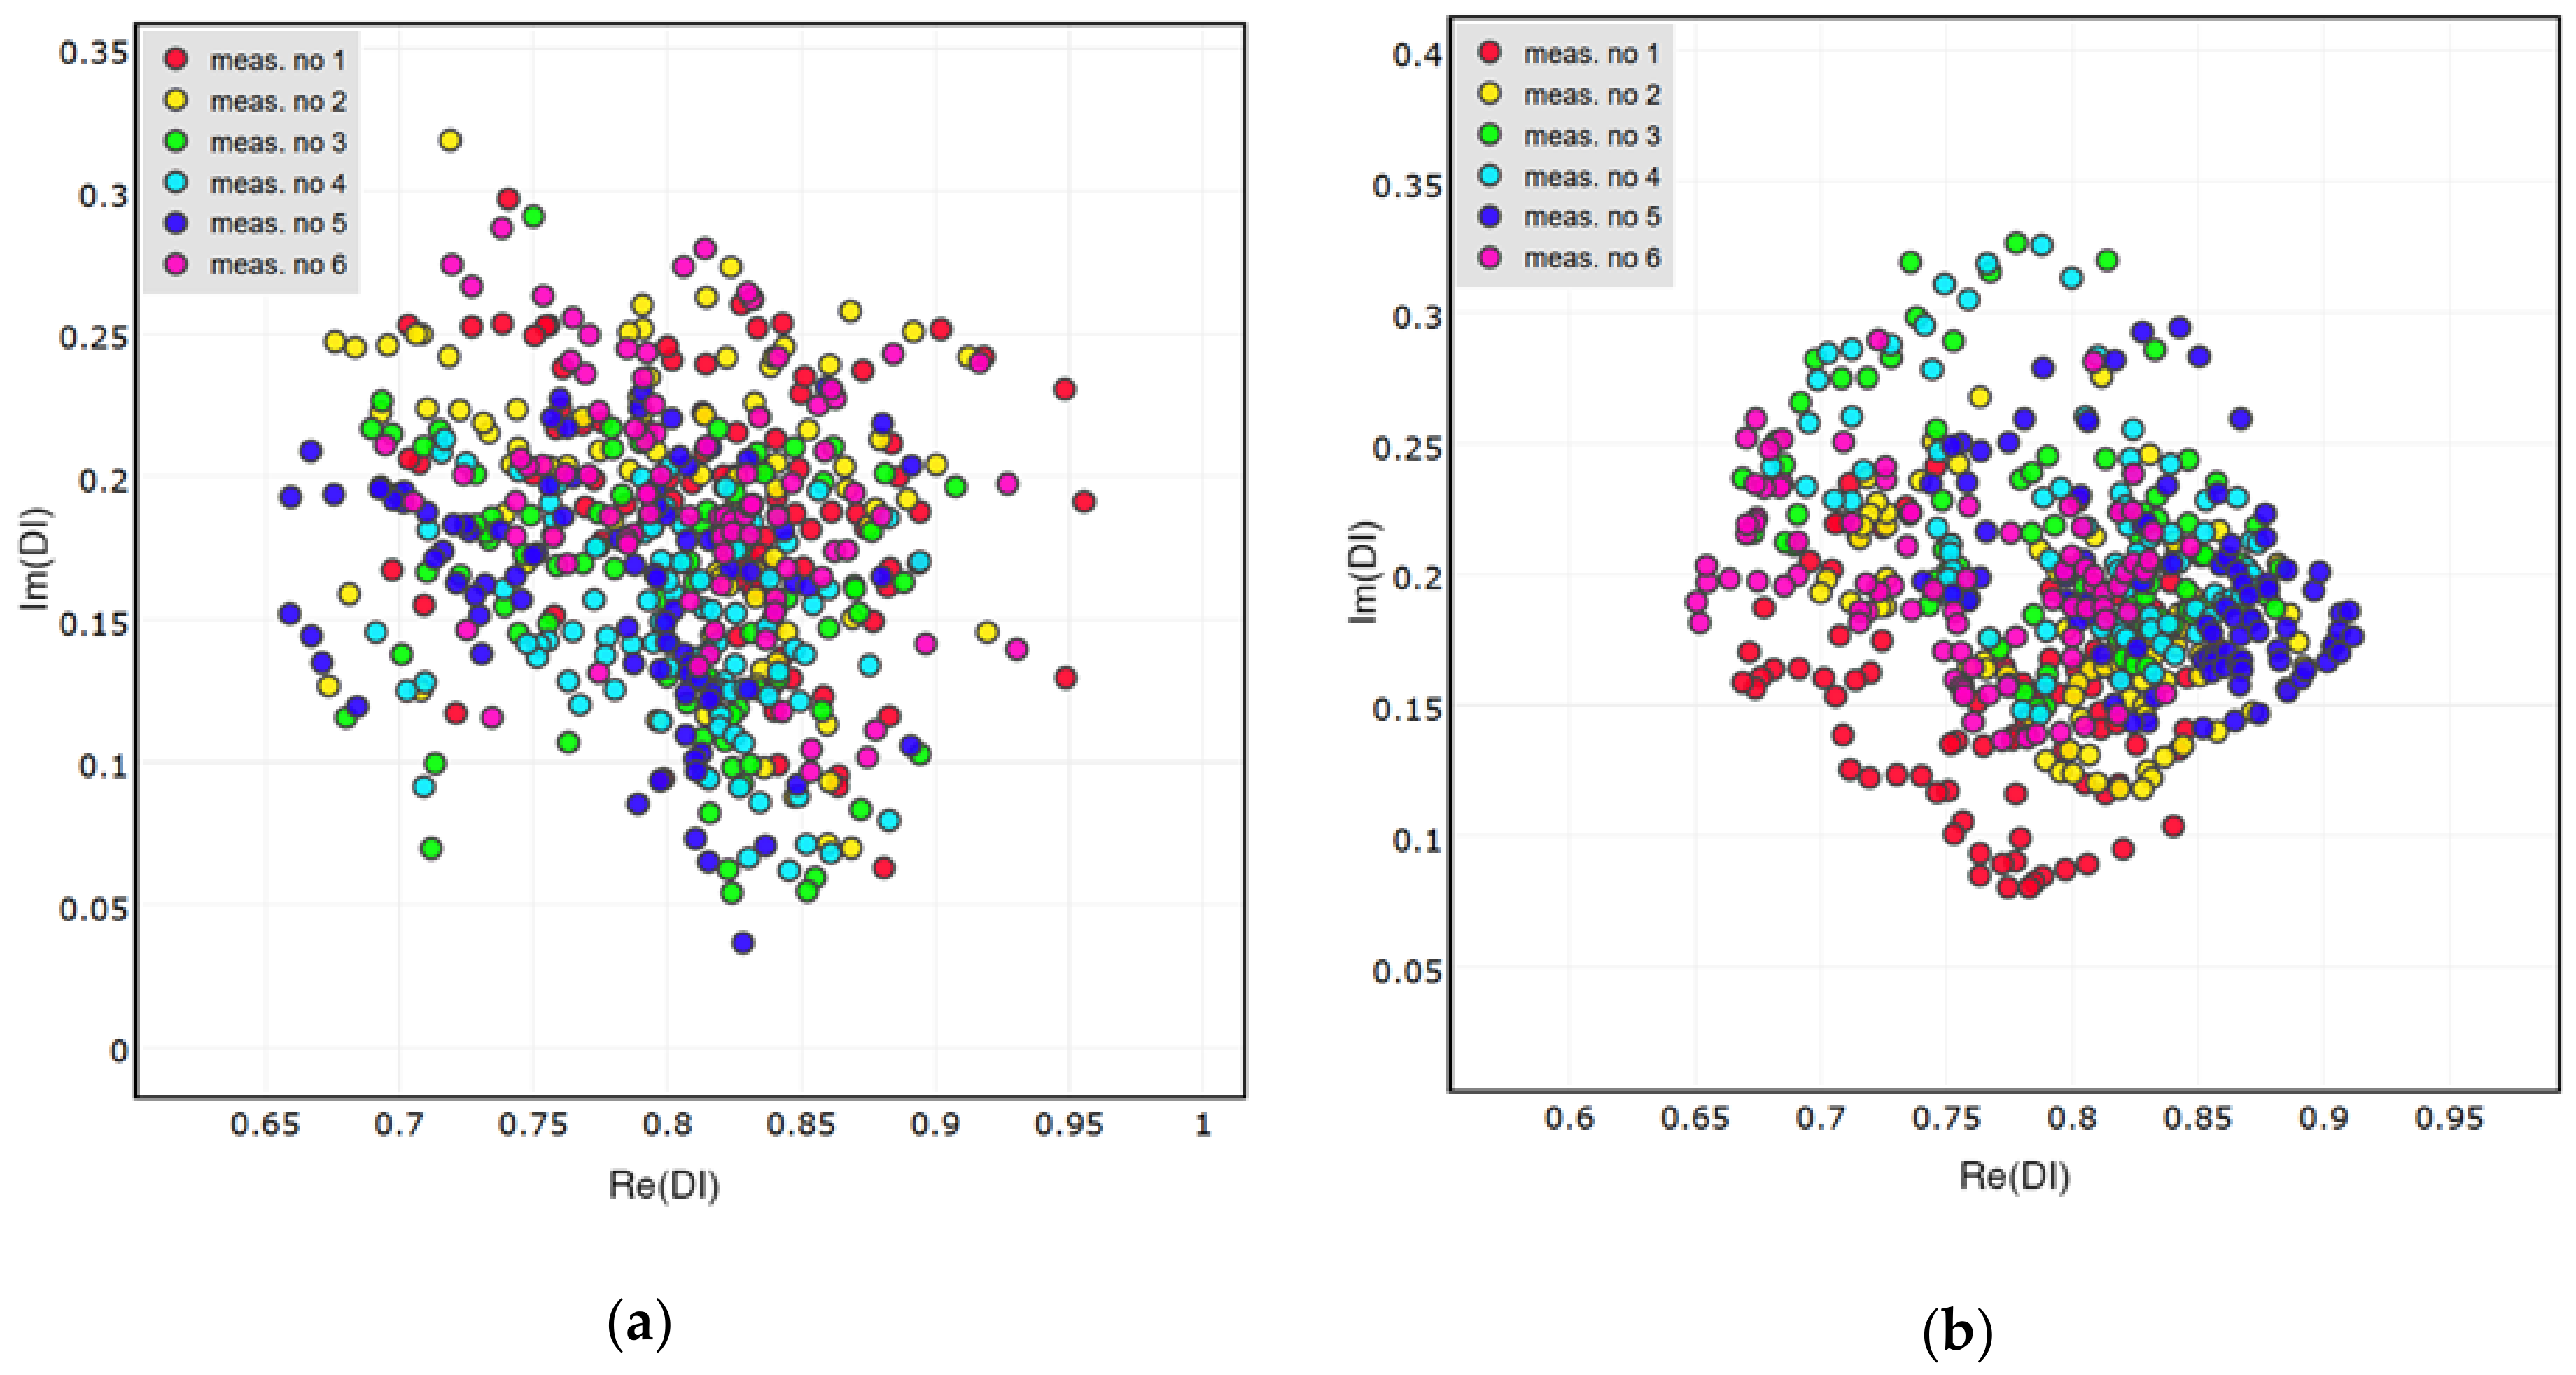
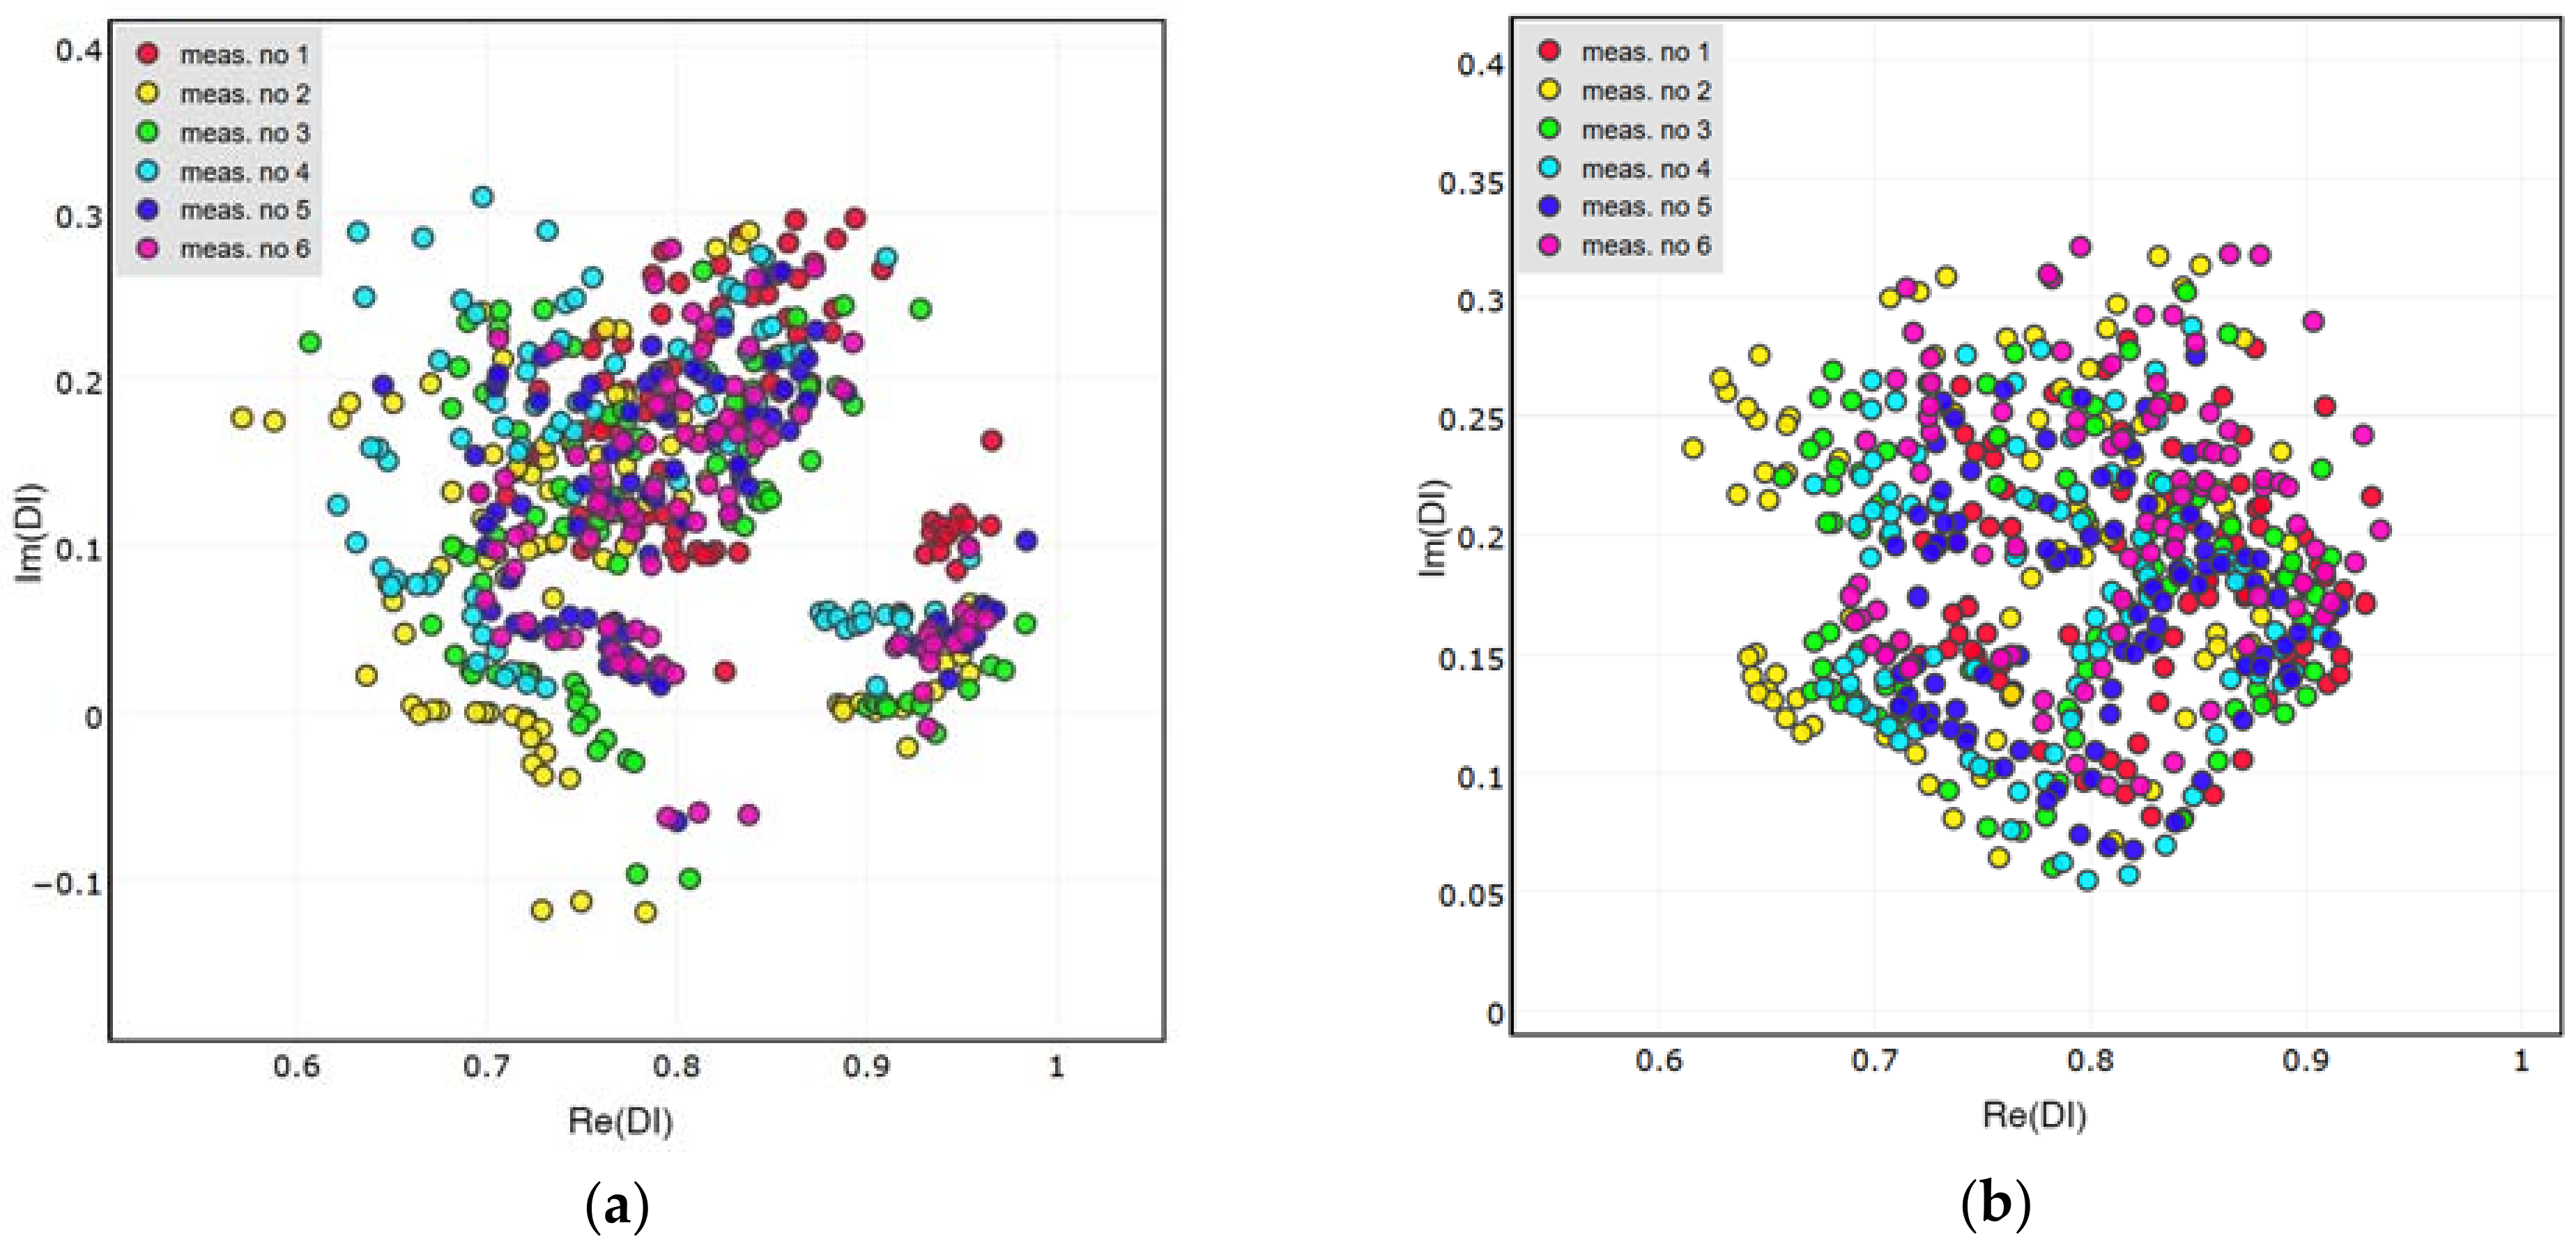
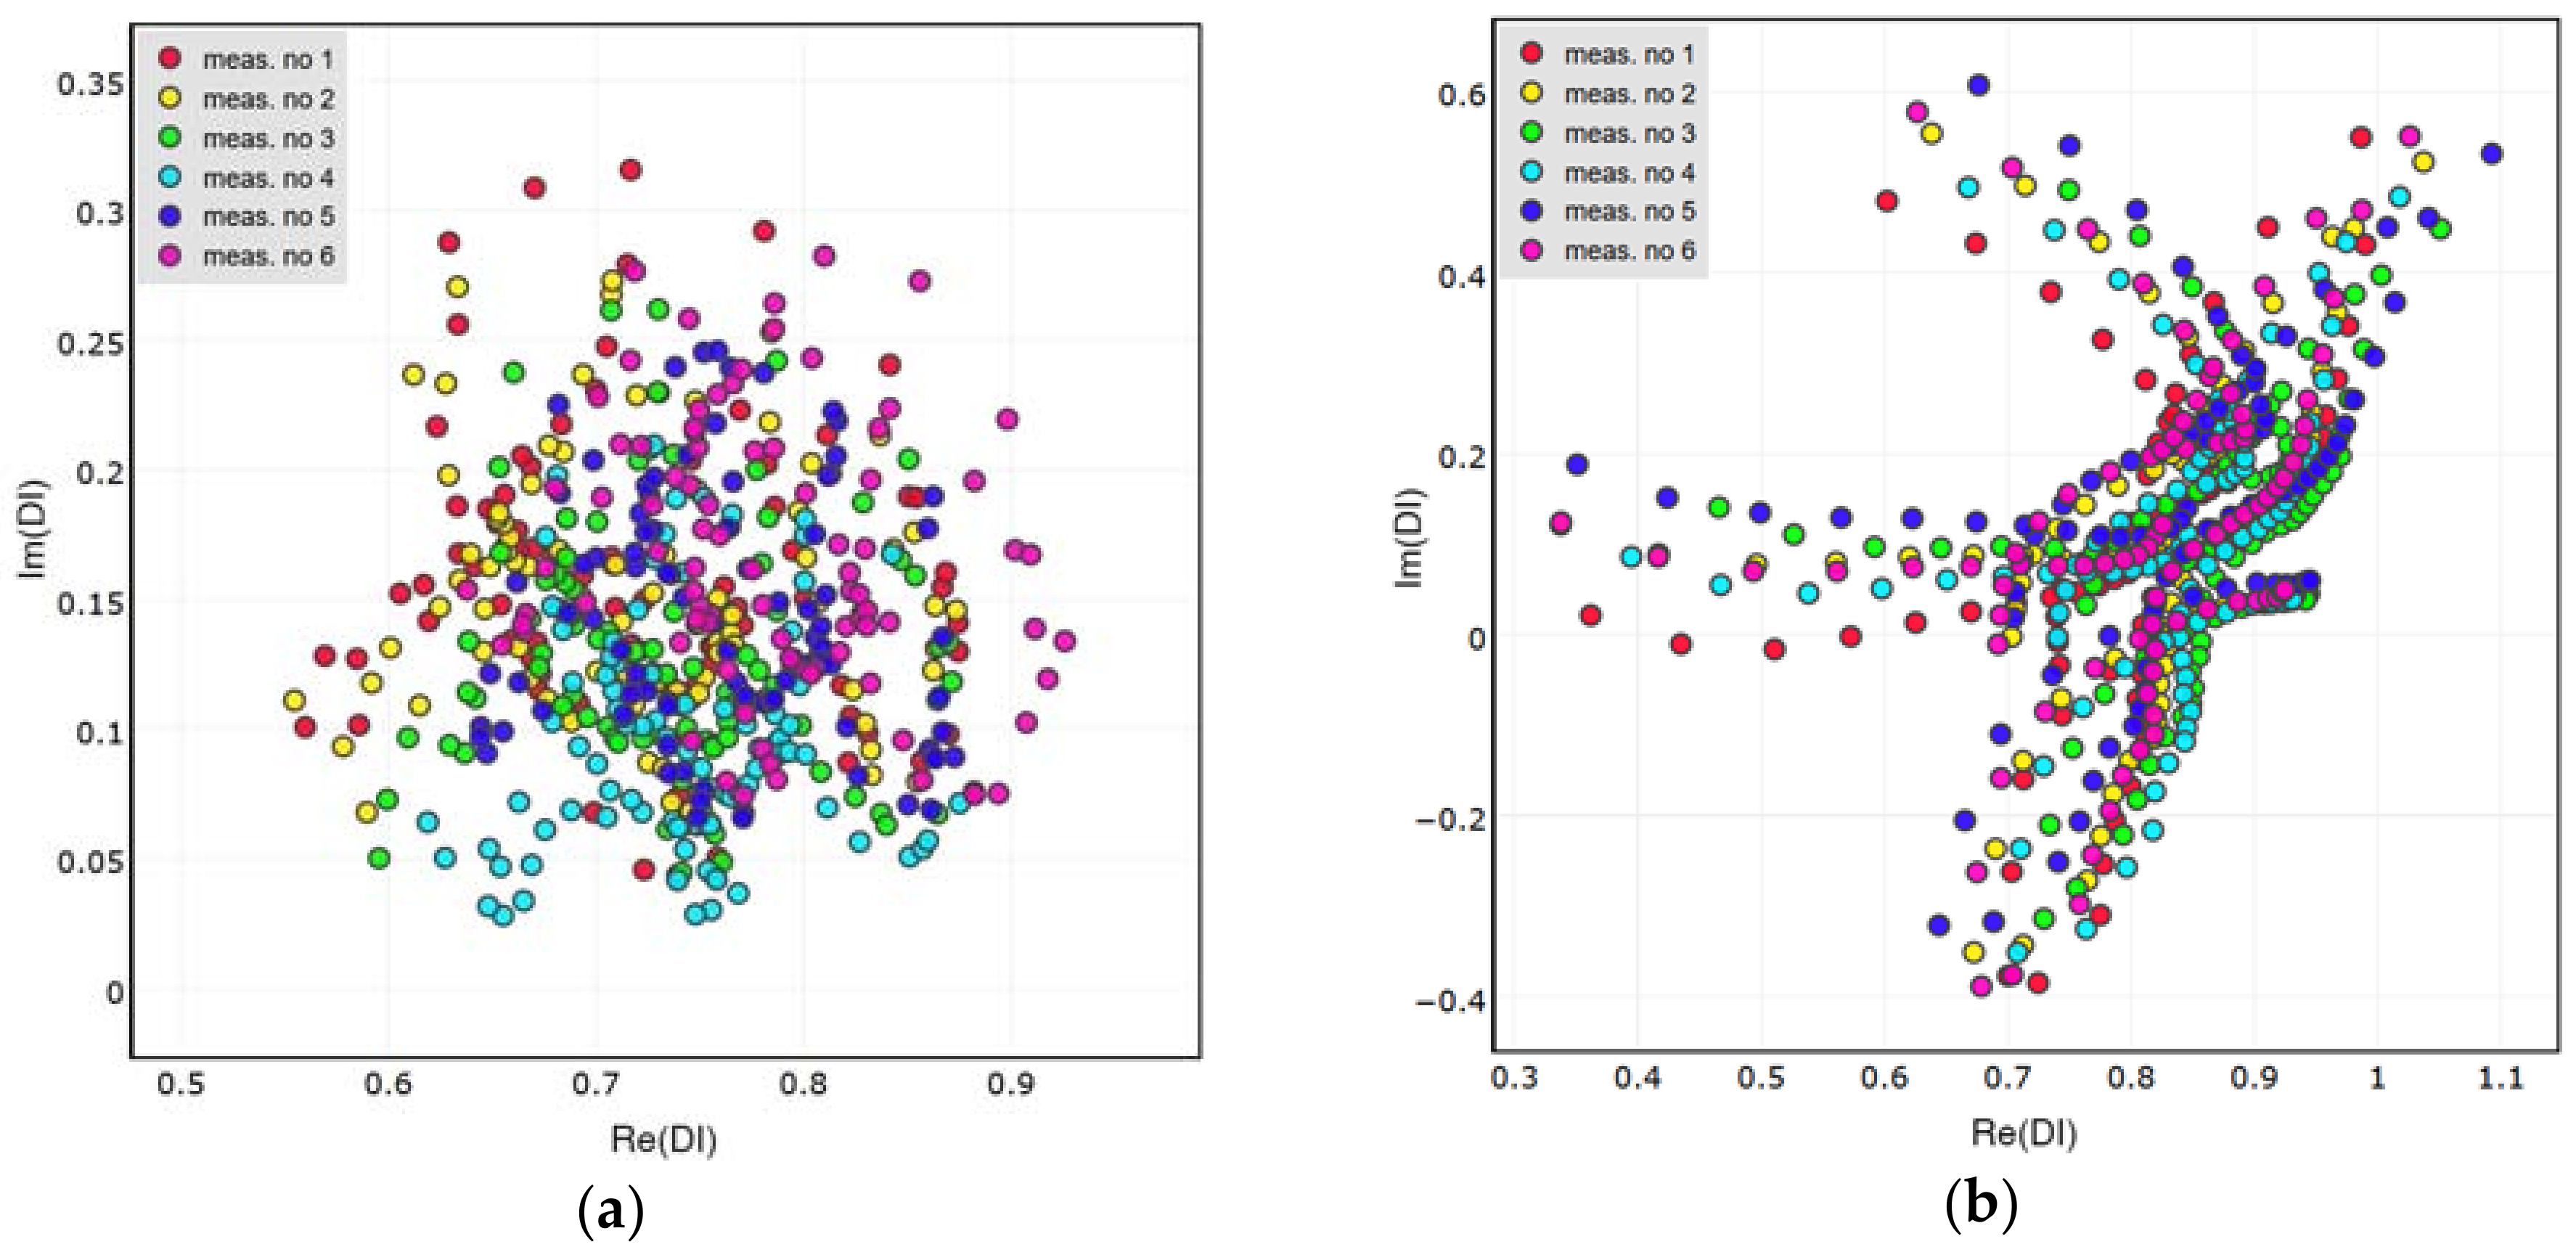
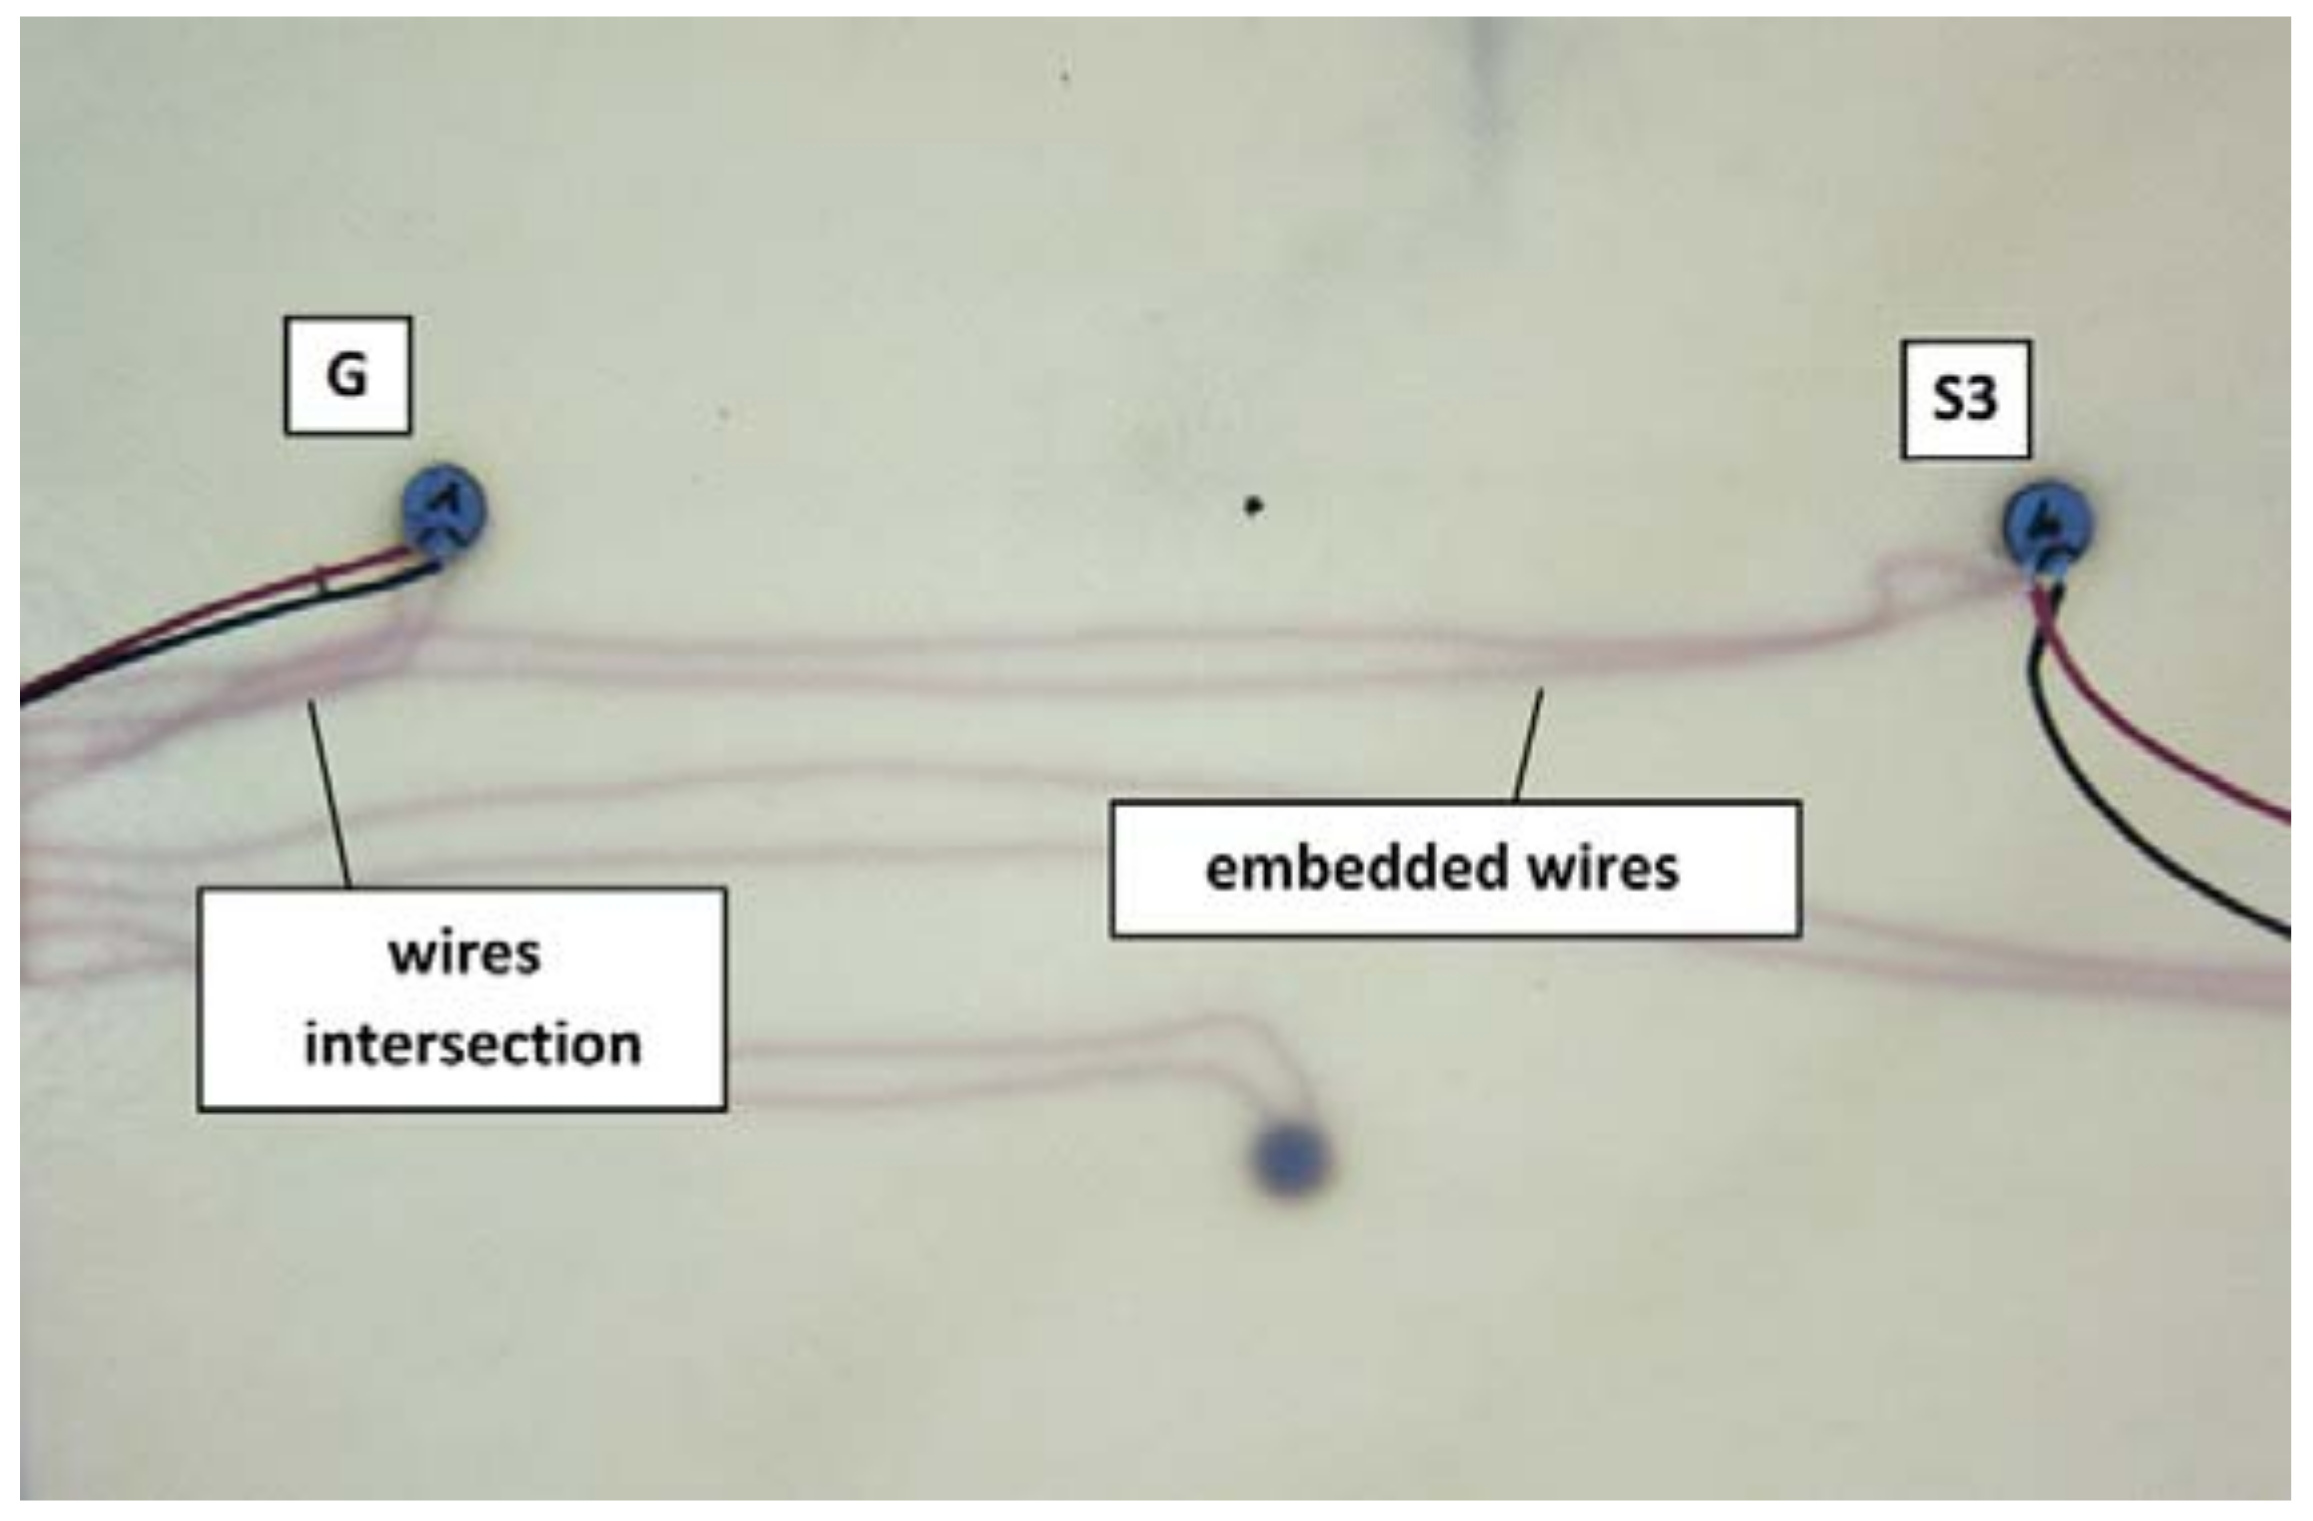
Distributions of DIs obtained for the presence of simulated damage are presented in Figure 11, Figure 12 and Figure 13 below. Both the attached and the embedded PZT networks are considered. DIs obtained for repeated measurement condition, i.e., presence of simulated damage, are concentrated around a similar point in the complex plane, therefore repeatability of the proposed method was confirmed. As expected, both the amplitude and the phase of voltage induced on PZT sensors are affected by simulated damage. Also, similar pattern of DIs distribution can be observed for different sensing paths, except for the embedded sensing path G-S3 (Figure 13b). In this case the spread of data is significantly higher compared to other cases. This can be caused by improper configuration of the embedded wires connected to G and S3 embedded transducers (Figure 14). The wires connected to actuator G, to which high voltage was applied, runs in parallel to wires connected to the sensor S3, used for low voltage measurement. This could have impact on the voltage induced on the sensor S3 and interfere with the results, resulting in increased spread of data in that case.
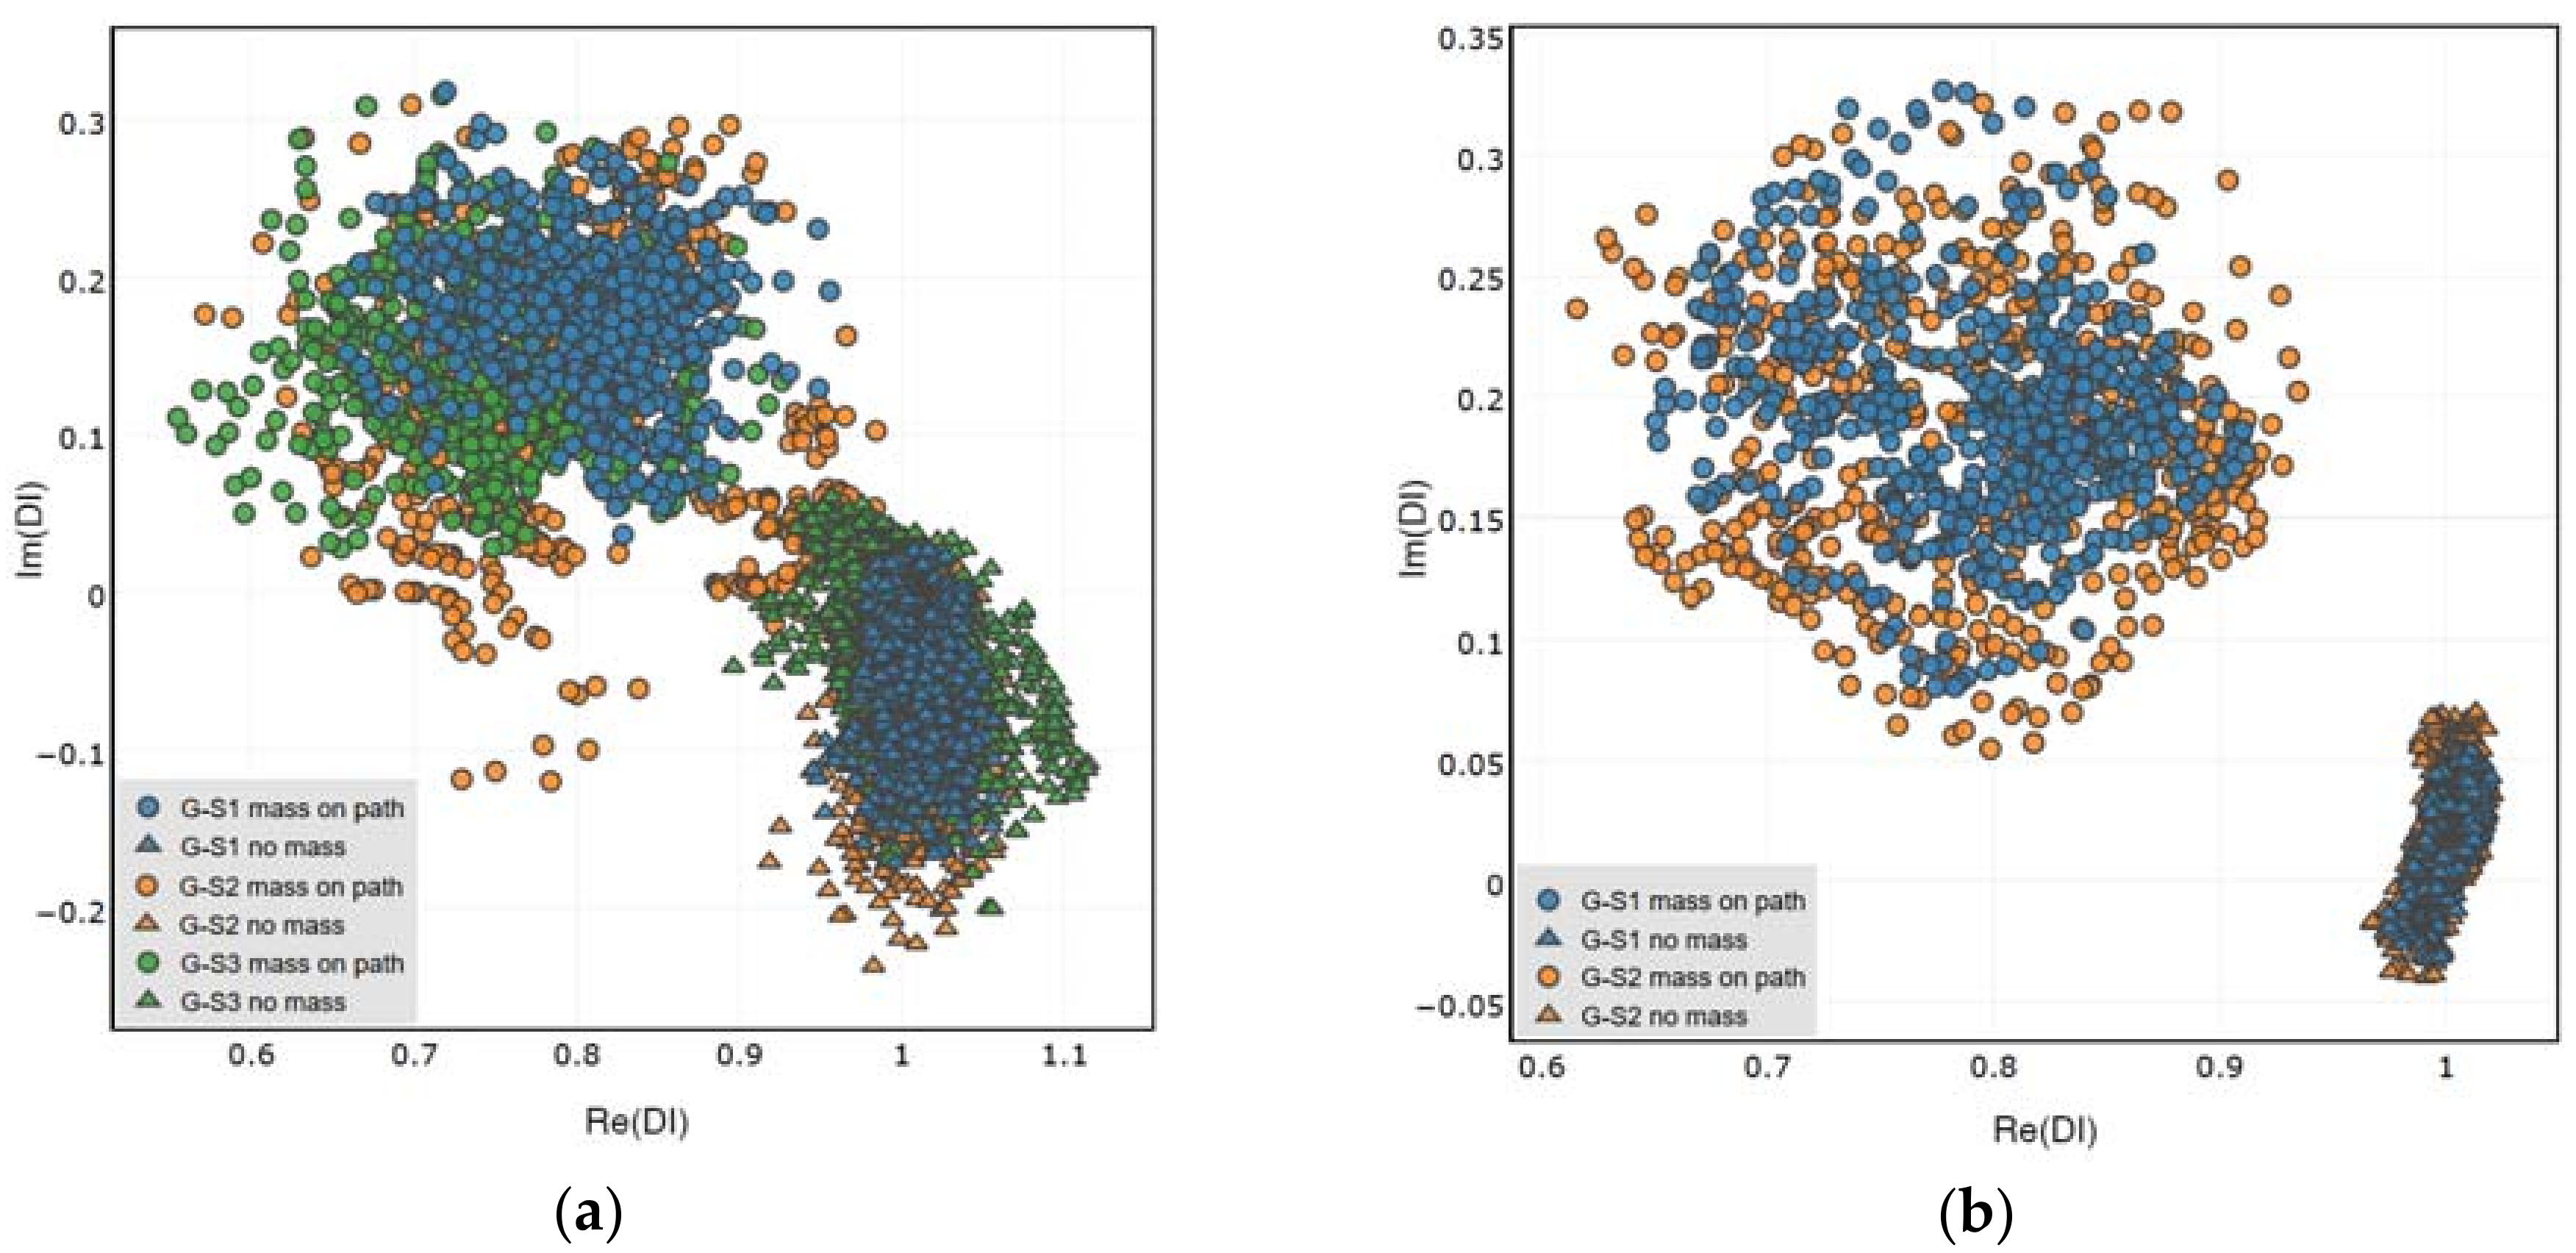
In Figure 15, a comparison of the DIs’ distribution for different sensing paths is presented. In the comparison, both states of the structure are considered—the case of simulated damage presence as well as undamaged structure condition. All repetitions of measurements are included for the purpose of comparison. For the attached network of PZT sensors, all of the sensing paths are considered (Figure 15a), whereas for the embedded network the sensing path G-S3 is excluded from the plot (Figure 15b), due to abovementioned divergence of the results obtained for it.
Remarkably, DIs obtained for different sensing paths under simulated damage condition are located in similar domains of the complex plane. This can be observed both for the attached and the embedded sensors. The material used for the experiment is anisotropic, so the PZT sensors also exhibit some anisotropies when interacting with elastic waves [5]. However, there is no significant dependence of the results (Figure 15) on the direction of sensing path or orientation between the actuator and the receiver (Figure 5). Also, the length of sensing path does not influence the DIs’ distribution. This property is of particular importance for damage classification possibility based on the proposed DIs. Since the DIs are located at the same region of the complex plane for comparable measurement conditions, it is possible to apply statistical methods for damage classification, e.g., nearest neighbor algorithm, for damage classification [44].
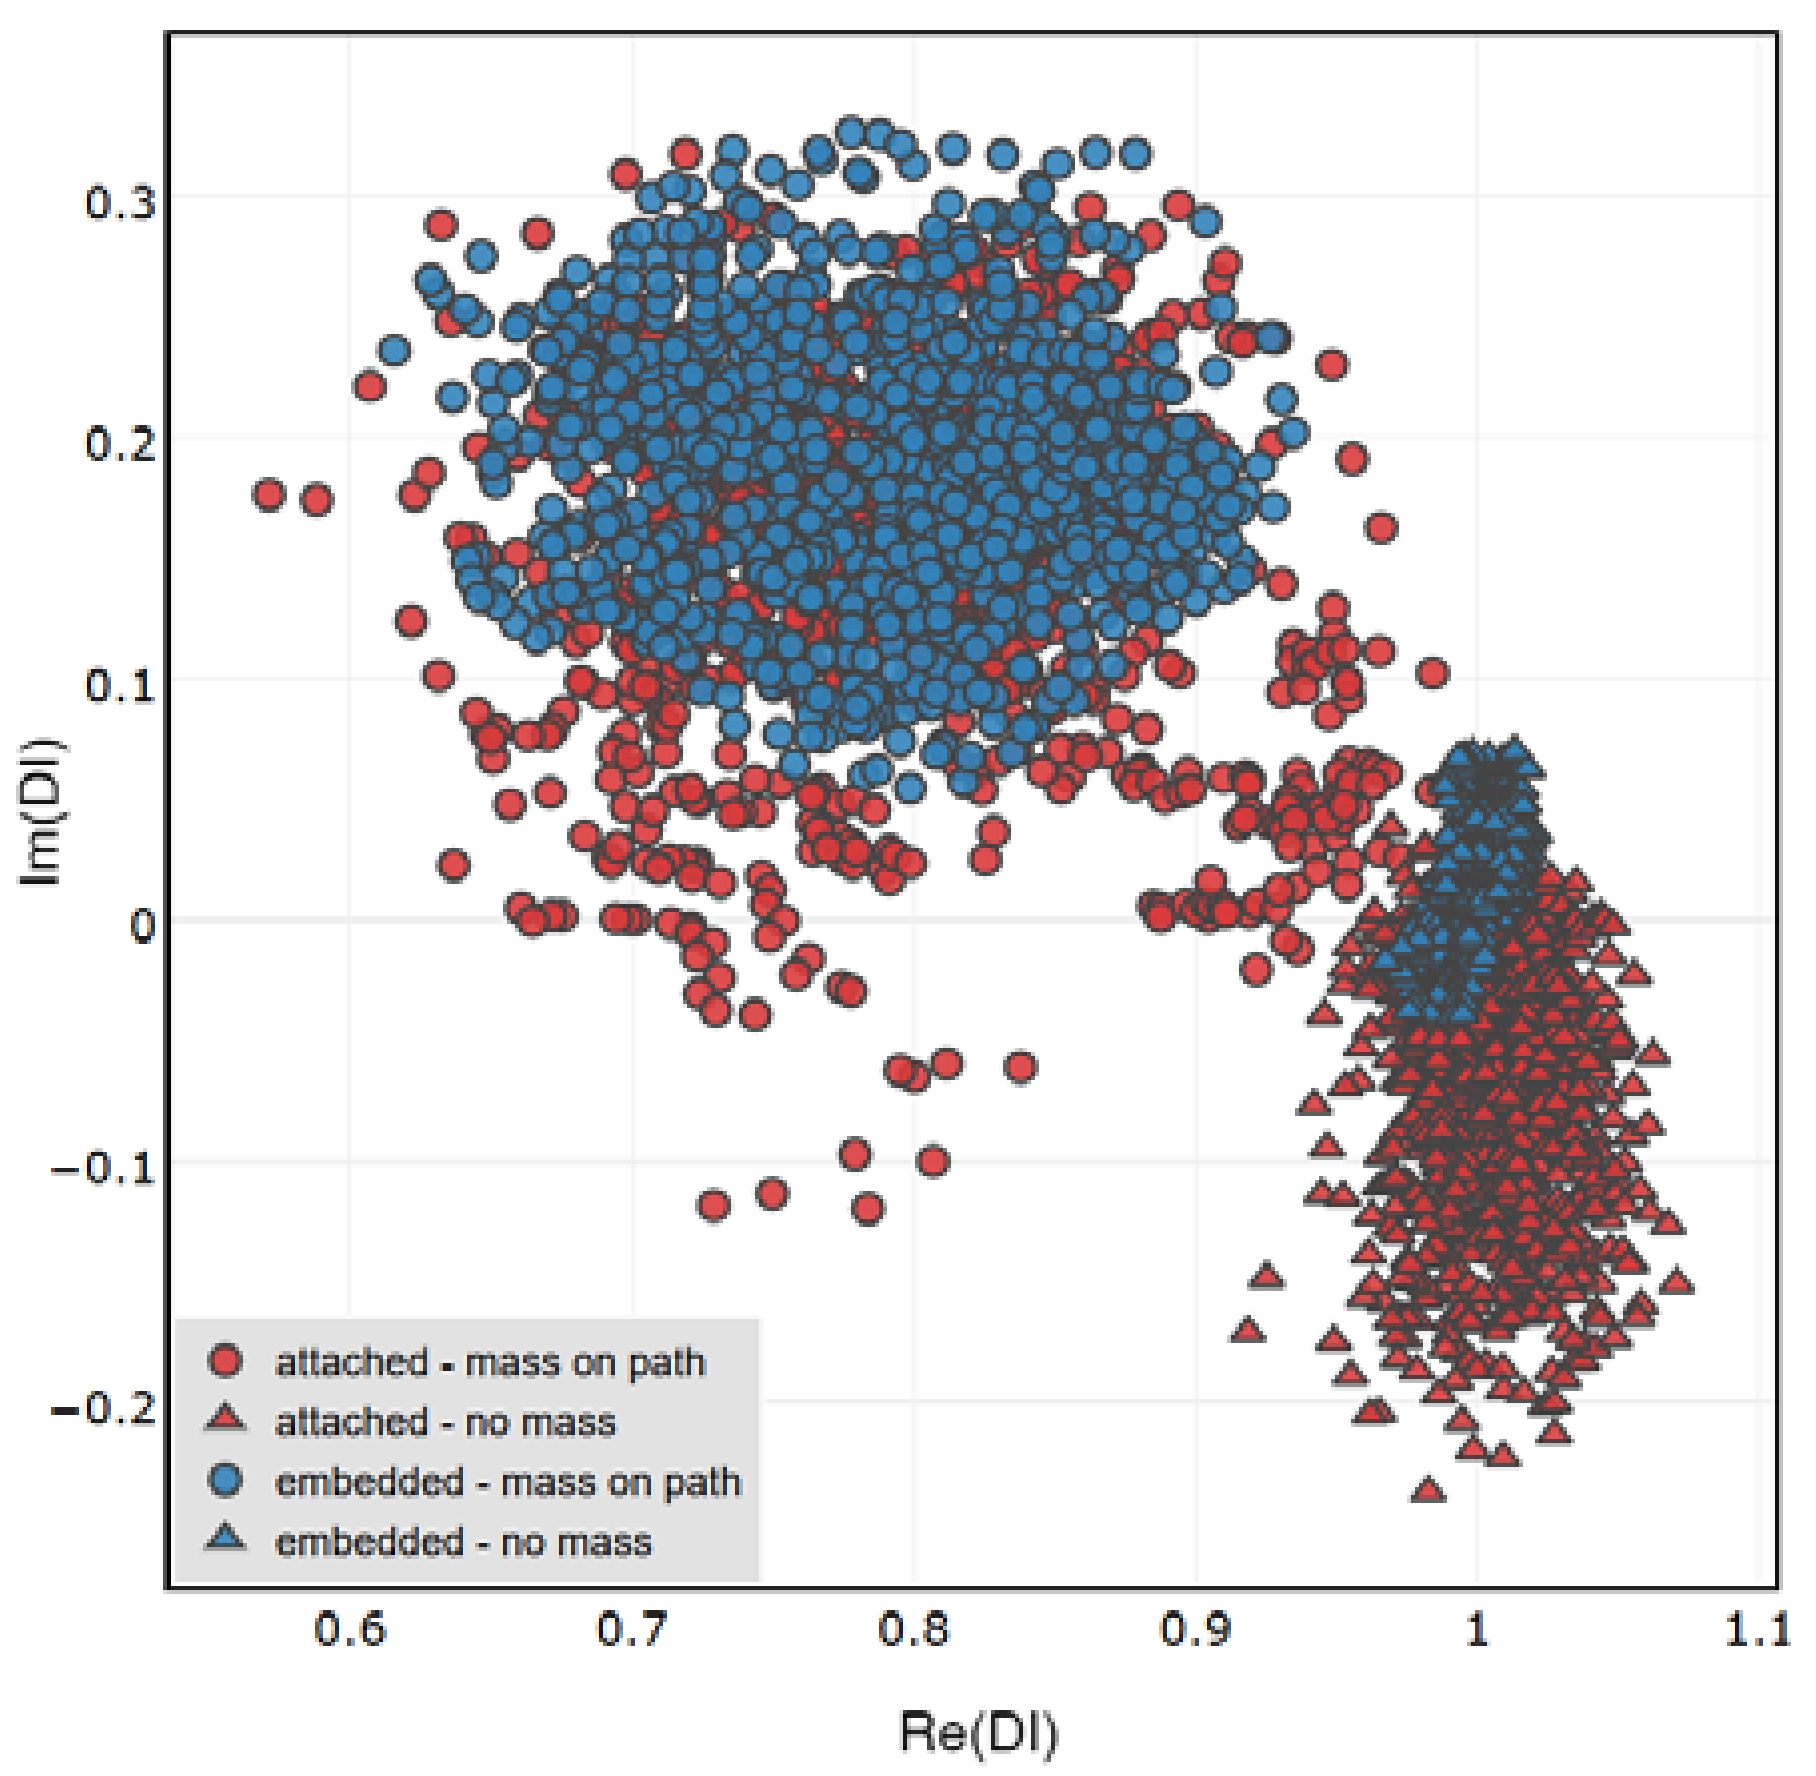
In Figure 16 the performance of the attached and embedded sensors in damage indication is compared. For both networks DIs obtained for sensing paths G-S1 and G-S2 were included. The bias of DIs distribution from the point 1 + i0 is similar for attached and embedded sensors, the difference between them is revealed in the separation of data corresponding to undamaged and damaged structure.
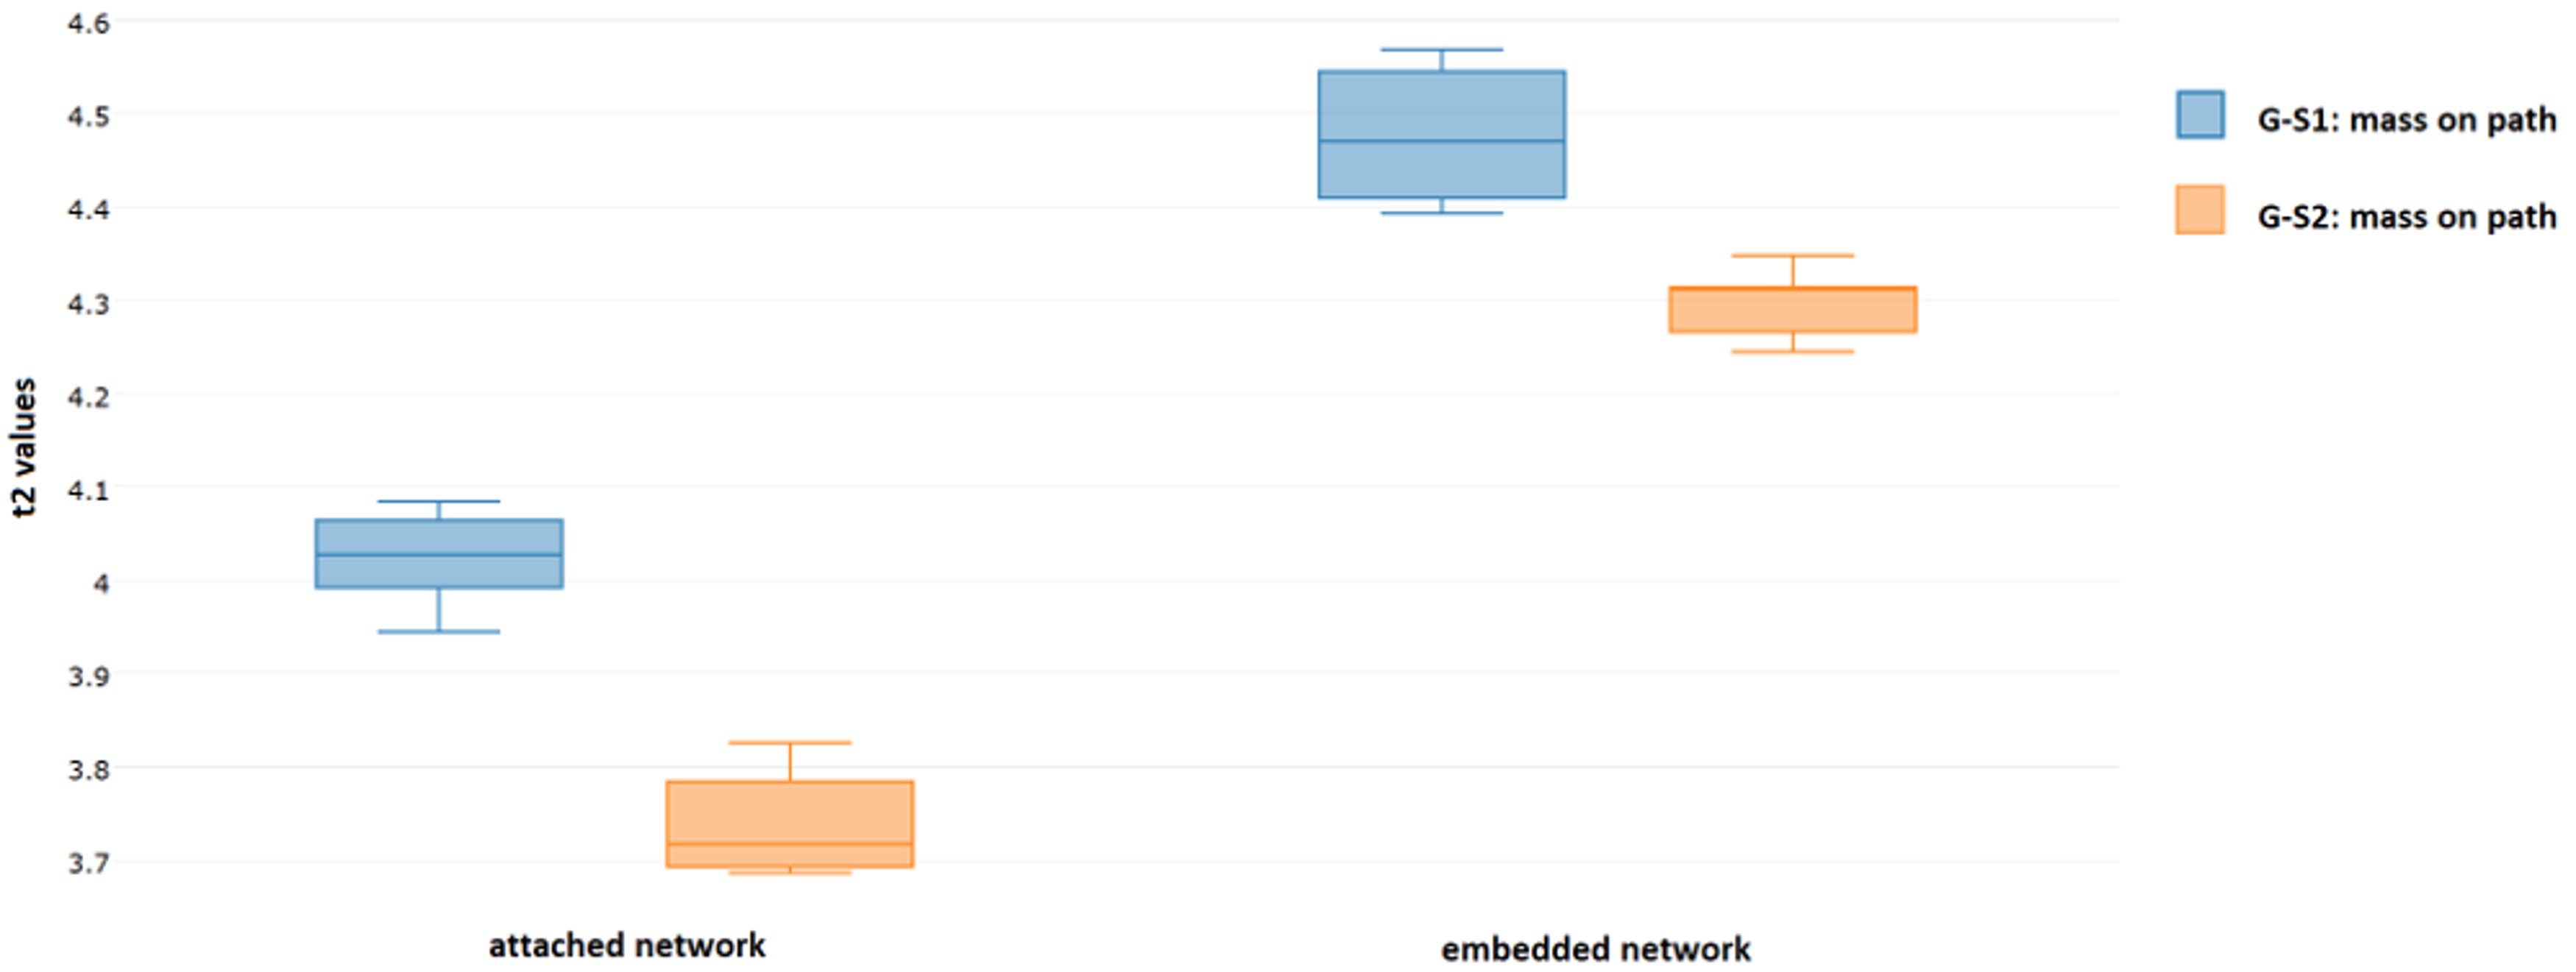
The separation of data can be quantified by using Hotelling’s T-squared distribution (T2) [45]. It is used for statistical testing of difference between means of multivariate random samples. Higher values of T2 distribution obtained for two groups of multivariate data indicates more significant separation of the two groups. In Figure 17 boxplots of values of T2 distribution obtained for DIs calculated for repetition of measurements are presented. The values of T2 were obtained as:
where:
and for denotes respectively: the number of data points, two dimensional mean of DIs and sample covariance matrix obtained for damaged and undamaged state of the structure.
The separation between data corresponding to damaged and undamaged state of the structure is higher for the embedded sensors. Therefore, for this technology involving PZT sensor integration with the structure, it might be possible to achieve higher precision of damage classification models. The space spanned by the proposed DIs in such case might be able to accommodate more well-separated domains, corresponding to different types of damage. This however, comes at the price of more complicated process of components manufacturing, in particular taking into account possible adverse effects (Figure 13b) due to improper configuration of wires connected to the embedded sensors Figure 14.
5. Conclusions
In the paper a method for structure monitoring by PZT networks was proposed and its basic properties has been studied. The proposed method revealed stability of damage indication, irrespective of the relative orientation of PZT transducers, geometrical properties of the PZT network or anisotropies of the tested material. This property is of particular importance for possibility of damage classification. For structure-embedded sensors the indication of damage is more significant compared to that of surface-attached sensors. However, proper configuration of wires connected to embedded sensors needs to be assured, which is an additional manufacturing difficulty in this technology of sensors integration with the structure.
Author Contributions
M.D. defined the approach, performed initial studies, contributed to data analysis and manuscript preparation, P.N. designed the experiment, performed measurements and contributed to software development and data analysis, K.K. and A.K. prepared hardware and software for the research, K.D. contributed to the idea development and manuscript preparation.
Acknowledgments
The work presented in this paper has been partially supported by the European Defence Agency (EDA) through Contract No B 1404 ESM2 GP entitled “SHM application to Remotely Piloted Aircraft Systems (SAMAS)”. The binational SAMAS project involves the following partners: Politecnico di Milano (consortium leader) and Leonardo Aircraft Division represent Italy, Air Force Institute of Technology and Military Aviation Works No. 1 J.S.C represent Poland.
Conflicts of Interest
The authors declare no conflict of interest.
References
- Davis, J.R. ASM Handbook: Nondestructive Evaluation and Quality Control; ASM International: Metals Park, OH, USA, 1989; Volume 17, ISBN 978-0-87170-023-0. [Google Scholar]
- Qin, Q.-H. Advanced Mechanics of Piezoelectricity; Springer: Berlin/Heidelberg, Germany, 2013; ISBN 978-3-642-29767-0. [Google Scholar]
- Ferrari, V.; Lucklum, R. Overview of acoustic-wave microsensors. In Piezoelectric Transducers and Applications; Springer: Berlin/Heidelberg, Germany, 2008; pp. 39–62. [Google Scholar]
- Lim, Y.Y.; Kwong, K.Z.; Liew, W.Y.H.; Soh, C.K. Non-destructive concrete strength evaluation using smart piezoelectric transducer—A comparative study. Smart Mater. Struct. 2016, 25, 085021. [Google Scholar] [CrossRef]
- Su, Z.; Ye, L. Identification of Damage Using Lamb Waves: From Fundamentals to Applications; Springer: Berlin/Heidelberg, Germany, 2009; ISBN 0387848576. [Google Scholar]
- Giurgiutiu, V. Structural Health Monitoring with Piezoelectric Wafer Active Sensors, 2nd ed.; Academic Press: Tokyo, Japan, 2014; ISBN 0124186912. [Google Scholar]
- Staszewski, W.J.; Boller, C.; Tomlinson, G.R. Health Monitoring of Aerospace Structures: Smart Sensor Technologies and Signal Processing; John Wiley & Sons: Chichester, UK, 2004; ISBN 0470843403. [Google Scholar]
- Graff, K. Wave Motion in Elastic Solids; Oxford University Press: London, UK, 1975; ISBN 0486667456. [Google Scholar]
- Chan, H.; Masserey, B.; Fromme, P. High frequency guided ultrasonic waves for hidden fatigue crack growth monitoring in multi-layer model aerospace structures. Smart Mater. Struct. 2015, 24, 025037. [Google Scholar] [CrossRef]
- Giurgiutiu, V.; Zagrai, A. Damage Detection in Thin Plates and Aerospace Structures with the Electro-Mechanical Impedance Method. Struct. Health Monit. 2005, 4, 99–118. [Google Scholar] [CrossRef]
- Rabelo, D.S.; Steffen, V., Jr.; Finzi Neto, R.M.; Lacerda, H.B. Impedance-based structural health monitoring and statistical method for threshold-level determination applied to 2024-T3 aluminum panels under varying temperature. Struct. Health Monit. 2016, 16, 365–381. [Google Scholar] [CrossRef]
- Rao, J.; Ratasepp, M.; Lisevych, D.; Caffoor, M.H.; Fan, Z. On-Line Corrosion Monitoring of Plate Structures Based on Guided Wave Tomography Using Piezoelectric Sensors. Sensors 2017, 17, 2882. [Google Scholar] [CrossRef] [PubMed]
- Dragan, K.; Dziendzikowski, M. A method to compensate non-damage-related influences on Damage Indices used for pitch-catch scheme of piezoelectric transducer based Structural Health Monitoring. Struct. Health Monit. 2016, 15, 423–437. [Google Scholar] [CrossRef]
- Lim, Y.Y.; Soh, C.K. Electro-mechanical impedance (EMI)-based incipient crack monitoring and critical crack identification of beam structures. Res. Nondestruct. Eval. 2014, 25, 82–98. [Google Scholar] [CrossRef]
- Ritdumrongkul, S.; Abe, M.; Fujino, Y.; Miyashita, T. Quantitative health monitoring of bolted joints using a piezoceramic actuator–sensor. Smart Mater. Struct. 2003, 13, 20. [Google Scholar] [CrossRef]
- An, Y.; Sohn, H. Integrated impedance and guided wave based damage detection. Mech. Syst. Signal Process. 2012, 28, 50–62. [Google Scholar] [CrossRef]
- Chiu, W.K.; Koh, Y.; Galea, S.; Rajic, N. Smart structure application in bonded repairs. Compos. Struct. 2000, 50, 433–444. [Google Scholar] [CrossRef]
- Ochôa, P.; Villegas, I.F.; Groves, R.M.; Benedictus, R. Experimental assessment of the influence of welding process parameters on Lamb wave transmission across ultrasonically welded thermoplastic composite joints. Mech. Syst. Signal Process. 2018, 9, 197–218. [Google Scholar] [CrossRef]
- Roth, W.; Giurgiutiu, V. Structural health monitoring of an adhesive disbond through electromechanical impedance spectroscopy. Int. J. Adhes. Adhes. 2017, 73, 109–117. [Google Scholar] [CrossRef]
- Dugnani, R.; Zhuang, Y.; Kopsaftopoulos, F.; Chang, F.-K. Adhesive bond-line degradation detection via a cross-correlation electromechanical impedance–based approach. Struct. Health Monit. 2016, 15, 650–667. [Google Scholar] [CrossRef]
- Zhuang, Y.; Kopsaftopoulos, F.; Dugnani, R.; Chang, F.-K. Integrity monitoring of adhesively bonded joints via an electromechanical impedance-based approach. Struct. Health Monit. 2017. [Google Scholar] [CrossRef]
- Gresil, M.; Yu, L.; Giurgiutiu, V.; Sutton, M. Predictive modeling of electromechanical impedance spectroscopy for composite materials. Struct. Health Monit. 2012, 11, 671–683. [Google Scholar] [CrossRef]
- Dziendzikowski, M.; Kurnyta, A.; Dragan, K.; Klysz, S.; Leski, A. In situ Barely Visible Impact Damage detection and localization for composite structures using surface mounted and embedded PZT transducers: A comparative study. Mech. Syst. Signal Process. 2016, 78, 91–106. [Google Scholar] [CrossRef]
- Gao, W.; Wu, Z.; Yang, L.; Zheng, Y. Integrated impedance and Lamb wave–based structural health monitoring strategy for long-term cycle-loaded composite structure. Struct. Health Monit. 2017. [Google Scholar] [CrossRef]
- Dixit, A.; Bhalla, S. Prognosis of fatigue and impact induced damage in concrete using embedded piezo-transducers. Sens. Actuator A-Phys. 2018, 274, 116–131. [Google Scholar] [CrossRef]
- Ayres, J.W.; Lalande, F.; Chaudhry, Z.; Rogers, C.A. Qualitative impedance-based health monitoring of civil infrastructures. Smart Mater. Struct. 1998, 7, 599. [Google Scholar] [CrossRef]
- Gu, H.; Moslehy, Y.; Sanders, D.; Song, G.; Mo, Y.L. Multi-functional smart aggregate-based structural health monitoring of circular reinforced concrete columns subjected to seismic excitations. Smart Mater. Struct. 2010, 19, 6. [Google Scholar] [CrossRef]
- Wang, D.; Song, H.; Zhu, H. Numerical and experimental studies on damage detection of a concrete beam based on PZT admittances and correlation coefficient. Constr. Build. Mater. 2013, 49, 564–574. [Google Scholar] [CrossRef]
- Providakis, C.P.; Stefanaki, K.D.; Voutetaki, M.E.; Tsompanakis, J.; Stavroulaki, M.E. Damage Detection in Concrete Structures using a Simultaneously Activated Multi-mode PZT Active Sensing System: Numerical Modelling. Struct. Infrastruct. Eng. 2014, 10, 1451–1468. [Google Scholar] [CrossRef]
- Hu, X.; Zhu, H.; Wang, D. A study of concrete slab damage detection based on the electromechanical impedance method. Sensors 2014, 14, 19897–19909. [Google Scholar] [CrossRef] [PubMed]
- Karayannis, C.G.; Voutetaki, M.E.; Chalioris, C.E.; Providakis, C.P.; Angeli, G.M. Detection of flexural damage stages for RC beams using piezoelectric sensors (PZT). Smart Struct. Syst. 2015, 15, 997–1018. [Google Scholar] [CrossRef]
- Karayannis, C.G.; Chalioris, C.E.; Angeli, G.M.; Papadopoulos, N.A.; Favvata, M.J.; Providakis, C.P. Experimental damage evaluation of reinforced concrete steel bars using piezoelectric sensors. Constr. Build. Mater. 2016, 105, 227–244. [Google Scholar] [CrossRef]
- Voutetaki, M.E.; Papadopoulos, N.A.; Angeli, G.M.; Providakis, C.P. Investigation of a new experimental method for damage assessment of RC beams failing in shear using piezoelectric transducers. Eng. Struct. 2016, 114, 226–240. [Google Scholar] [CrossRef]
- Chalioris, C.E.; Karayannis, C.G.; Angeli, G.M.; Papadopoulos, N.A.; Favvata, M.J.; Providakis, C.P. Applications of smart piezoelectric materials in a wireless admittance monitoring system (WiAMS) to structures—Tests in RC elements. Case Stud. Constr. Mater. 2016, 5, 1–18. [Google Scholar] [CrossRef]
- Li, W.; Fan, S.; Ho, S.C.M.; Wu, J.; Song, G. Interfacial debonding detection in fiber-reinforced polymer rebar–reinforced concrete using electro-mechanical impedance technique. Struct. Health Monit. 2017, 17, 461–471. [Google Scholar] [CrossRef]
- Park, S.; Park, G.; Yun, C.-B.; Farrar, C.R. Sensor Self-diagnosis Using a Modified Impedance Model for Active Sensing-based Structural Health Monitoring. Struct. Health Monit. 2009, 8, 71–82. [Google Scholar] [CrossRef]
- Sharif-Khodaei, Z.; Ghajari, M.; Aliabadi, M.H. Impact Damage Detection in Composite Plates using a Self-diagnostic Electro-Mechanical Impedance based Structural Health Monitoring System. J. Multiscale Model. 2006, 2015, 1550013. [Google Scholar] [CrossRef]
- Nasrollahi, A.; Deng, W.; Ma, Z.; Rizzo, P. Multimodal structural health monitoring based on active and passive sensing. Struct. Health Monit. 2018, 17, 395–409. [Google Scholar] [CrossRef]
- Santoni, G.B.; Yu, L.; Xu, B.; Giurgiutiu, V. Lamb wave-mode tuning of piezoelectric wafer active sensors for structural health monitoring. J. Vib. Acoust. 2007, 129, 752–762. [Google Scholar] [CrossRef]
- Song, H.; Lim, H.J.; Sohn, H. Electromechanical impedance measurement from large structures using a dual piezoelectric transducer. J. Sound Vib. 2013, 332, 6580–6595. [Google Scholar] [CrossRef]
- Rosiek, M.; Martowicz, A.; Uhl, T. An Overview of Electromechanical Impedance Method for Damage Detection in Mechanical Structures. In Proceedings of the 6th European Workshop on Structural Health Monitoring, Nantes, France, 3–6 July 2014. [Google Scholar]
- Bhalla, S.; Gupta, A.; Bansal, S.; Garg, T. Ultra Low-cost Adaptations of Electro-mechanical Impedance Technique for Structural Health Monitoring. J. Intell. Mater. Syst. Struct. 2009, 20, 991–999. [Google Scholar] [CrossRef]
- Campeiro, L.M.; Silveira, R.Z.M.; Baptista, F.G. Impedance-based damage detection under noise and vibration effects. Struct. Health Monit. 2017, 17, 654–667. [Google Scholar] [CrossRef]
- Hastie, T.; Tibshirani, R.; Friedman, J. The Elements of Statistical Learning, 2nd ed.; Springer Science+Business Media: New York, NY, USA, 2009; ISBN 978-0-387-84858-7. [Google Scholar]
- Mujica, L.E.; Rodellar, J.; Fernandez, A.; Güemes, A. Q-statistic and T2-statistic PCA-based measures for damage assessment in structures. Struct. Health Monit. 2011, 10, 539–553. [Google Scholar] [CrossRef]
Figure 1.
Methods of PZT application for Structural Health Monitoring.

Figure 2.
Example of a sinusoidal steady state excitation of PZT sensors: (a) PZT network; (b) Output voltages acquired on PZT sensors.
Figure 2.
Example of a sinusoidal steady state excitation of PZT sensors: (a) PZT network; (b) Output voltages acquired on PZT sensors.

Figure 3.
Example of transfer function components: (a) amplitude ratio ; (b) phase difference , between output and input signals.
Figure 3.
Example of transfer function components: (a) amplitude ratio ; (b) phase difference , between output and input signals.

Figure 4.
Example of DIs obtained for the pristine state of the structure and when a damage is present.
Figure 4.
Example of DIs obtained for the pristine state of the structure and when a damage is present.

Figure 5.
The geometry of the PZT network.

Figure 6.
Block diagram of the measurement system.

Figure 7.
The system devices prepared for measurements.

Figure 8.
The front panel of the developed computer program—the settings window of the oscilloscope and the function generator parameters.
Figure 8.
The front panel of the developed computer program—the settings window of the oscilloscope and the function generator parameters.

Figure 9.
Parts of the integrated measurement system.

Figure 10.
Data acquisition scheme.

Figure 11.
Damage Indices obtained for simulated damage on sensing path G-S1: (a) Attached network; (b) Embedded network.
Figure 11.
Damage Indices obtained for simulated damage on sensing path G-S1: (a) Attached network; (b) Embedded network.

Figure 12.
Damage Indices obtained for simulated damage on sensing path G-S2: (a) Attached network; (b) Embedded network.
Figure 12.
Damage Indices obtained for simulated damage on sensing path G-S2: (a) Attached network; (b) Embedded network.

Figure 13.
Damage Indices obtained for simulated damage on sensing path G-S3: (a) Attached network; (b) Embedded network.
Figure 13.
Damage Indices obtained for simulated damage on sensing path G-S3: (a) Attached network; (b) Embedded network.

Figure 14.
Embedded wires intersection.

Figure 15.
Comparison of DIs obtained for the pristine state of the structure and for simulated damage presence: (a) Attached network; (b) Embedded network.
Figure 15.
Comparison of DIs obtained for the pristine state of the structure and for simulated damage presence: (a) Attached network; (b) Embedded network.

Figure 16.
Comparison of DIs obtained for the embedded and surface attached PZT networks under certain measurement conditions.
Figure 16.
Comparison of DIs obtained for the embedded and surface attached PZT networks under certain measurement conditions.

Figure 17.
Values of T2 statistics obtained for both PZT networks.

© 2018 by the authors. Licensee MDPI, Basel, Switzerland. This article is an open access article distributed under the terms and conditions of the Creative Commons Attribution (CC BY) license (http://creativecommons.org/licenses/by/4.0/).
Share and Cite
MDPI and ACS Style
Dziendzikowski, M.; Niedbala, P.; Kurnyta, A.; Kowalczyk, K.; Dragan, K. Structural Health Monitoring of a Composite Panel Based on PZT Sensors and a Transfer Impedance Framework. Sensors 2018, 18, 1521. https://doi.org/10.3390/s18051521
AMA Style
Dziendzikowski M, Niedbala P, Kurnyta A, Kowalczyk K, Dragan K. Structural Health Monitoring of a Composite Panel Based on PZT Sensors and a Transfer Impedance Framework. Sensors. 2018; 18(5):1521. https://doi.org/10.3390/s18051521
Chicago/Turabian StyleDziendzikowski, Michal, Patryk Niedbala, Artur Kurnyta, Kamil Kowalczyk, and Krzysztof Dragan. 2018. "Structural Health Monitoring of a Composite Panel Based on PZT Sensors and a Transfer Impedance Framework" Sensors 18, no. 5: 1521. https://doi.org/10.3390/s18051521
Note that from the first issue of 2016, this journal uses article numbers instead of page numbers. See further details here.