Magnetic Detection Structure for Lab-on-Chip Applications Based on the Frequency Mixing Technique

 ,
,  , , and
Abstract
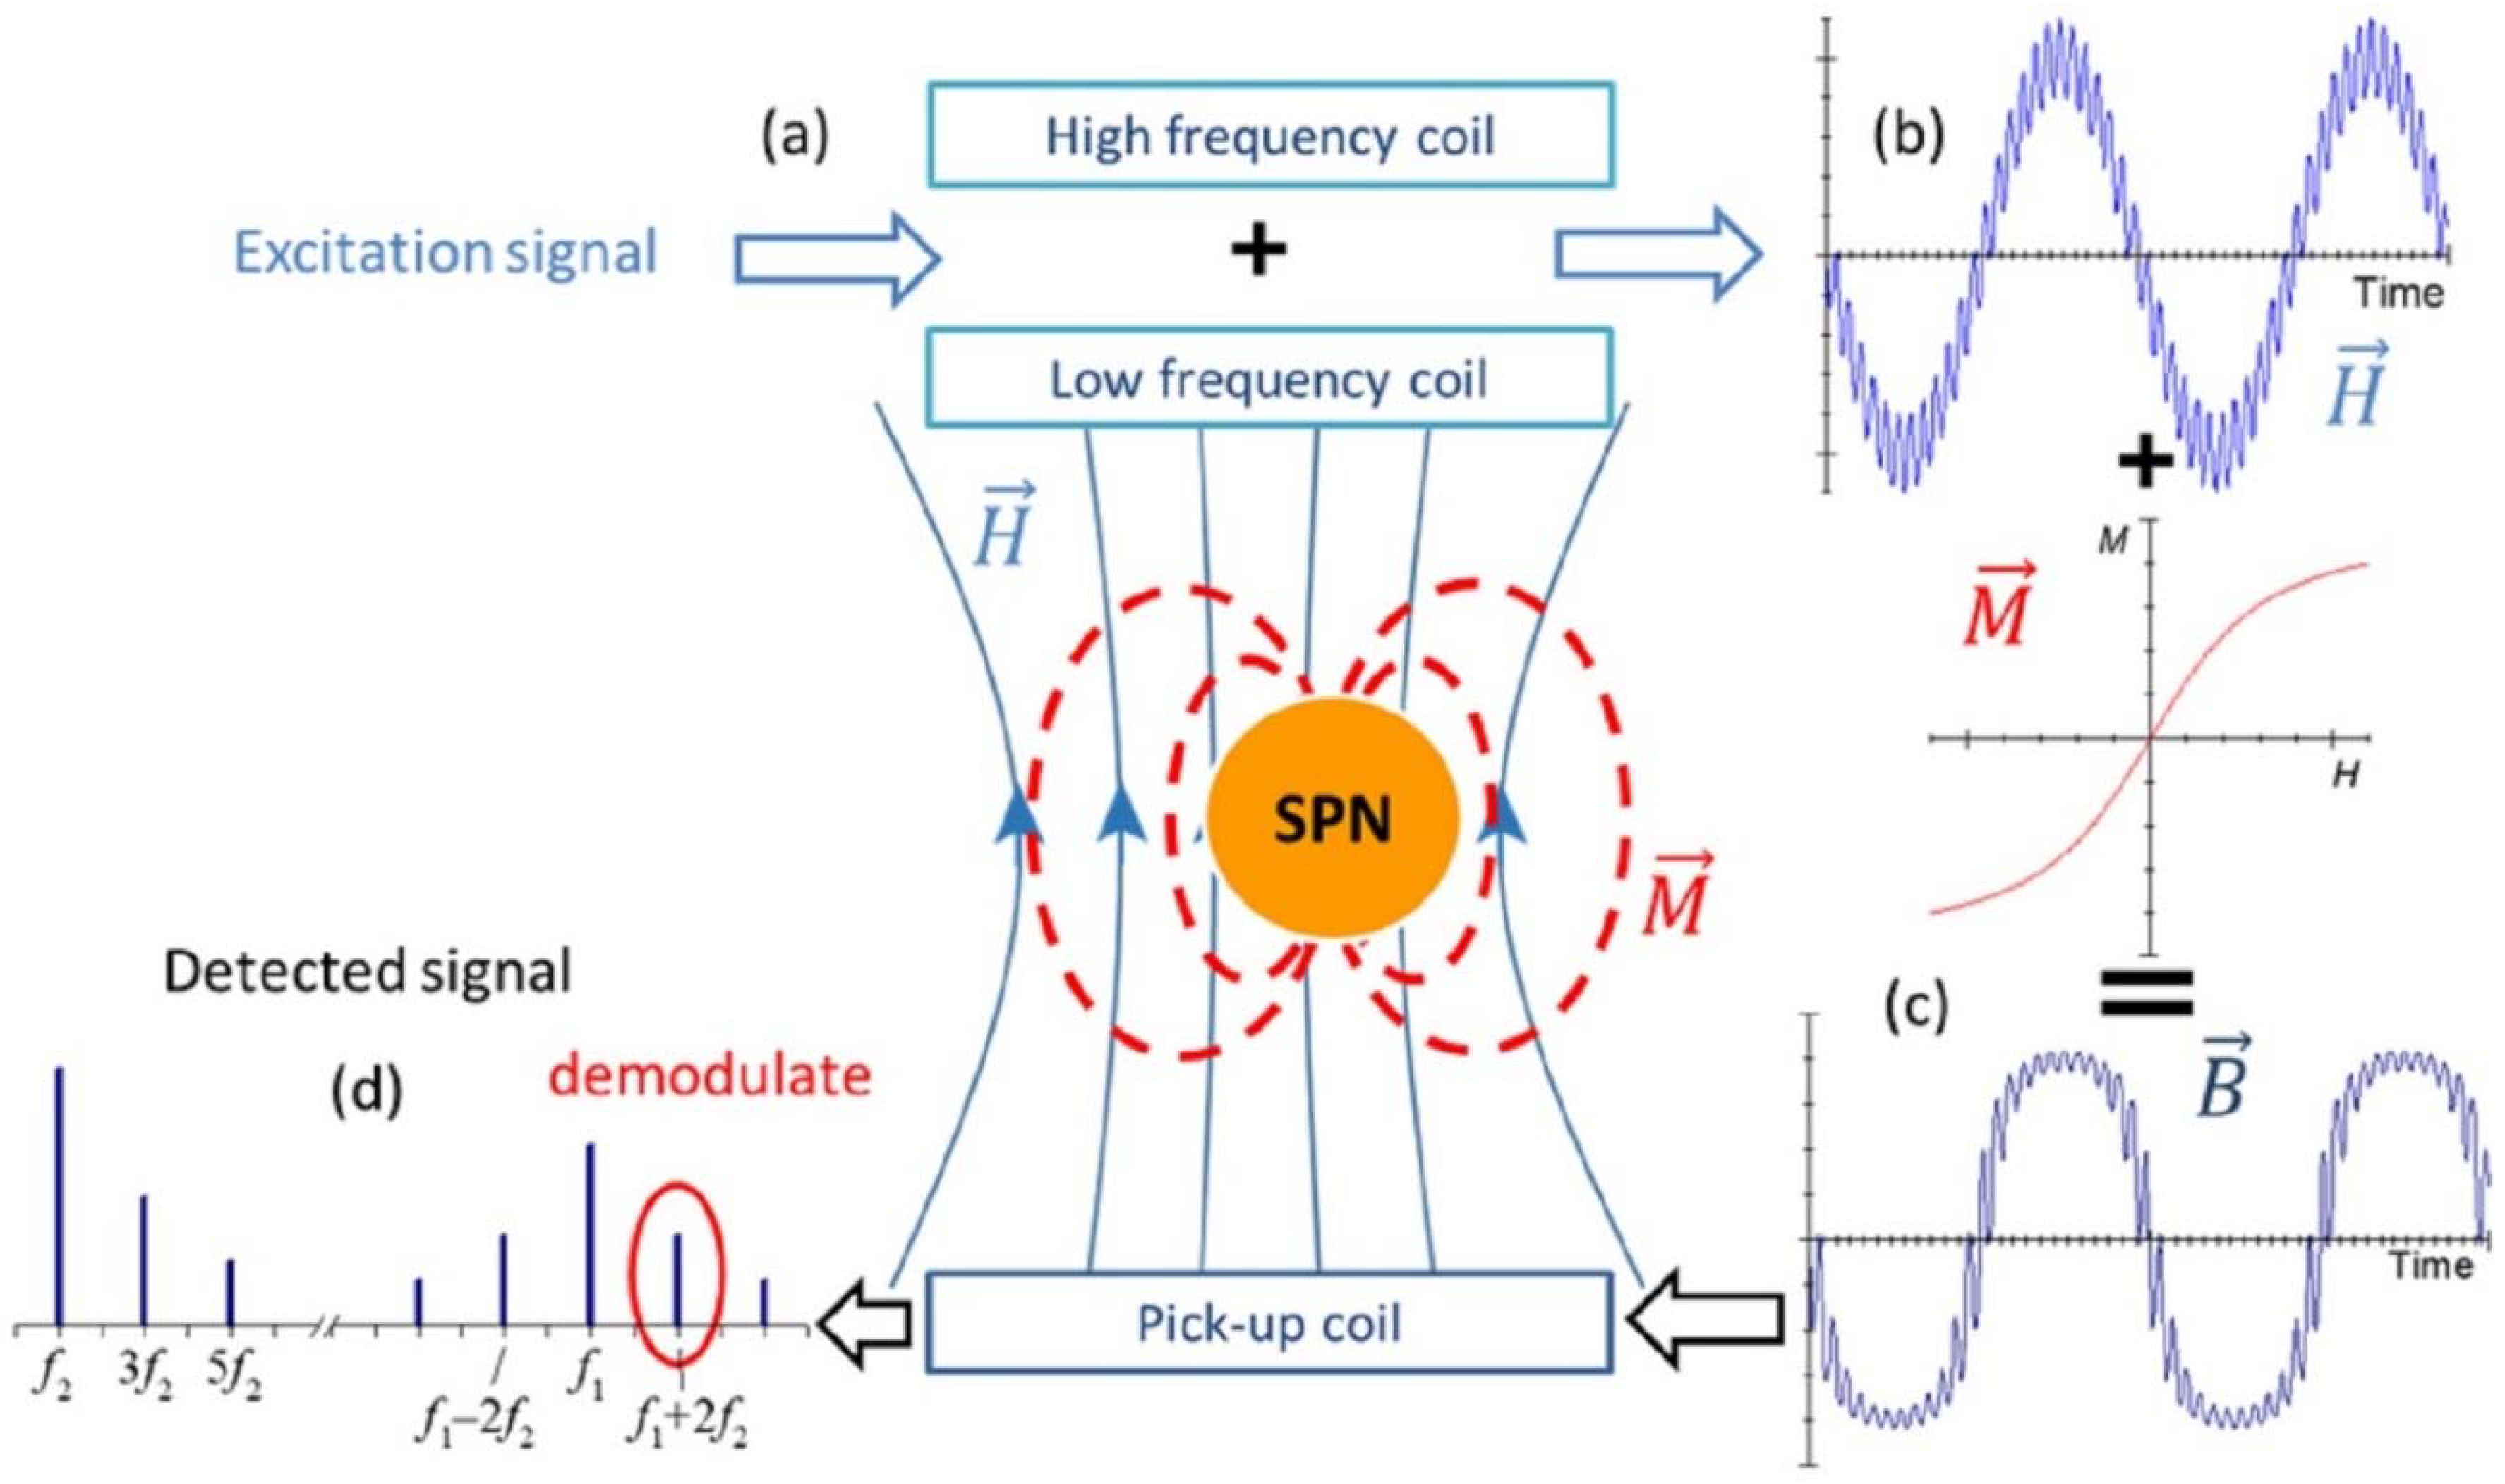
:1. Introduction
2. Design and Optimization of the Structure
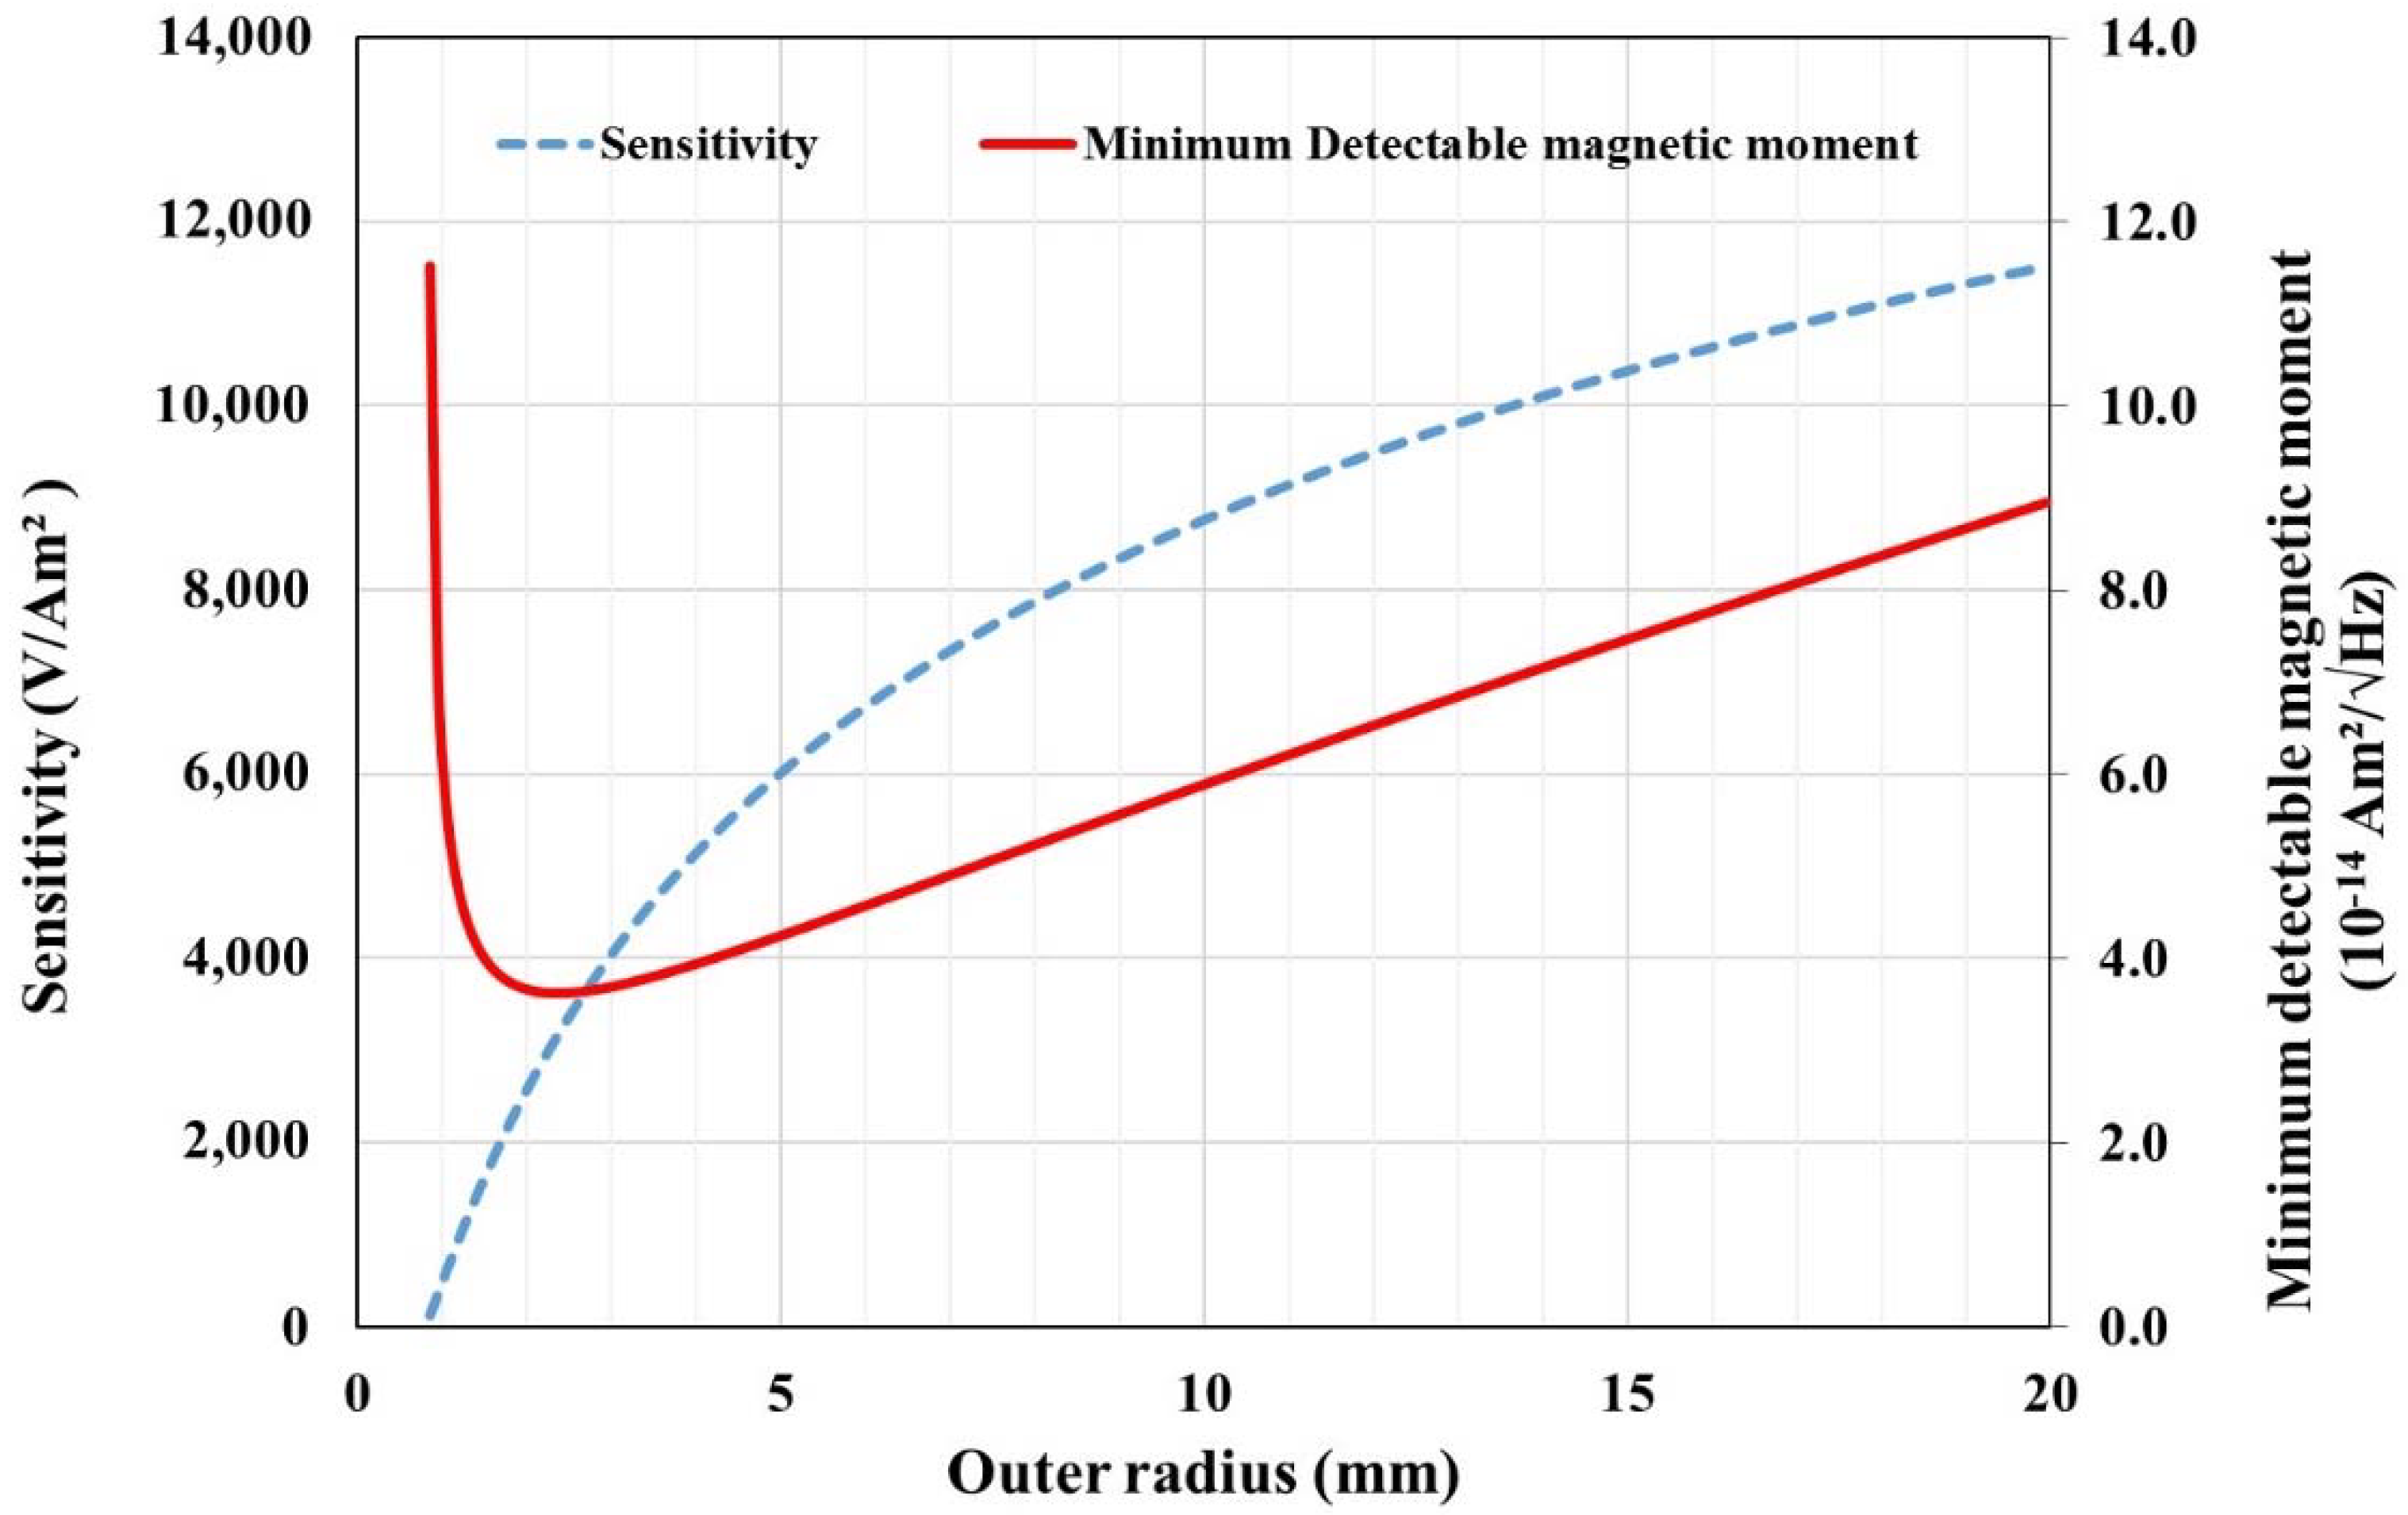
2.1. Pick-Up Coil Optimization
2.2. Excitation Coils Optimization
3. Materials and Methods
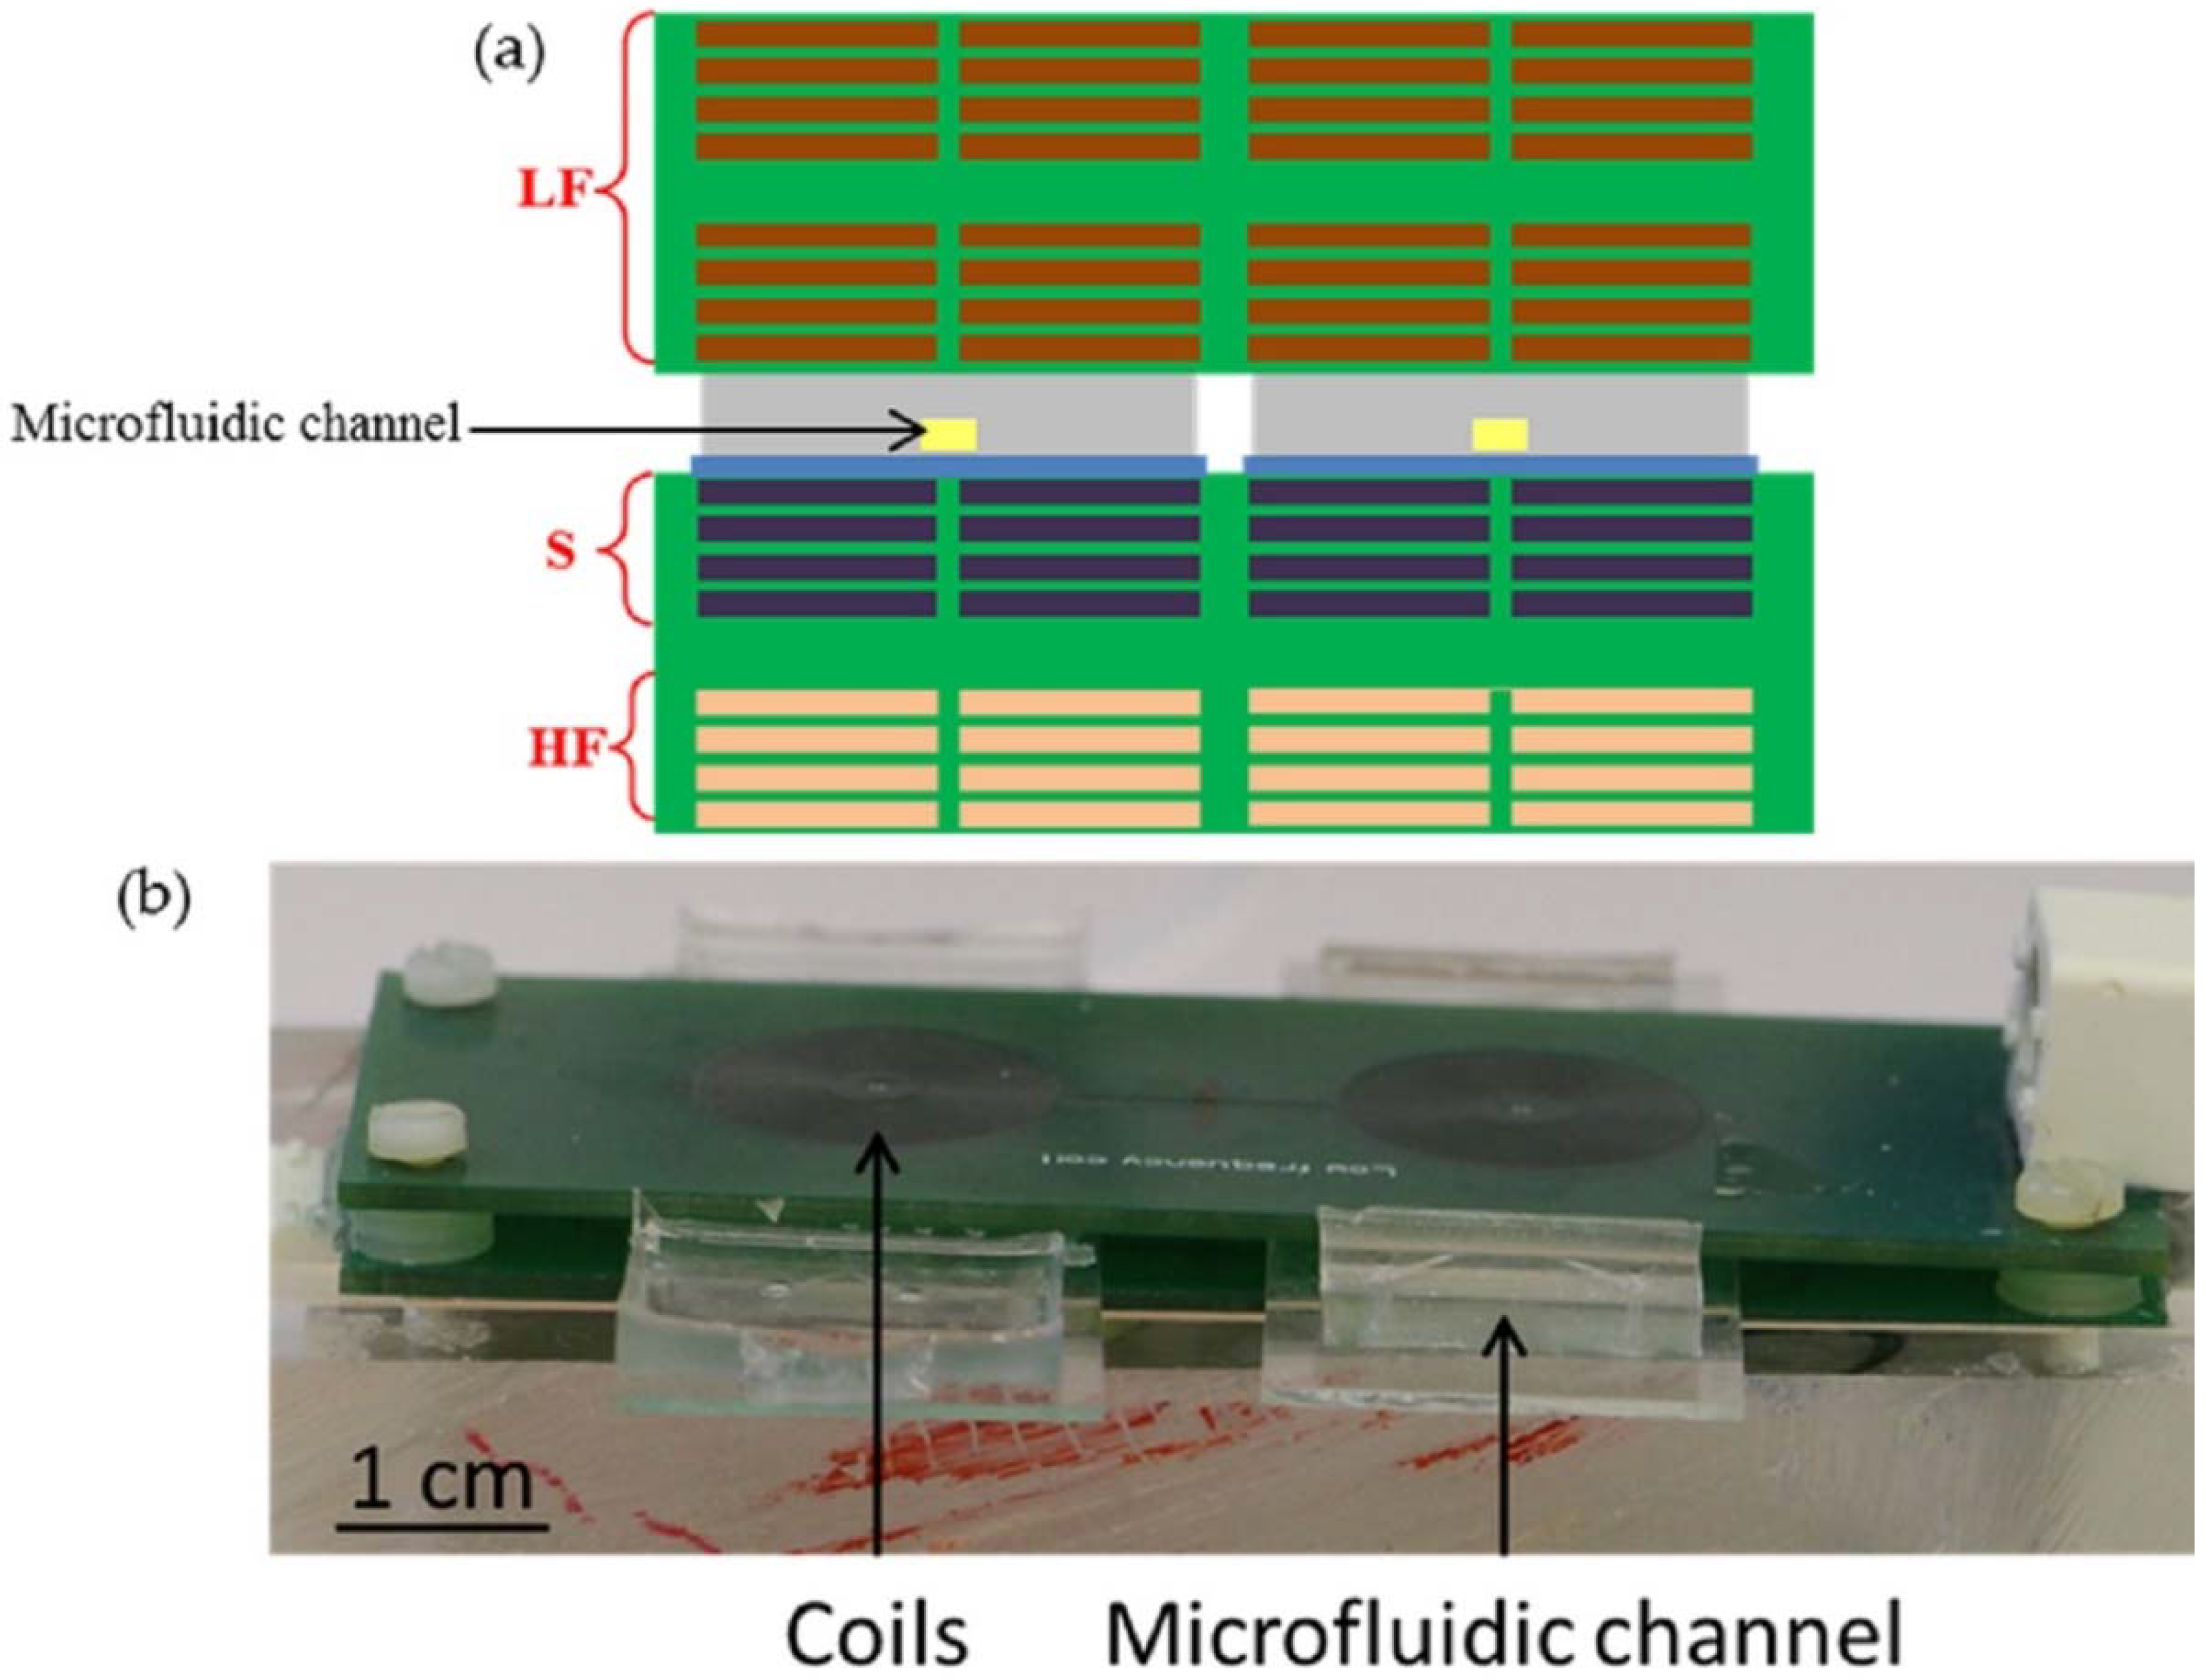
3.1. Magnetic Detection Device
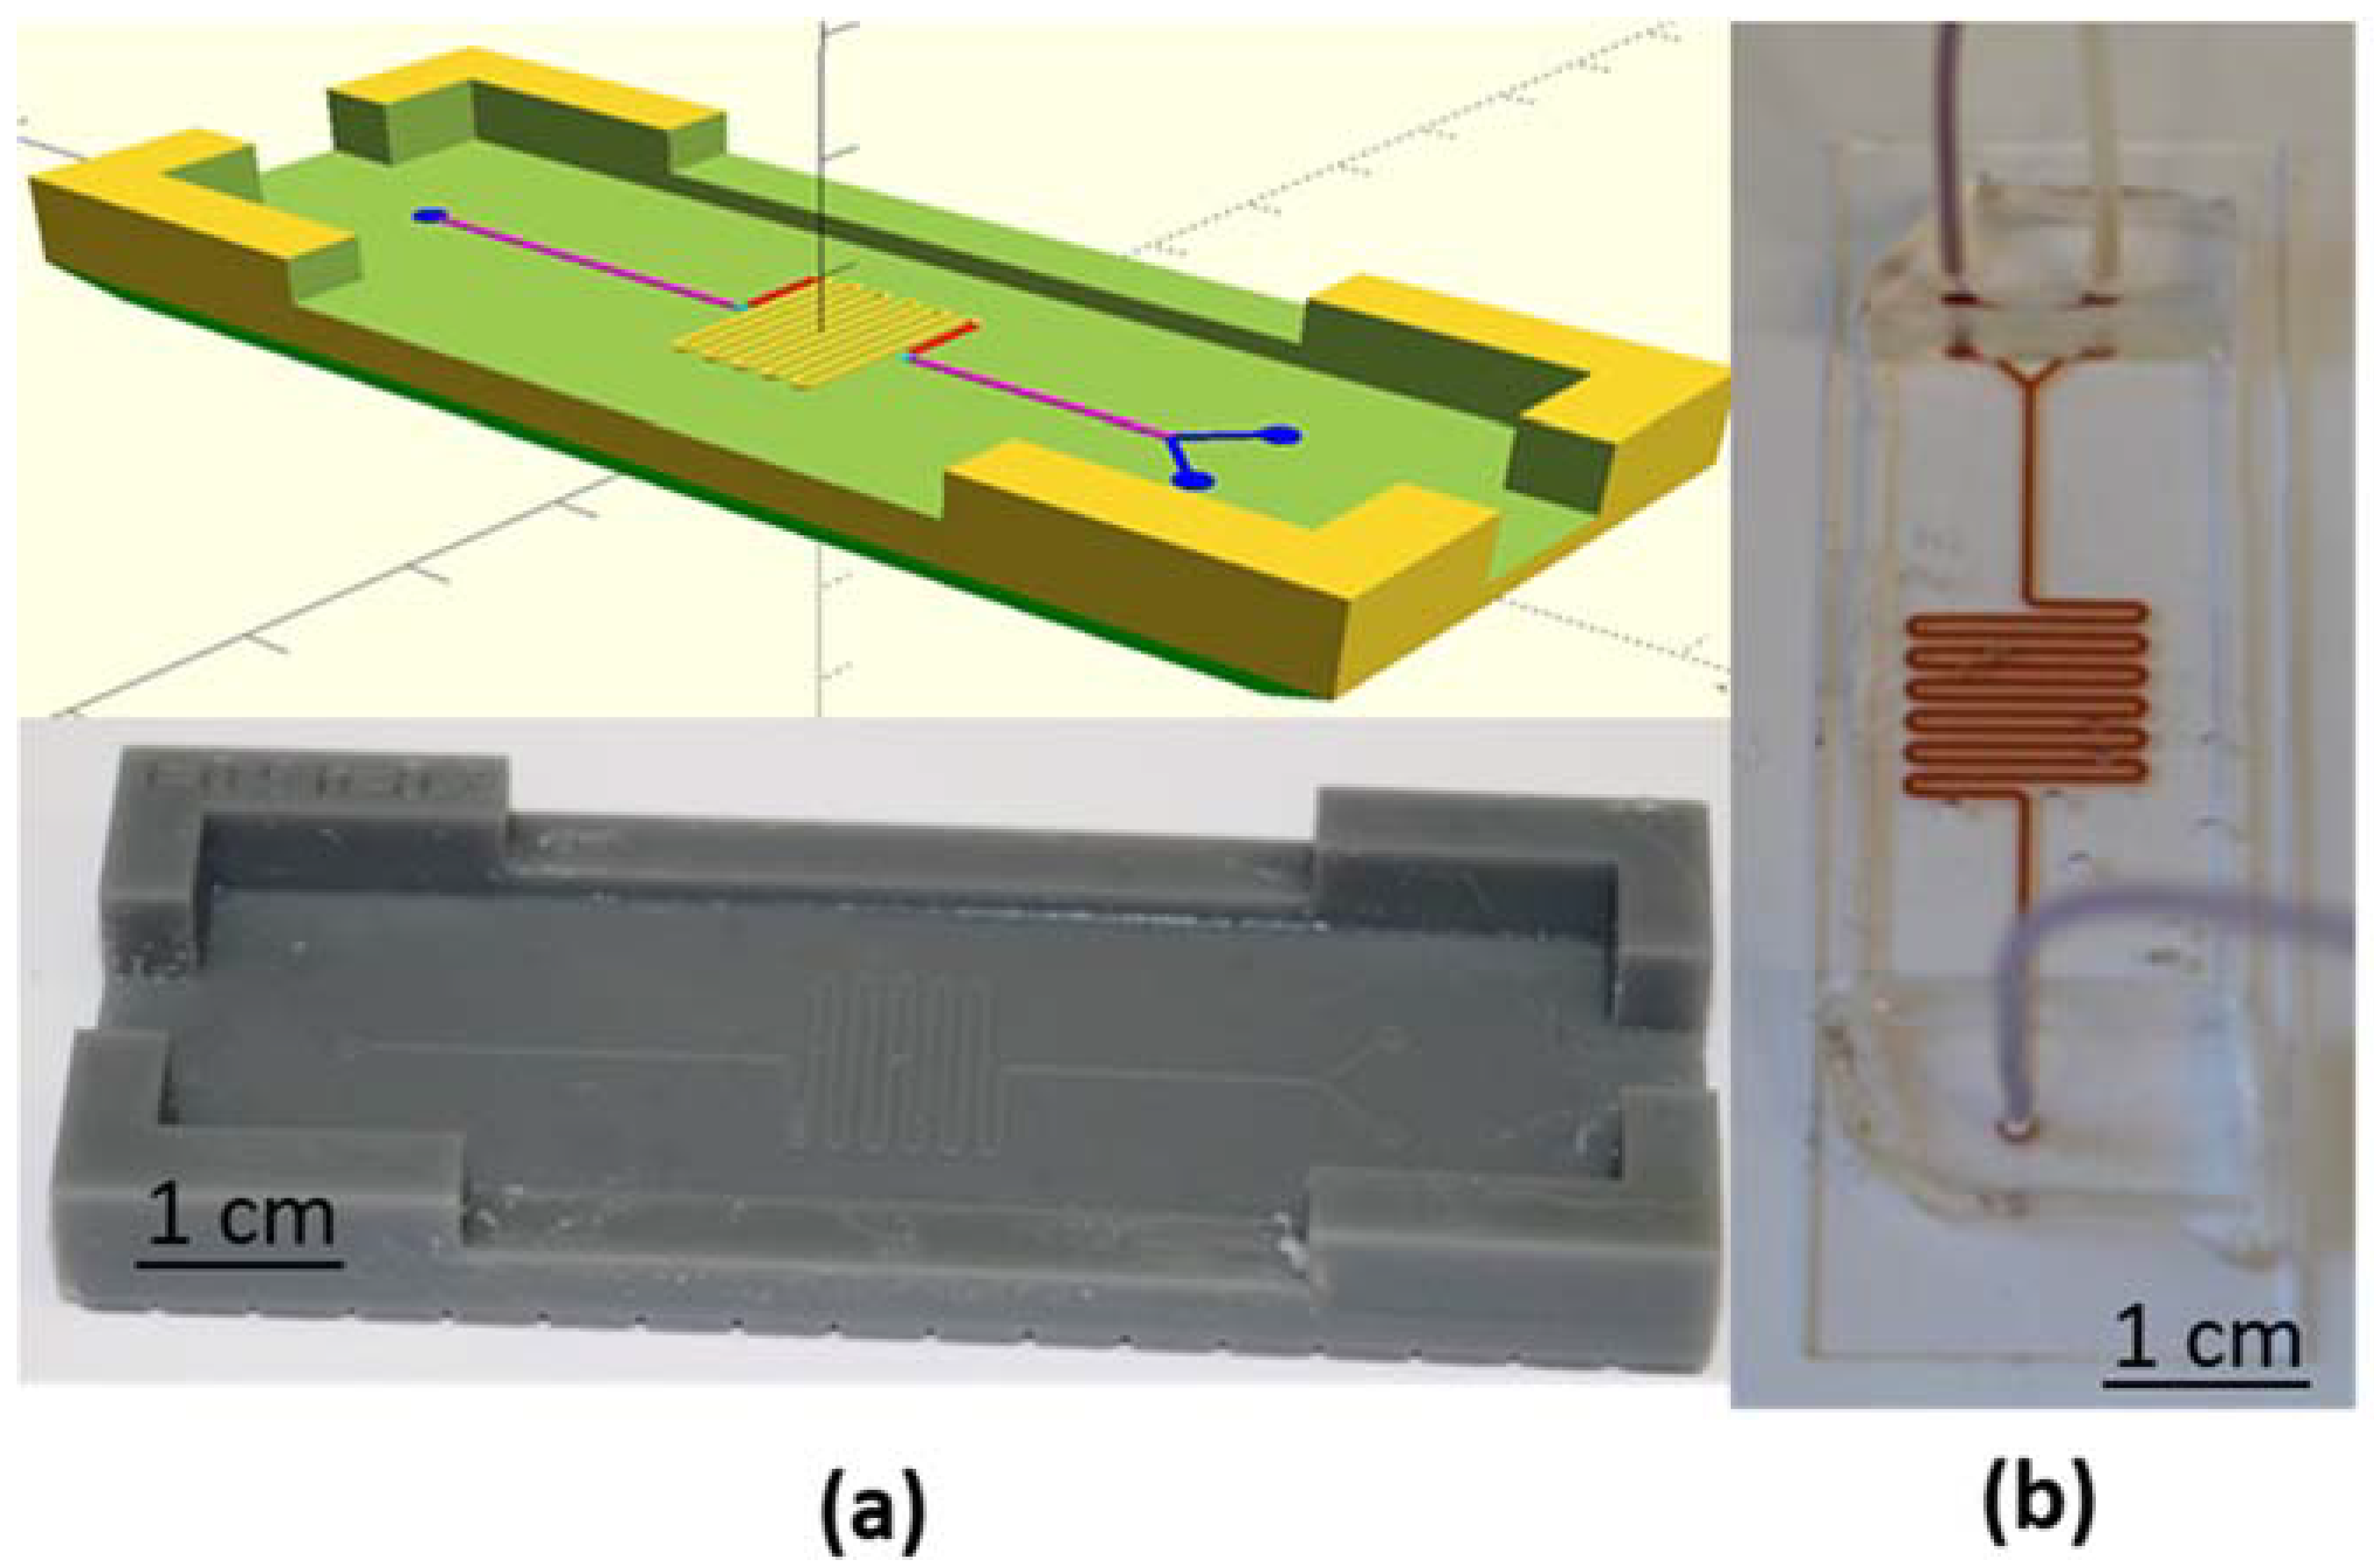
3.2. Microfluidic Channel
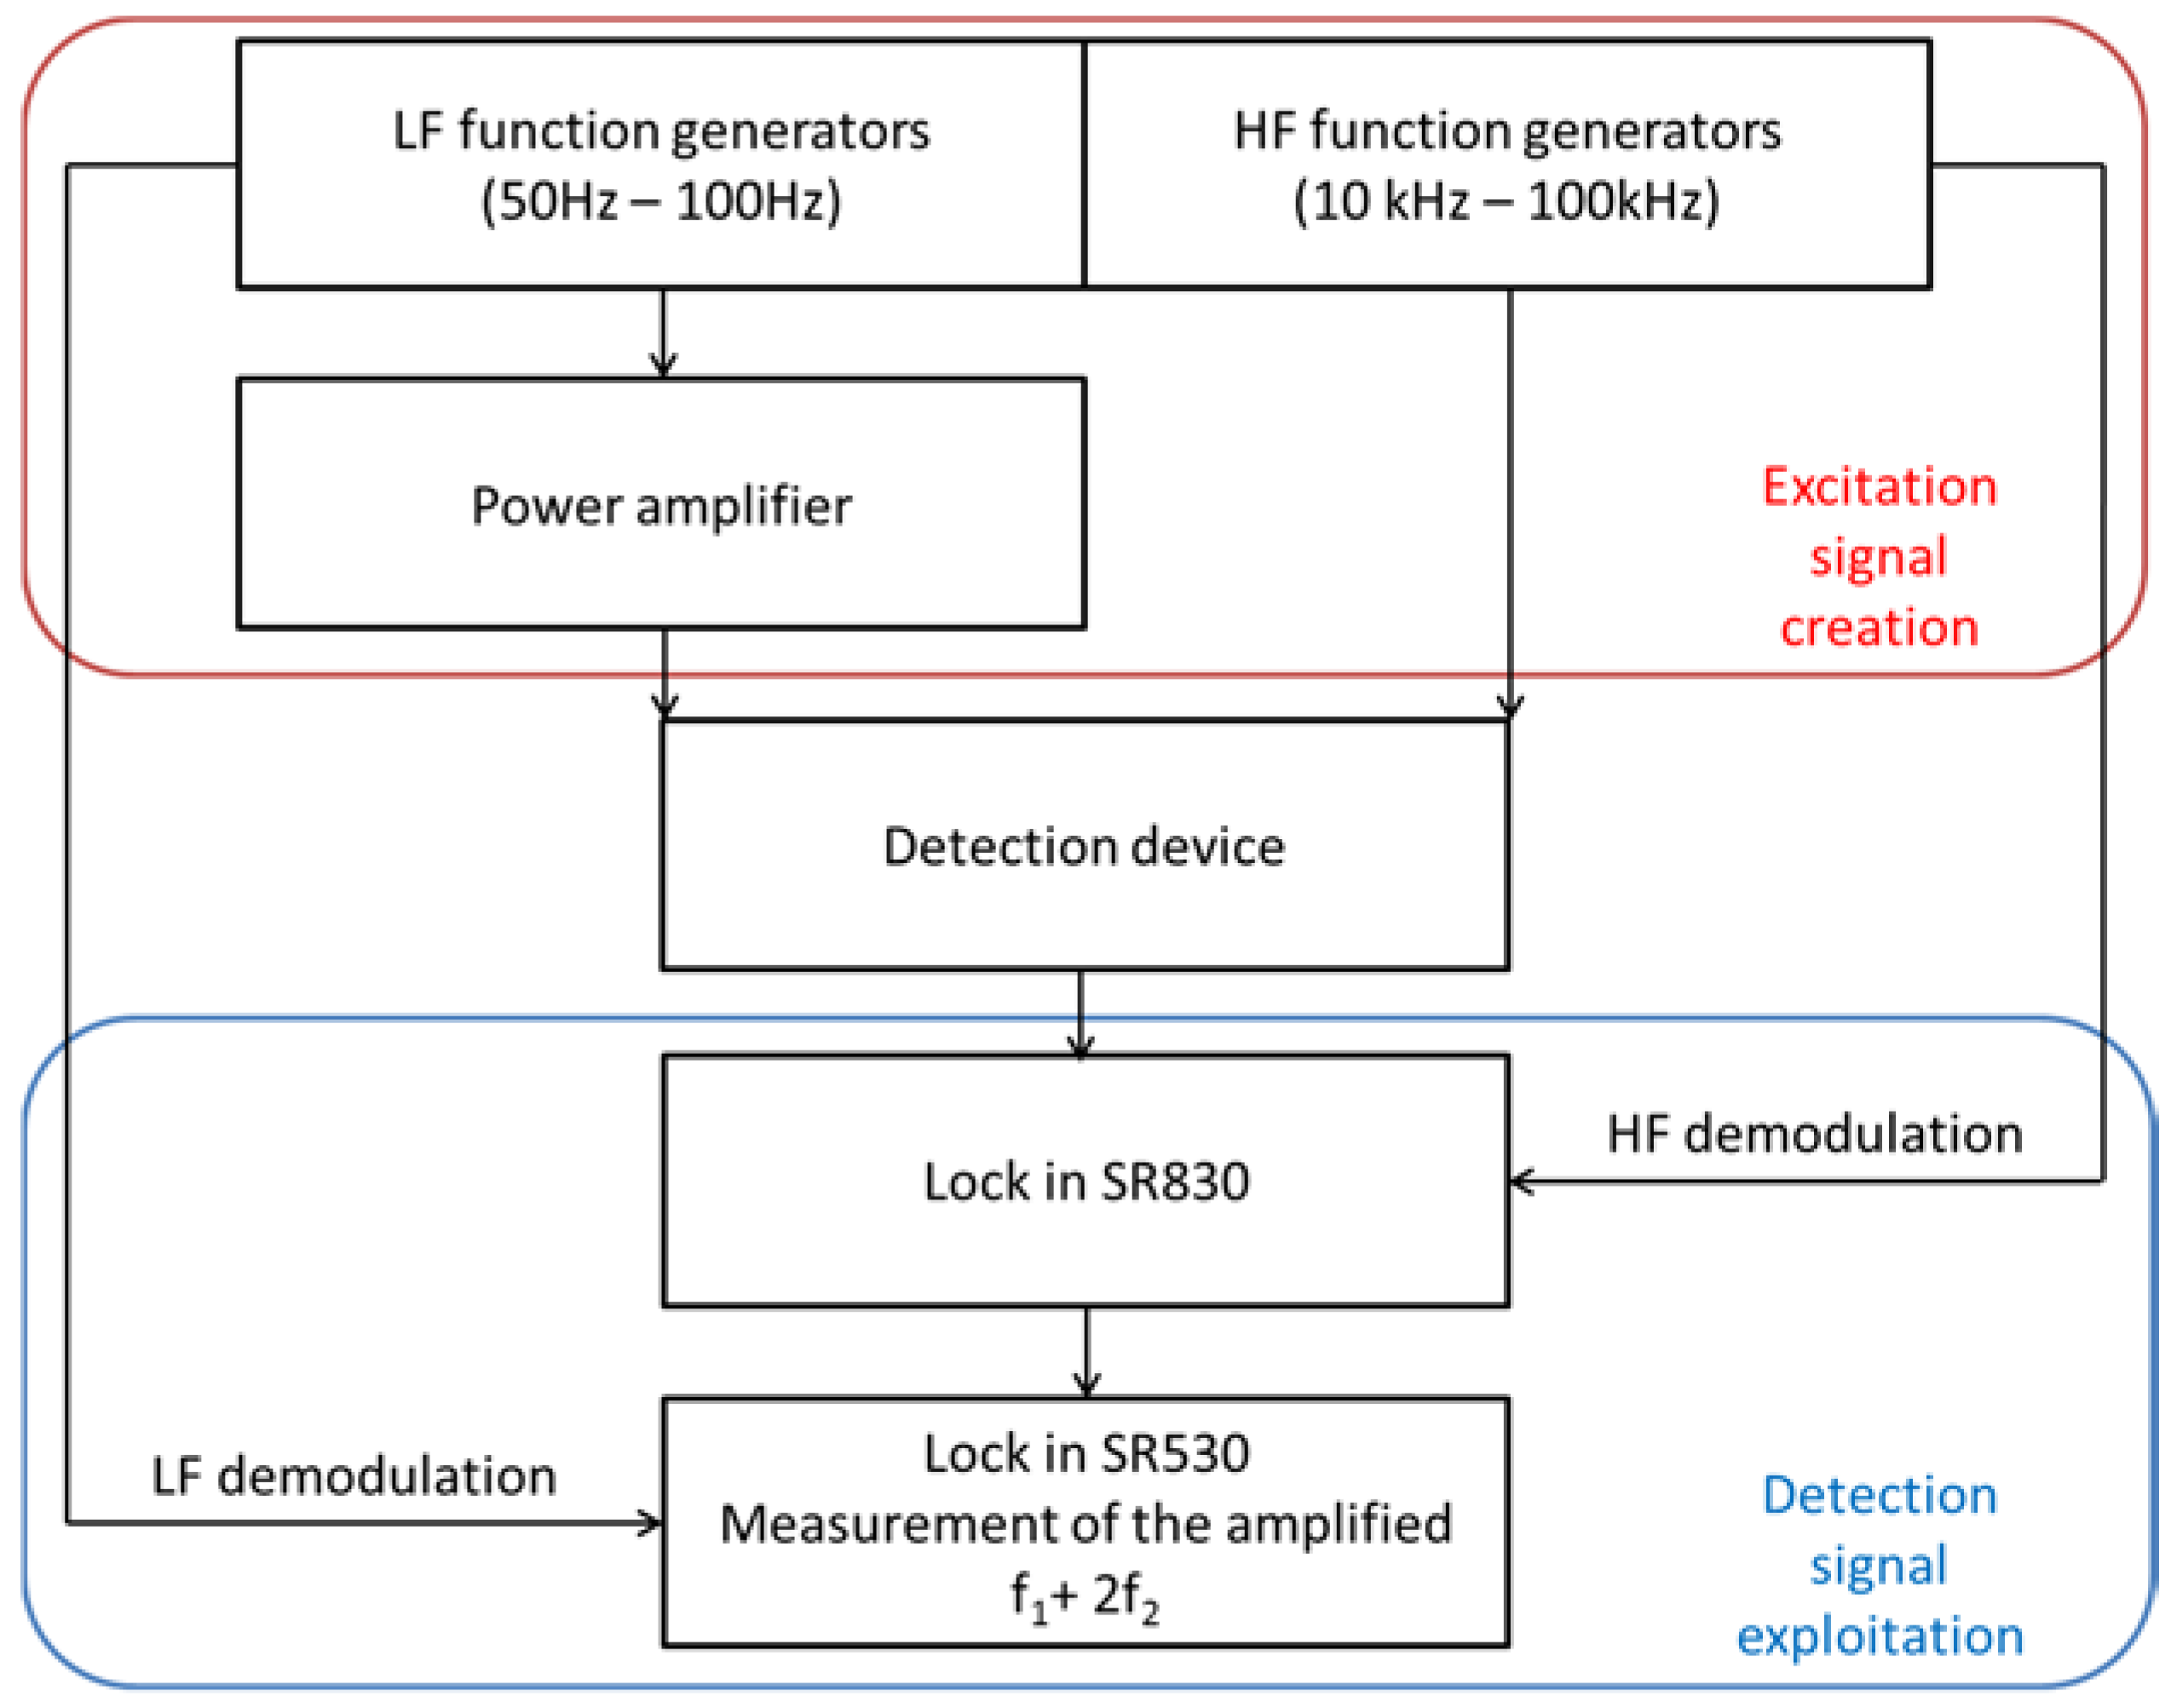
3.3. Test Bench
4. Results and Discussion
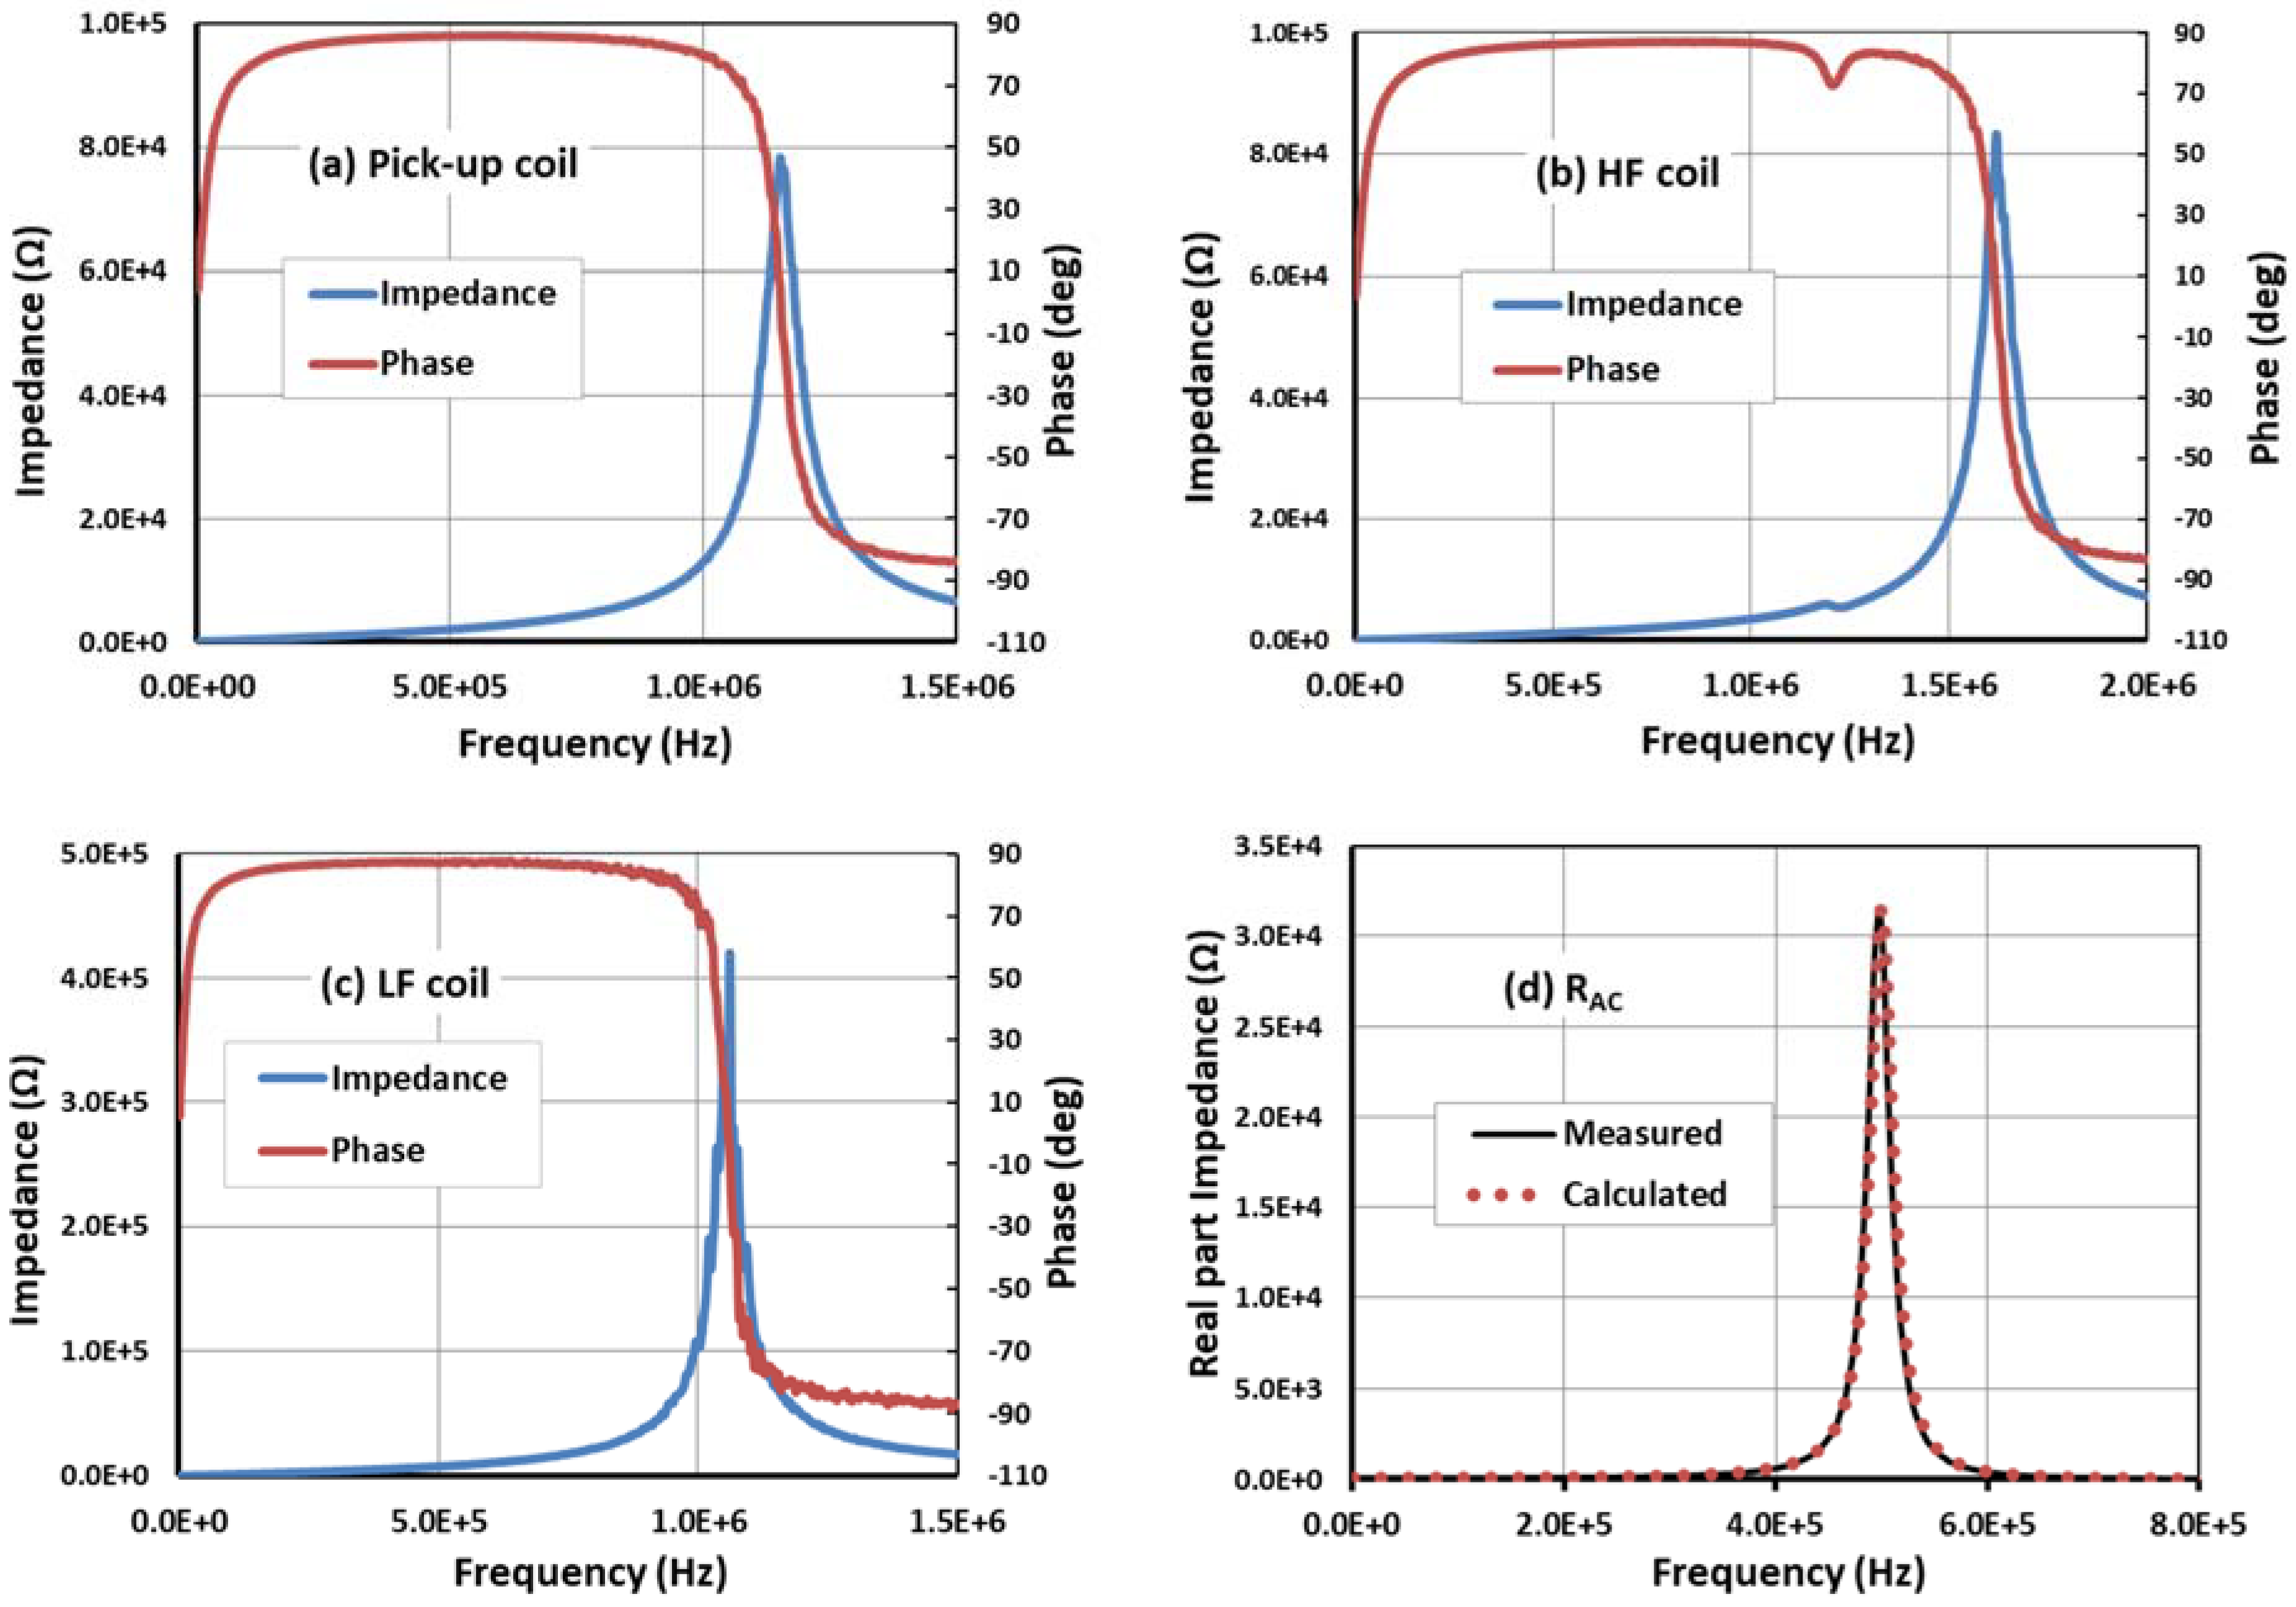
4.1. Characterization of the Structure
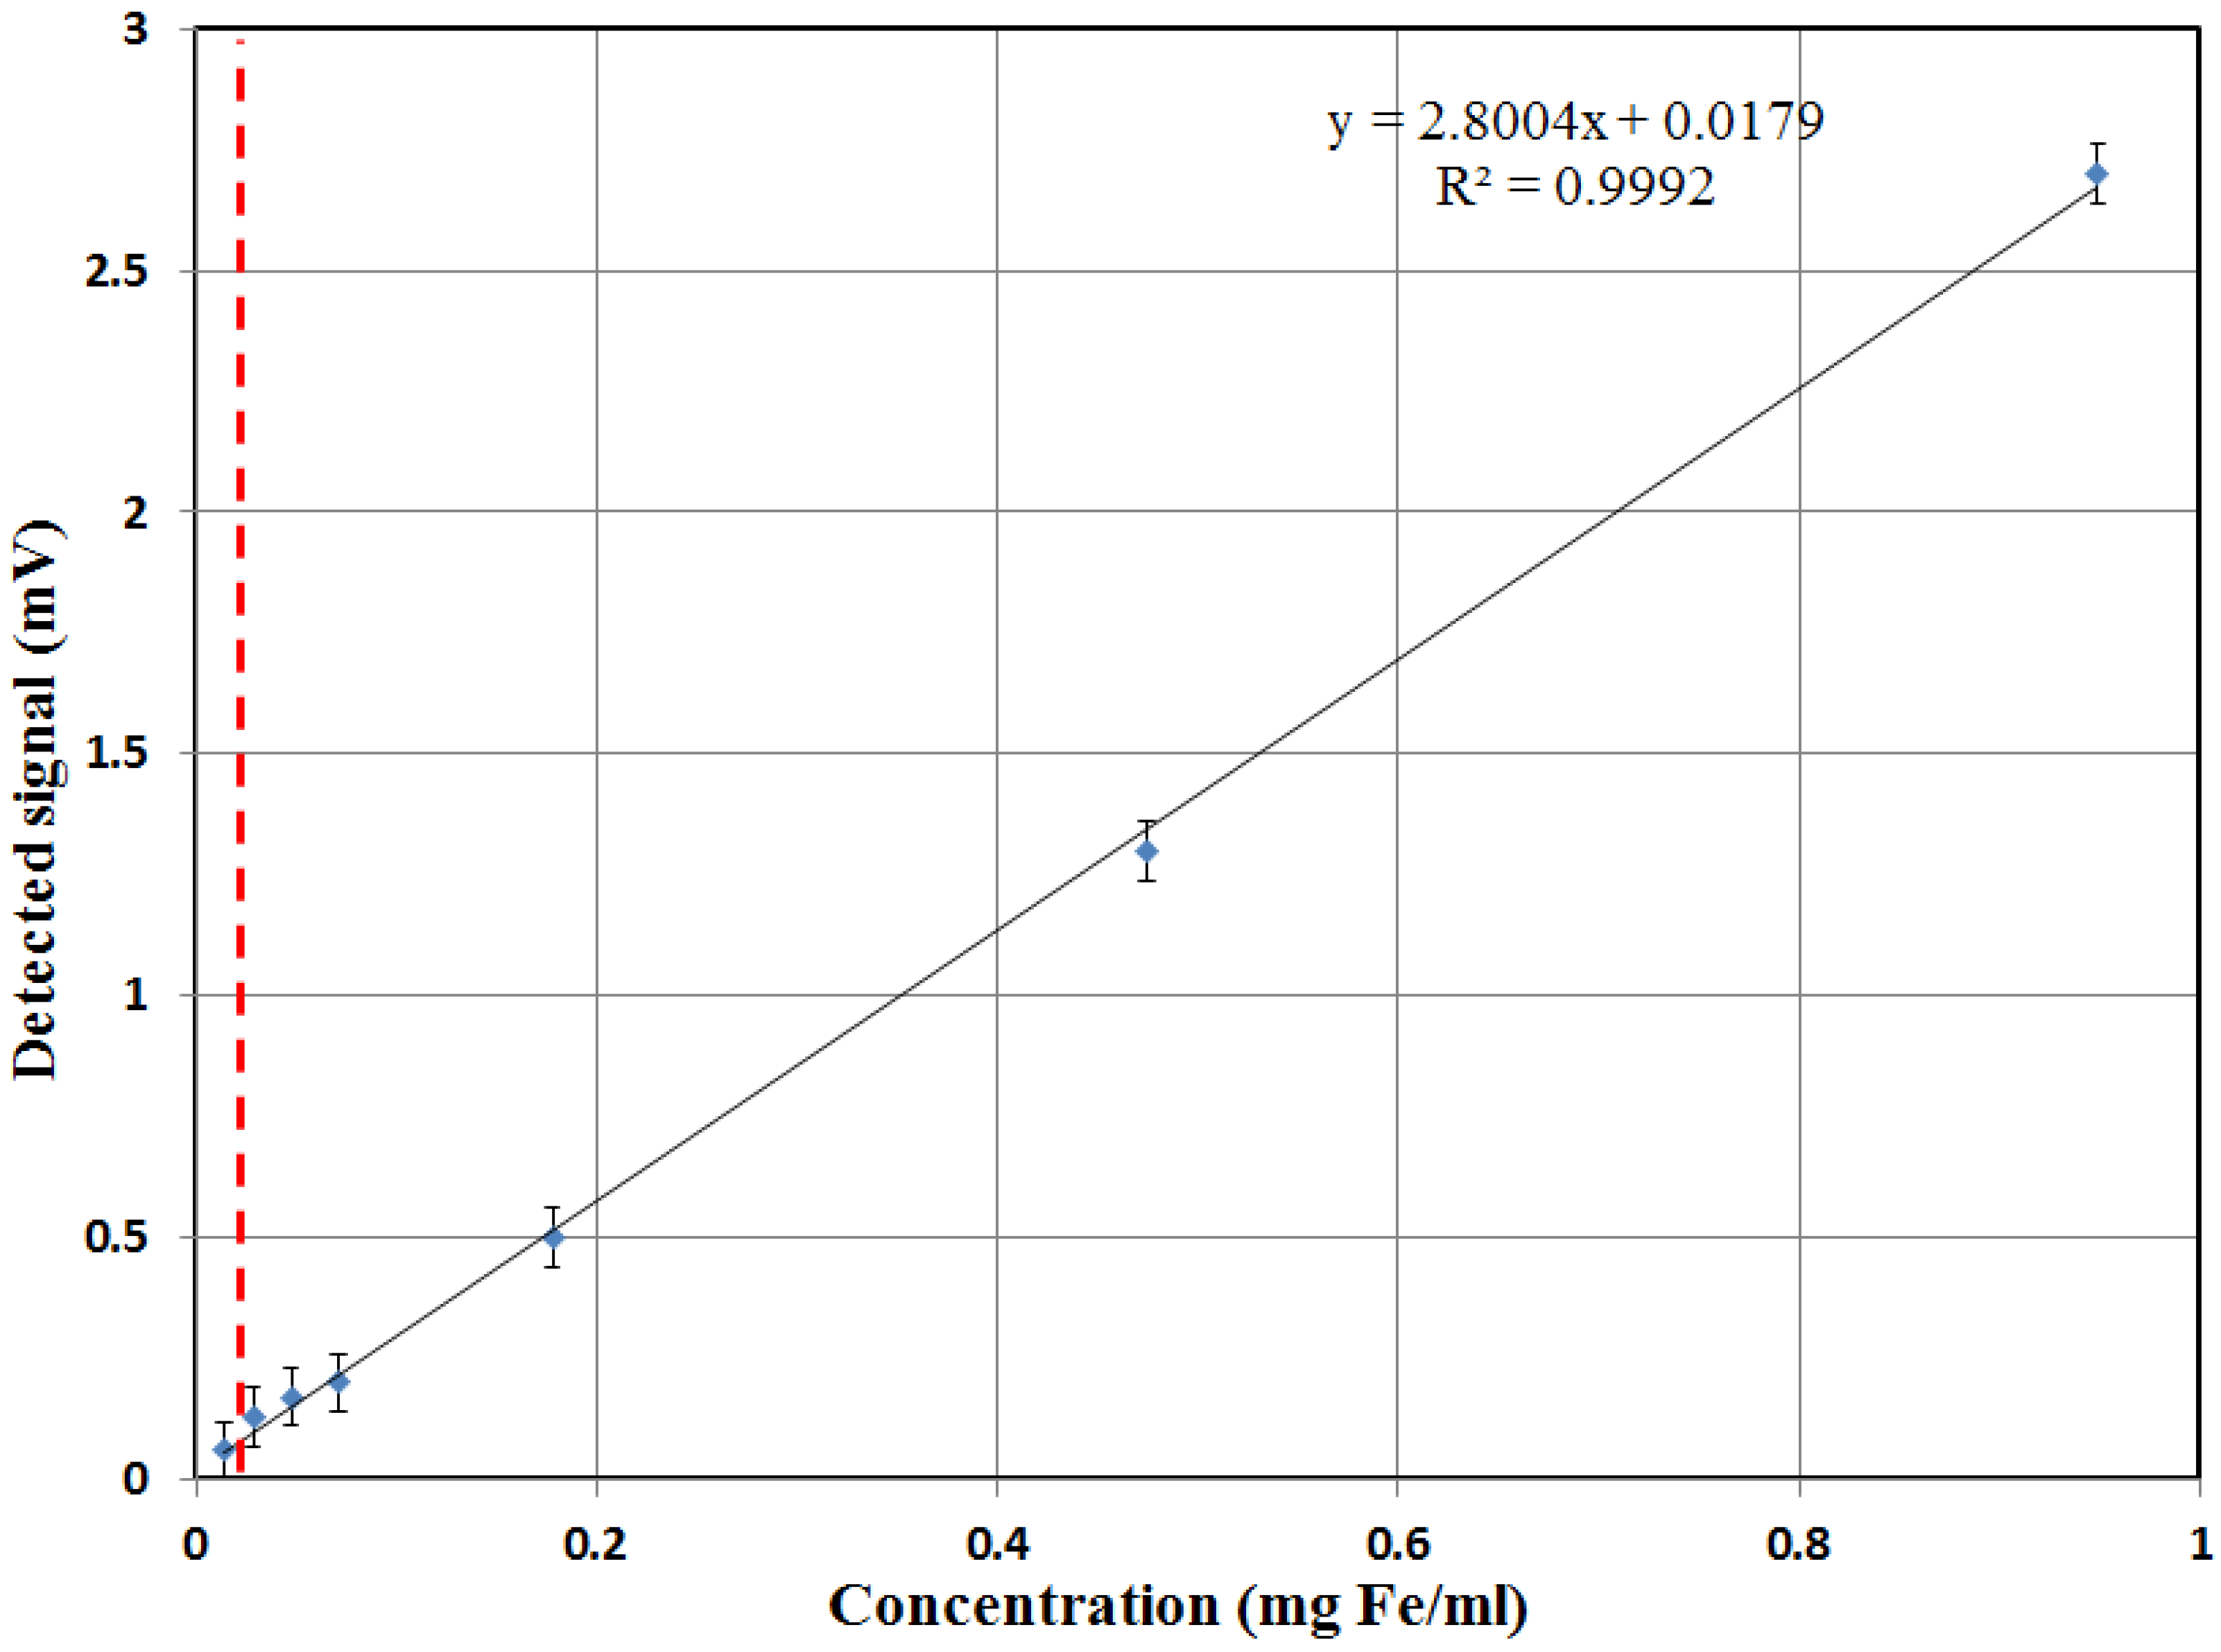
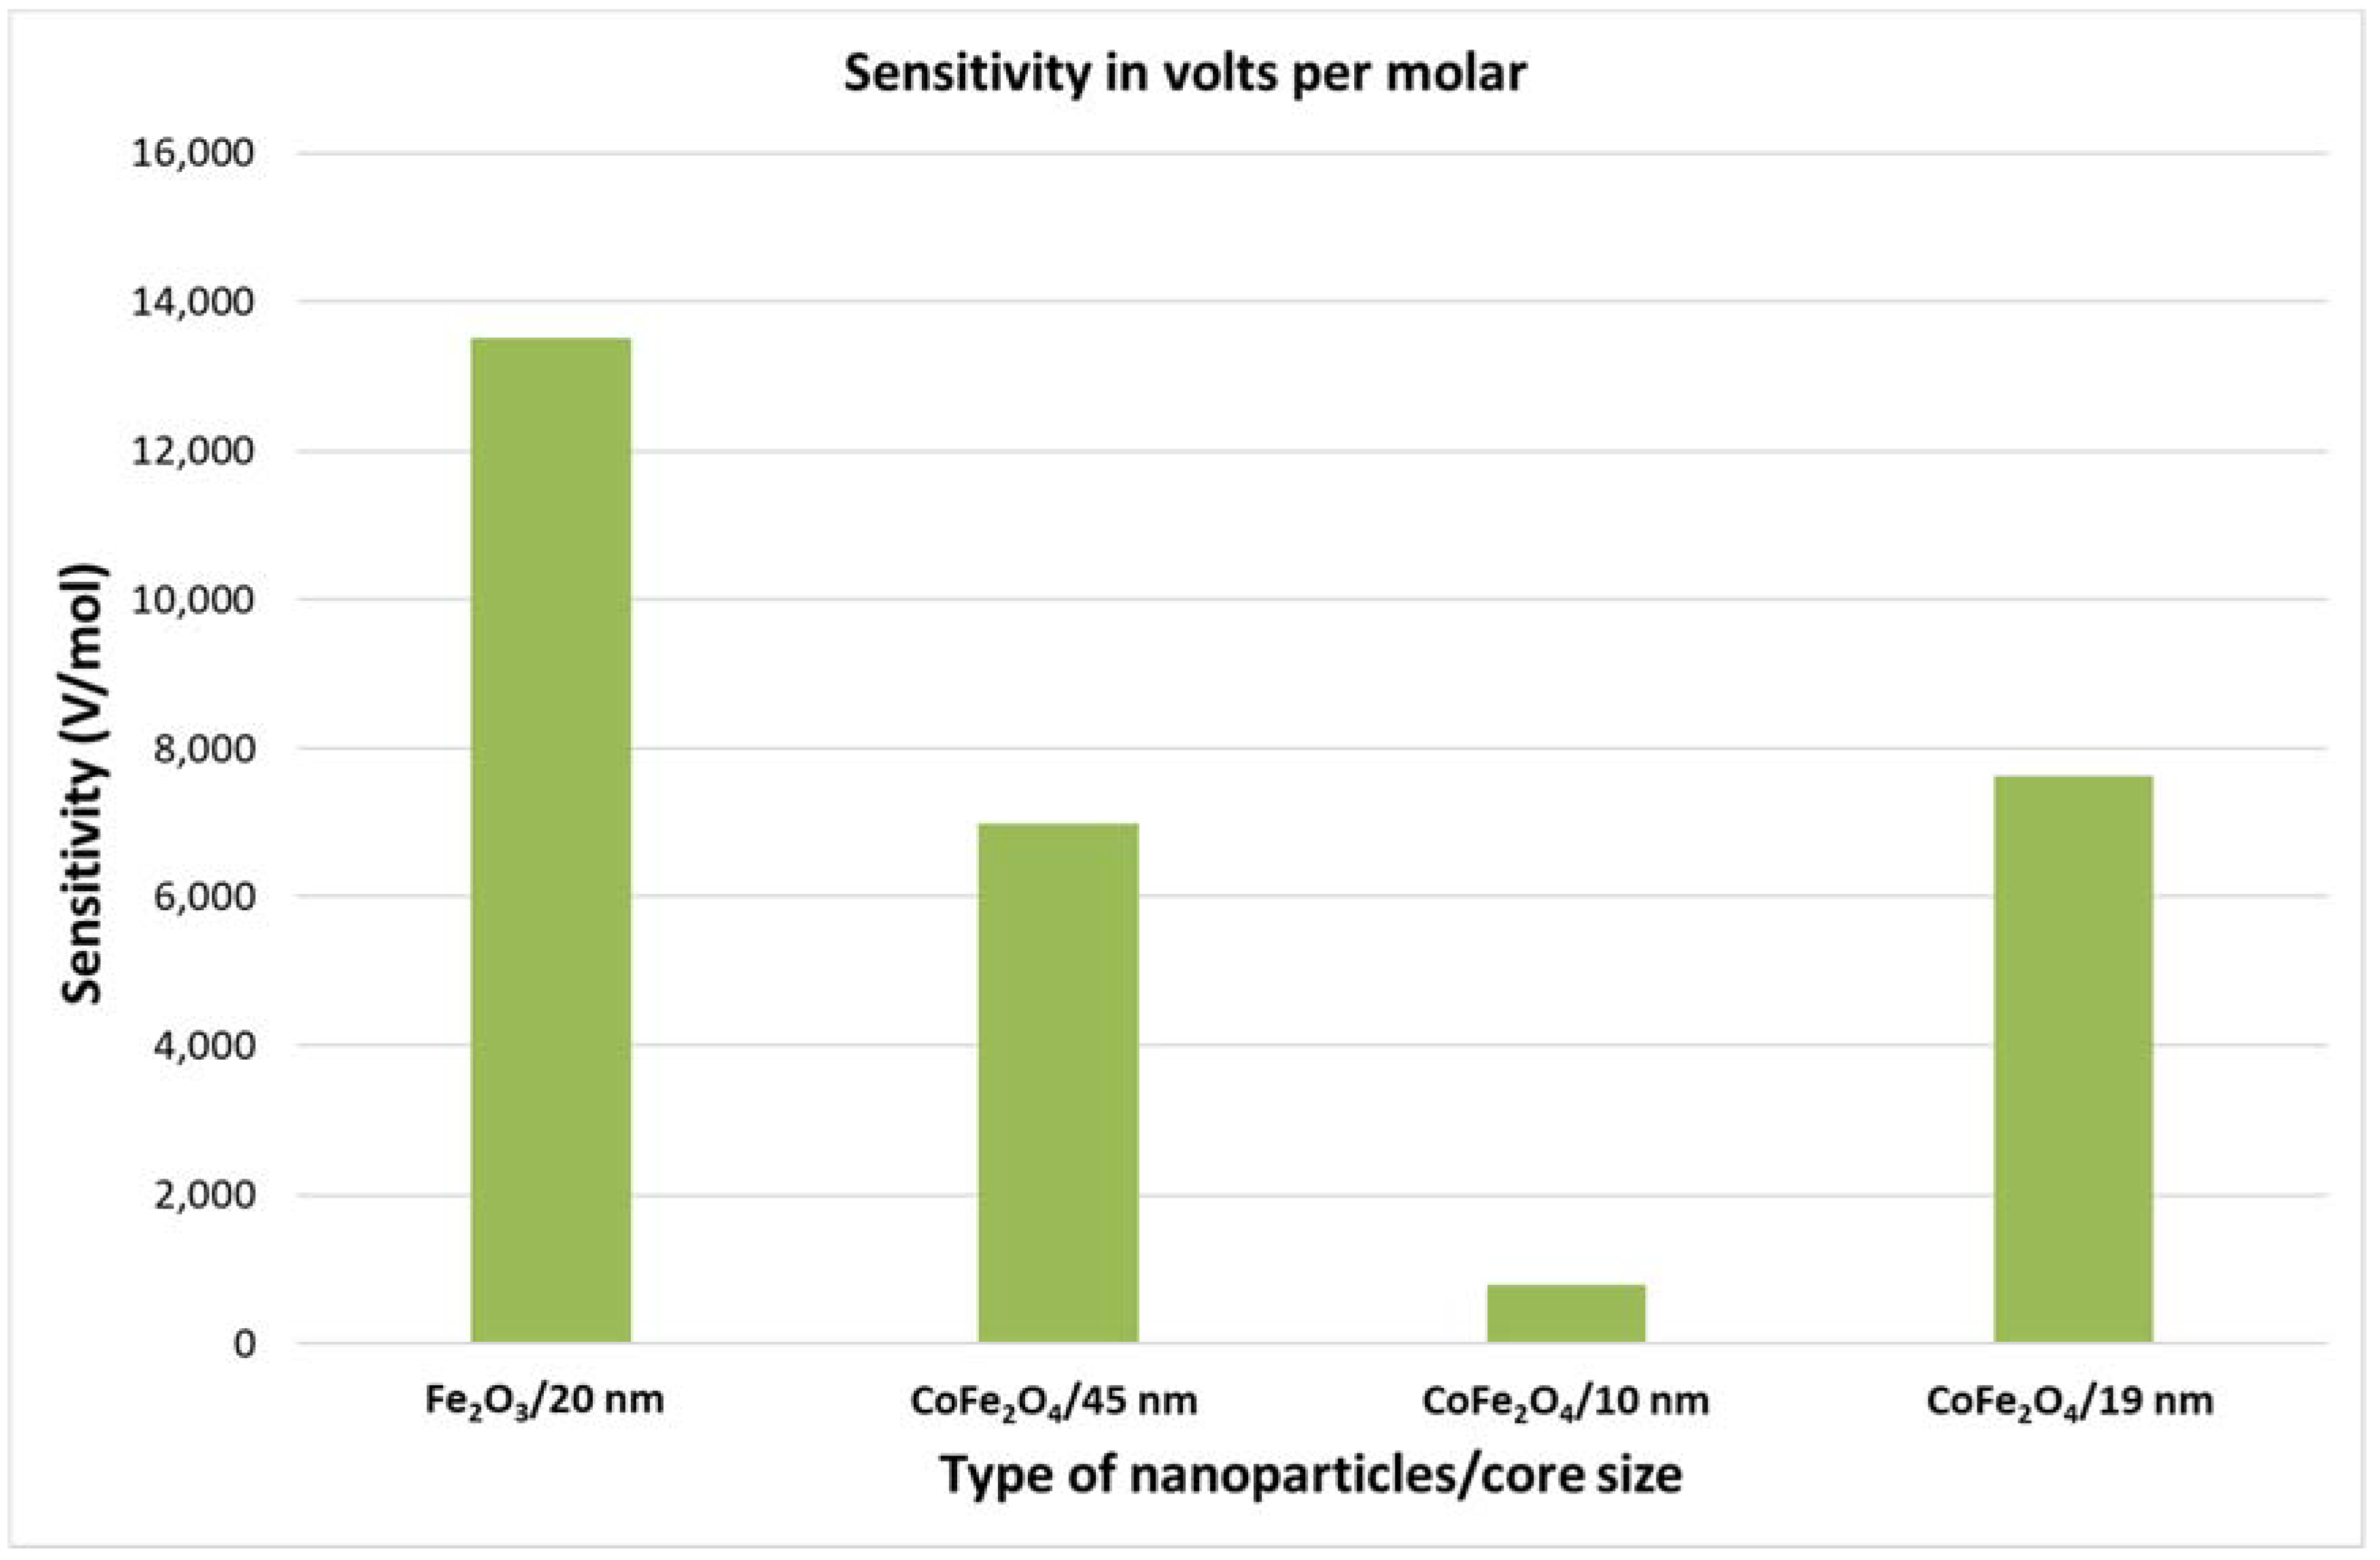
4.2. Sensing Performance of the Device with SPN
5. Conclusions
6. Patents
Supplementary Materials
Author Contributions
Funding
Acknowledgments
Conflicts of Interest
References
- Niemz, A.; Ferguson, T.M.; Boyle, D.S. Point-of-care nucleic acid testing for infectious diseases. Trends Biotechnol. 2011, 29, 240–250. [Google Scholar] [CrossRef] [PubMed]
- Choi, S.; Goryll, M.; Mandy Sin, L.Y.; Wong, P.K.; Chae, J. Microfluidic-based biosensors toward point-of-care detection of nucleic acids and proteins. Microfluid. Nanofluid. 2011, 10, 231–247. [Google Scholar] [CrossRef]
- Wu, J.; Gu, M. Microfluidic sensing: State of the art fabrication and detection techniques. J. Biomed. Opt. 2011, 16, 080901. [Google Scholar] [CrossRef] [PubMed]
- Mairhofer, J.; Roppert, K.; Ertl, P. Microfluidic systems for pathogen sensing: A review. Sensors 2009, 9, 4804–4823. [Google Scholar] [CrossRef] [PubMed]
- Ng, A.H.; Uddayasankar, U.; Wheeler, A.R. Immunoassays in microfluidic systems. Anal. Bioanal. Chem. 2010, 397, 991–1007. [Google Scholar] [CrossRef] [PubMed]
- Arlett, J.; Myers, E.B.; Roukes, M.L. Comparative advantages of mechanical biosensors. Nat. Nanotechnol. 2011, 6, 203–215. [Google Scholar] [CrossRef] [PubMed]
- Vigneshvar, S.; Sudhakumari, C.C.; Senthilkumaran, B.; Prakash, H. Recent Advances in Biosensor technology for potential applications—An overview. Front. Bioeng. Biotechnol. 2016, 4, 11. [Google Scholar] [CrossRef] [PubMed]
- Koh, I.; Josephson, L. Magnetic nanoparticle sensors. Sensors 2009, 9, 8130–8145. [Google Scholar] [CrossRef] [PubMed] [Green Version]
- Haun, J.B.; Yoon, T.J.; Lee, H.; Weissleder, R. Magnetic nanoparticle biosensors. Wiley Interdiscip. Rev. Nanomed. Nanobiotechnol. 2010, 2, 291–304. [Google Scholar] [CrossRef] [PubMed]
- Baselt, D.R.; Lee, G.U.; Natesan, M.; Metzger, S.W.; Sheehan, P.E.; Colton, R.J. A biosensor based on magnetoresistance technology. Biosens. Bioelectron. 1998, 13, 731–739. [Google Scholar] [CrossRef]
- Lee, H.; Shin, T.H.; Cheon, J.; Weissleder, R. Recent developments in magnetic diagnostic systems. Chem. Rev. 2015, 115, 10690–10724. [Google Scholar] [CrossRef] [PubMed]
- Tamanaha, C.R.; Mulvaney, S.P.; Rife, J.C.; Whitman, L.J. Magnetic labeling, detection, and system integration. Biosens. Bioelectron. 2008, 24, 1–13. [Google Scholar] [CrossRef] [PubMed]
- Chen, Y.T.; Kolhatkar, A.G.; Zenasni, O.; Xu, S.; Lee, T.R. Biosensing Using Magnetic Particle Detection Techniques. Sensors 2017, 17, 2300. [Google Scholar] [CrossRef] [PubMed]
- Chung, H.J.; Castro, C.M.; Im, H.; Lee, H.; Weissleder, R. A magneto-DNA nanoparticle system for rapid detection and phenotyping of bacteria. Nat. Nanotechnol. 2013, 8, 369–375. [Google Scholar] [CrossRef] [PubMed]
- Chiriac, H.; Tibu, M.; Moga, A.-E.; Herea, D.D. Magnetic GMI sensor for detection of biomolecules. J. Magn. Magn. Mater. 2005, 293, 671–676. [Google Scholar] [CrossRef]
- Kurlyandskaya, G.V.; Levit, V.I. Advanced materials for drug delivery and biosensors based on magnetic label detection. Mater. Sci. Eng. C 2007, 27, 495–503. [Google Scholar] [CrossRef]
- Beato-López, J.J.; Pérez-Landazábal, J.I.; Gómez-Polo, C. Magnetic nanoparticle detection method employing non-linear magnetoimpedance effects. J. Appl. Phys. 2017, 121, 163901. [Google Scholar] [CrossRef]
- Nikitin, P.I.; Vetoshko, P.M.; Ksenevich, T.I. Clinical Applications of Magnetic Nanoparticles. J. Magn. Magn. Mater. 2007, 311, 445–449. [Google Scholar] [CrossRef]
- Do, J.; Ahn, C.H. A polymer lab-on-a-chipfor magnetic immunoassay with on-chip sampling and detection capabilities. Lab Chip 2008, 8, 542–549. [Google Scholar] [CrossRef] [PubMed]
- Meyer, M.H.F.; Hartmann, M.; Krause, H.-J.; Blankenstein, G.; Mueller-Chorus, B.; Oster, J.; Miethe, P.; Keusgen, P. CRP determination based on a novel magnetic biosensor. Biosens. Bioelectron. 2007, 22, 973–979. [Google Scholar] [CrossRef] [PubMed]
- Hong, H.B.; Krause, H.-J.; Nam, I.H.; Choi, C.J.; Shin, S.W. Magnetic immunoassay based on frequency mixing magnetic detection and magnetic particles of different magnetic properties. Anal. Meth. 2014, 6, 8055–8058. [Google Scholar] [CrossRef]
- Krause, H.-J.; Wolters, N.; Zhang, Y.; Offenhäusser, A.; Miethe, P.; Meyer, M.H.F.; Hartmann, M.; Keusgen, M. Magnetic particle detection by frequency mixing for immunoassay applications. J. Magn. Magn. Mater. 2007, 311, 436–444. [Google Scholar] [CrossRef]
- Lany, M.; Boero, G.; Popovic, R.S. Superparamagnetic microbead inductive detector. Rev. Sci. Instr. 2005, 76, 084301. [Google Scholar] [CrossRef]
- Salunkhe, A.; Khot, V.; Ruso, J.; Patil, S. Synthesis and magnetostructural studies of amine functionalized superparamagnetic iron oxide nanoparticles. R. Soc. Chem. 2015, 5, 18420–18428. [Google Scholar] [CrossRef]
- Dehmel, G. Magnetic field sensors: Induction coil (search coil) sensors. In Sensors, a Comprehensive Survey. Volume 5, Magnetic Sensors; Göpel, W., Hesse, J., Zemel, J., Eds.; VCH: Weinhein, Germany, 1989; ISBN 9783527265381. [Google Scholar] [CrossRef]
- Hugounenq, P.; Levy, M.; Alloyeau, D.; Lartigue, L.; Dubois, E.; Cabuil, V.; Ricolleau, C.; Roux, S.; Wilhelm, C.; Gazeau, F.; et al. Iron oxide monocrystalline nanoflowers for highly efficient magnetic hyperthermia. J. Phys. Chem. C 2012, 116, 15702–15712. [Google Scholar] [CrossRef]


| Coils | Resistance (Total) (Ω) | Inductance (mH) | Capacitance (Calculated) (pF) | (MHz) |
|---|---|---|---|---|
| LF () | 160 | 1.8 | 12 | 1.06 |
| HF () | 68 | 0.4 | 33 | 1.62 |
| Sensor | 80 | 0.52 | 39 | 1.16 |
© 2018 by the authors. Licensee MDPI, Basel, Switzerland. This article is an open access article distributed under the terms and conditions of the Creative Commons Attribution (CC BY) license (http://creativecommons.org/licenses/by/4.0/).
Share and Cite
Rabehi, A.; Garlan, B.; Achtsnicht, S.; Krause, H.-J.; Offenhäusser, A.; Ngo, K.; Neveu, S.; Graff-Dubois, S.; Kokabi, H. Magnetic Detection Structure for Lab-on-Chip Applications Based on the Frequency Mixing Technique. Sensors 2018, 18, 1747. https://doi.org/10.3390/s18061747
Rabehi A, Garlan B, Achtsnicht S, Krause H-J, Offenhäusser A, Ngo K, Neveu S, Graff-Dubois S, Kokabi H. Magnetic Detection Structure for Lab-on-Chip Applications Based on the Frequency Mixing Technique. Sensors. 2018; 18(6):1747. https://doi.org/10.3390/s18061747
Chicago/Turabian StyleRabehi, Amine, Benjamin Garlan, Stefan Achtsnicht, Hans-Joachim Krause, Andreas Offenhäusser, Kieu Ngo, Sophie Neveu, Stephanie Graff-Dubois, and Hamid Kokabi. 2018. "Magnetic Detection Structure for Lab-on-Chip Applications Based on the Frequency Mixing Technique" Sensors 18, no. 6: 1747. https://doi.org/10.3390/s18061747