Commissioning of the Controlled and Automatized Testing Facility for Human Behavior and Control (CASITA)

 ,
,  ,
,
Abstract
:1. Introduction
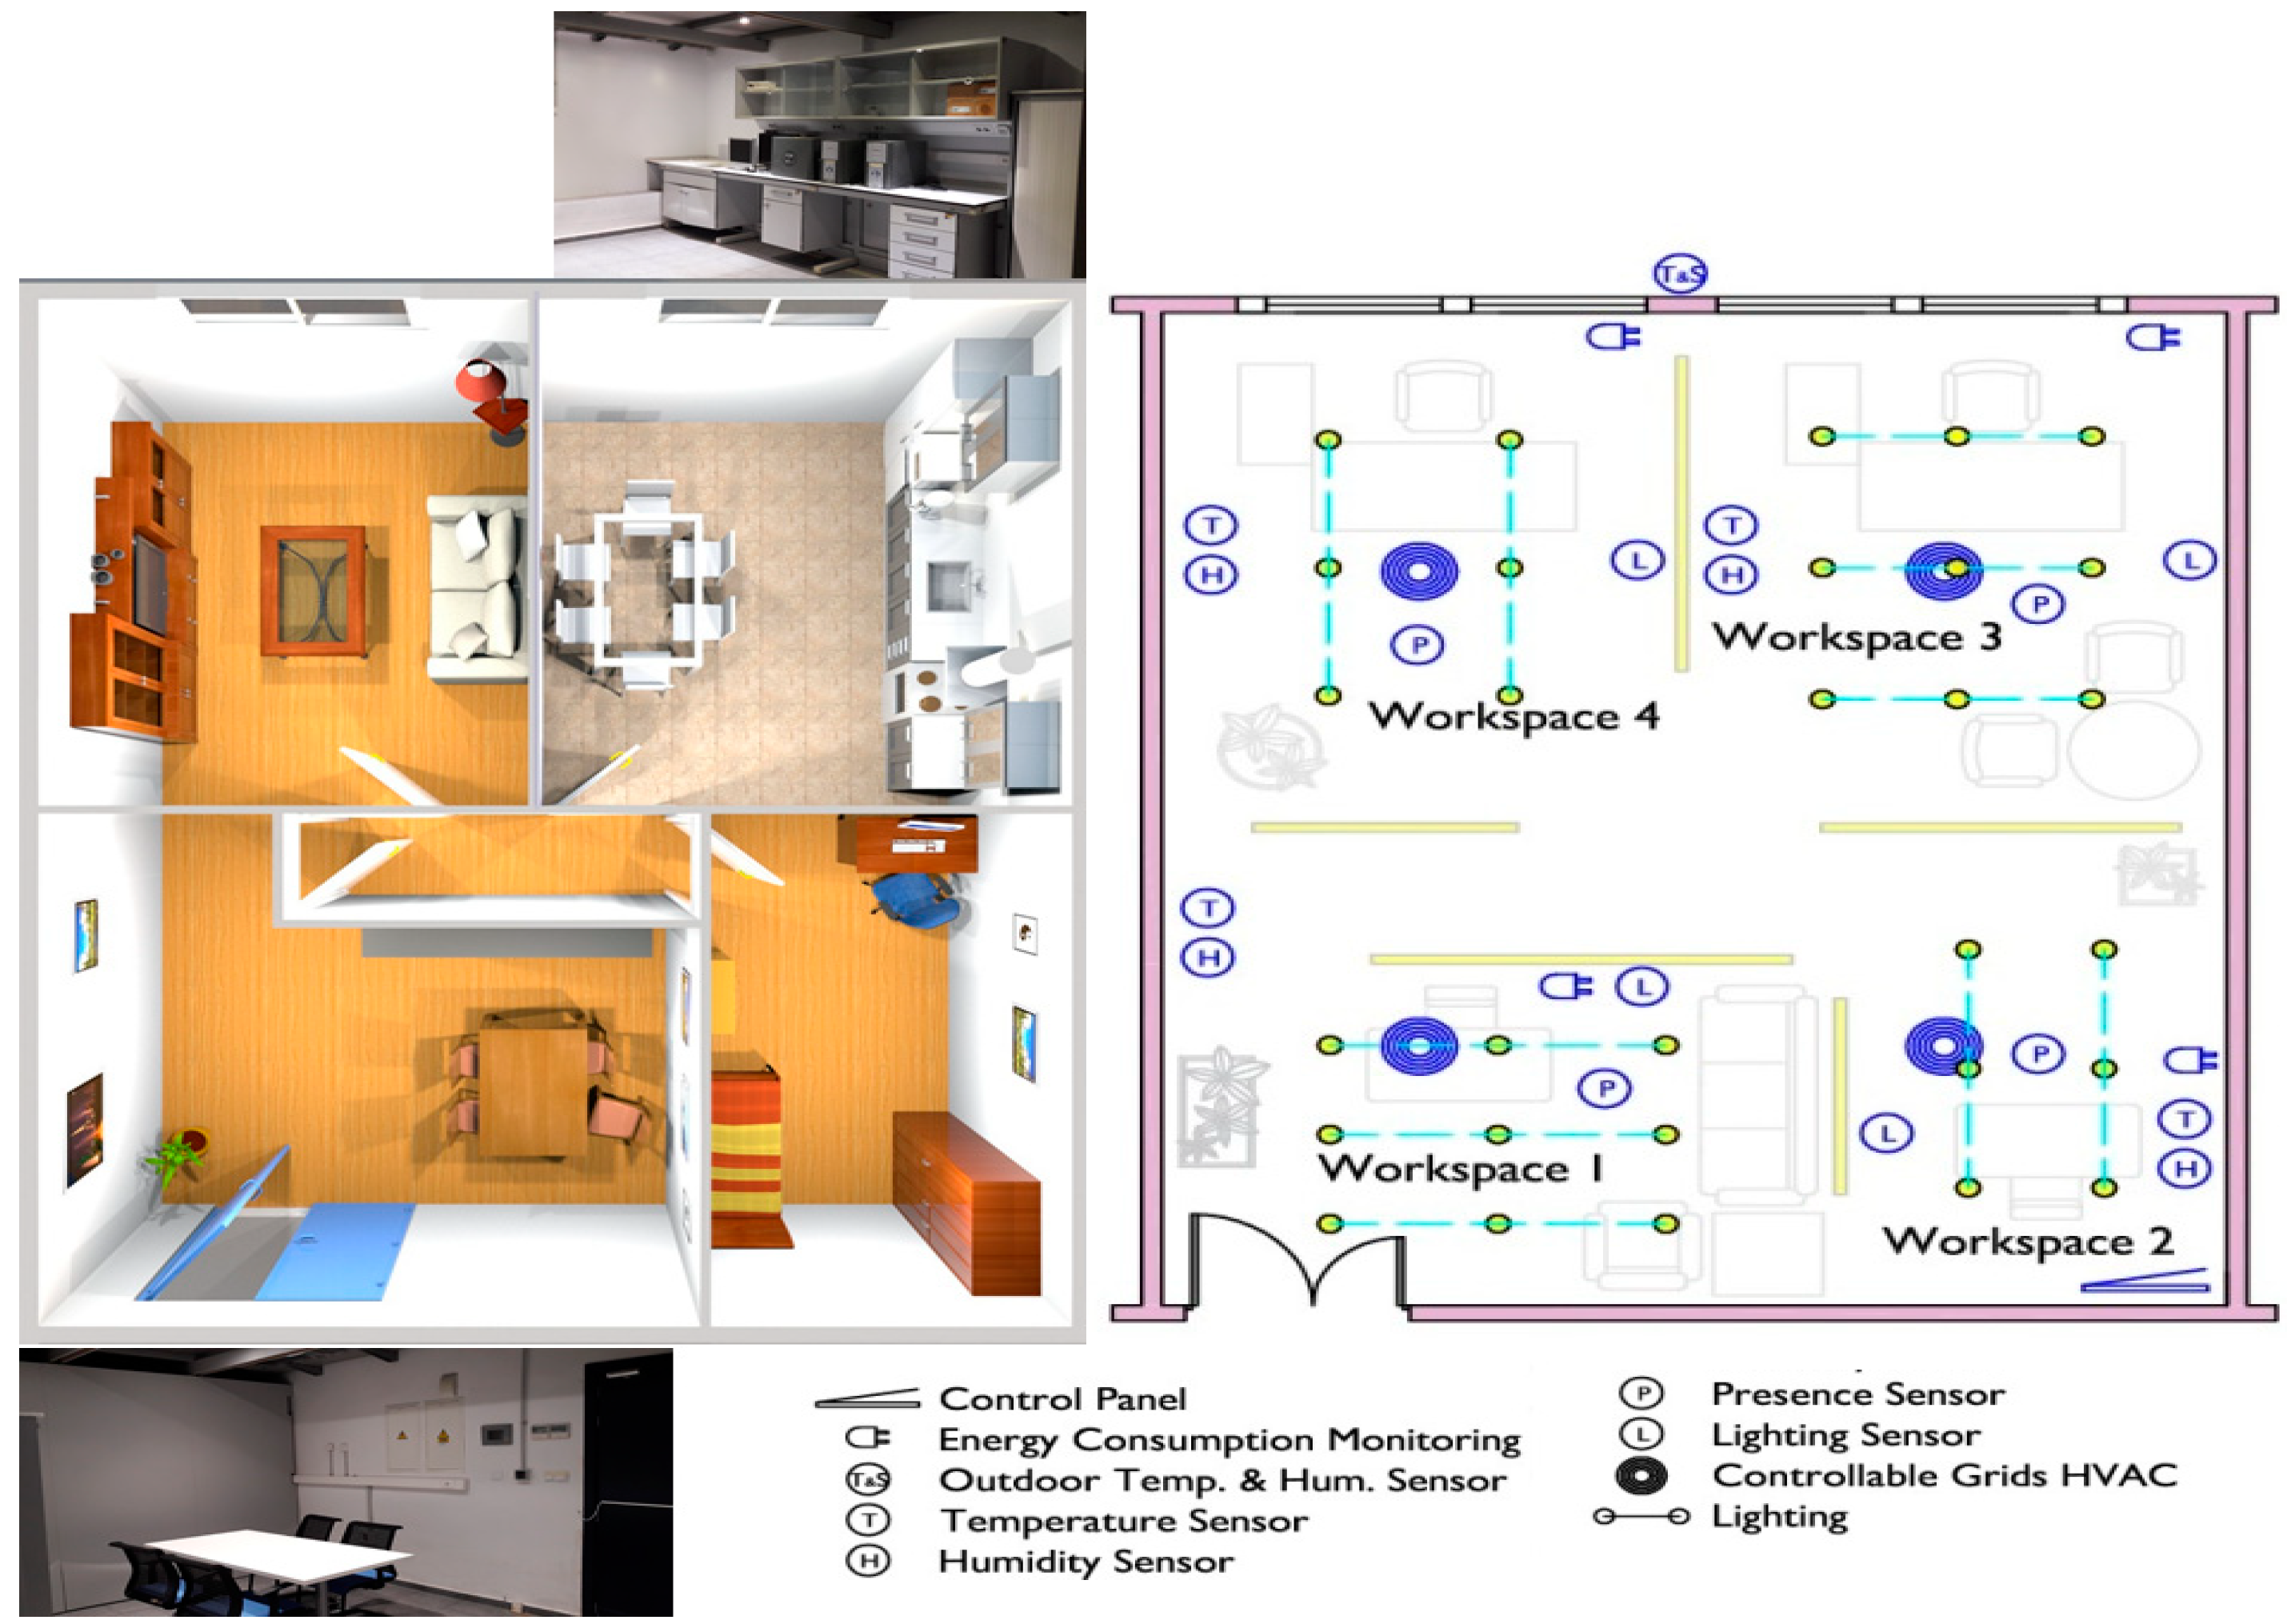
2. The Controlled and Automatized Testing Facility for Human Behaviour (CASITA)
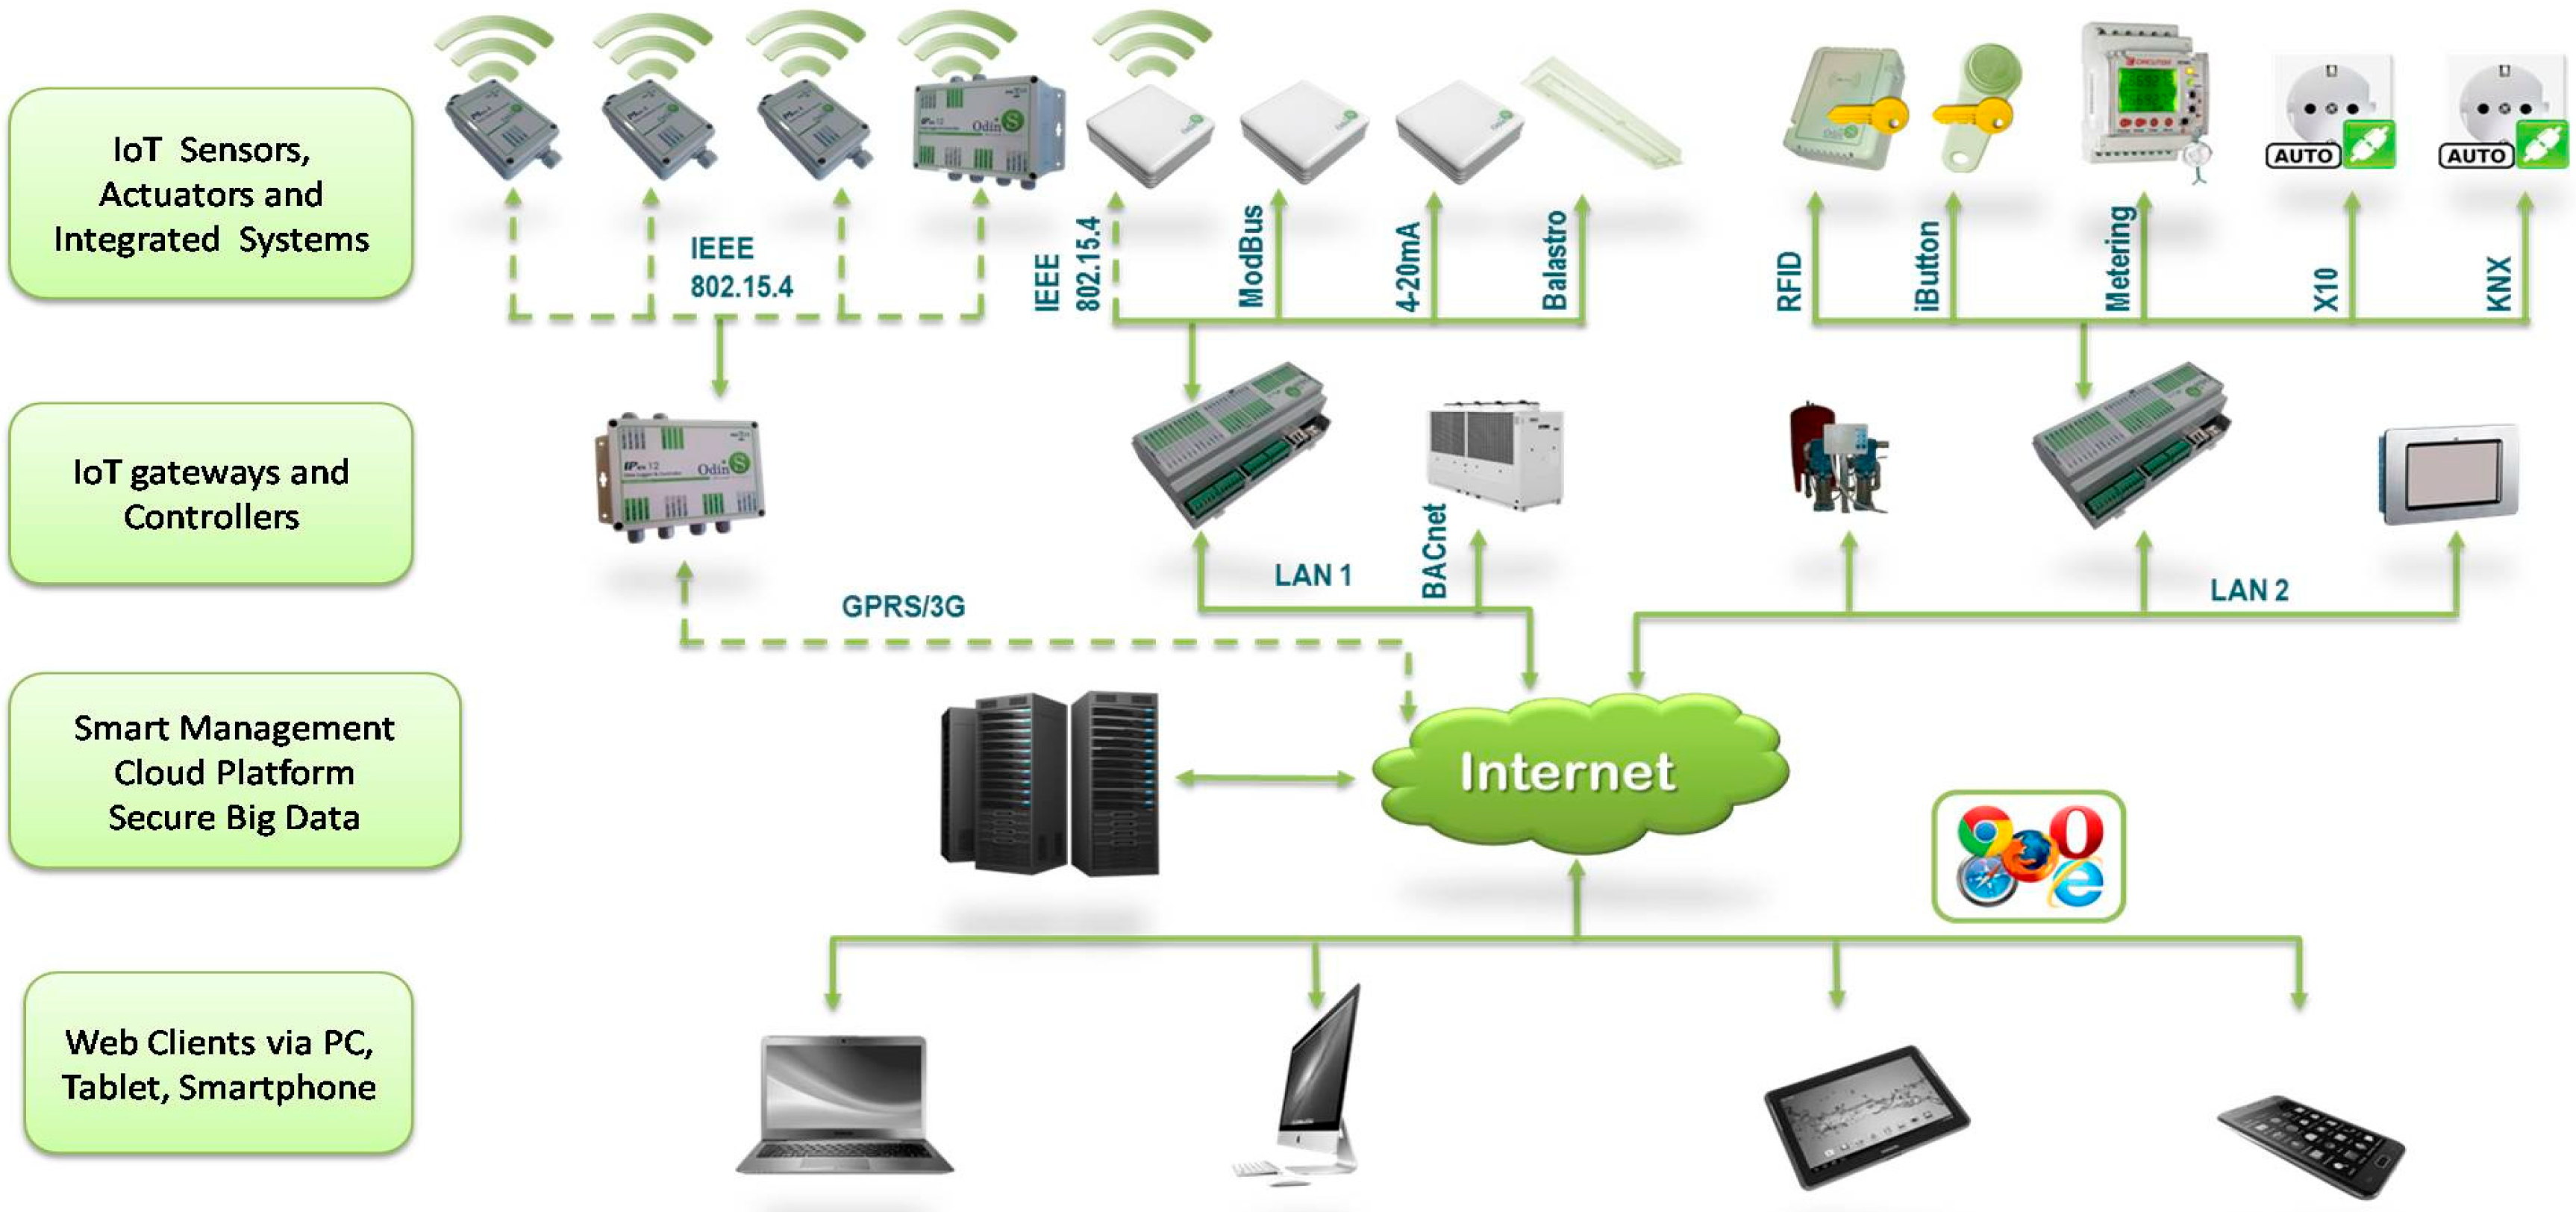
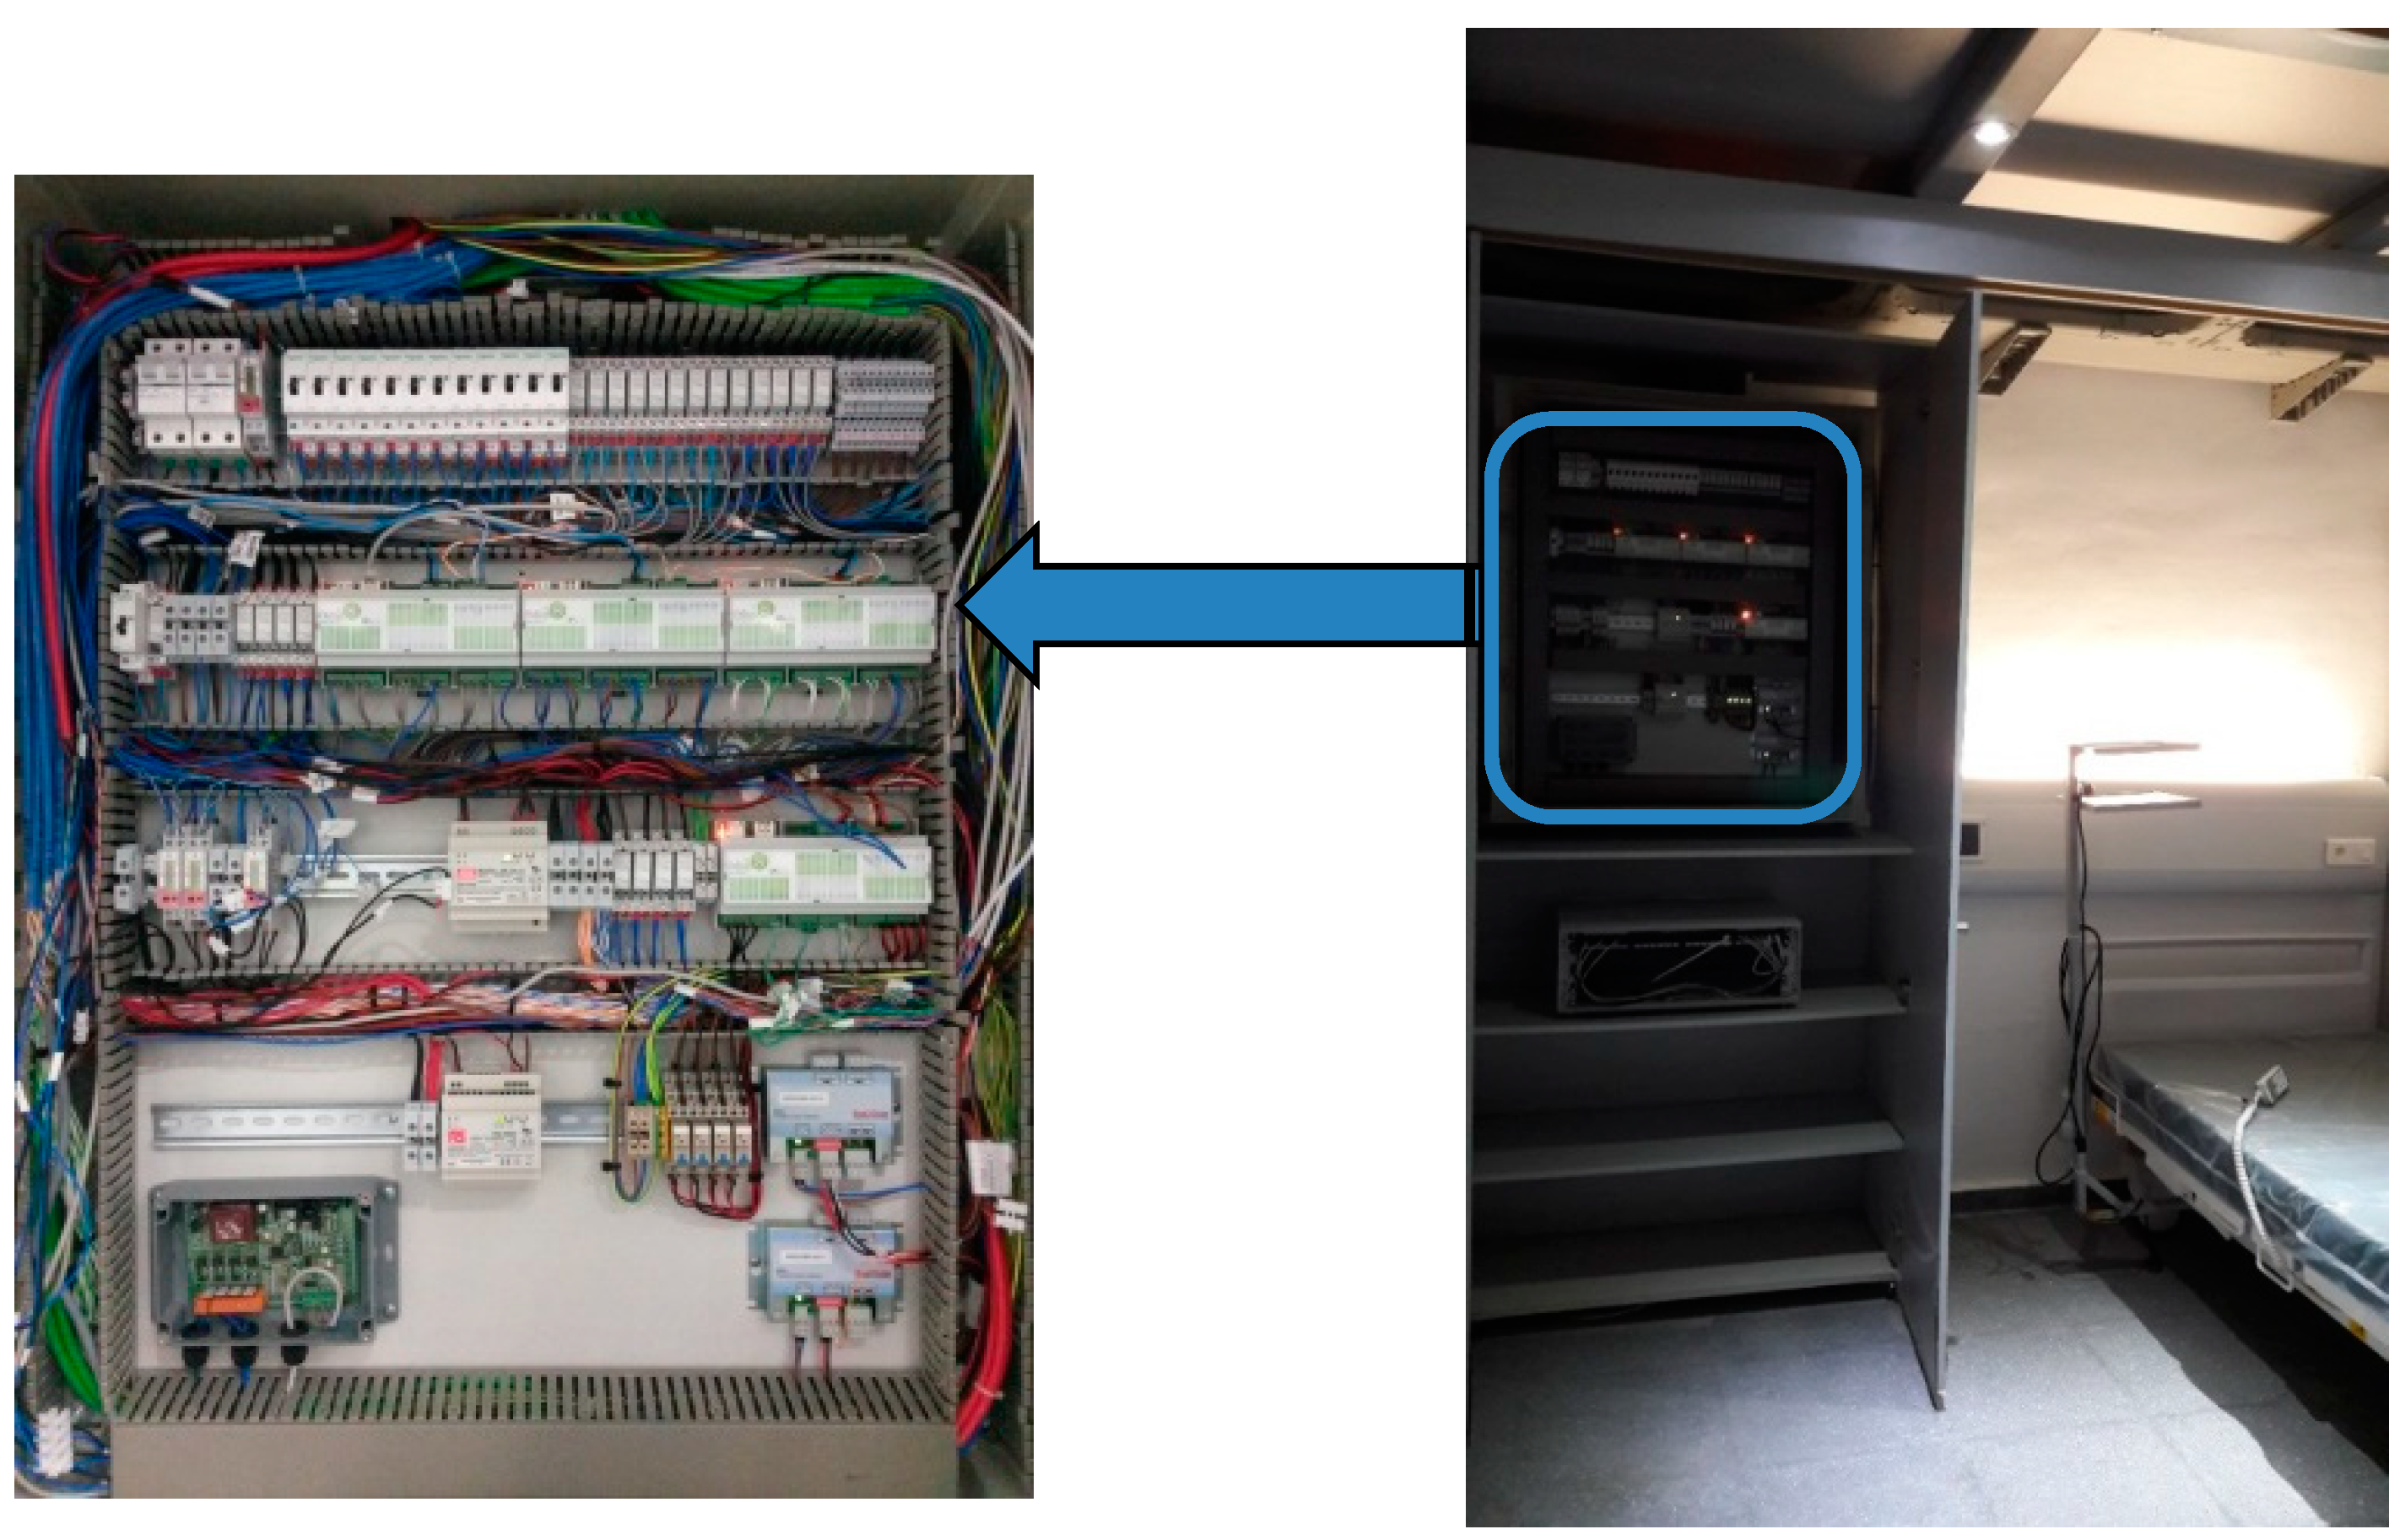
2.1. Hardware
2.2. Software: The PROPHET Package
- y(t): time series of interest.
- g(t): represents non-periodic components (using piecewise linear or logistic growth curve trend). PROPHET implements two trend models that cover many applications: a saturating growth model and a piecewise linear model with automatic change point selection.
- s(t): trend factor that represents periodic changes. Time series often have multi-period seasonality as a result of the human behaviors they represent. To fit and forecast these effects, we must specify seasonality models that are periodic functions of t. This part relies on Fourier series to provide a flexible model of periodic effects.
- h(t): effects of holidays (a list provided by the user). Holidays and events provide large, somewhat predictable shocks to many time series and often do not follow a periodic pattern, so their effects are not well modeled by a smooth cycle.
- εt: error which will be assumed to follow a normal distribution.
3. Commissioning and Example of Data Analysis
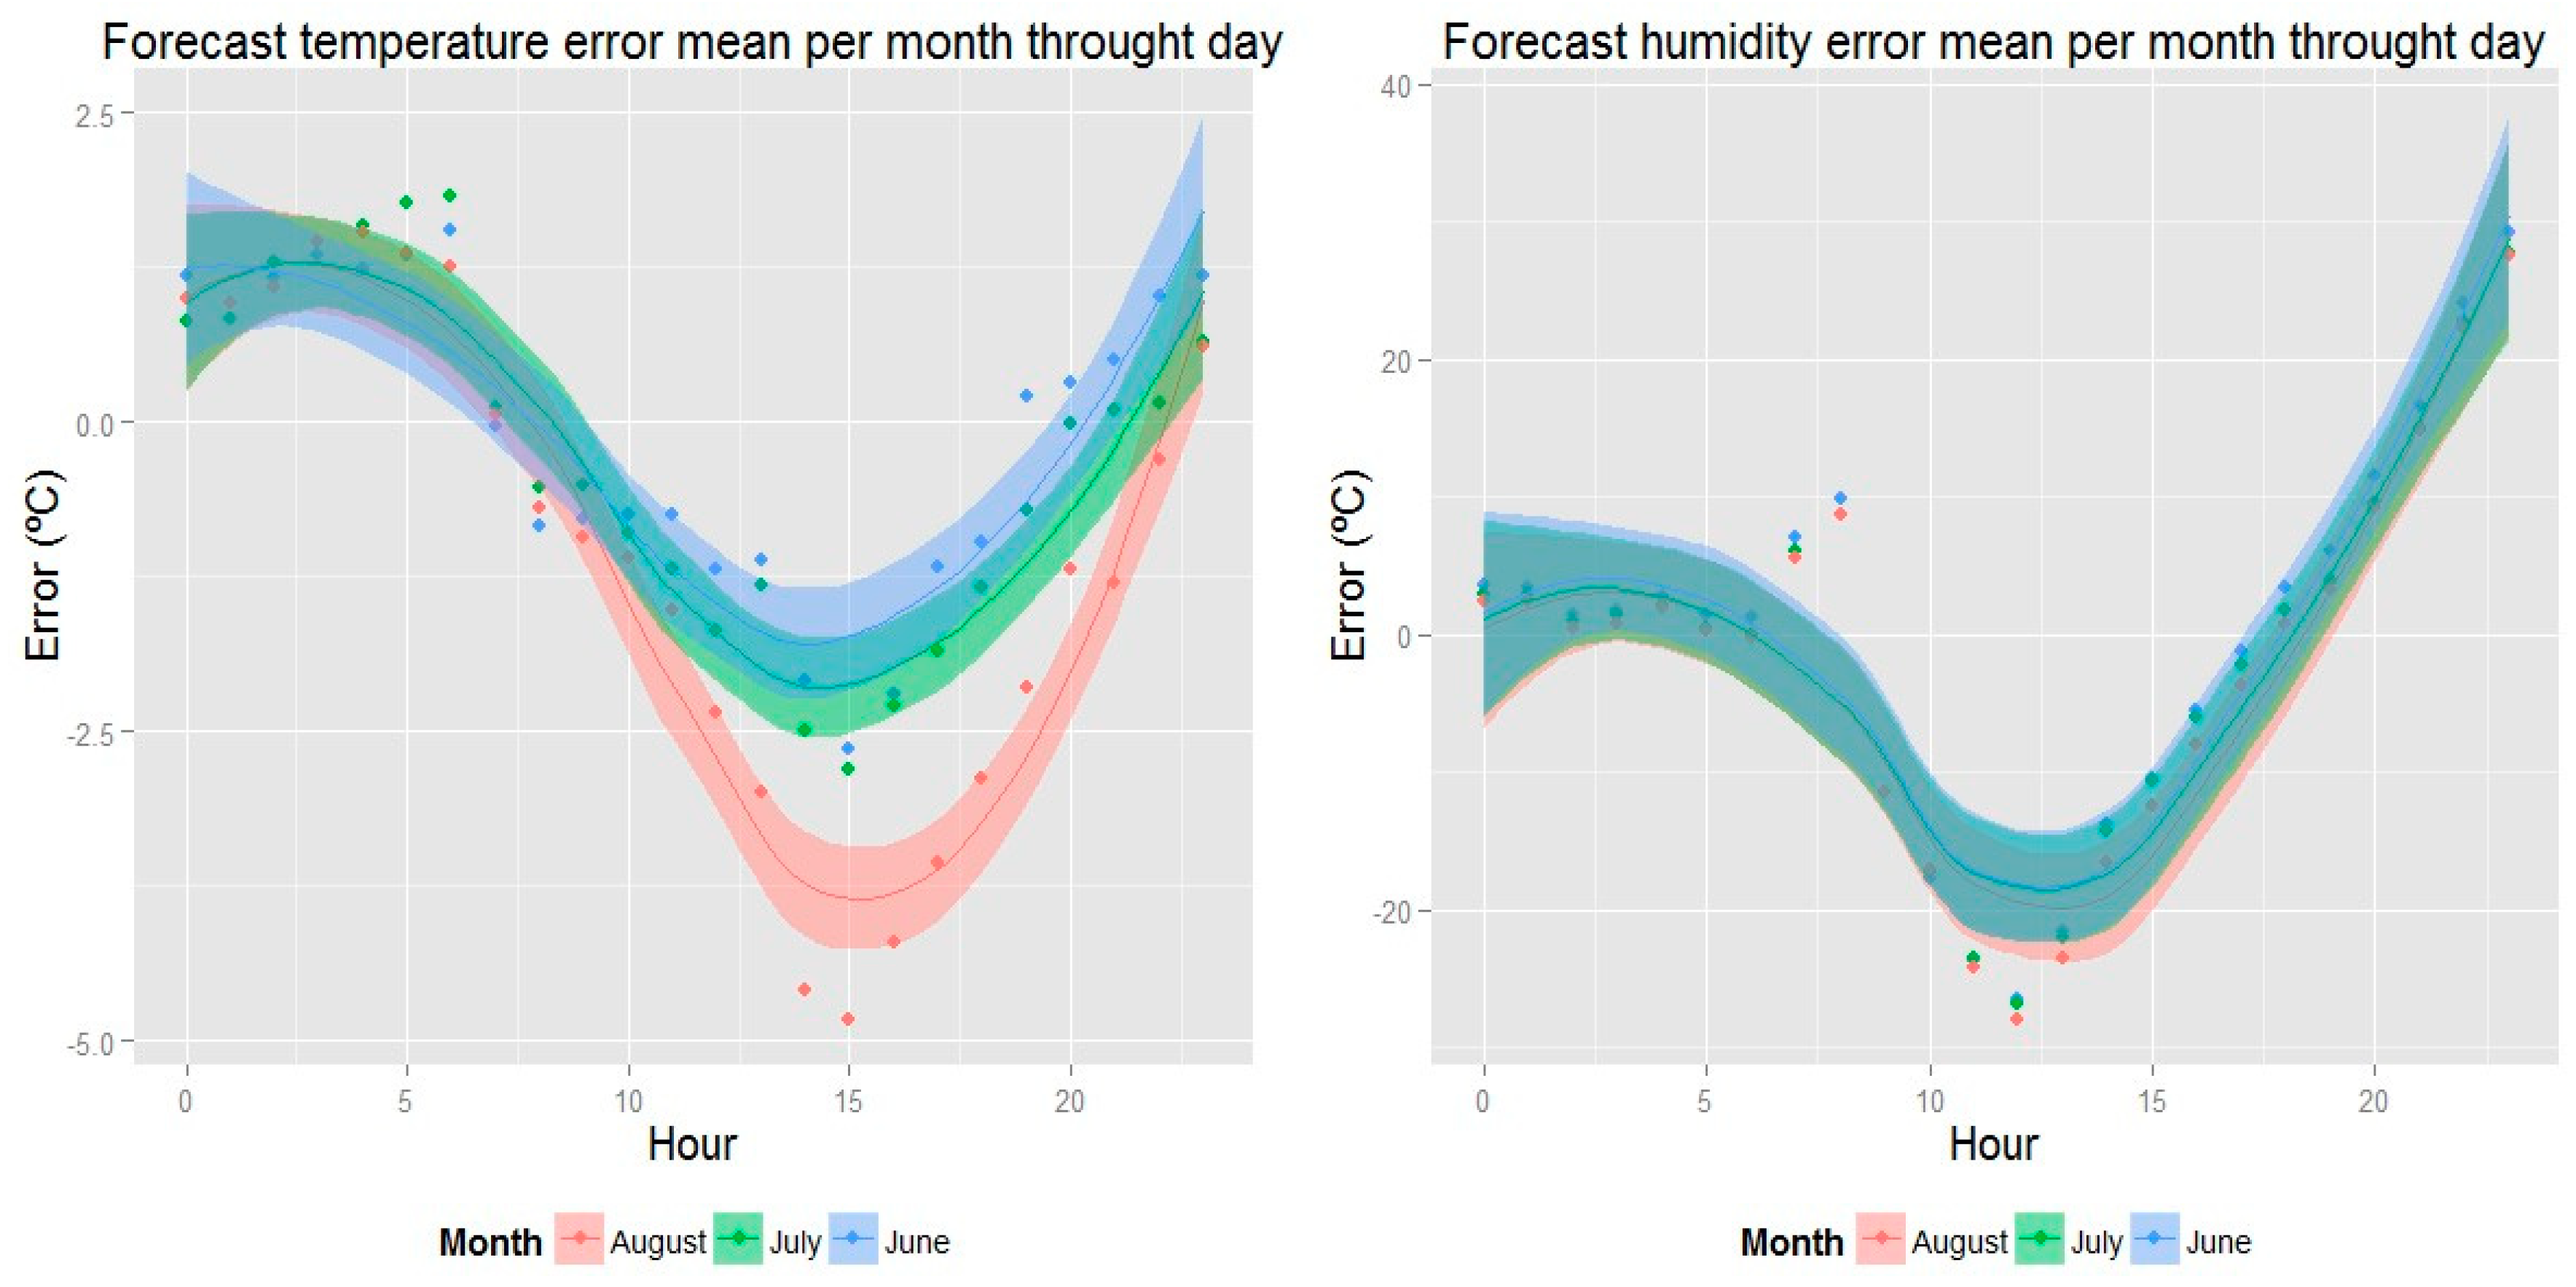
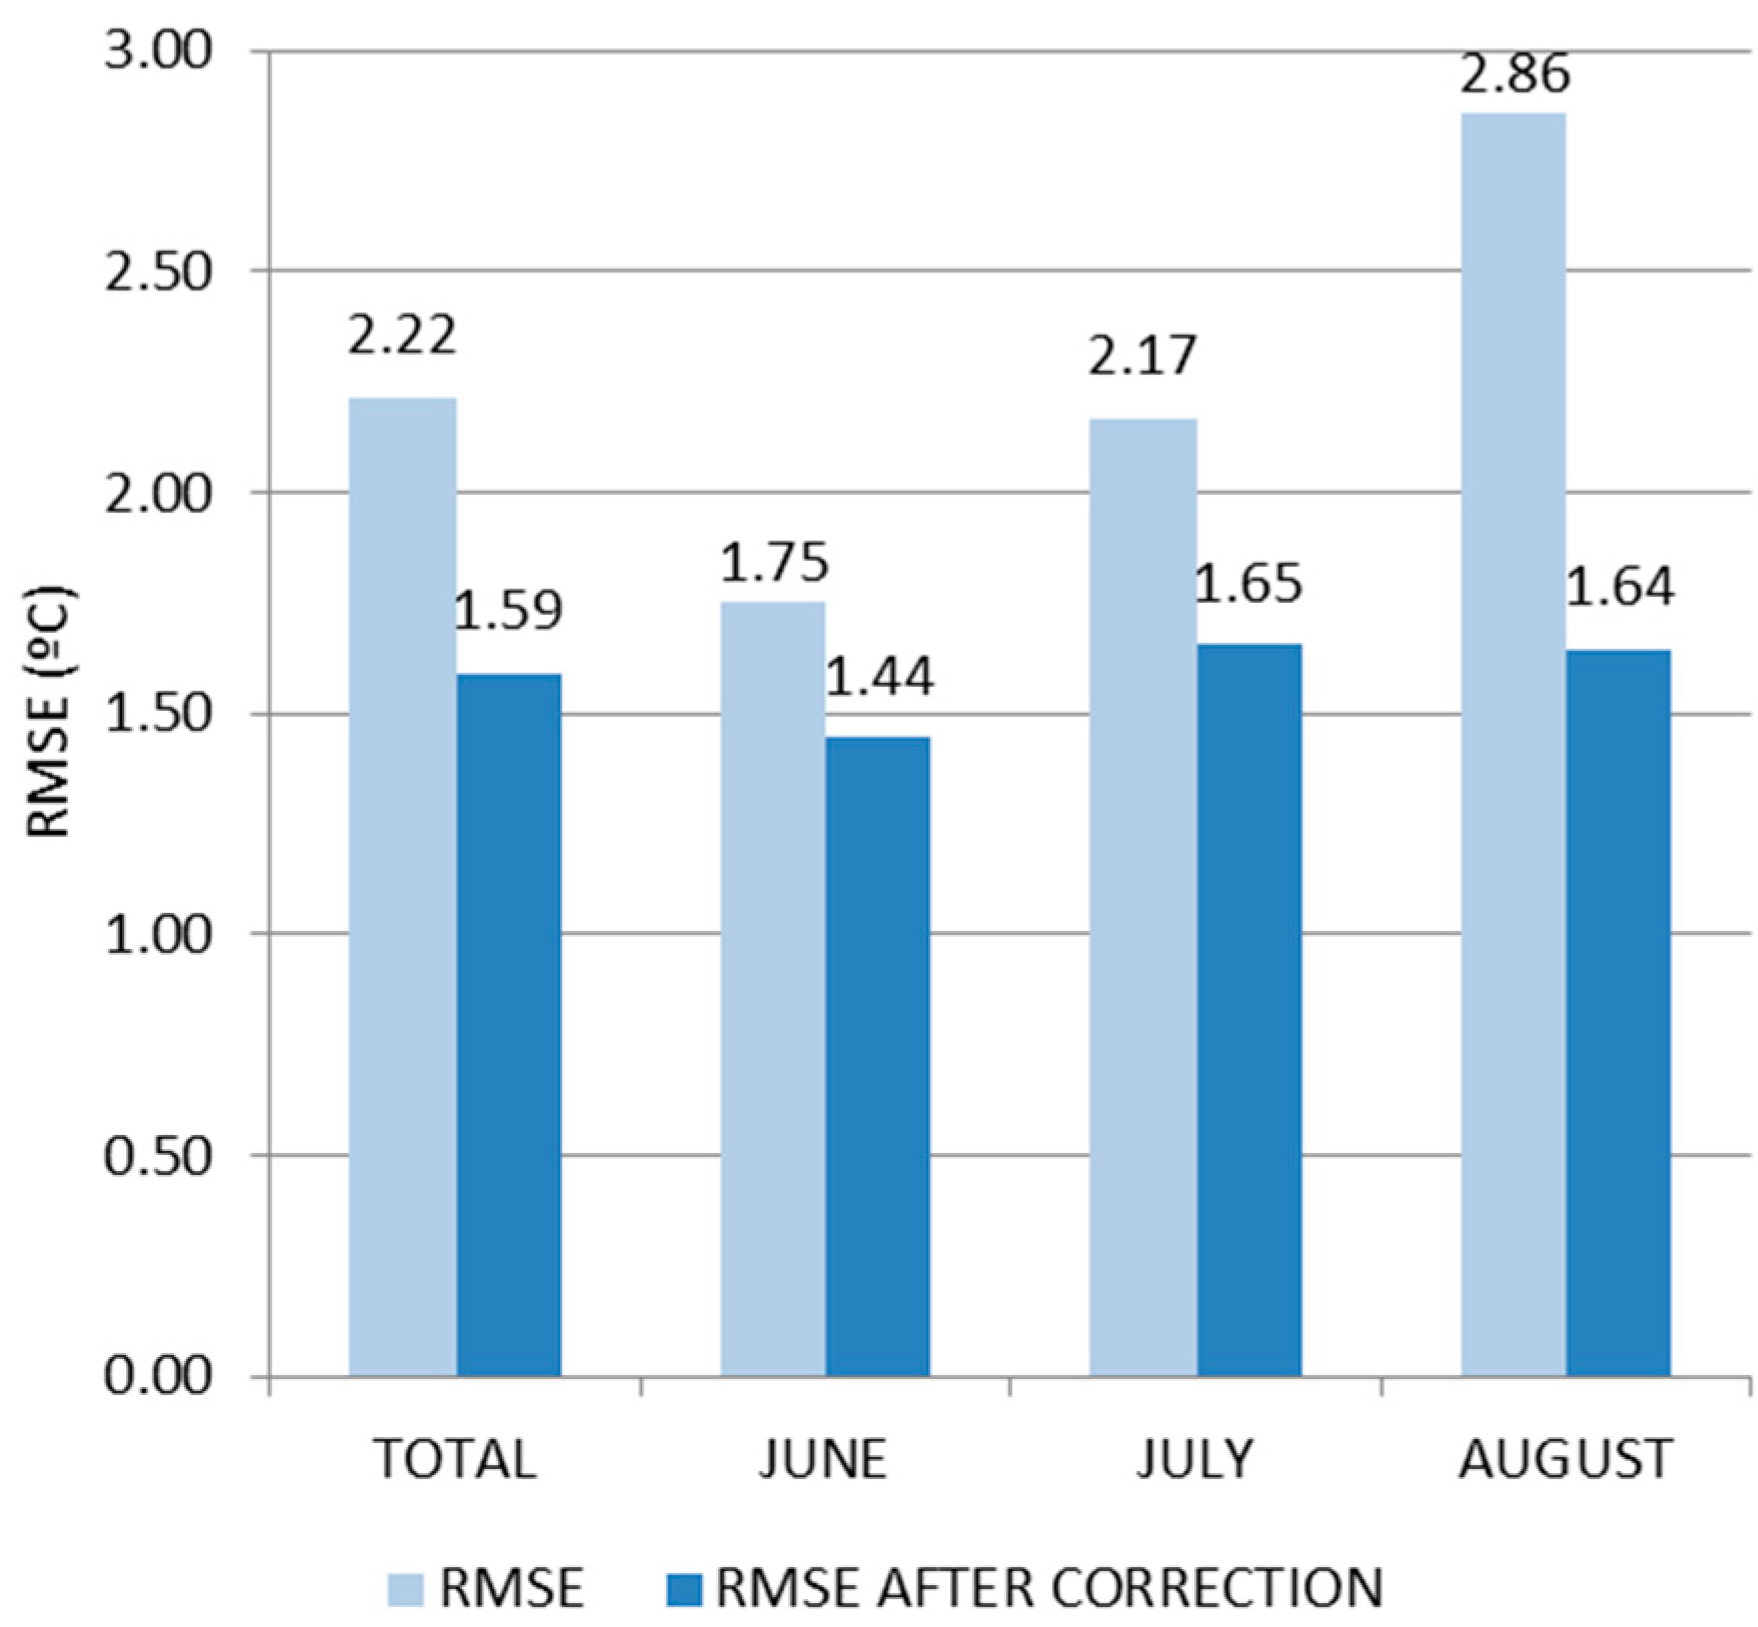
3.1. Verification of Accessible National Weather Forecasting in CASITA Using PROPHET
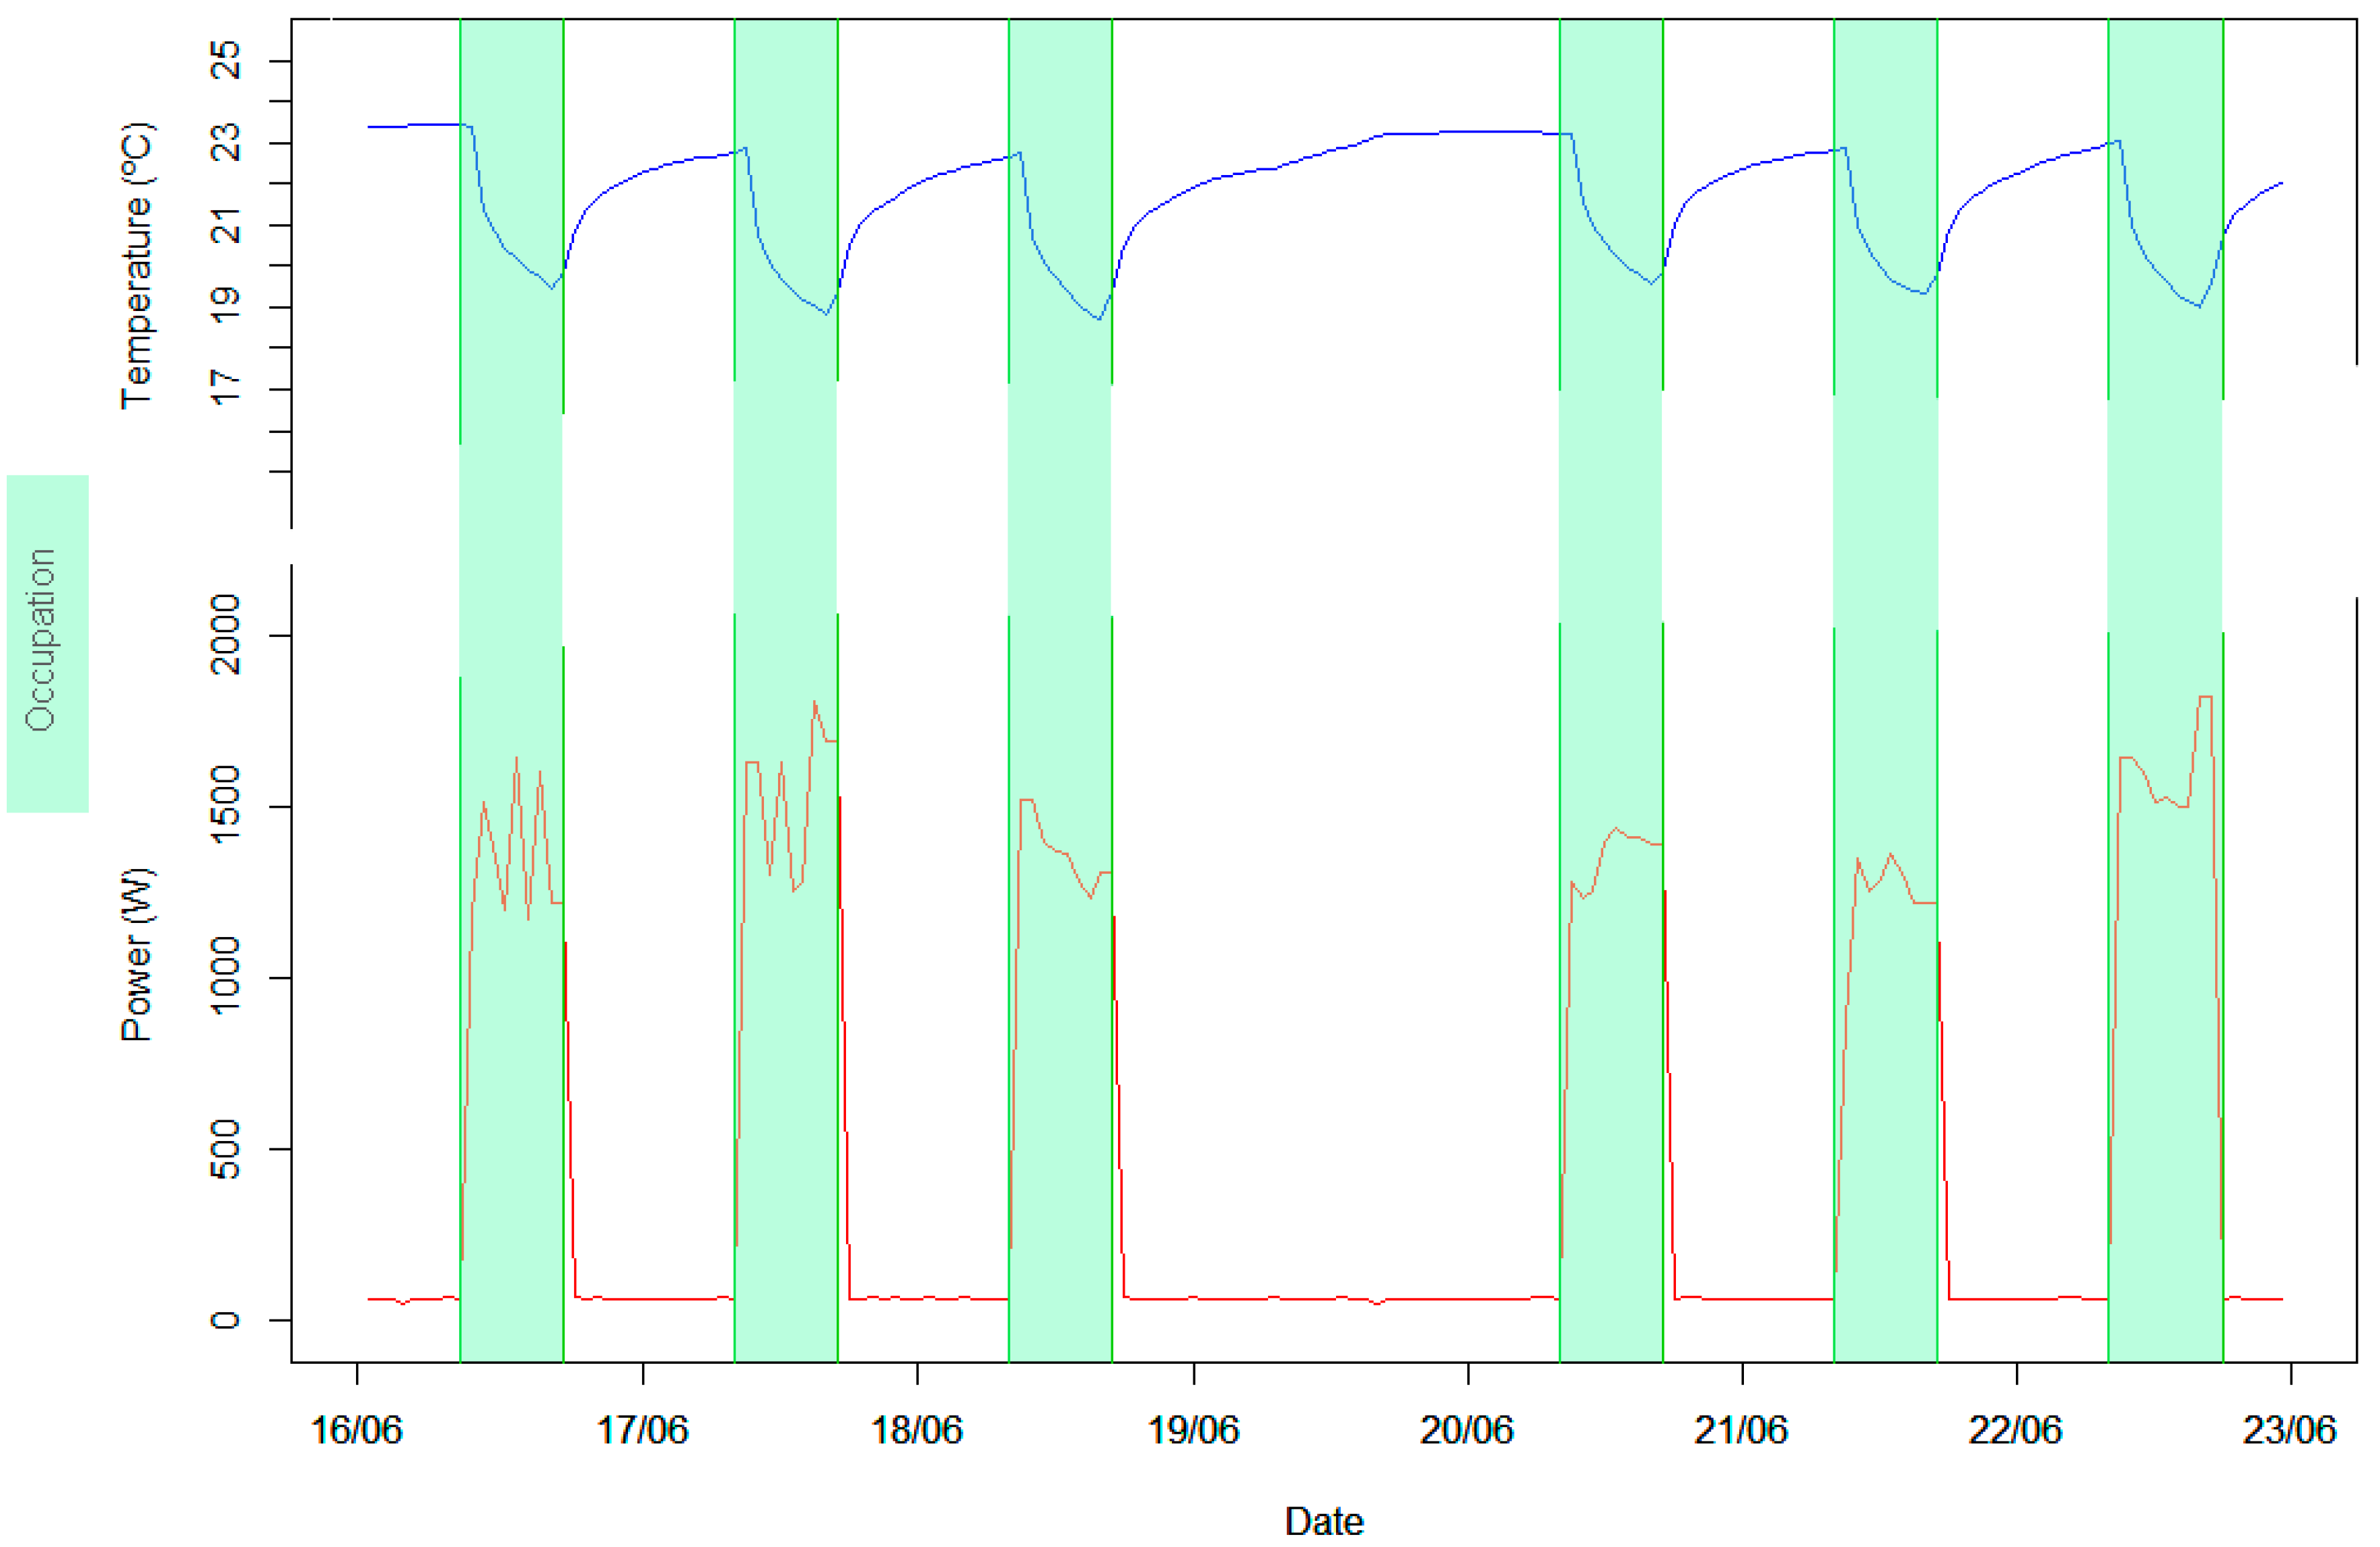
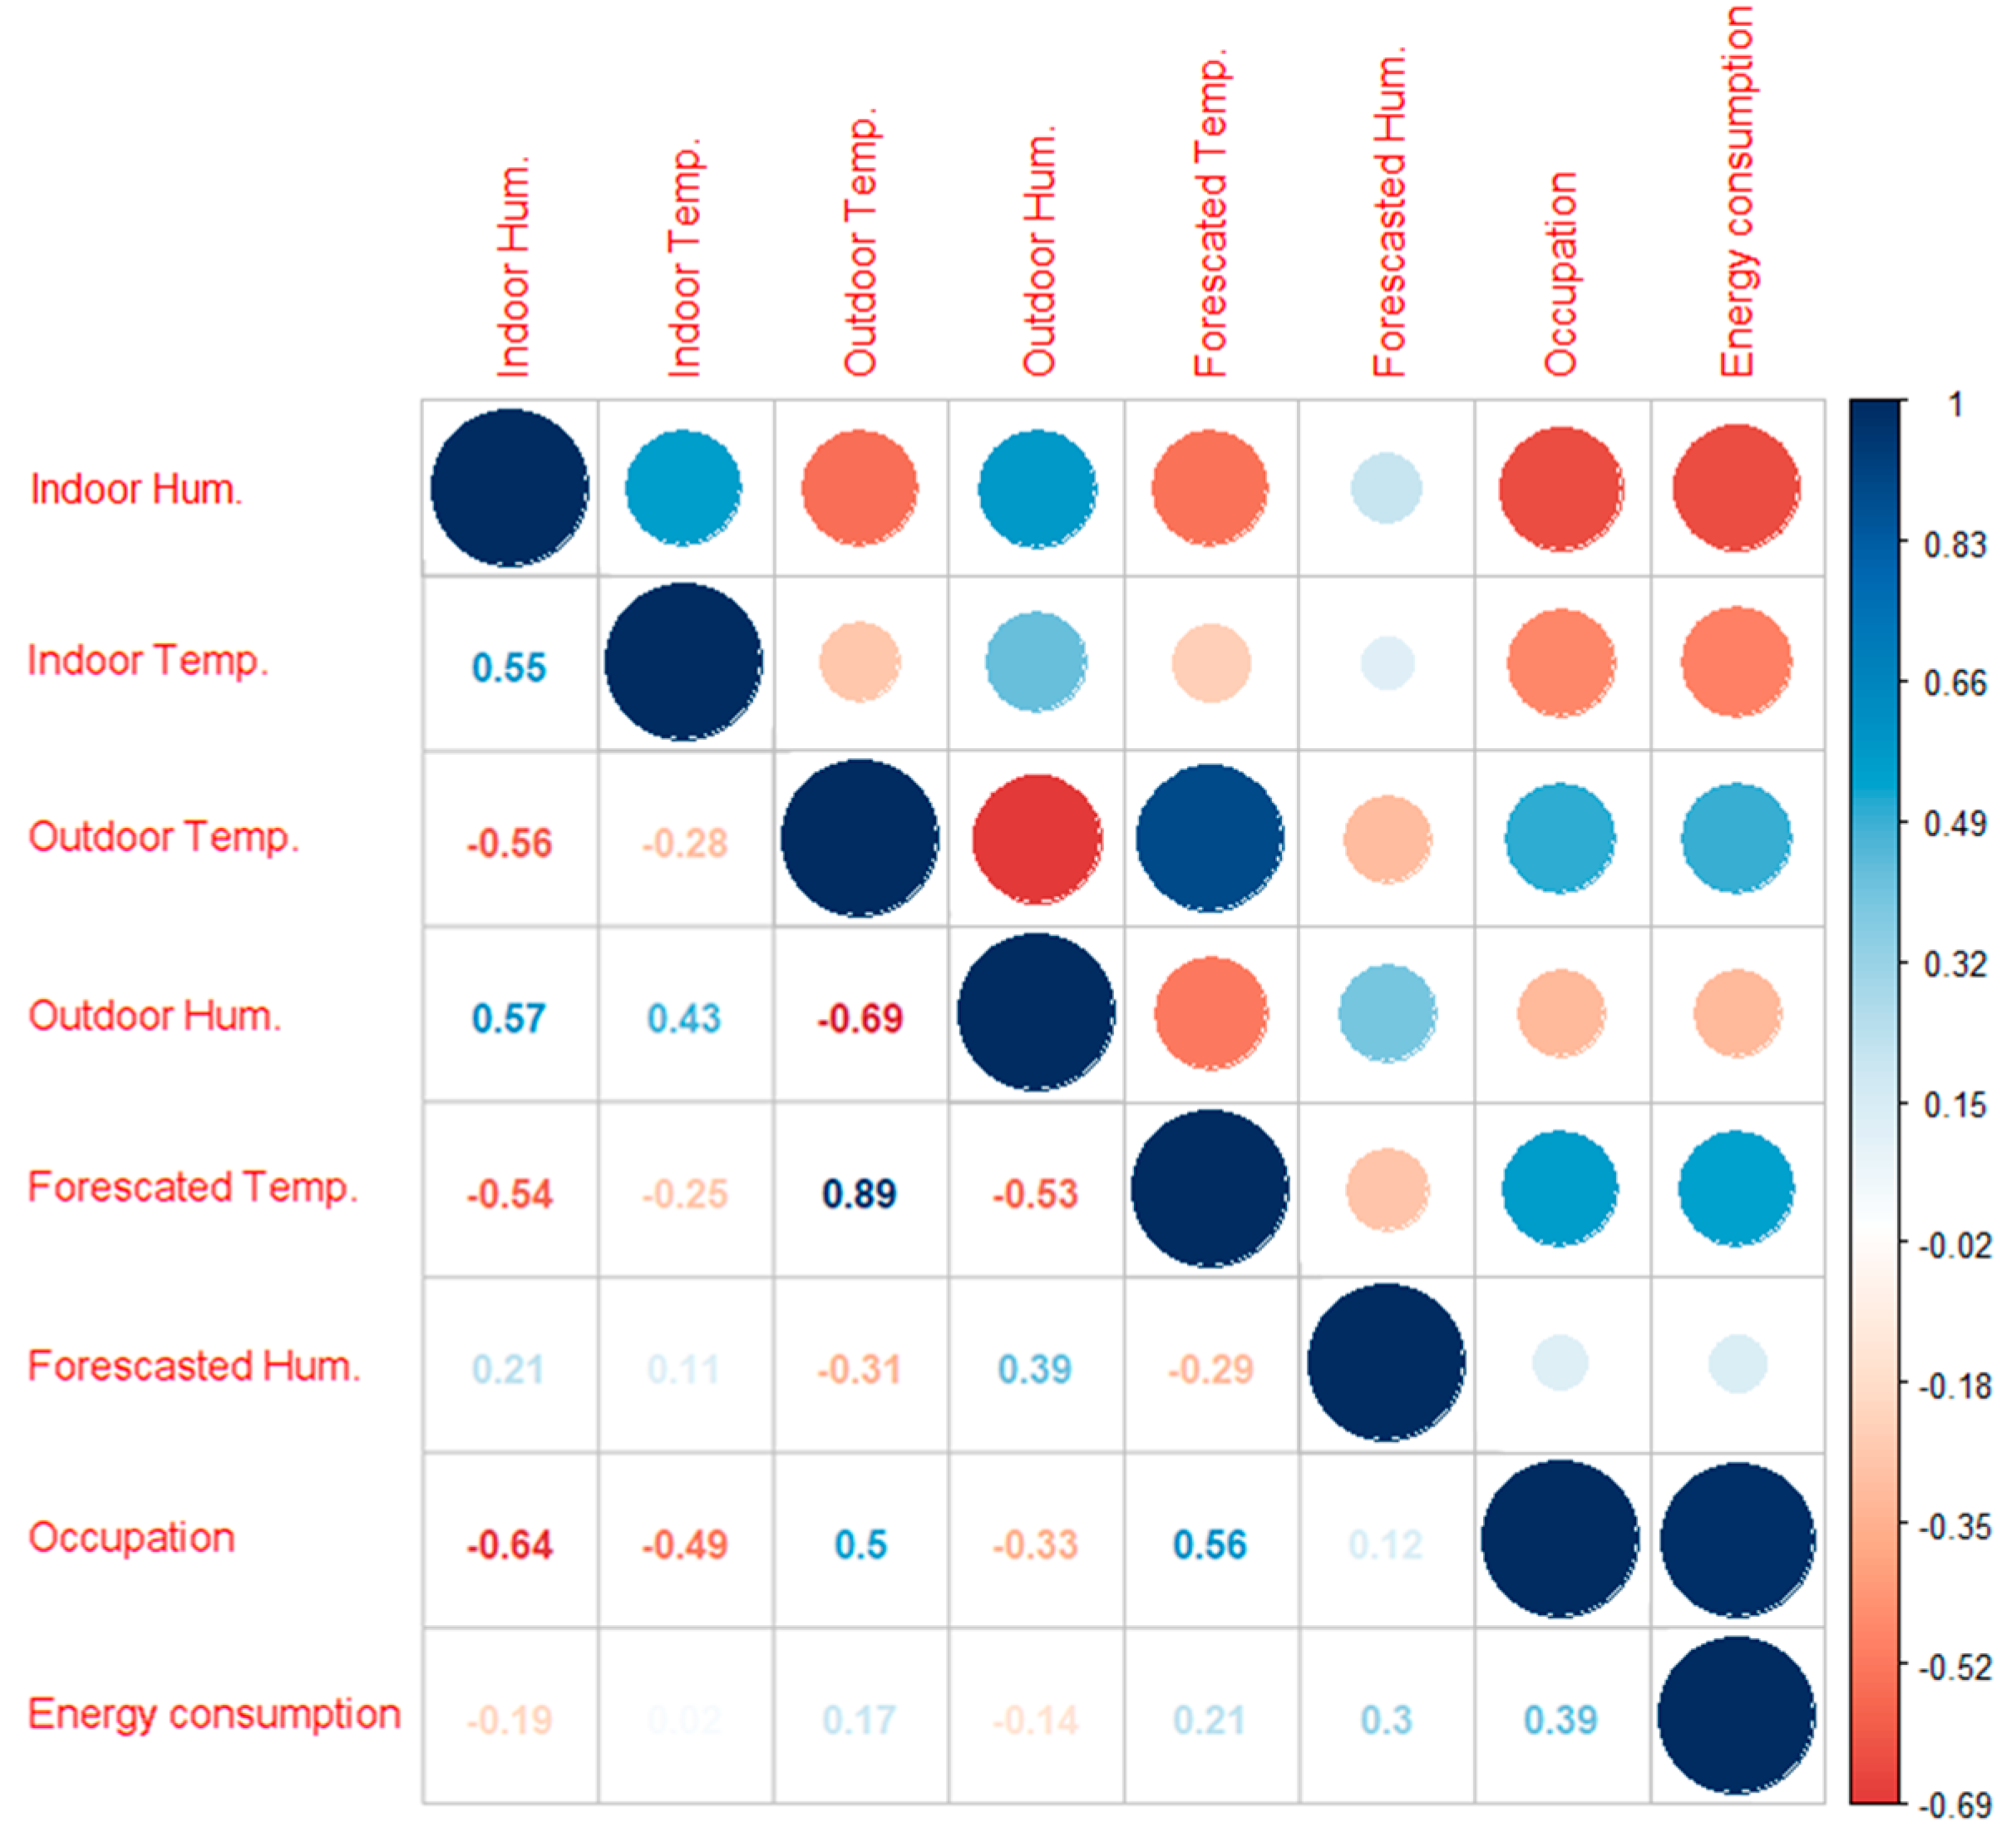
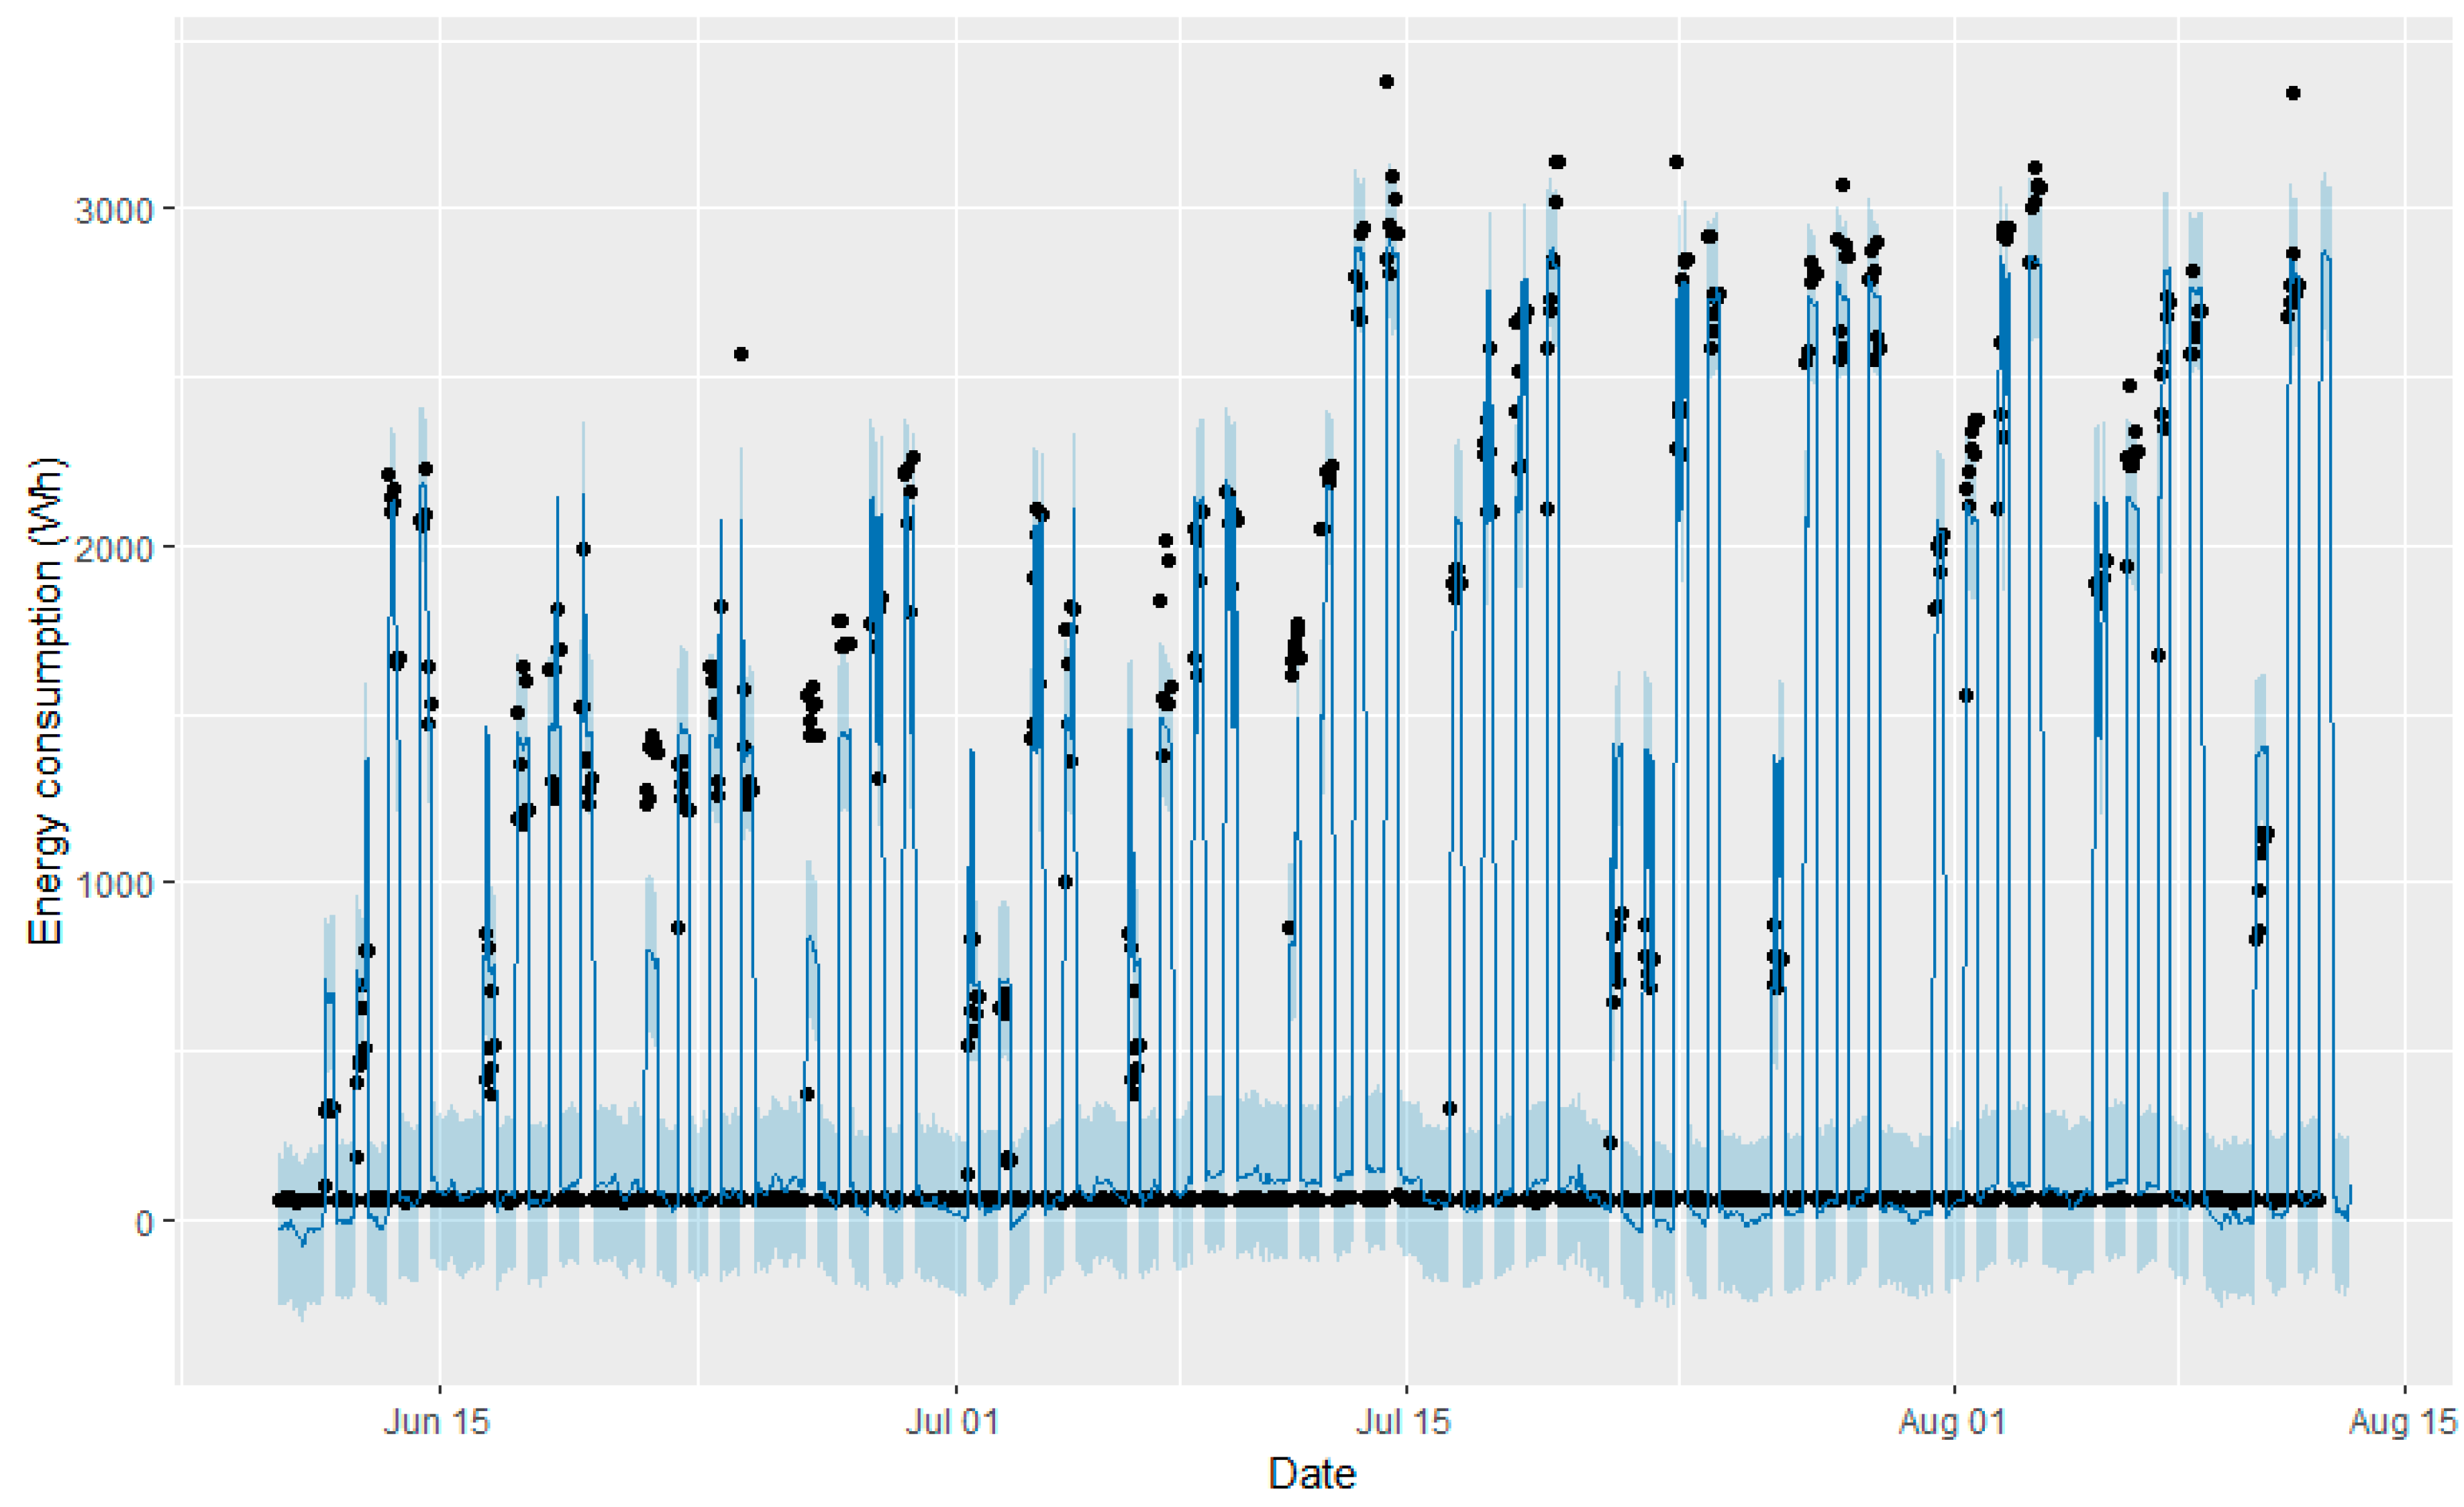
3.2. Validating Influence of the Variables Using PROPHET
- Occupation;
- Indoor conditions: temperature and humidity;
- Outdoor temperature;
- Forecasted temperature.
- Strong multiple human-scale seasonality (such as day of the week and the time of year);
- Important holidays that occur at irregular intervals that are known in advance; and
- A certain random component.
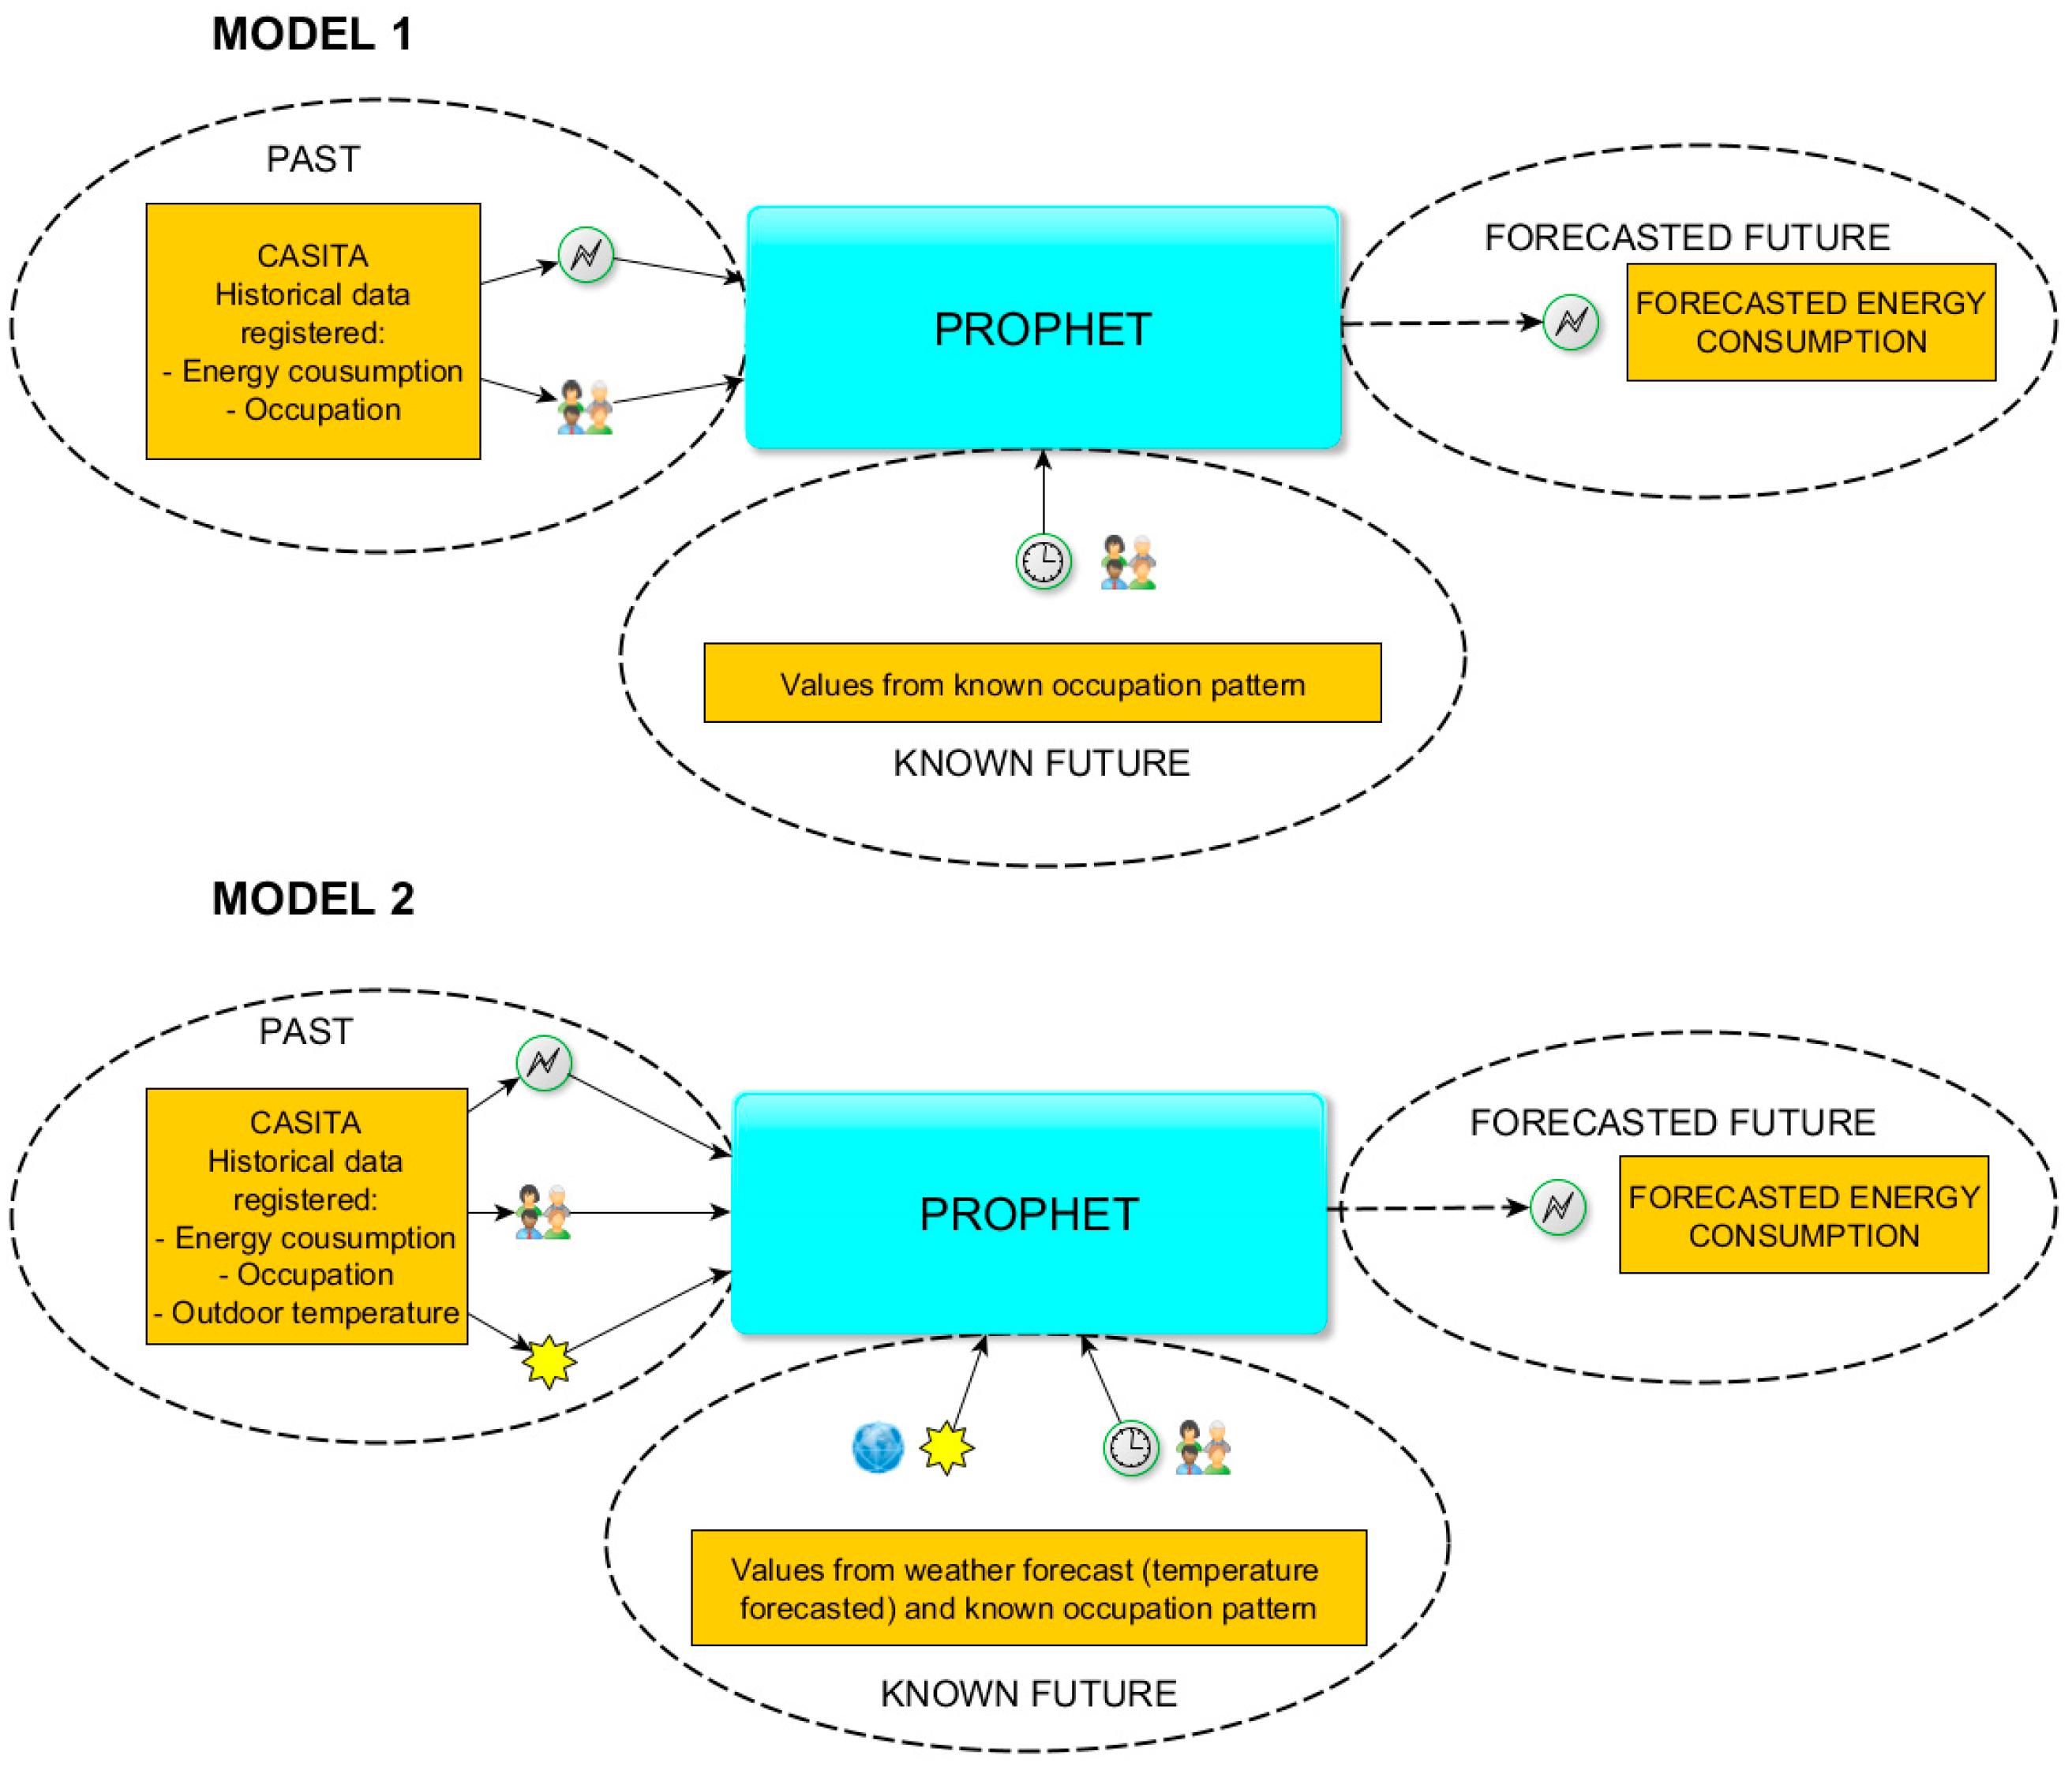
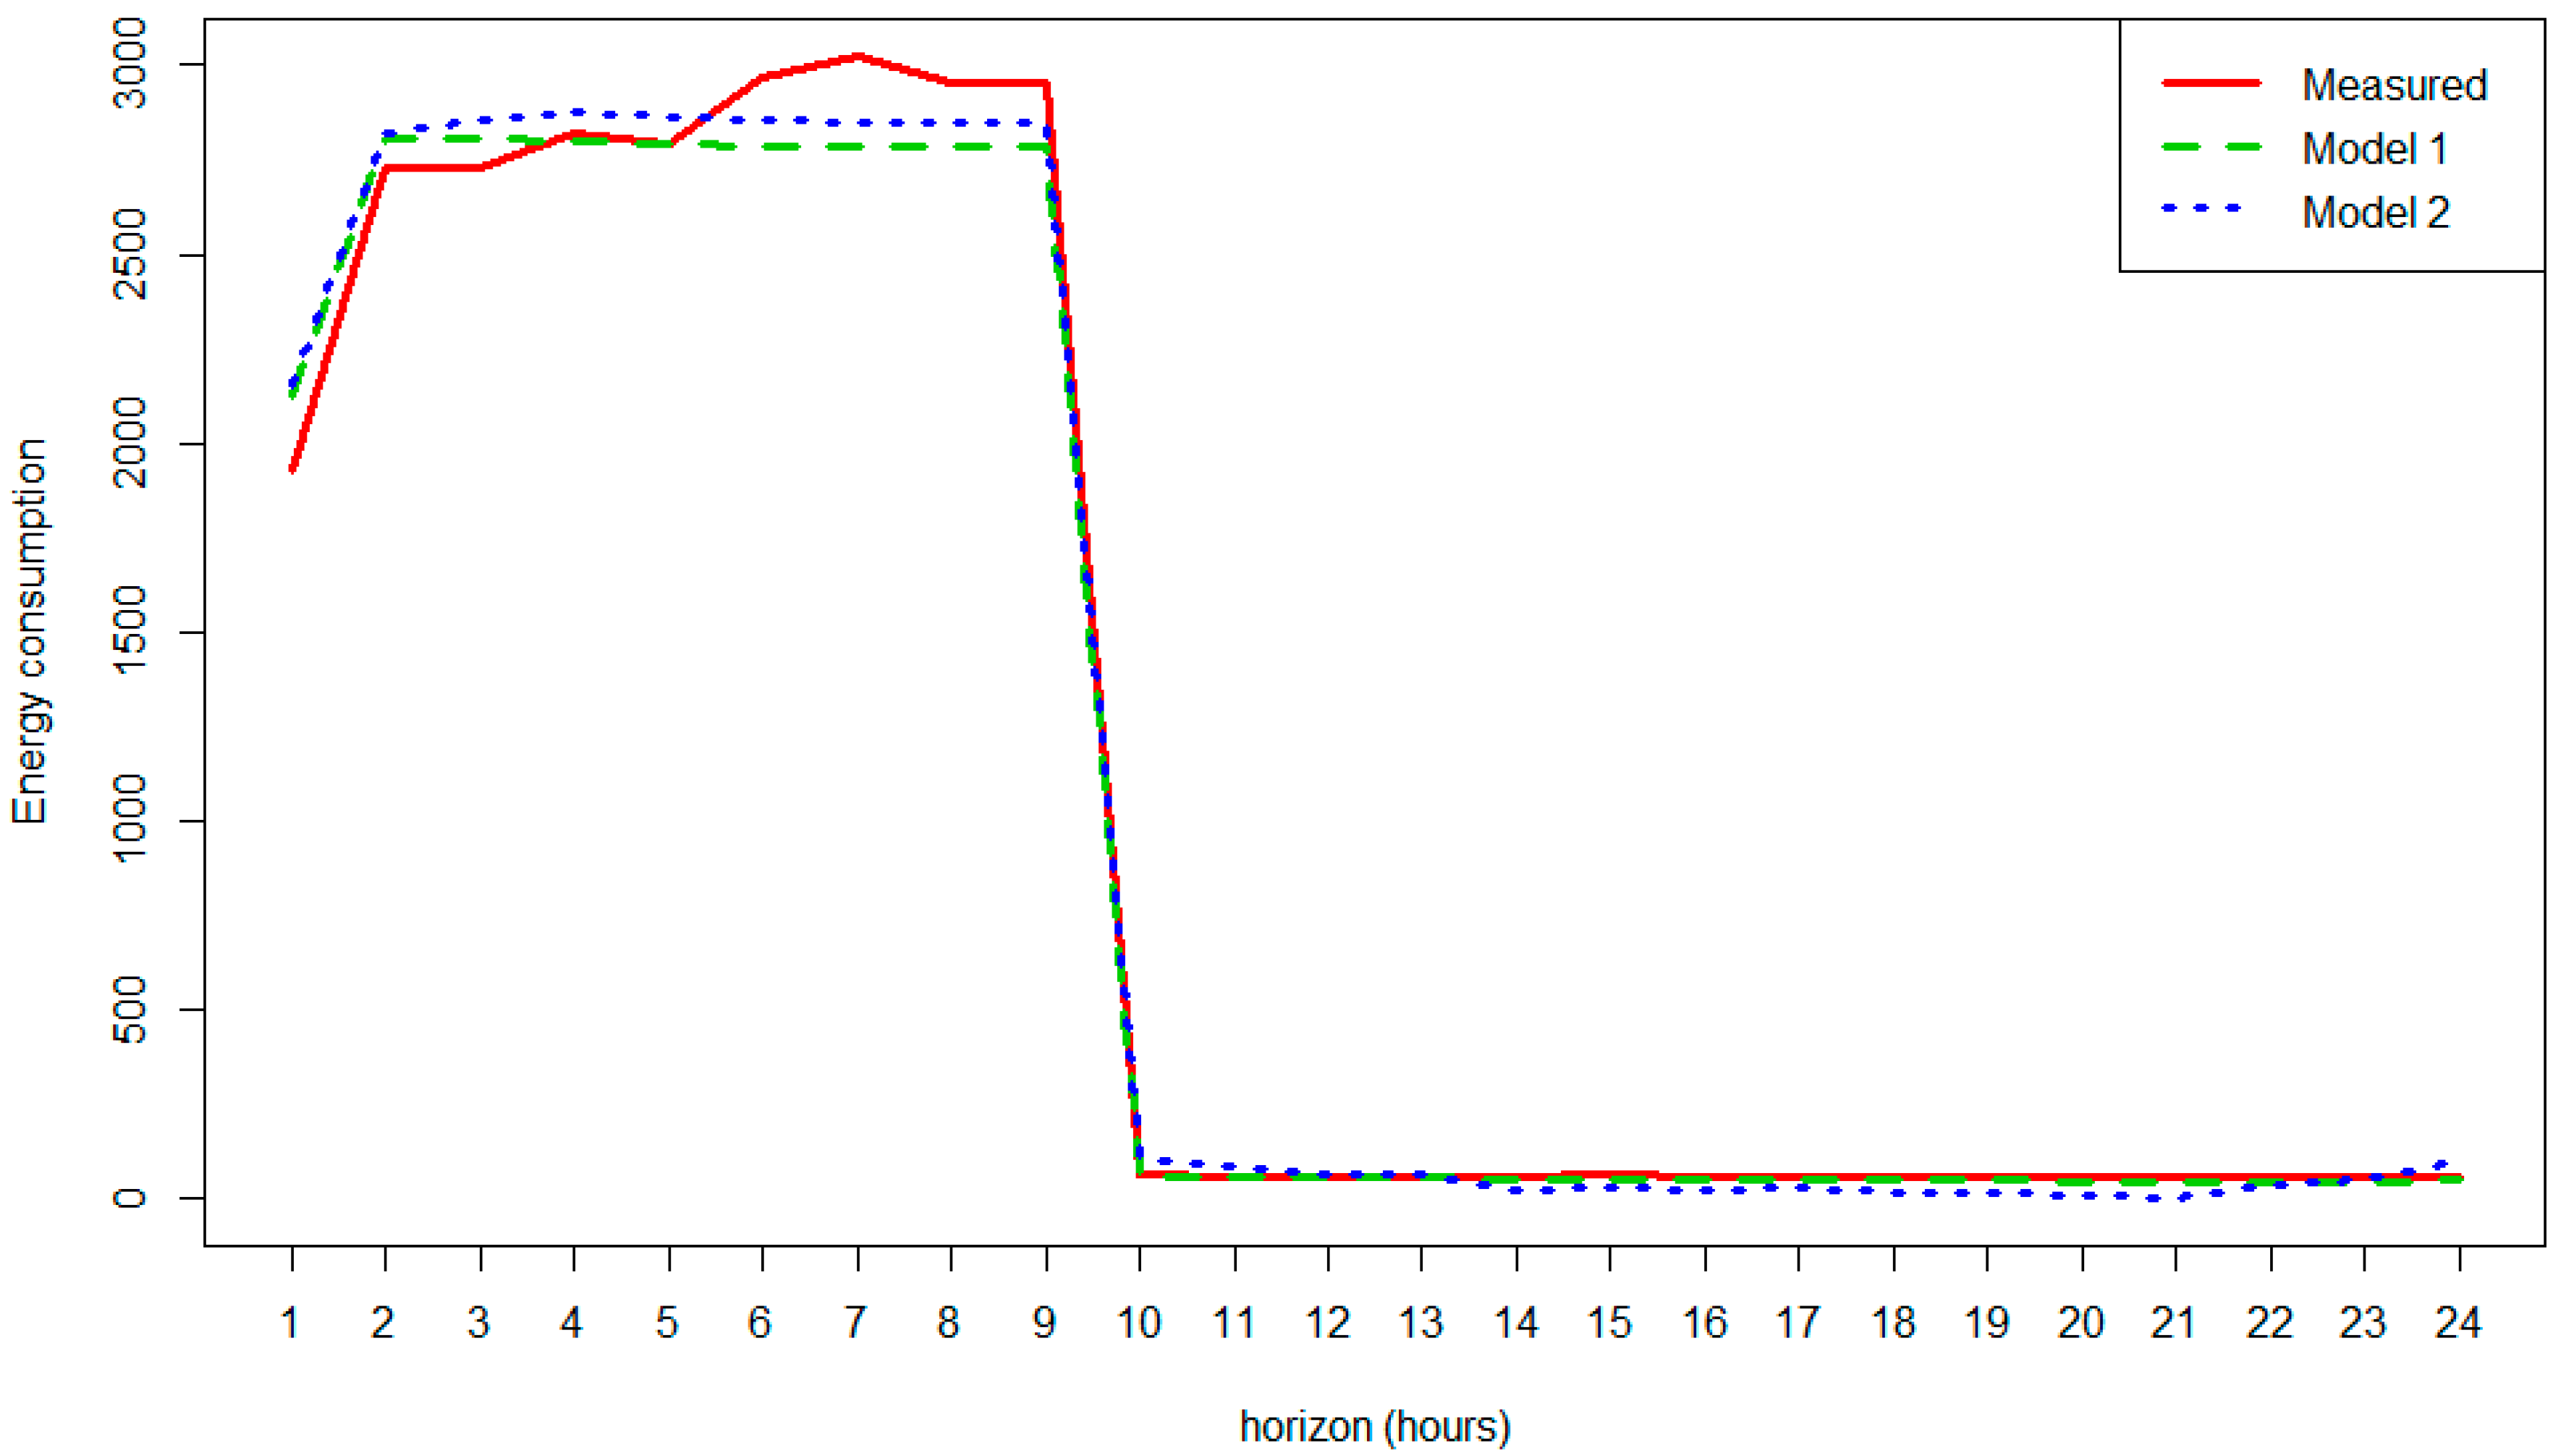
- Previous energy consumption.
- Previous occupation and future values of this variable with a known pattern and schedule.
- Previous energy consumption.
- Previous occupation and future values of this variable with a known a pattern and schedule.
- Outdoor temperature values with temperature predictions filling the time series to be predicted.
4. Conclusions and Future Work
Author Contributions
Funding
Acknowledgments
Conflicts of Interest
References
- Perez-Lombard, L.; Ortiz, J.; Pout, C. A review on buildings energy consumption information. Energy Build. 2008, 40, 394–398. [Google Scholar] [CrossRef]
- Schnieders, J. CEPHEUS–Measurement Results from More Than 100 Dwelling Units in Passive Houses. Available online: https://www.researchgate.net/publication/237709858_CEPHEUS_-_Measurement_results_from_more_than_100_dwelling_units_in_passive_houses (accessed on 19 July 2018).
- Schnieders, J.; Hermelink, A. CEPHEUS results: Measurements and occupants’ satisfaction provide evidence for Passive Houses being an option for sustainable building. Energy Policy 2006, 34, 151–171. [Google Scholar] [CrossRef]
- Mogles, N.; Walker, I.; Ramallo-González, A.P.; Lee, J.; Natarajan, S.; Padget, J.; Gabe-Thomas, E.; Lovett, T.; Ren, G.; Hyniewska, S.; et al. How smart do smart meters need to be? Build. Environ. 2017, 125, 439–450. [Google Scholar] [CrossRef]
- Terroso-Saenz, F.; González-Vida, A.; Ramallo-González, A.P.; Skarmeta, A.F. An open IoT platform for the management and analysis of energy data. Future Gener. Comput. Syst. 2017. [Google Scholar] [CrossRef]
- Moreno, V.; Úbeda, B.; Skarmeta, A.F.; Zamora, M.A. How can we tackle energy efficiency in IoT basedsmart buildings? Sensors 2014, 14, 9582–9614. [Google Scholar] [CrossRef] [PubMed]
- Darby, S. Making it obvious: Designing feedback into energy consumption. In Energy Efficiency in Household Appliances and Lighting; Springer: Berlin/Heidelberg, Germany, 2001; pp. 685–696. [Google Scholar]
- Karatasou, S.; Laskari, M.; Santamouris, M. Models of behavior change and residential energy use: A review of research directions and findings for behavior-based energy efficiency. Adv. Build. Energy Res. 2014, 8, 137–147. [Google Scholar] [CrossRef]
- Newton, D.; James, R.; Bartholomew, D. Building energy simulation—A user’s perspective. Energy Build. 1988, 10, 241–247. [Google Scholar] [CrossRef]
- Haldi, F.; Robinson, D. The impact of occupants’ behaviour on building energy demand. J. Build. Perform. Simul. 2011, 4, 323–338. [Google Scholar] [CrossRef]
- Rouleau, J.; Ramallo-González, A.; Gosselin, L. Towards a comprehensive tool to model occupant behaviour for dwellings that combines domestic hot water use with active occupancy. In Proceedings of the 15th IBPSA Conference, San Francisco, CA, USA, 7–9 August 2017. [Google Scholar]
- Agarwal, Y.; Balaji, B.; Gupta, R.; Lyles, J.; Wei, M.; Weng, T. Occupancy-driven energy management for smart building automation. In Proceedings of the 2nd ACM Workshop on Embedded Sensing Systems for Energy-Efficiency in Building, Zurich, Switzerland, 2 November 2010; pp. 1–6. [Google Scholar]
- Pettersen, T.D. Variation of energy consumption in dwellings due to climate, building and inhabitants. Energy Build. 1994, 21, 209–218. [Google Scholar] [CrossRef]
- Lindberg, R.; Binamu, A.; Teikari, M. Five-year data of measured weather, energy consumption, and time-dependent temperature variations within different exterior wall structures. Energy Build. 2004, 36, 495–501. [Google Scholar] [CrossRef]
- Keller, J.; Heiko, A. The influence of information and communication technology (ICT) on future foresight processes—Results from a Delphi survey. Technol. Forecast. Soc. Chang. 2014, 85, 81–92. [Google Scholar] [CrossRef]
- Weiser, M. The computer for the 21st century. Sci. Am. 1991, 265, 94–104. [Google Scholar] [CrossRef]
- Atzori, L.; Iera, A.; Morabito, G. The internet of things: A survey. Comput. Netw. 2010, 54, 2787–2805. [Google Scholar] [CrossRef]
- Perera, C.; Zaslavsky, A.; Christen, P.; Georgakopoulos, D. Sensing as a service model for smart cities supported by internet of things. Trans. Emerg. Telecommun. Technol. 2014, 25, 81–93. [Google Scholar] [CrossRef]
- European Commission. Benchmarking Smart Metering Deployment in the EU-27 with a Focus on Electricity; Publications Office of the European Union: Luxembourg, 2014. [Google Scholar]
- Voss, K.; Sartori, I.; Napolitano, A.; Geier, S.; Gonçalves, H.; Hall, M.; Heiselberg, P.; Widén, J.; Candanedo, J.A.; Musall, E. Load matching and grid interaction of net zero energy buildings. In Proceedings of the EUROSUN 2010 International Conference on Solar Heating, Cooling and Buildings, Graz, Austria, 28 September–1 October 2010. [Google Scholar]
- Zhao, H.; Magoules, F. A review on the prediction of building energy consumption. Renew. Sustain. Energy Rev. 2012, 16, 3586–3592. [Google Scholar] [CrossRef]
- Han, D.M.; Lim, J.H. Design and implementation of smart home energy management systems based on zigbee. IEEE Trans. Consum. Electron. 2010, 56, 1417–1425. [Google Scholar] [CrossRef]
- Oksa, P.; Soini, M.; Sydnheimo, L.; Kivikoski, M. Kilavi platform for wireless building automation. Energy Build. 2008, 40, 1721–1730. [Google Scholar] [CrossRef]
- Moreno, M.V.; Zamora, M.A.; Santa, J.; Skarmeta, A.F. An indoor localization mechanism based on RFID and IR data in ambient intelligent environments. In Proceedings of the 2012 Sixth International Conference on Innovative Mobile and Internet Services in Ubiquitous Computing, Palermo, Italy, 4–6 July 2012. [Google Scholar]
- Moreno-Cano, M.; Zamora-Izquierdo, M.A.; Santa, J.; Skarmeta, A.F. An indoor localization system based on artificial neural networks and particle filters applied to intelligent buildings. Neurocomputing 2013, 122, 116–125. [Google Scholar] [CrossRef]
- Hernández-Ramos, J.L.; Moreno, M.V.; Bernabé, J.B.; Carrillo, D.G.; Skarmeta, A.F. SAFIR: Secure access framework for IoT-enabled services on smart buildings. J. Comput. Syst. Sci. 2015, 81, 1452–1463. [Google Scholar] [CrossRef]
- Moreno, M.V.; Zamora, M.A.; Skarmeta, A.F. An IoT based framework for user–centric smart building services. Int. J. Web Grid Serv. 2015, 11, 78–101. [Google Scholar] [CrossRef]
- Moreno, V.; Zamora, M.A.; Skarmeta, A.F. A low-cost indoor localization system for energy sustainability in smart buildings. IEEE Sens. J. 2016, 16, 3246–3262. [Google Scholar] [CrossRef]
- Moreno, M.V.; Terroso-Sáenz, F.; González-Vidal, A.; Valdés-Vela, M.; Skarmeta, A.F.; Zamora, M.A.; Chang, V. Applicability of big data techniques to smart cities deployments. IEEE Trans. Ind. Inform. 2017, 13, 800–809. [Google Scholar] [CrossRef]
- Zamora-Izquierdo, M.A.; Santa, J.; Gmez-Skarmeta, A.F. An integral and networked home automation solution for indoor ambient intelligence. IEEE Pervasive Comput. 2010, 9, 66–77. [Google Scholar] [CrossRef]
- Hazas, M.; Friday, A.; Scott, J. Look back before leaping forward: Four decades of domestic energy inquiry. IEEE Pervasive Comput. 2011, 10, 13–19. [Google Scholar] [CrossRef]
- Agencia Estatal de Meteorología-AEMET. Gobierno de España. Available online: http://www.aemet.es/es/portada (accessed on 18 July 2018).
- Zoha, A.; Gluhak, A.; Ali Imran, M.; Rajasegarar, S. Non-intrusive load monitoring approaches for disaggregated energy sensing: A survey. Sensors 2012, 12, 16838–16866. [Google Scholar] [CrossRef] [PubMed] [Green Version]
- Santander, P.; Elórtegui, C.; González, C.; Allende-Cid, H.; Palma, W. Redes sociales, inteligencia computacional y predicción electoral: El caso de las primarias presidenciales de Chile 2017. Cuadernos. Info 2017, 41, 41–56. (In Spanish) [Google Scholar] [CrossRef]
- Hamadeh, A. Anomaly Detection in a Multivariate DataStream in a Highly Scalable and Fault Tolerant Architecture. Master’s Thesis, KTH, Stockholm, Sweden, 2017. [Google Scholar]
- Brügner, H. Holt-Winters Traffic Prediction on Aggregated Flow Data. In Proceedings of the Seminars Future Internet (FI) and Innovative Internet Technologies and Mobile Communication (IITM) Focal Topic: Advanced Persistent Threats, Munich, Germany, 24 February–16 August 2017; pp. 25–32. [Google Scholar]
- Riihijarvi, J.; Mahonen, P. Machine Learning for Performance Prediction in Mobile Cellular Networks. IEEE Comput. Intell. Mag. 2018, 13, 51–60. [Google Scholar] [CrossRef]
- Alkharif, S.; Lee, K.; Kim, H. Time-Series Analysis for Price Prediction of Opportunistic Cloud Computing Resources, In Proceedings of the 7th International Conference on Emerging Databases, Busan, Korea, 7–9 August 2017.
- Saad, F.; Mansinghka, V. Temporally-Reweighted Chinese Restaurant Process Mixtures for Clustering, Imputing, and Forecasting Multivariate Time Series. In Proceedings of the International Conference on Artificial Intelligence and Statistics, Playa Blanca, Lanzarote, Spain, 9–11 April 2018; pp. 755–764. [Google Scholar]
- Taylor, S.; Letham, B. Prophet: Automatic Forecasting Procedure. Available online: https://cran.r-project.org/web/packages/prophet/prophet.pdf (accessed on 25 June 2018).
- Taylor, S.J.; Letham, B. Forecasting at scale. Am. Stat. 2018, 72, 37–45. [Google Scholar] [CrossRef]
- González-Vidal, A.; Ramallo-González, A.P.; Terroso-Sáenz, F.; Skarmeta, A. Data driven modeling for energy consumption prediction in smart buildings. In Proceedings of the 2017 IEEE International Conference on Big Data, Boston, MA, USA, 11–14 December 2017; pp. 4562–4569. [Google Scholar]
- González-Vidal, A.; Moreno-Cano, V.; Terroso-Sáenz, F.; Skarmeta, A.F. Towards energy efficiency smart buildings models based on intelligent data analytics. Procedia Comput. Sci. 2016, 83, 994–999. [Google Scholar] [CrossRef]


| Features | Sensor Deployments Allow Measurement of a Wide Set of Data |
|---|---|
| Weather data | Temperature and humidity. |
| Weather forecast | Up to 4 days. |
| Indoor conditions | In four different locations, temperature and humidity. |
| Occupancy and activity | A control access system in the test lab entrance and volumetric detectors in each room let predict in an accurate way the tracking of human presence. |
| Energy consumption: | For this purpose, and to monitor each component separately, non-intrusive load monitoring techniques have been considered [33]. We distinguish: |
| Electrical devices | Computers and other appliance are monitored. |
| Lighting | Differentiating each room. |
| Heating, Ventilation, and Air Conditioning (HVAC) | Each air-conditioned machine is quantified but is much bigger than the previous consumptions, which makes it energetically undesirable. |
| Actuators | It is Possible to Modify the Test Lab Features, Comfort and Energy Consumption, Adapting the Next Actuators |
| Access | Test lab can be completely locked, rendering it impossible to enter. |
| Control of the energy supplies | The plugs can be disabled completely. |
| Control of the HVAC machines | It is possible to force a shutdown or a start. The temperature set point and fan velocity mode can be chosen. |
| Ventilation grilles | Each air supply duct ends in a motorized ventilation grille (one per room), which can be opened or closed depending on the nature of its use in the area. |
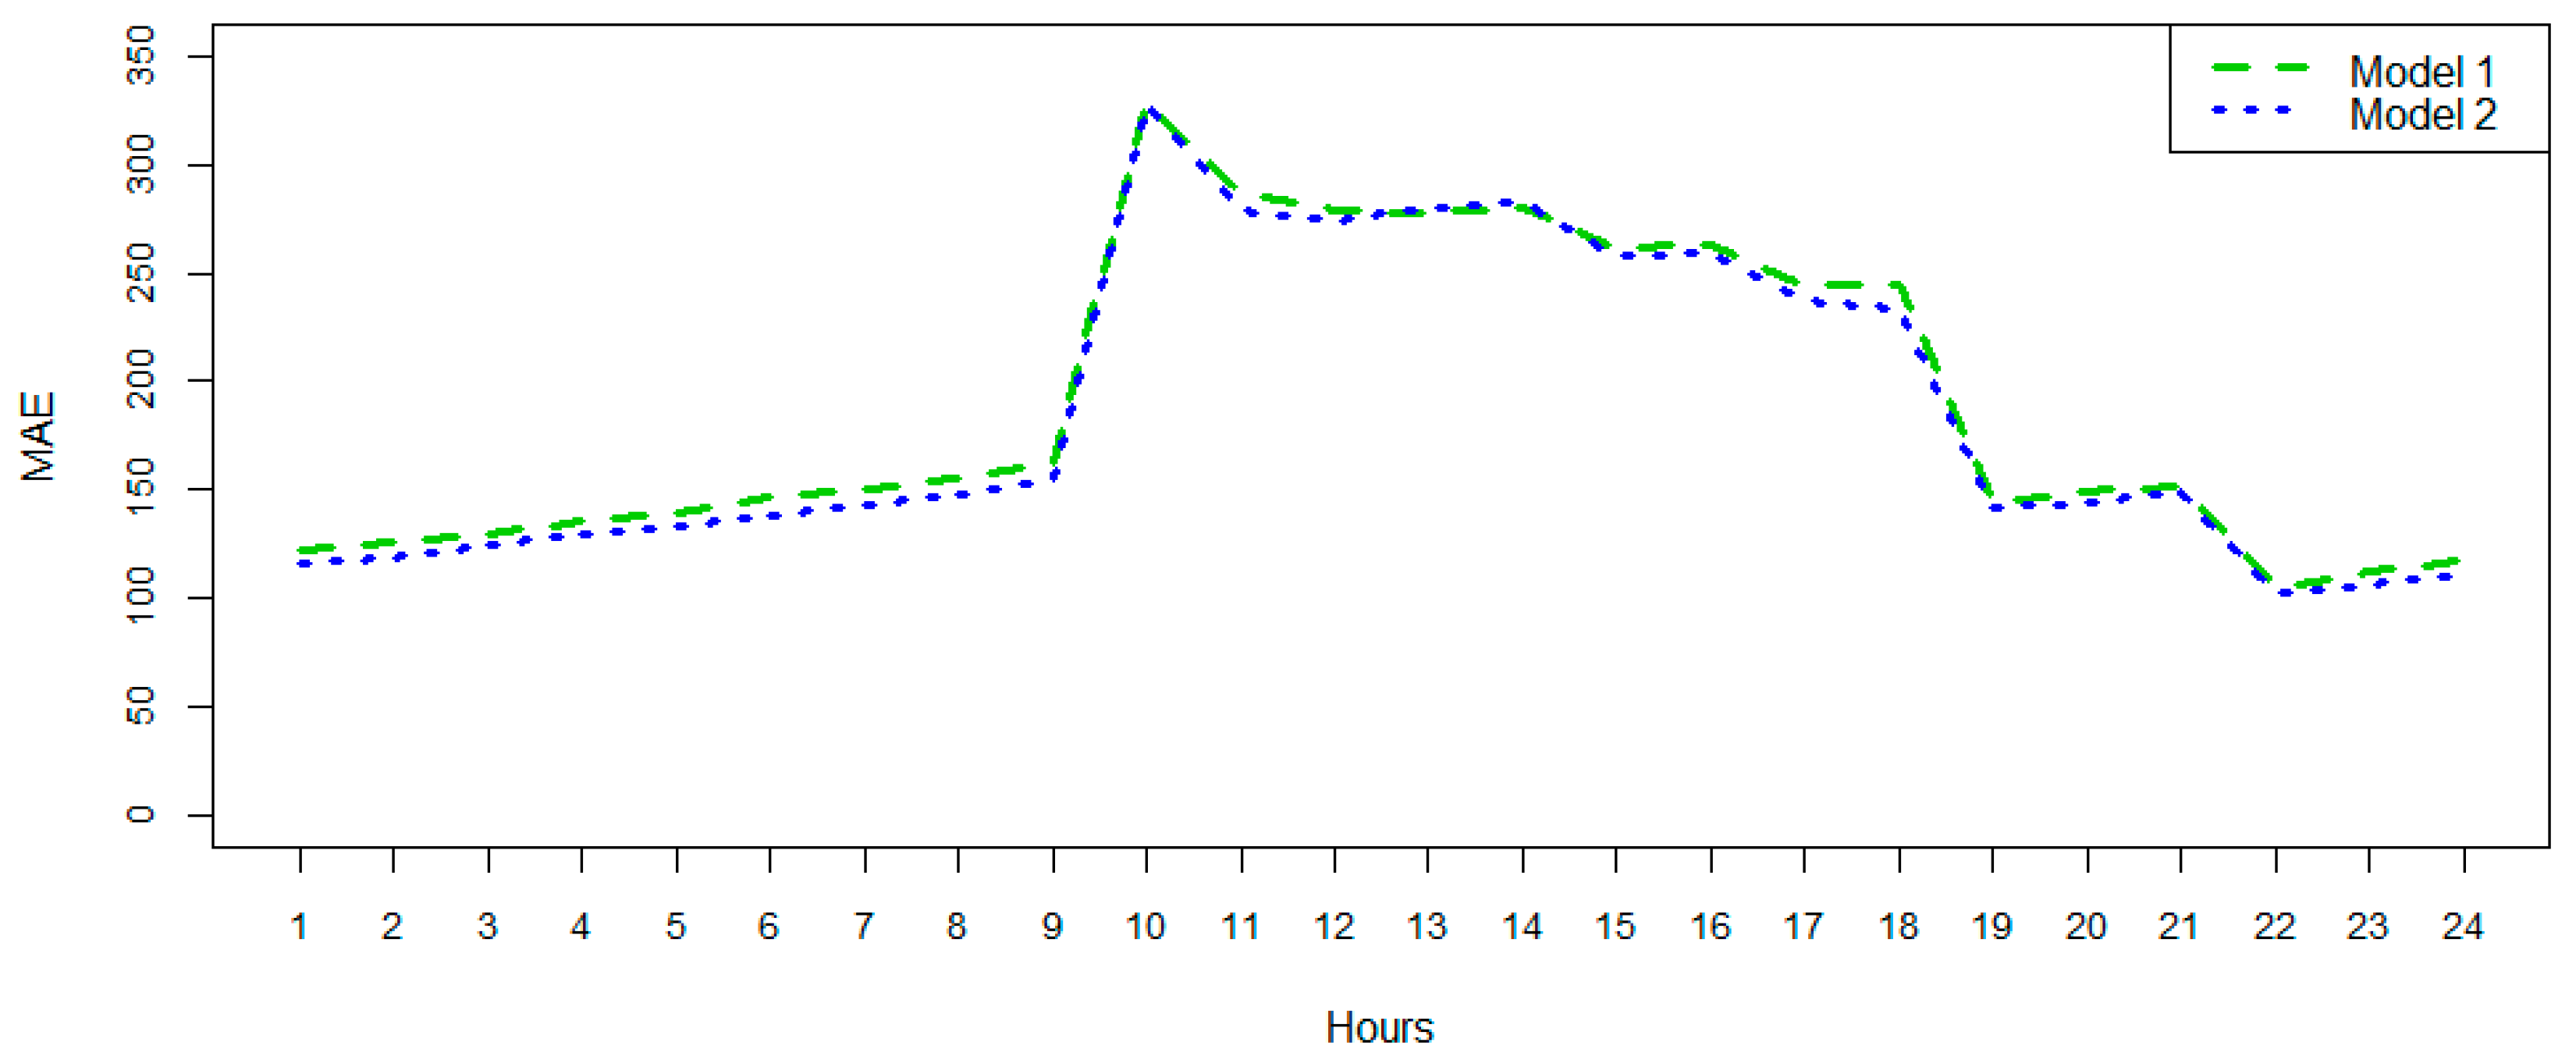
| Hour | RMSE Model 1 | RMSE Model 2 | Improvement | Hour | RMSE Model 1 | RMSE Model 2 | Improvement |
|---|---|---|---|---|---|---|---|
| 01 | 192.93 | 176.80 | 8.36% | 13 | 378.35 | 384.33 | −1.58% |
| 02 | 200.24 | 182.96 | 8.63% | 14 | 381.95 | 381.93 | 0.00% |
| 03 | 210.39 | 191.86 | 8.81% | 15 | 358.22 | 358.05 | 0.05% |
| 04 | 222.05 | 202.28 | 8.90% | 16 | 358.66 | 352.96 | 1.59% |
| 05 | 231.73 | 212.67 | 8.23% | 17 | 349.19 | 342.75 | 1.84% |
| 06 | 243.96 | 222.99 | 8.59% | 18 | 356.19 | 344.36 | 3.32% |
| 07 | 251.60 | 230.77 | 8.28% | 19 | 249.11 | 247.70 | 0.57% |
| 08 | 262.76 | 239.10 | 9.00% | 20 | 258.60 | 255.62 | 1.15% |
| 09 | 275.33 | 250.72 | 8.94% | 21 | 269.52 | 265.63 | 1.44% |
| 10 | 427.56 | 432.00 | −1.04% | 22 | 160.57 | 149.72 | 6.75% |
| 11 | 381.20 | 377.35 | 1.01% | 23 | 172.48 | 159.43 | 7.57% |
| 12 | 376.05 | 374.41 | 0.43% | 24 | 181.99 | 167.22 | 8.12% |
© 2018 by the authors. Licensee MDPI, Basel, Switzerland. This article is an open access article distributed under the terms and conditions of the Creative Commons Attribution (CC BY) license (http://creativecommons.org/licenses/by/4.0/).
Share and Cite
Rodríguez-Rodríguez, I.; González Vidal, A.; Ramallo González, A.P.; Zamora, M.Á. Commissioning of the Controlled and Automatized Testing Facility for Human Behavior and Control (CASITA). Sensors 2018, 18, 2829. https://doi.org/10.3390/s18092829
Rodríguez-Rodríguez I, González Vidal A, Ramallo González AP, Zamora MÁ. Commissioning of the Controlled and Automatized Testing Facility for Human Behavior and Control (CASITA). Sensors. 2018; 18(9):2829. https://doi.org/10.3390/s18092829
Chicago/Turabian StyleRodríguez-Rodríguez, Ignacio, Aurora González Vidal, Alfonso P. Ramallo González, and Miguel Ángel Zamora. 2018. "Commissioning of the Controlled and Automatized Testing Facility for Human Behavior and Control (CASITA)" Sensors 18, no. 9: 2829. https://doi.org/10.3390/s18092829