
Visualizing and Evaluating Finger Movement Using Combined Acceleration and Contact-Force Sensors: A Proof-of-Concept Study

 ,
,
Abstract
:1. Introduction
2. Materials and Methods
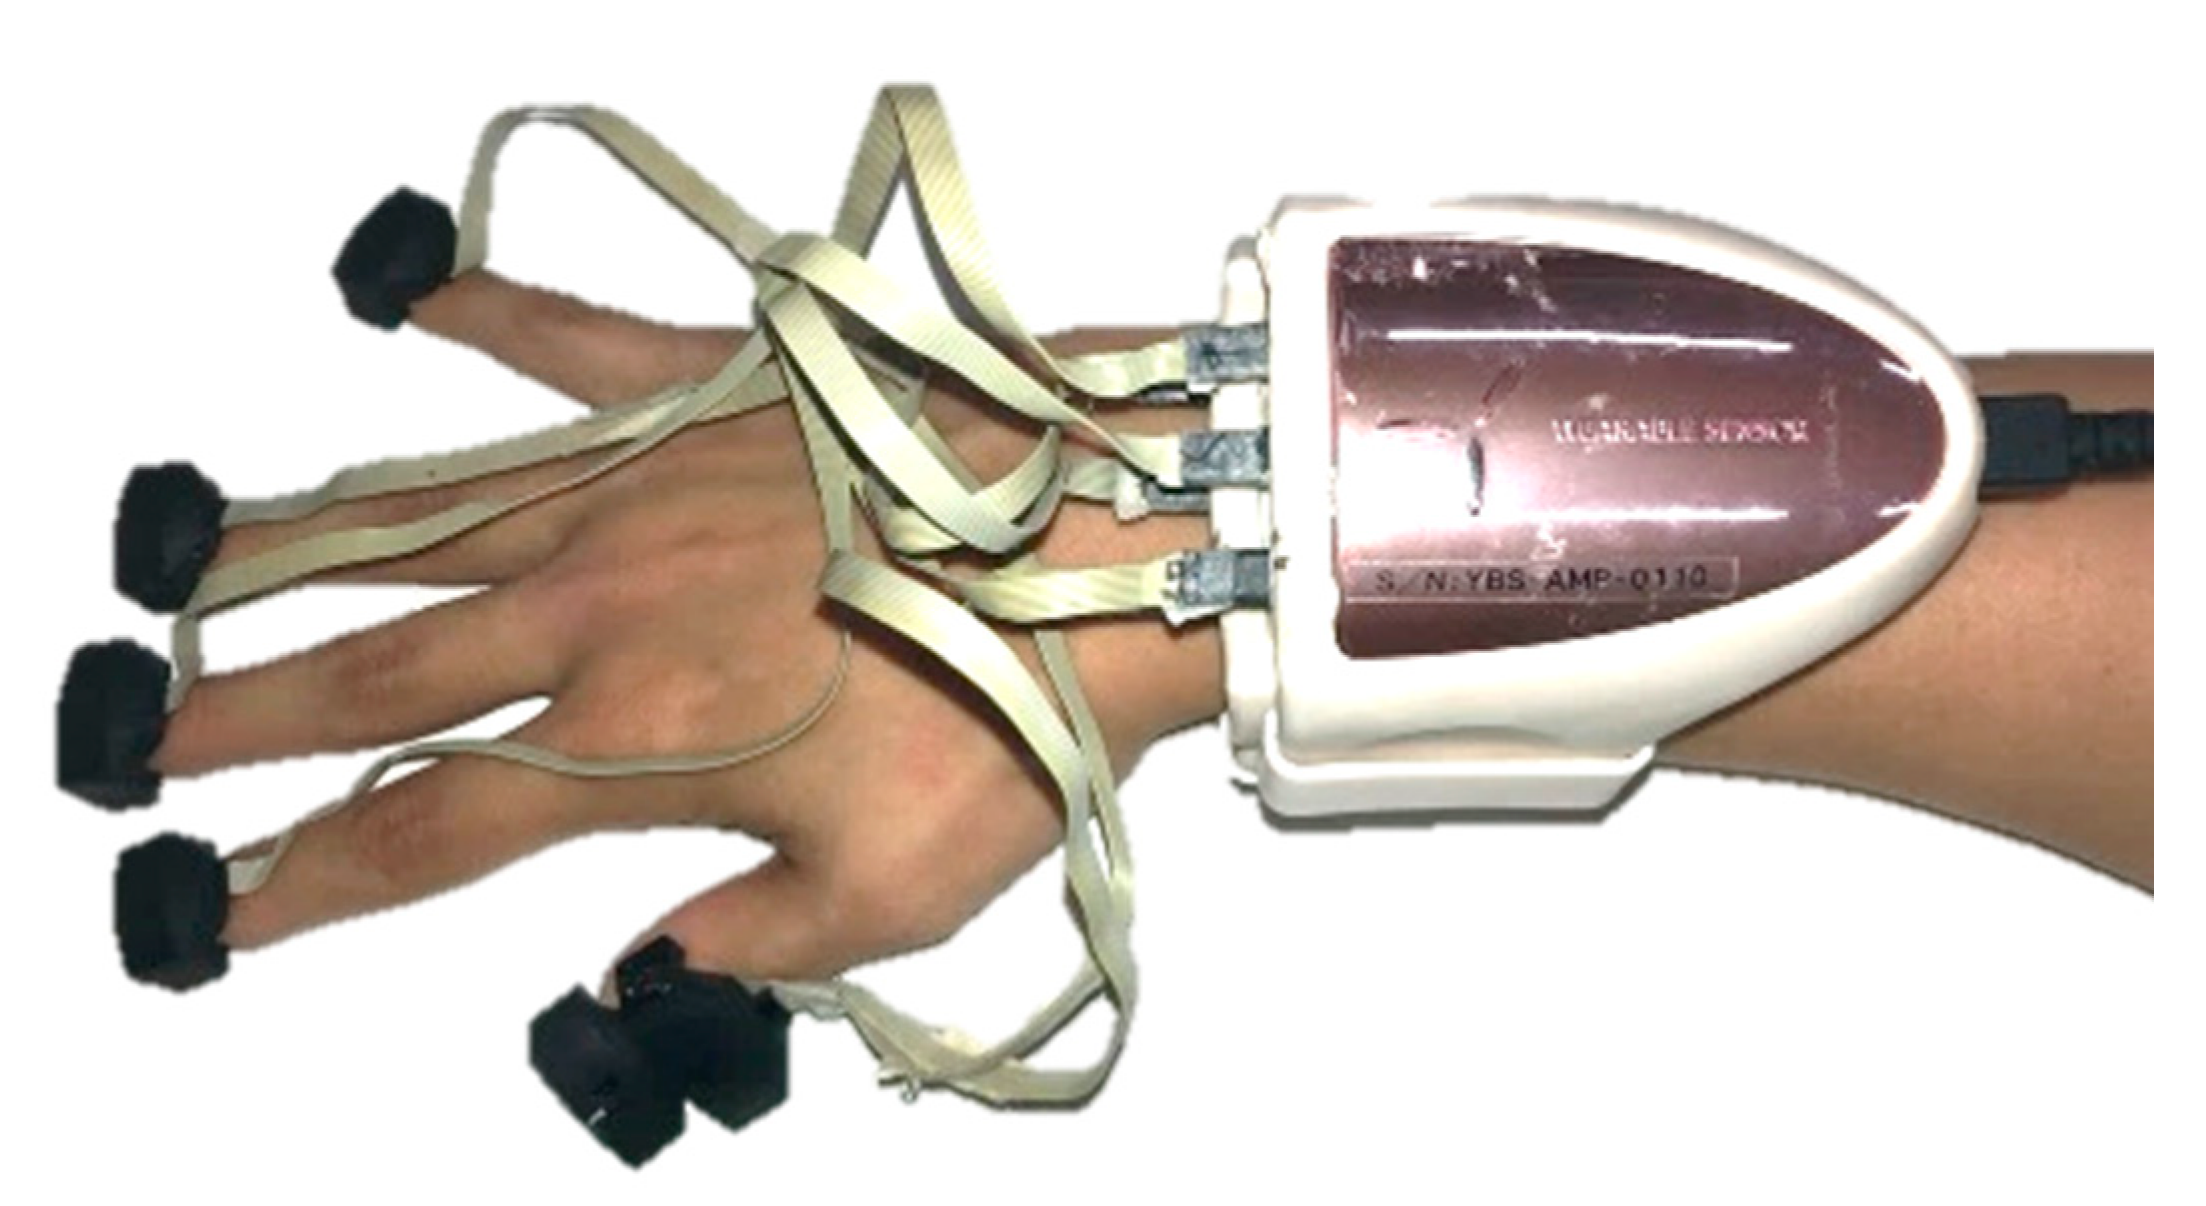
2.1. HapLog
2.2. Measurement
- Freely
- As soon as possible
- Slowly
- Irregularly
- Shivering
- Without moving thumb as much as possible
- Without moving the index finger as much as possible
- Without moving the middle finger as much as possible
- Without moving the ring finger as much as possible
- Without moving little finger as much as possible
2.3. Preprocessing
2.4. Evaluation
- Data variation
- Number of times to grip and release
- Frequency characteristics
- Correlation of each finger
3. Results
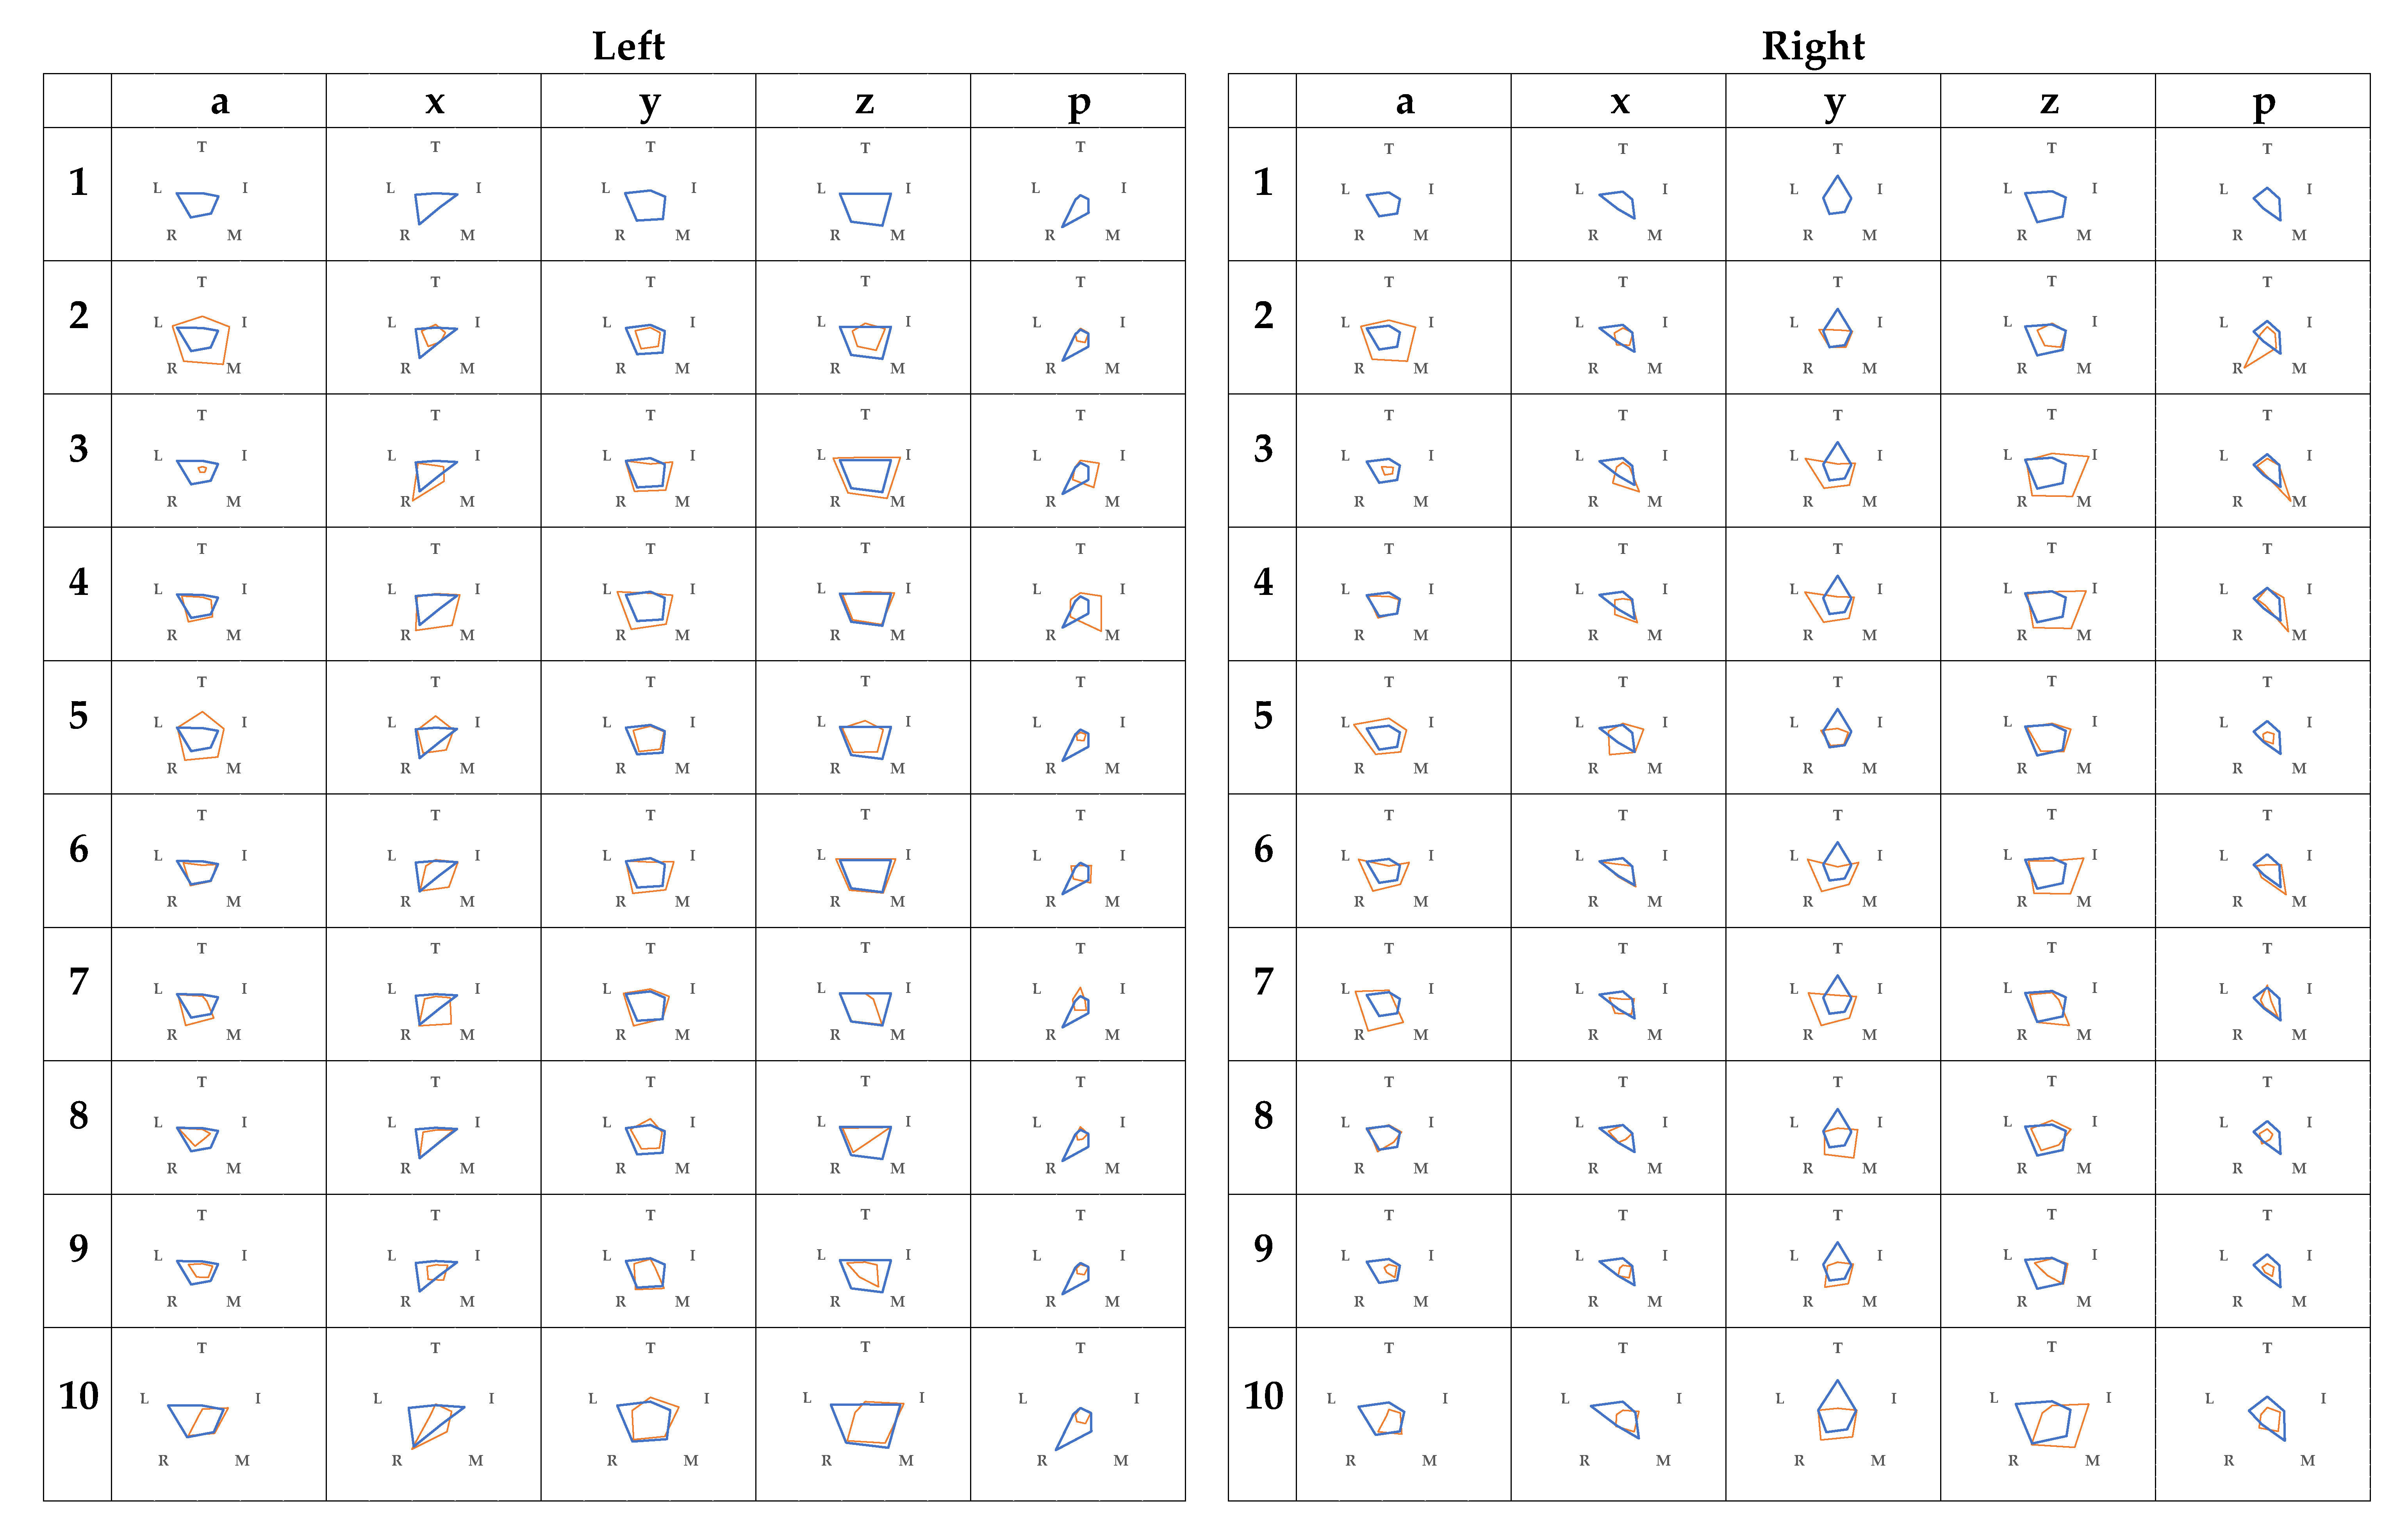
3.1. Data Variation
3.2. Number of Times to Grip and Release
3.3. Frequency Characteristics
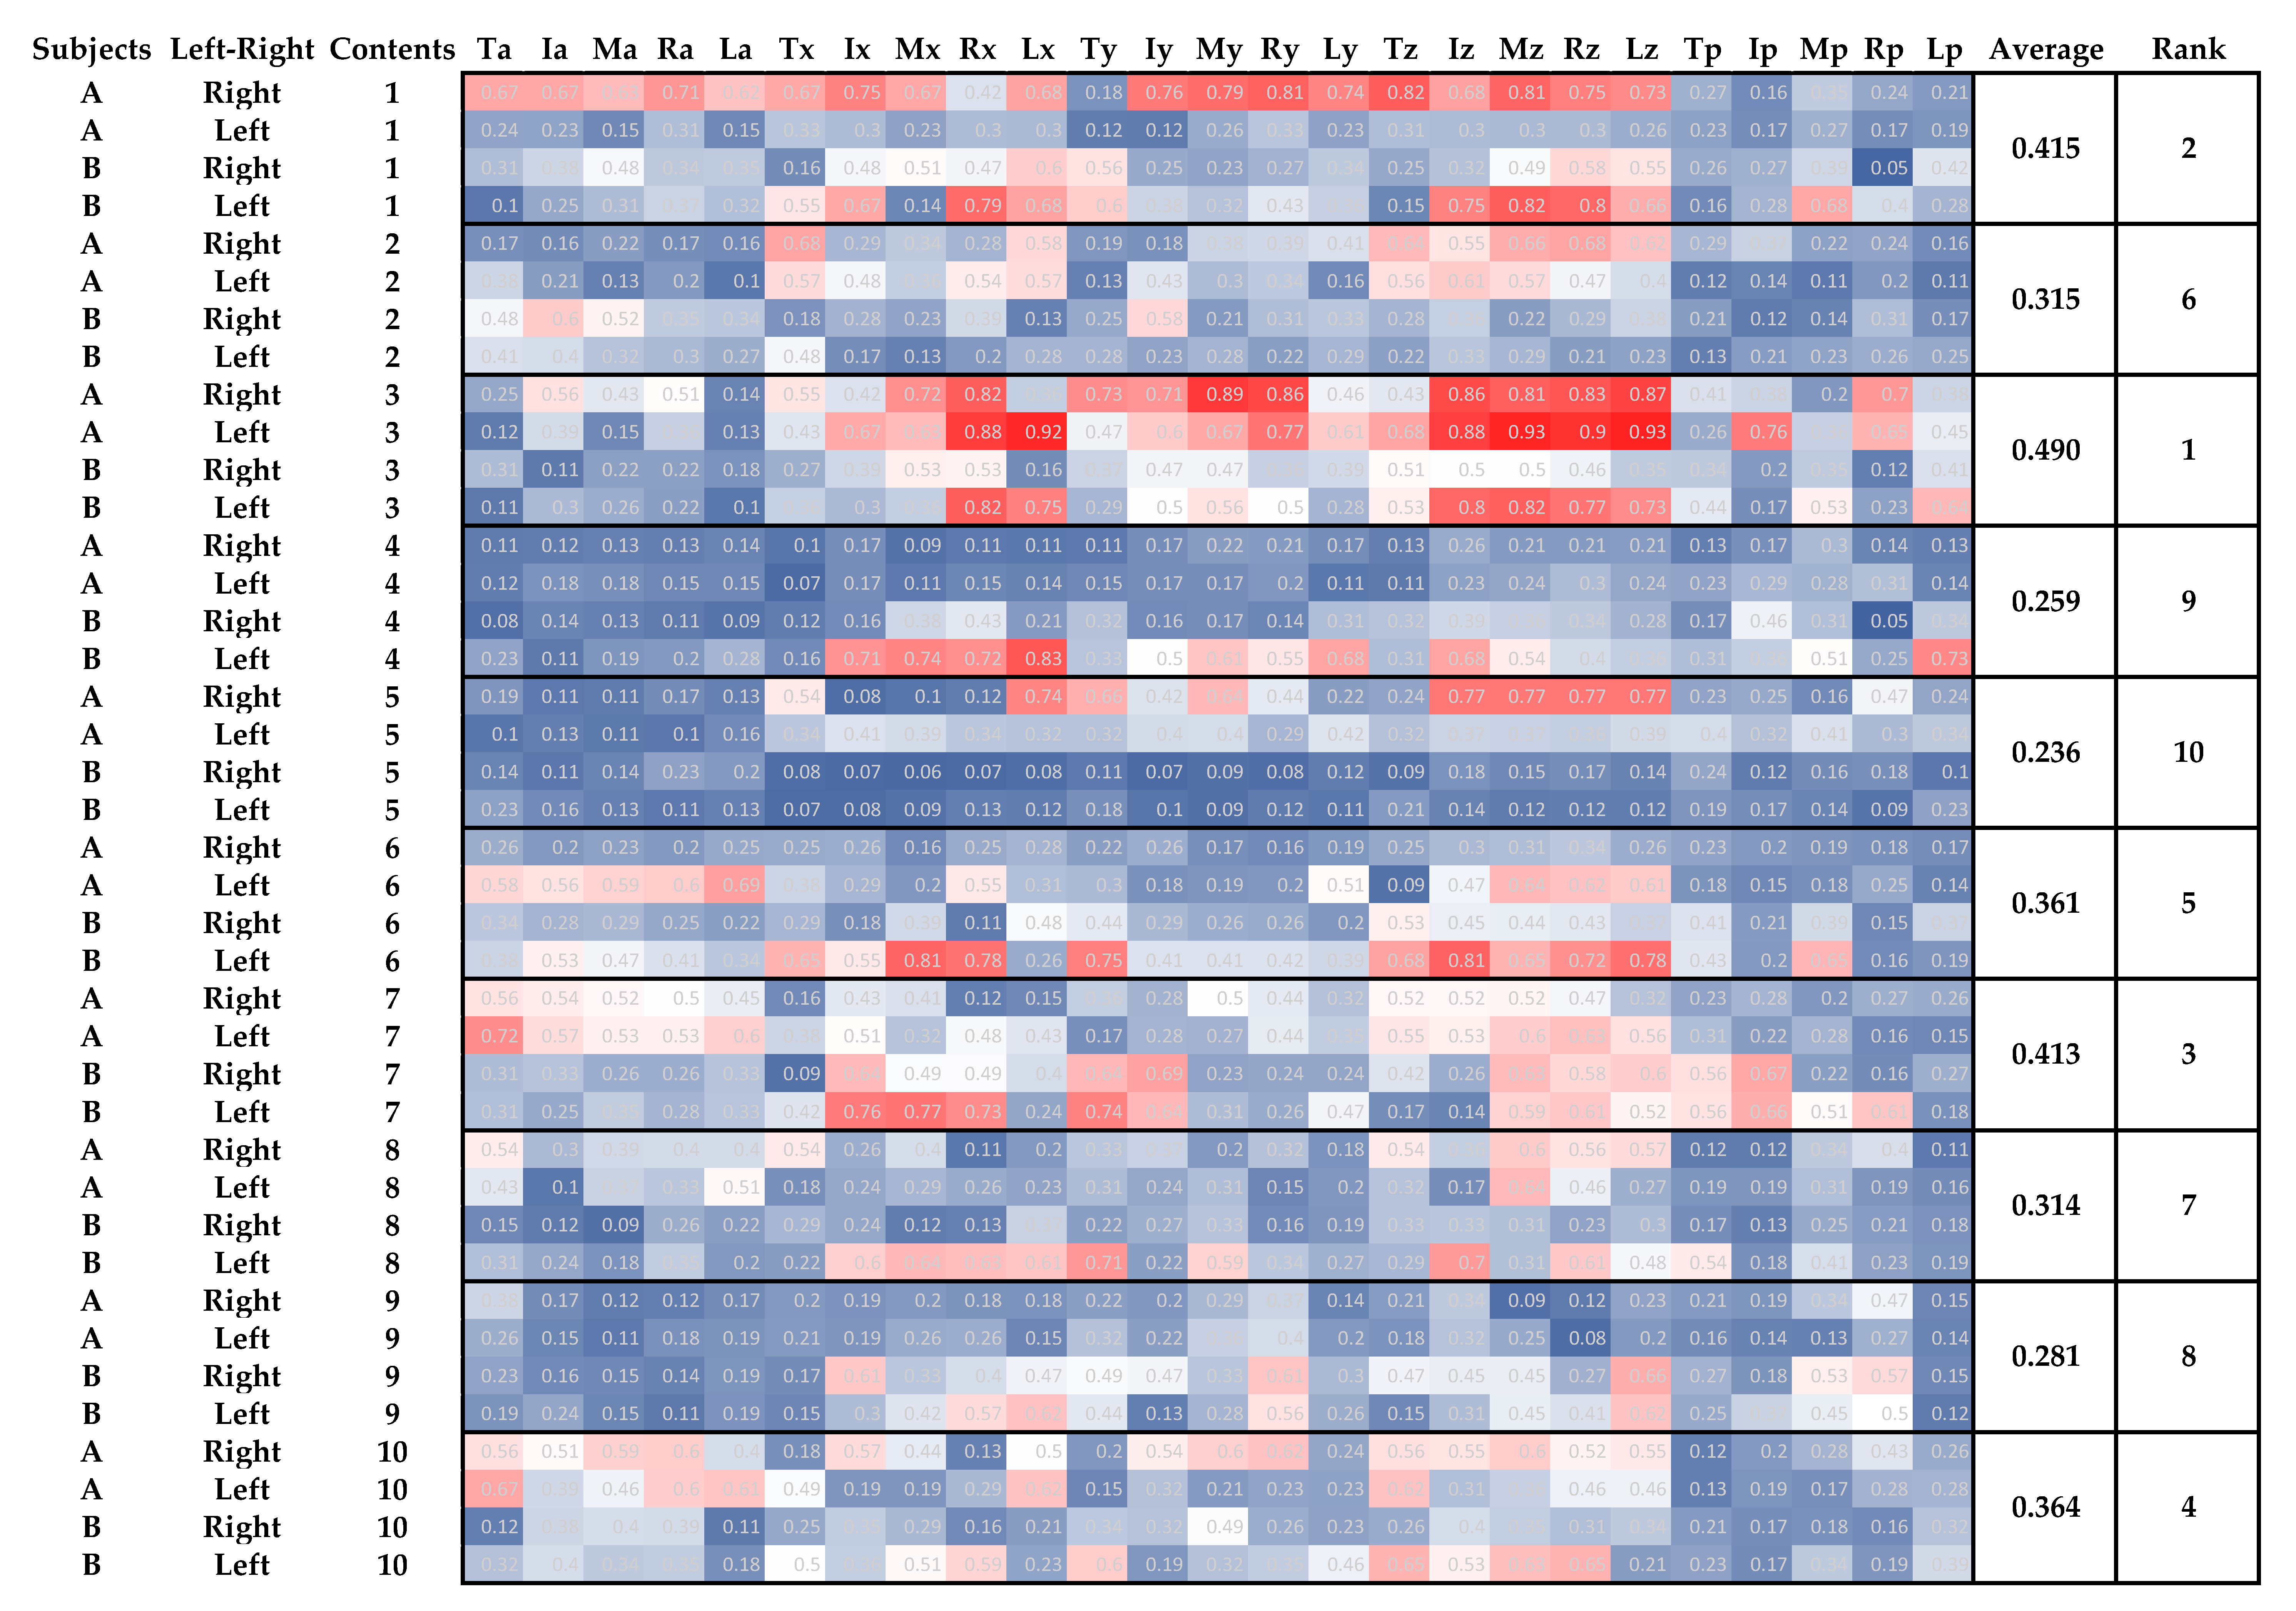
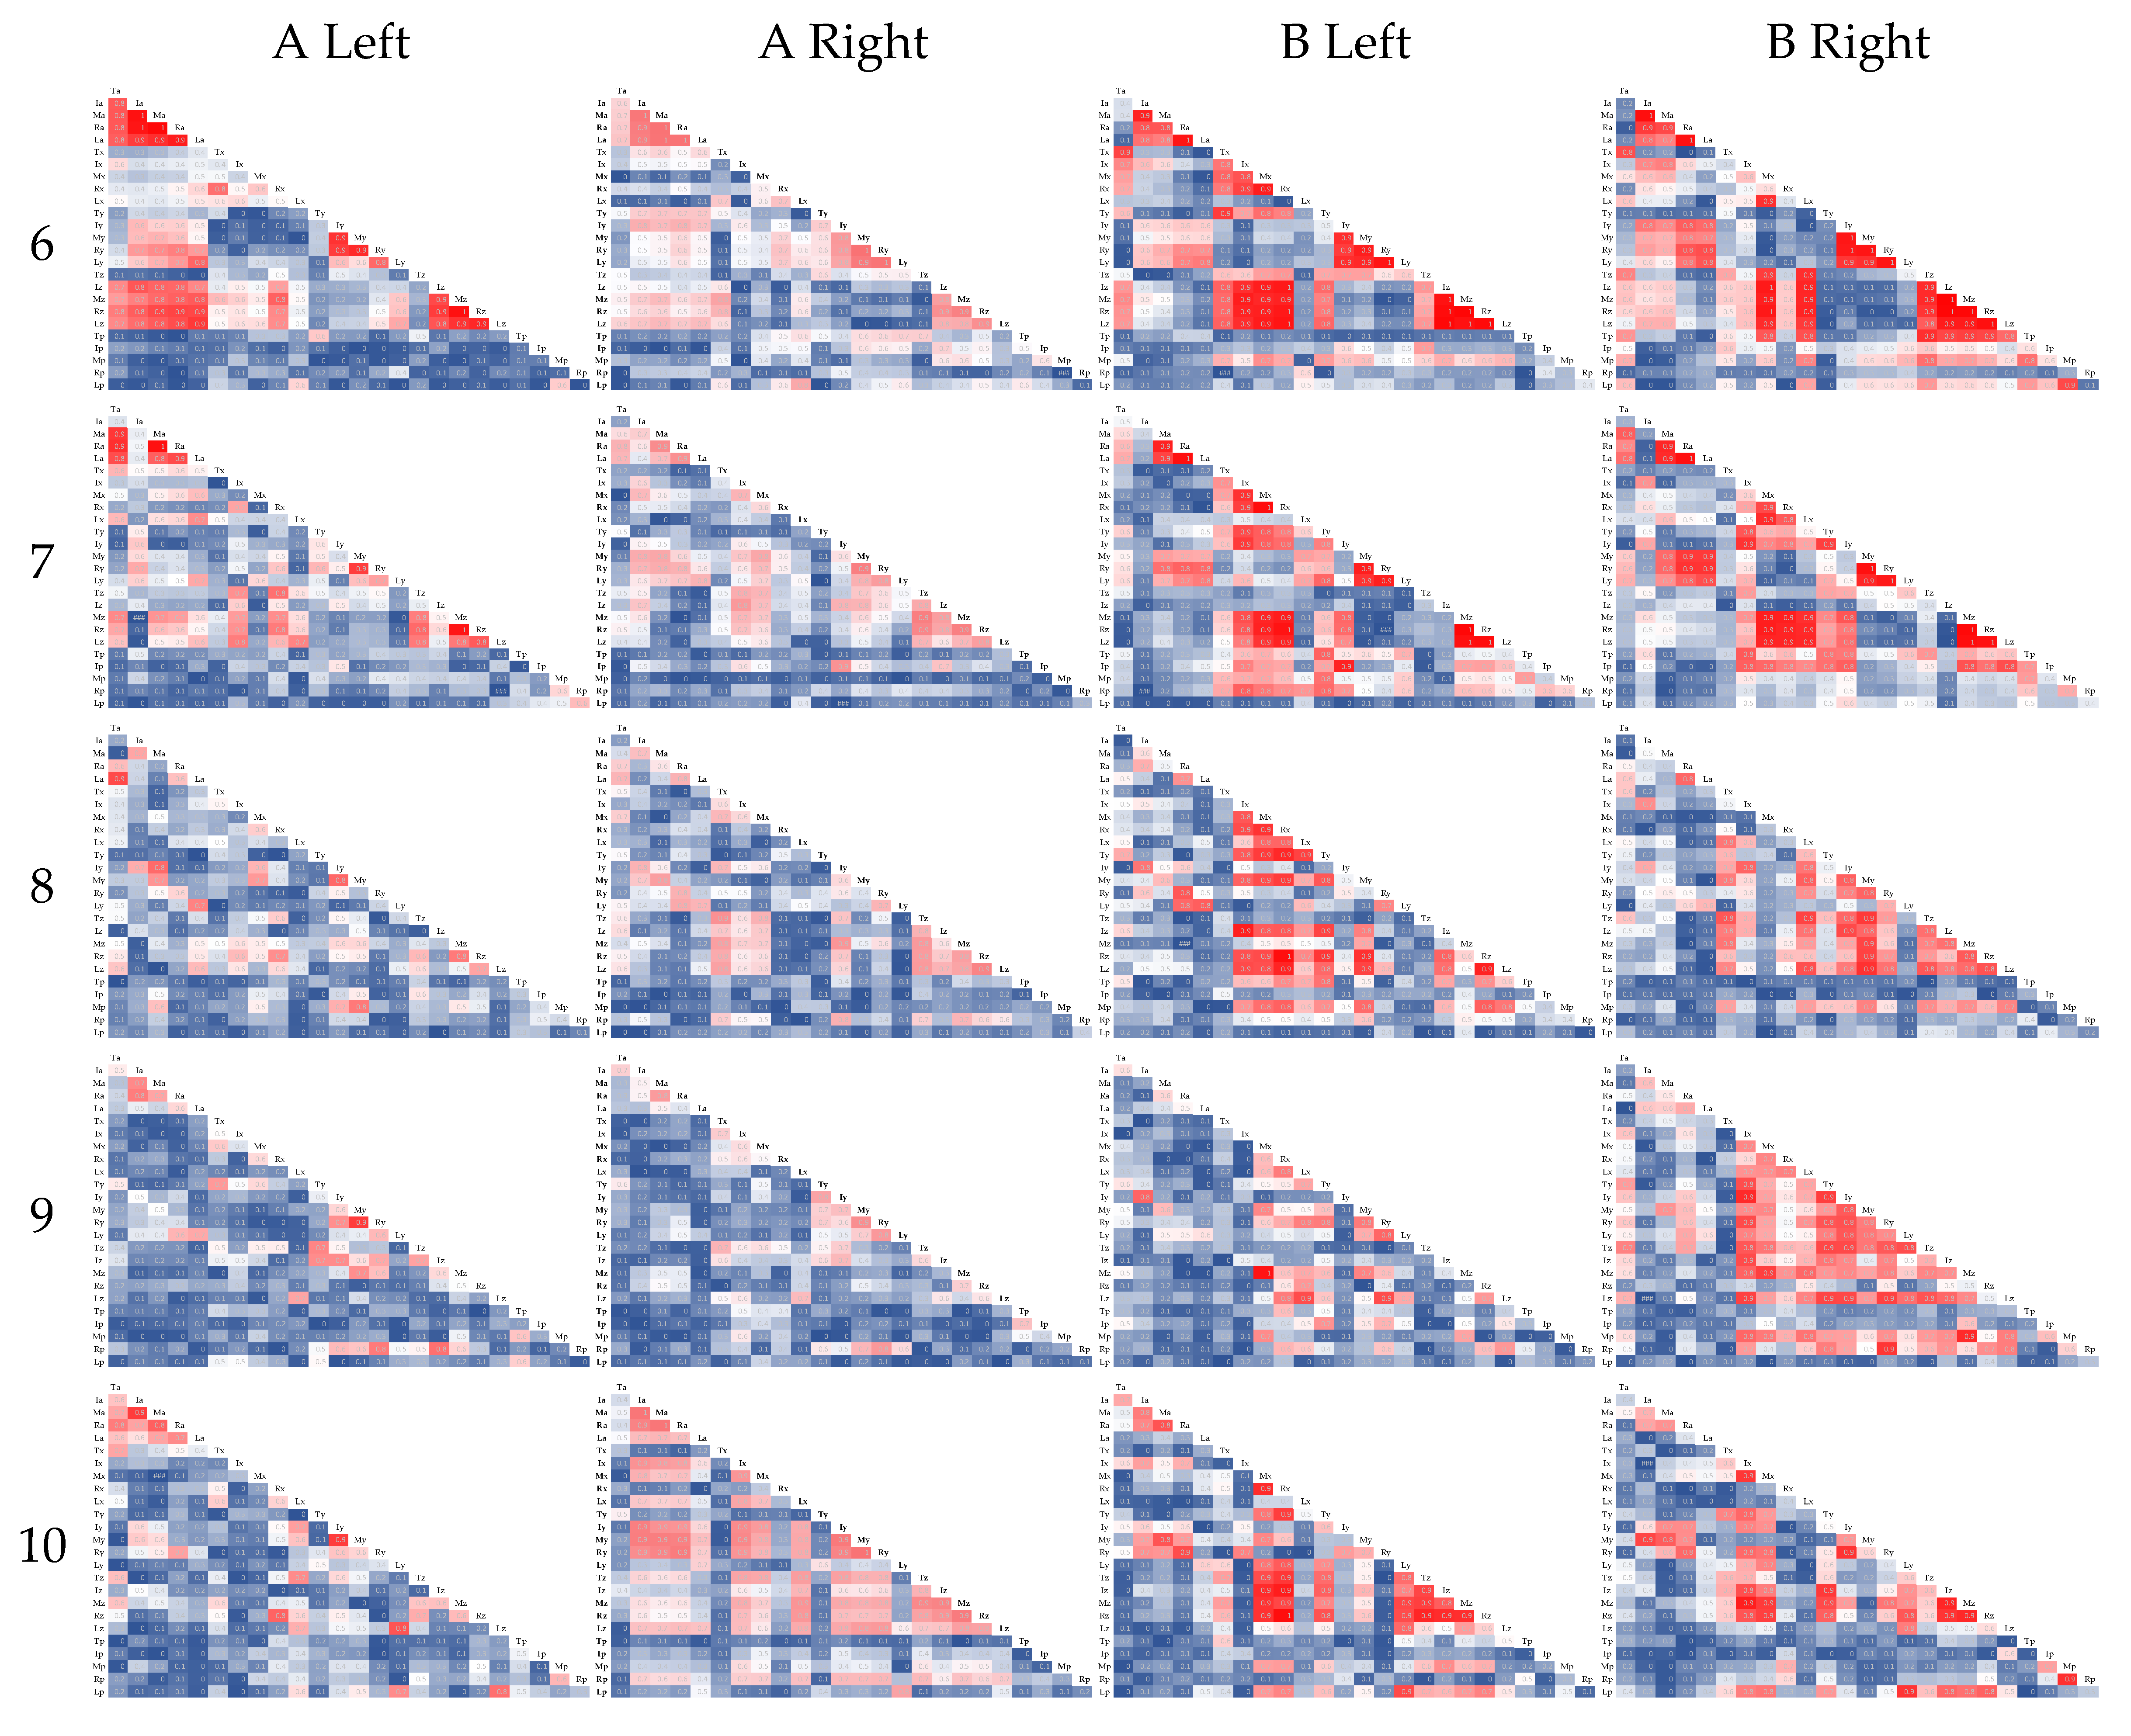
3.4. Correlation of Each Finger
4. Discussion
4.1. Data Variation
4.2. Number of Times to Grip and Release
4.3. Frequency Characteristics
4.4. Correlation of Each Finger
5. Limitations
6. Conclusions
Author Contributions
Funding
Institutional Review Board Statement
Informed Consent Statement
Data Availability Statement
Conflicts of Interest
References
- World Health Organization. World Health Statistics 2016: Monitoring Health for the SDGs Sustainable Development Goals; World Health Organization: Geneva, Switzerland, 2019; Volume 1, pp. 1–13. [Google Scholar]
- National Institute of Population and Social Security Research. Population Projections for Japan (2016–2065): Summary; Foreign Press Center Japan: Tokyo, Japan, 2017; pp. 1–60. [Google Scholar]
- World Health Organization. World Health Statistics 2020—Monitoring Health for the SDGs, Sustainable Development Goals; World Health Organization: Geneva, Switzerland, 2020; ISBN 9789240005105. [Google Scholar]
- Snoek, G.J.; Ijzerman, M.J.; Hermens, H.J.; Maxwell, D.; Biering-Sorensen, F. Survey of the needs of patients with spinal cord injury: Impact and priority for improvement in hand function in tetraplegics. Spinal Cord 2004, 42, 526–532. [Google Scholar] [CrossRef]
- Anzarut, A.; Chen, M.; Shankowsky, H.; Tredget, E.E. Quality-of-life and outcome predictors following massive burn injury. Plast. Reconstr. Surg. 2005, 116, 791–797. [Google Scholar] [CrossRef]
- Sayer, A.A.; Syddall, H.E.; Martin, H.J.; Dennison, E.M.; Roberts, H.C.; Cooper, C. Is grip strength associated with health-related quality of life? Findings from the Hertfordshire Cohort Study. Age Ageing 2006, 35, 409–415. [Google Scholar] [CrossRef] [Green Version]
- Gopinath, B.; Kifley, A.; Liew, G.; Mitchell, P. Handgrip strength and its association with functional independence, depressive symptoms and quality of life in older adults. Maturitas 2017, 106, 92–94. [Google Scholar] [CrossRef] [Green Version]
- Ekstrand, E.; Rylander, L.; Lexell, J.; Brogårdh, C. Perceived ability to perform daily hand activities after stroke and associated factors: A cross-sectional study. BMC Neurol. 2016, 16, 208. [Google Scholar] [CrossRef] [Green Version]
- Mahoney, F.I.; Barthel, D.W. Functional evaluation: The barthel index. Md. State Med. J. 1965, 14, 61–65. [Google Scholar] [PubMed]
- Ott, B.R.; Ellias, S.A.; Lannon, M.C. Quantitative assessment of movement in Alzheimer’s disease. J. Geriatr. Psychiatry Neurol. 1995, 8, 71–75. [Google Scholar] [PubMed]
- Massman, P.J.; Doody, R.S. Hemispheric asymmetry in Alzheimer’s disease is apparent in motor functioning. J. Clin. Exp. Neuropsychol. 1996, 18, 110–121. [Google Scholar] [CrossRef] [PubMed]
- Mcgrath, R.; Robinson-Lane, S.G.; Cook, S.; Clark, B.C.; Herrmann, S.; O’connor, M.L.; Hackney, K.J. Handgrip Strength Is Associated with Poorer Cognitive Functioning in Aging Americans. J. Alzheimer’s Dis. 2019, 70, 1187–1196. [Google Scholar] [CrossRef] [PubMed]
- Hatabe, Y.; Shibata, M.; Ohara, T.; Oishi, E.; Yoshida, D.; Honda, T.; Hata, J.; Kanba, S.; Kitazono, T.; Ninomiya, T. Decline in handgrip strength from midlife to late-life is associated with dementia in a Japanese community: The Hisayama study. J. Epidemiol. 2020, 30, 15–23. [Google Scholar] [CrossRef] [Green Version]
- Mainous, A.G.; Tanner, R.J.; Anton, S.D.; Jo, A. Low grip strength and prediabetes In normal-weight adults. J. Am. Board Fam. Med. 2016, 29, 280–282. [Google Scholar] [CrossRef] [PubMed] [Green Version]
- Ekstrand, E.; Lexell, J.; Brogårdh, C. Grip strength is a representative measure of muscle weakness in the upper extremity after stroke. Top. Stroke Rehabil. 2016, 23, 400–405. [Google Scholar] [CrossRef] [PubMed]
- Rantanen, T.; Guralnik, J.M.; Foley, D.; Masaki, K.; Leveille, S.; Curb, J.D.; White, L. Midlife hand grip strength as a predictor of old age disability. J. Am. Med. Assoc. 1999, 281, 558–560. [Google Scholar] [CrossRef] [PubMed] [Green Version]
- Villafañe, J.H.; Valdes, K.; Bertozzi, L.; Negrini, S. Minimal clinically important difference of grip and pinch strength in women with thumb carpometacarpal osteoarthritis when compared to healthy subjects. Rehabil. Nurs. 2017, 42, 139–145. [Google Scholar] [CrossRef] [PubMed]
- Lu, S.C.; Xiu, K.; Li, K.; Marquardt, T.L.; Evans, P.J.; Li, Z.M. Effects of Carpal Tunnel Syndrome on Force Coordination and Muscle Coherence during Precision Pinch. J. Med. Biol. Eng. 2017, 37, 328–335. [Google Scholar] [CrossRef] [PubMed]
- Cole, T.S.; Almefty, K.K.; Godzik, J.; Muma, A.H.; Hlubek, R.J.; Martinez-Del-Campo, E.; Theodore, N.; Kakarla, U.K.; Turner, J.D. Functional improvement in hand strength and dexterity after surgical treatment of cervical spondylotic myelopathy: A prospective quantitative study. J. Neurosurg. Spine 2020, 32, 907–913. [Google Scholar] [CrossRef]
- Mathiowetz, V.; Volland, G.; Kashman, N.; Weber, K. Adult norms for the Box and Block Test of manual dexterity. Am. J. Occup. Ther. 1985, 39, 386–391. [Google Scholar] [CrossRef] [PubMed] [Green Version]
- Tiffin, J.; Asher, E.J. The Purdue Pegboard: Norms and studies of reliability and validity. J. Appl. Psychol. 1948, 32, 234–247. [Google Scholar] [CrossRef]
- Ono, K.; Ebara, S.; Fuji, T.; Yonenobu, K.; Fujiwara, K.; Yamashita, K. Myelopathy hand. New clinical signs of cervical cord damage. J. Bone Jt. Surg. Ser. B 1987, 69, 215–219. [Google Scholar] [CrossRef] [Green Version]
- Shapiro, M.; Johnston, D.; Wald, J.; Mon, D. Patient-Generated Health Data—White Paper; RTI International: Research Triangle Park, NC, USA, 2012; pp. 1–35. [Google Scholar]
- Lai, A.M.; Hsueh, P.Y.S.; Choi, Y.K.; Austin, R.R. Present and Future Trends in Consumer Health Informatics and Patient-Generated Health Data. Yearb. Med. Inform. 2017, 26, 152–159. [Google Scholar] [CrossRef]
- Demiris, G.; Iribarren, S.J.; Sward, K.; Lee, S.; Yang, R. Patient generated health data use in clinical practice: A systematic review. Nurs. Outlook 2019, 67, 311–330. [Google Scholar] [CrossRef] [PubMed]
- Connolly, J.; Condell, J.; O’Flynn, B.; Sanchez, J.T.; Gardiner, P. IMU Sensor-Based Electronic Goniometric Glove for Clinical Finger Movement Analysis. IEEE Sens. J. 2018, 18, 1273–1281. [Google Scholar] [CrossRef]
- Dai, H.; Lin, H.; Lueth, T.C. Quantitative assessment of parkinsonian bradykinesia based on an inertial measurement unit. Biomed. Eng. Online 2015, 14, 68. [Google Scholar] [CrossRef] [PubMed] [Green Version]
- Bobić, V.; Djurić-Jovičić, M.; Dragašević, N.; Popović, M.B.; Kostić, V.S.; Kvaščev, G. An expert system for quantification of bradykinesia based on wearable inertial sensors. Sensors 2019, 19, 2644. [Google Scholar] [CrossRef] [Green Version]
- Park, J.; Heo, P.; Kim, J.; Na, Y. A finger grip force sensor with an open-pad structure for glove-type assistive devices. Sensors 2020, 20, 4. [Google Scholar] [CrossRef] [Green Version]
- Simone, L.K.; Kamper, D.G. Design considerations for a wearable monitor to measure finger posture. J. Neuroeng. Rehabil. 2005, 2, 5. [Google Scholar] [CrossRef] [PubMed] [Green Version]
- Valè, N.; Gandolfi, M.; Mazzoleni, S.; Battini, E.; Dimitrova, E.K.; Gajofatto, A.; Ferraro, F.; Castelli, M.; Camin, M.; Filippetti, M.; et al. Characterization of Upper Limb Impairments at Body Function, Activity, and Participation in Persons with Multiple Sclerosis by Behavioral and EMG Assessment: A Cross-Sectional Study. Front. Neurol. 2020, 10, 1395. [Google Scholar] [CrossRef] [Green Version]
- Rowson, J.; Yoxall, A.; Gonzalez, V. Differences in EMG burst patterns during grasping dexterity tests and activities of daily living. Front. Bioeng. Biotechnol. 2018, 6, 6. [Google Scholar] [CrossRef] [PubMed]
- Yap, H.K.; Kamaldin, N.; Lim, J.H.; Nasrallah, F.A.; Goh, J.C.H.; Yeow, C.H. A Magnetic Resonance Compatible Soft Wearable Robotic Glove for Hand Rehabilitation and Brain Imaging. IEEE Trans. Neural Syst. Rehabil. Eng. 2017, 25, 782–793. [Google Scholar] [CrossRef] [PubMed]
- Nagamune, K.; Uozumi, Y.; Sakai, Y. Automation of the simple test for evaluating hand function using leap motion controller. In Proceedings of the Lecture Notes in Computer Science (Including Subseries Lecture Notes in Artificial Intelligence and Lecture Notes in Bioinformatics); Springer: Cham, Switzerland, 2016; Volume 9738, pp. 312–319. [Google Scholar]
- Weiss Cohen, M.; Regazzoni, D. Hand rehabilitation assessment system using leap motion controller. AI Soc. 2020, 35, 581–594. [Google Scholar] [CrossRef]
- Oña, E.D.; Jardón, A.; Cuesta-Gómez, A.; Sánchez-Herrera-baeza, P.; Cano-De-la-cuerda, R.; Balaguer, C. Validity of a fully-immersive VR-based version of the box and blocks test for upper limb function assessment in Parkinson’s disease. Sensors 2020, 20, 2773. [Google Scholar] [CrossRef]
- Carpinella, I.; Jonsdottir, J.; Ferrarin, M. Multi-finger coordination in healthy subjects and stroke patients: A mathematical modelling approach. J. Neuroeng. Rehabil. 2011, 8, 19. [Google Scholar] [CrossRef] [Green Version]
- Valevicius, A.M.; Boser, Q.A.; Lavoie, E.B.; Murgatroyd, G.S.; Pilarski, P.M.; Chapman, C.S.; Vette, A.H.; Hebert, J.S. Characterization of normative hand movements during two functional upper limb tasks. PLoS ONE 2018, 13, e0199549. [Google Scholar] [CrossRef]
- Nishi, T.; Fukudome, K.; Hata, K.; Kawaida, Y.; Yone, K. Effectiveness of simple tracing test as an objective evaluation of hand dexterity. Sci. Rep. 2019, 9, 9915. [Google Scholar] [CrossRef] [PubMed]
- Shawen, N.; O’Brien, M.K.; Venkatesan, S.; Lonini, L.; Simuni, T.; Hamilton, J.L.; Ghaffari, R.; Rogers, J.A.; Jayaraman, A. Role of data measurement characteristics in the accurate detection of Parkinson’s disease symptoms using wearable sensors. J. Neuroeng. Rehabil. 2020, 17, 52. [Google Scholar] [CrossRef] [Green Version]
- Fang, Q.; Gu, X. A new hand function assessment method using an infrared imaging device. In Proceedings of the Annual International Conference of the IEEE Engineering in Medicine and Biology Society (EMBS), Jeju, Korea, 11–15 July 2017; pp. 1571–1574. [Google Scholar]
- Germanotta, M.; Gower, V.; Papadopoulou, D.; Cruciani, A.; Pecchioli, C.; Mosca, R.; Speranza, G.; Falsini, C.; Cecchi, F.; Vannetti, F.; et al. Reliability, validity and discriminant ability of a robotic device for finger training in patients with subacute stroke. J. Neuroeng. Rehabil. 2020, 17, 1. [Google Scholar] [CrossRef] [PubMed]
- Martin, J.A.; Ramsay, J.; Hughes, C.; Peters, D.M.; Edwards, M.G. Age and grip strength predict hand dexterity in adults. PLoS ONE 2015, 10, e0117598. [Google Scholar] [CrossRef] [PubMed] [Green Version]
- Térémetz, M.; Colle, F.; Hamdoun, S.; Maier, M.A.; Lindberg, P.G. A novel method for the quantification of key components of manual dexterity after stroke. J. Neuroeng. Rehabil. 2015, 12, 64. [Google Scholar] [CrossRef] [Green Version]
- Yukawa, Y.; Nakashima, H.; Ito, K.; Machino, M.; Kanbara, S.; Kato, F. Quantifiable tests for cervical myelopathy; 10-s grip and release test and 10-s step test: Standard values and aging variation from 1230 healthy volunteers. J. Orthop. Sci. 2013, 18, 509–513. [Google Scholar] [CrossRef]
- Machino, M.; Ando, K.; Kobayashi, K.; Morozumi, M.; Tanaka, S.; Ito, K.; Kato, F.; Ishiguro, N.; Imagama, S. Cut off value in each gender and decade of 10-s grip and release and 10-s step test: A comparative study between 454 patients with cervical spondylotic myelopathy and 818 healthy subjects. Clin. Neurol. Neurosurg. 2019, 184, 105414. [Google Scholar] [CrossRef]
- Yonenobu, K.; Abumi, K.; Nagata, K.; Taketomi, E.; Ueyama, K. Interobserver and intraobserver reliability of the Japanese Orthopaedic Association scoring system for evaluation of cervical compression myelopathy. Spine 2001, 26, 1890–1895. [Google Scholar] [CrossRef] [PubMed]
- Hosono, N.; Sakaura, H.; Mukai, Y.; Kaito, T.; Makino, T.; Yoshikawa, H. A simple performance test for quantifying the severity of cervical myelopathy. J. Bone Jt. Surg. Ser. B 2008, 90, 1210–1213. [Google Scholar] [CrossRef] [PubMed] [Green Version]
- Hosono, N.; Makino, T.; Sakaura, H.; Mukai, Y.; Fuji, T.; Yoshikawa, H. Myelopathy hand: New evidence of the classical sign. Spine 2010, 35, E273–E277. [Google Scholar] [CrossRef]
- Alagha, M.A.; Alagha, M.A.; Dunstan, E.; Sperwer, O.; Timmins, K.A.; Boszczyk, B.M. Development of a new assessment tool for cervical myelopathy using hand-tracking sensor: Part 1: Validity and reliability. Eur. Spine J. 2017, 26, 1291–1297. [Google Scholar] [CrossRef]
- Alagha, M.A.; Alagha, M.A.; Dunstan, E.; Sperwer, O.; Timmins, K.A.; Boszczyk, B.M. Development of a new assessment tool for cervical myelopathy using hand-tracking sensor: Part 2: Normative values. Eur. Spine J. 2017, 26, 1298–1304. [Google Scholar] [CrossRef] [PubMed]
- Watanabe, M.; Sugiura, Y.; Saito, H.; Koyama, T.; Fujita, K. Detection of cervical myelopathy with Leap Motion Sensor by random forests. In Proceedings of the LifeTech 2020—2020 IEEE 2nd Global Conference on Life Sciences and Technologies, Kyoto, Japan, 10–12 March 2020; pp. 214–216. [Google Scholar]
- HapLog. Available online: http://www.tecgihan.co.jp/products/tactile-sensibility-measurement/haplog/haplog/ (accessed on 20 November 2020).
- Thaker, N.G.; Ali, T.N.; Porter, M.E.; Feeley, T.W.; Kaplan, R.S.; Frank, S.J. Communicating value in health care using radar charts: A case study of prostate cancer. J. Oncol. Pract. 2016, 12, 813–820. [Google Scholar] [CrossRef]


| CSV File | |
|---|---|
| Header information | Version information, timestamp, and memo |
| Sensor information (for each sensor) | Position of a sensor in connector, name, unit of target data, number of data, and the maximum value and minimum value |
| Measurement data | Time, finger contact force, absolute acceleration, raw contact-force data (με), x-axis acceleration, y-axis acceleration, z-axis acceleration, and mark |
| Label | |
|---|---|
| Finger | T (thumb), I (index finger), M (middle finger), R (ring finger), and L (little finger) |
| Item | a (Absolute Acceleration), x (x-axis acceleration), y (y-axis acceleration), and z (z-axis acceleration) p (raw contact-force data) |
| Significant Difference (p < 0.05) | |
|---|---|
| left–right | Subject A: Mx, Rx, Ry, Rz, La, Lx Subject B: Ix, Mp, Rx, Lp |
| subject A–subject B | Right: Tp, Iz, Ip, Mx, Mp, Rx, Lz, Lp Left: Tz, Tp, Ix, Iz, Ip, Mx, Rx, Rz, Rp, |
| Combination | Accuracy | Conditions with Different Number of Grip and Release: Subjects, Hands, and Conditions Performed (Error) |
|---|---|---|
| TyMzRzRpLp | 80.0% | ARight9(−6), ALeft2(3), ALeft8(1), ALeft9(−1), ALeft10(−2) BLeft 2(2), BLeft 5(−4), BLeft 8(−1) |
| MzMpLp | 80.0% | ARight6(1), ARight9(−9), ALeft1(−1), ALeft9(-2), ALeft10(−1) BRight 5(−8), BRight 8(3), BLeft5(−3) |
| Mz | 75.0% | ARight4(1), ARight5(−1), ARight6(1), ARight9(−9), ALeft1(−1), ALeft10(−1) BRight2(−2), BRight5(−8), BRight8(2), BLeft5(−4) |
Publisher’s Note: MDPI stays neutral with regard to jurisdictional claims in published maps and institutional affiliations. |
© 2021 by the authors. Licensee MDPI, Basel, Switzerland. This article is an open access article distributed under the terms and conditions of the Creative Commons Attribution (CC BY) license (http://creativecommons.org/licenses/by/4.0/).
Share and Cite
Oigawa, H.; Musha, Y.; Ishimine, Y.; Kinjo, S.; Takesue, Y.; Negoro, H.; Umeda, T. Visualizing and Evaluating Finger Movement Using Combined Acceleration and Contact-Force Sensors: A Proof-of-Concept Study. Sensors 2021, 21, 1918. https://doi.org/10.3390/s21051918
Oigawa H, Musha Y, Ishimine Y, Kinjo S, Takesue Y, Negoro H, Umeda T. Visualizing and Evaluating Finger Movement Using Combined Acceleration and Contact-Force Sensors: A Proof-of-Concept Study. Sensors. 2021; 21(5):1918. https://doi.org/10.3390/s21051918
Chicago/Turabian StyleOigawa, Hitomi, Yoshiro Musha, Youhei Ishimine, Sumito Kinjo, Yuya Takesue, Hideyuki Negoro, and Tomohiro Umeda. 2021. "Visualizing and Evaluating Finger Movement Using Combined Acceleration and Contact-Force Sensors: A Proof-of-Concept Study" Sensors 21, no. 5: 1918. https://doi.org/10.3390/s21051918