
Evolutionary Algorithm for Improving Decision Tree with Global Discretization in Manufacturing

Department of Industrial and Systems Engineering, Dongguk University, Seoul 04620, Korea
Sensors 2021, 21(8), 2849; https://doi.org/10.3390/s21082849
Submission received: 16 March 2021
/
Revised: 13 April 2021
/
Accepted: 15 April 2021
/
Published: 18 April 2021
(This article belongs to the Special Issue Machine Learning Applied to Sensor Data Analysis)
Abstract
:Due to the recent advance in the industrial Internet of Things (IoT) in manufacturing, the vast amount of data from sensors has triggered the need for leveraging such big data for fault detection. In particular, interpretable machine learning techniques, such as tree-based algorithms, have drawn attention to the need to implement reliable manufacturing systems, and identify the root causes of faults. However, despite the high interpretability of decision trees, tree-based models make a trade-off between accuracy and interpretability. In order to improve the tree’s performance while maintaining its interpretability, an evolutionary algorithm for discretization of multiple attributes, called Decision tree Improved by Multiple sPLits with Evolutionary algorithm for Discretization (DIMPLED), is proposed. The experimental results with two real-world datasets from sensors showed that the decision tree improved by DIMPLED outperformed the performances of single-decision-tree models (C4.5 and CART) that are widely used in practice, and it proved competitive compared to the ensemble methods, which have multiple decision trees. Even though the ensemble methods could produce slightly better performances, the proposed DIMPLED has a more interpretable structure, while maintaining an appropriate performance level.
1. Introduction
Due to recent advances in Internet of Things (IoT), the connectivity between machines as well as the amount of data from sensors have been significantly increased. Depending on the need to leverage data properly, transparent and interpretable machine learning (ML) techniques are drawing particular attention amid growing interest in more reliable systems for a digital twin [1]. In particular, in fault detection of the manufacturing process (e.g., semiconductor manufacturing), interpretable ML models can provide insights into which attributes are the root causes for faults on the shop floor, so that human operators can improve the product quality [2].
However, even though various ML techniques having black-box structures (e.g., neural network) have been studied and developed for more accurate fault detection, many manufacturing companies suffer from the opaqueness of models, and costly human efforts to enhance the interpretability of detection accordingly [3]. In this context, the interpretability of ML models in manufacturing environments is growing in importance for two reasons. First, human operators want a set of understandable rules to control parameters in the manufacturing process. In addition, ML models with interpretability enable practitioners to explain the factors that have affected the ups and downs of process quality based on past production data [4].
Despite the fact that there is a significant need for interpretability, one of the most widely used interpretable models, decision-tree-based algorithms, still present some issues. The first issue is the trade-off between accuracy and interpretability. In order to improve the accuracy for training data, the maximum tree height should be increased. However, as the tree becomes deeper, the interpretability of the model decreases, because of the more complicated structure. Therefore, interpretable models are preferably small in size, as well as of sufficient high-performance. In order to have high explanation complexity, there is a significant need for shrinkage methods for ML models [5]. For example, a decision tree of depth = 5 is easier to understand than one of depth = 50.
However, when limiting the tree height for interpretability, many decision-tree-based algorithms, such as classification and regression tree (CART) and C4.5, allow trees to have only binary splits for continuous attributes, and thus hinder the potential for improving the performance of the decision trees within the limited tree depth.
To deal with these issues, discretization techniques for multi-point splits (decision tree algorithms) have been proposed [6,7]. The discretization techniques enable the information obtained from datasets to be more concise, easy to understand, and easy to use [8]. Nonetheless, efficient discretization techniques considering dependencies among attributes while maintaining interpretability have been far less studied even though the dependencies are important in performance [9]. In particular, for a decision tree algorithm, discretization of all continuous attributes without consideration of those dependencies has been shown to result in decreased accuracy [10].
In order to construct interpretable and effective models for fault detection, there is a significant need for efficient discretization algorithms designed for decision trees while considering dependencies between continuous attributes. Therefore, this paper proposes a novel approach for retrieving an improved decision tree for fault detection in manufacturing. The proposed approach utilizes the evolutionary process with k-means clustering to find good solutions efficiently for global discretization. In addition, to maintain high interpretability, the proposed approach is designed to improve a decision tree under the limitation of the maximum tree depth.
This paper is organized as follows. In Section 2, the previous research related to interpretable ML and discretization techniques is reviewed. Section 3 proposes a new evolutionary algorithm for discretization of continuous attributes based on k-means clustering. Section 4 defines the two datasets for fault detection in manufacturing, and Section 5 summarizes the results of experiments verifying the algorithm. Finally, Section 6 draws conclusions, and discusses possible areas for further research.
2. Backgrounds
2.1. Fault Detection in Manufacturing
Accurate detection of faults in manufacturing has been highly involved in the development of prediction models using data collected by sensors on the shop floor. Especially, well-designed ML models for fault detection at an early process can prevent defectives in the downstream, and thus significantly reduce manufacturing costs [11]. However, due to the interactions between process variables in large-scale manufacturing processes (e.g., chemical plant, semiconductor factory), identification of the relationships between fault causes and their effects is complicated [12].
While ML algorithms, such as neural network (NN) and support vector machine (SVM), have demonstrated high accuracy on several datasets, there is a significant issue called the “black-box” nature of their decision-making and learning processes. Because the learning process of black-box algorithms is neither transparent nor understandable to human operators, high accuracy on a given dataset may be misreading without a deeper understanding of causes from machine-related sensor inputs [13]. Therefore, interpretable ML-based models that can identify and analyze the root causes of fault detection in manufacturing have drawn attention from researchers.
2.2. Interpretable Machine Learning
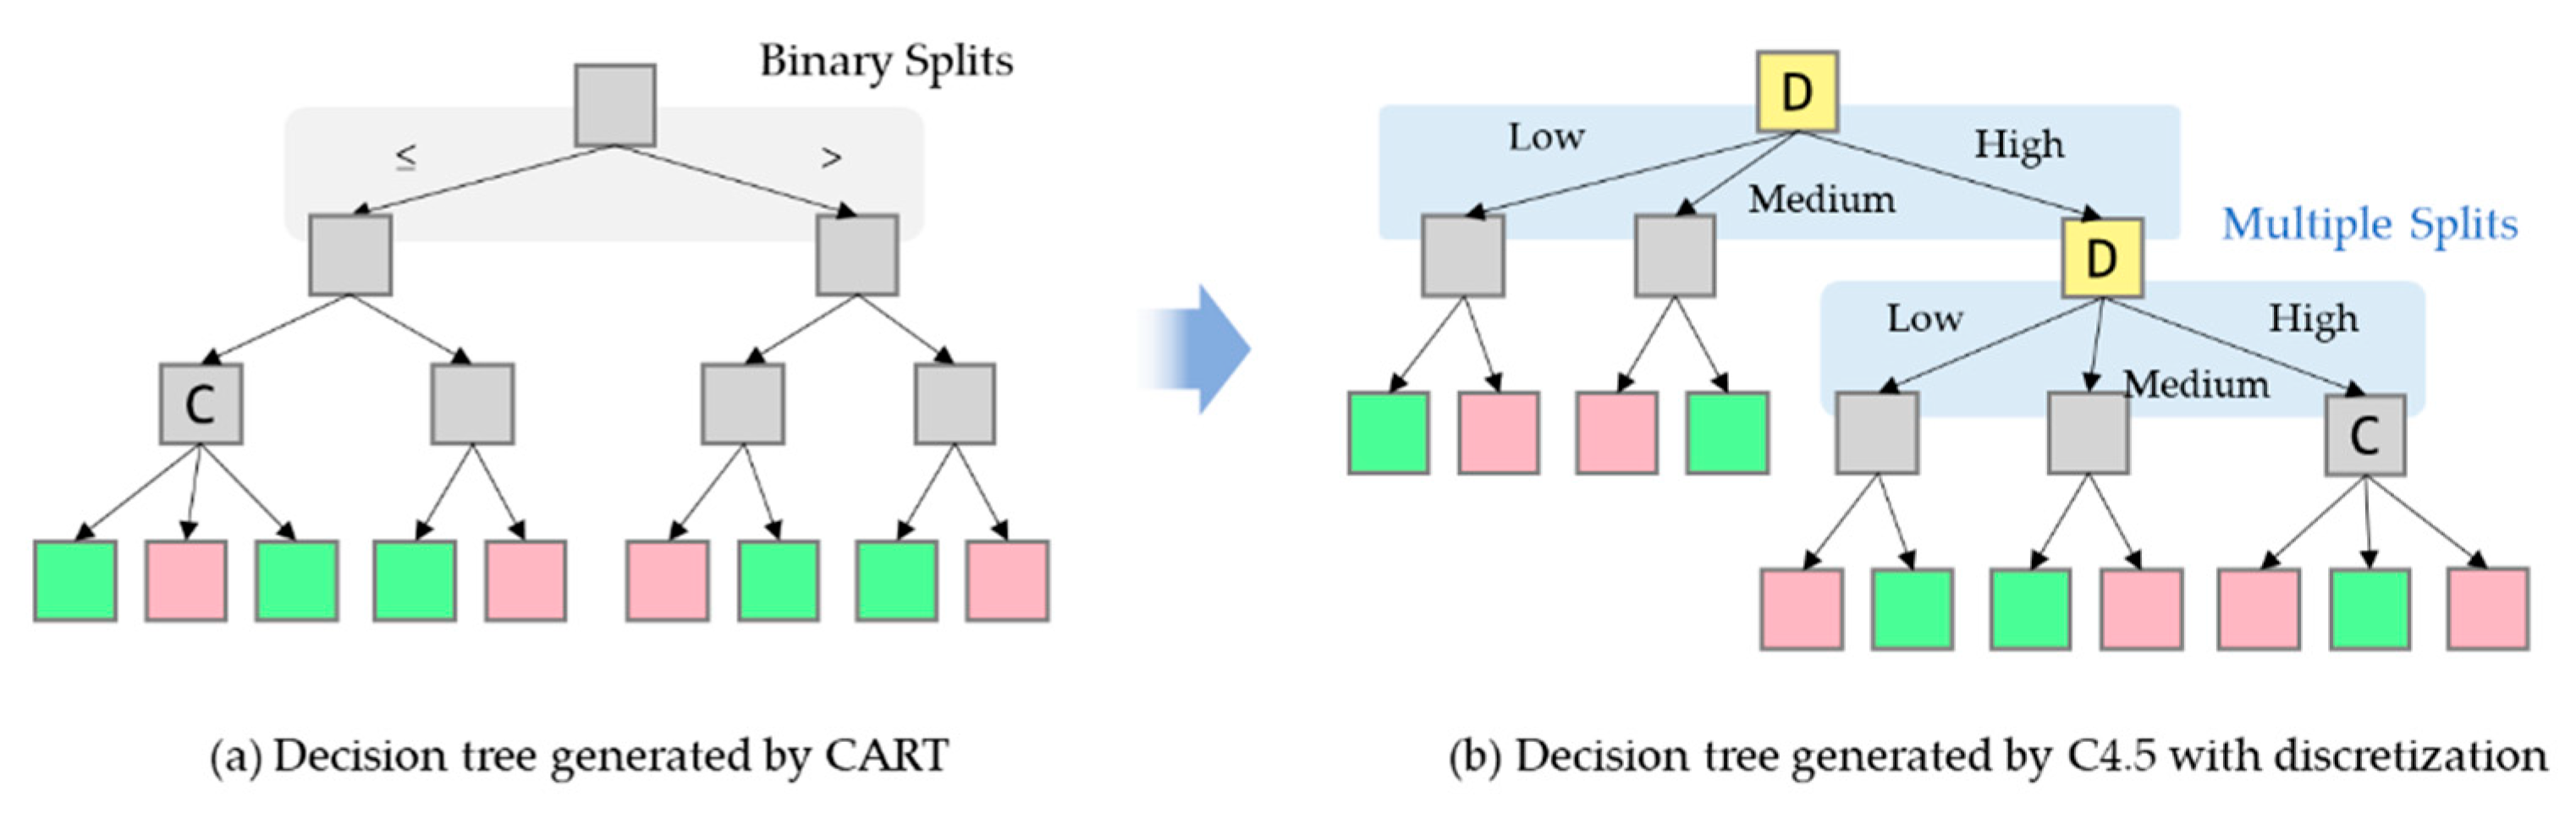
In order to deal with the black-box issue, interpretable ML models that are able to produce insights about their decisions have been investigated [14]. Among ML algorithms, decision-tree-based algorithms, such as ID3 (Iterative Dichotomiser 3) and C4.5 proposed by Quinlan [15,16], have been widely studied, due to their comprehensible nature that resembles the human reasoning process [17]. ID3 builds a decision tree for the given data in a top-down fashion and one categorical attribute is tested at each node. C4.5 is the successor to ID3 and it relaxes the restriction of ID3 that all attributes must be categorical. In addition, CART algorithm proposed by Reference [18] can address the classification and regression problems by creating a decision tree with binary splits of the continuous attributes as shown in Figure 1a. Compared to CART, C4.5 have an advantage of handling both continuous and discrete attributes [19]. These single-tree-based algorithms are easy to understand, and the trees can be easily converted to a set of rules. However, in spite of the high interpretability, the algorithms also have some limitations, such as overfitting, low performance, and binary splits on continuous attributes [20].
In order to overcome the limitations, various ensemble methods have been proposed and broadly investigated. Ensemble methods are simple and powerful techniques that aggregate predictions of some weak learners (such as decision trees) to provide more accurate estimation, instead of finding a single sophisticated learner [21]. For example, random forest introduced by Reference [22] generates many decision trees and aggregates their result. Especially, random forest has been shown to outperform other learners for problems with high-dimensional data.
In addition, boosting is a technique of combining a set of weak classifiers into one strong classifier for high-performance prediction, and has been a very successful technique for solving the two-class classification problem. The first practical boosting algorithm, called AdaBoost, was proposed by Reference [23]. Because of its capability of generalization, fast performance, and low implementation complexity, boosting has become one of the most popular and effective classification tools [24]. The gradient boosting model proposed by Reference [25] is another widely used ensemble method for classification and regression problems. The gradient boosting algorithms use decision or regression trees as weak classifiers, and measure the error observed in each node and split node using a test function. Gradient boosting is similar to random forest in terms of combination of week tree leaners, but the tree in gradient boosting is fit on the residual of the former trees so that it can minimize the biases while random forest reduces variances [26].
On the other hand, due to the complicated structure of ensemble methods with multiple trees, their power of interpretability is weaker than algorithms with a single decision tree. However, even though decision-tree-based algorithms have better interpretability over other ML techniques, they still have limitations such as overfitting [27]. For example, if the training dataset is not large enough or includes some noise, the algorithms try to fit every single instance in the training set. As a result, the size of decision tree is relatively larger with meaningless branches and the overfitting problem leads to low interpretability. Thus, in order to have interpretability as well as high performance, shrinkage methods for ML models, such as discretization, are worthy for further research as a desirable property for interpretable models [28,29].
2.3. Discretization
Discretization, as one of the basic reduction techniques, has received attention because it helps decision trees to yield more compact, shorter, and more accurate results than the ones derived using numerical values [30]. Moreover, discretized attributes are easier to comprehend, employ, and describe for researchers [31].
Assume a classification problem with C target classes with a set of N instances and M attributes. A learning set consists of N instances. Each instance is described by M attributes , and labeled by a class . A discretization algorithm partitions a continuous attribute into discrete and disjoint intervals as shown below:
where and are the minimum and maximum values of , respectively [32]. Finally, denotes the complete set of cut points for each continuous attribute in M. The goal of discretization algorithms is to find the best for the target attribute .
There are three different categories where discretization methods can be classified: global vs. local, supervised vs. unsupervised, and static vs. dynamic [33]. Local methods generate partitions that are applied to localized regions of the instance space while global methods, such as binning, independently produce a mesh over the entire n-dimensional continuous instance space. The mesh contains regions, where is the number of partitions of the th feature. Unsupervised discretization methods, such as equal width interval binning, do not use instance labels in the discretization process, while supervised discretization methods utilize the class labels. Static discretization methods perform determine the maximum number of intervals for each attribute independently, but dynamic methods conduct a search through the space of possible values for all attributes simultaneously to capture interdependencies.
2.4. Related Work
Discretization has been proven to improve the performance as well as the interpretability of ML models, especially for decision tree models. Especially, discretization of multiple attributes can be considered as an optimization problem, which finds the best with consideration of interdependencies between attributes. The previous literature related to multivariate discretization with interpretable ML models is summarized in Table 1.
Reference [34] noted that C4.5’s performance is weaker in domains with a preponderance of continuous attributes than for learning tasks that have mainly discrete attributes. In order to address the weakness, a penalty inspired by the Minimum Description Length (MDL) principle was applied and it produced smaller DTs with higher accuracies with multi-interval splits. The results also showed that global discretization may degrade performance more as datasets become larger. Reference [35] focused on identifying the best combination of feature selection and discretization with four discretization methods: equal frequency binning (EFB), equal width binning (EWB), MDL, and ChiMerge. In this research, C4.5 was used for feature selection while SVM was used as a classifier.
Recently, as the size of data increases, finding the optimal discretization strategy with cut points is becoming extremely complicated. In order to solve the optimization problem, evolutionary multivariate discretizers (EMDs) have been studied for the discretization problem. Reference [32] proposed an evolutionary algorithm for learning decision rules with multivariate discretization called EDRL-MD (Evolutionary Decision Rule Learner with Multivariate Discretization). EDRL-MD consists of two steps: the simultaneous search for threshold values for all continuous attributes and the discovery of decision rules. Reference [36] proposed an evolutionary algorithm to construct a global discretization scheme for all continuous attributes simultaneously. The proposed algorithm was able to improve the accuracy of DTs and generate much simpler model. Reference [37] proposed an evolutionary algorithm to select a subset of cut points for multivariate discretization based on a wrapper fitness function. The algorithm was compared with different discretizers with C4.5 and Naive Bayes. Reference [38] proposed an evolutionary approach, which obtains a set of discretization schemes guiding the search by using a discretization criterion and the prediction accuracy of Naive Bayes. In Reference [39], classification error and number of cut points are simultaneously reduced by using evolutionary multi-objective optimization.
In addition to improved accuracy, discretization is likely to enhance interpretability, especially in combination with decision tree models [40]. For example, when applying discretization in C4.5, this benefit is clear, even when the continuous attributes are simply partitioned into ‘low’, ‘medium’, or ‘high’ values as shown in Figure 1b. Moreover, discretization can significantly increase the efficiency of decision tree induction by reducing the required sorting step for continuous attributes at each branch [41].
However, although the above-mentioned studies have proposed various discretization approaches, in practice, two issues persist. The first issue is the computational complexity. As the number of sensors increases with the stream of industrial IoT in manufacturing, the search space for global discretization has become voluminous. Accordingly, when the number of instances and continuous attributes increases, the chromosome structure for searching all possible cutting points may not be appropriate.
Another issue is the lack of investigation on benefits of discretization under the limitation of the maximum tree depth. Although limiting the tree height for interpretability may affect the performance, the evolutionary approach for global discretization of a decision tree under the limitation of the maximum tree depth has been far less studied. Therefore, a new approach for learning interpretable models that are compact in size as well as sufficiently accurate is necessary to predict faults at the early stages and identify their root causes in an understandable form.
3. Proposed Approach
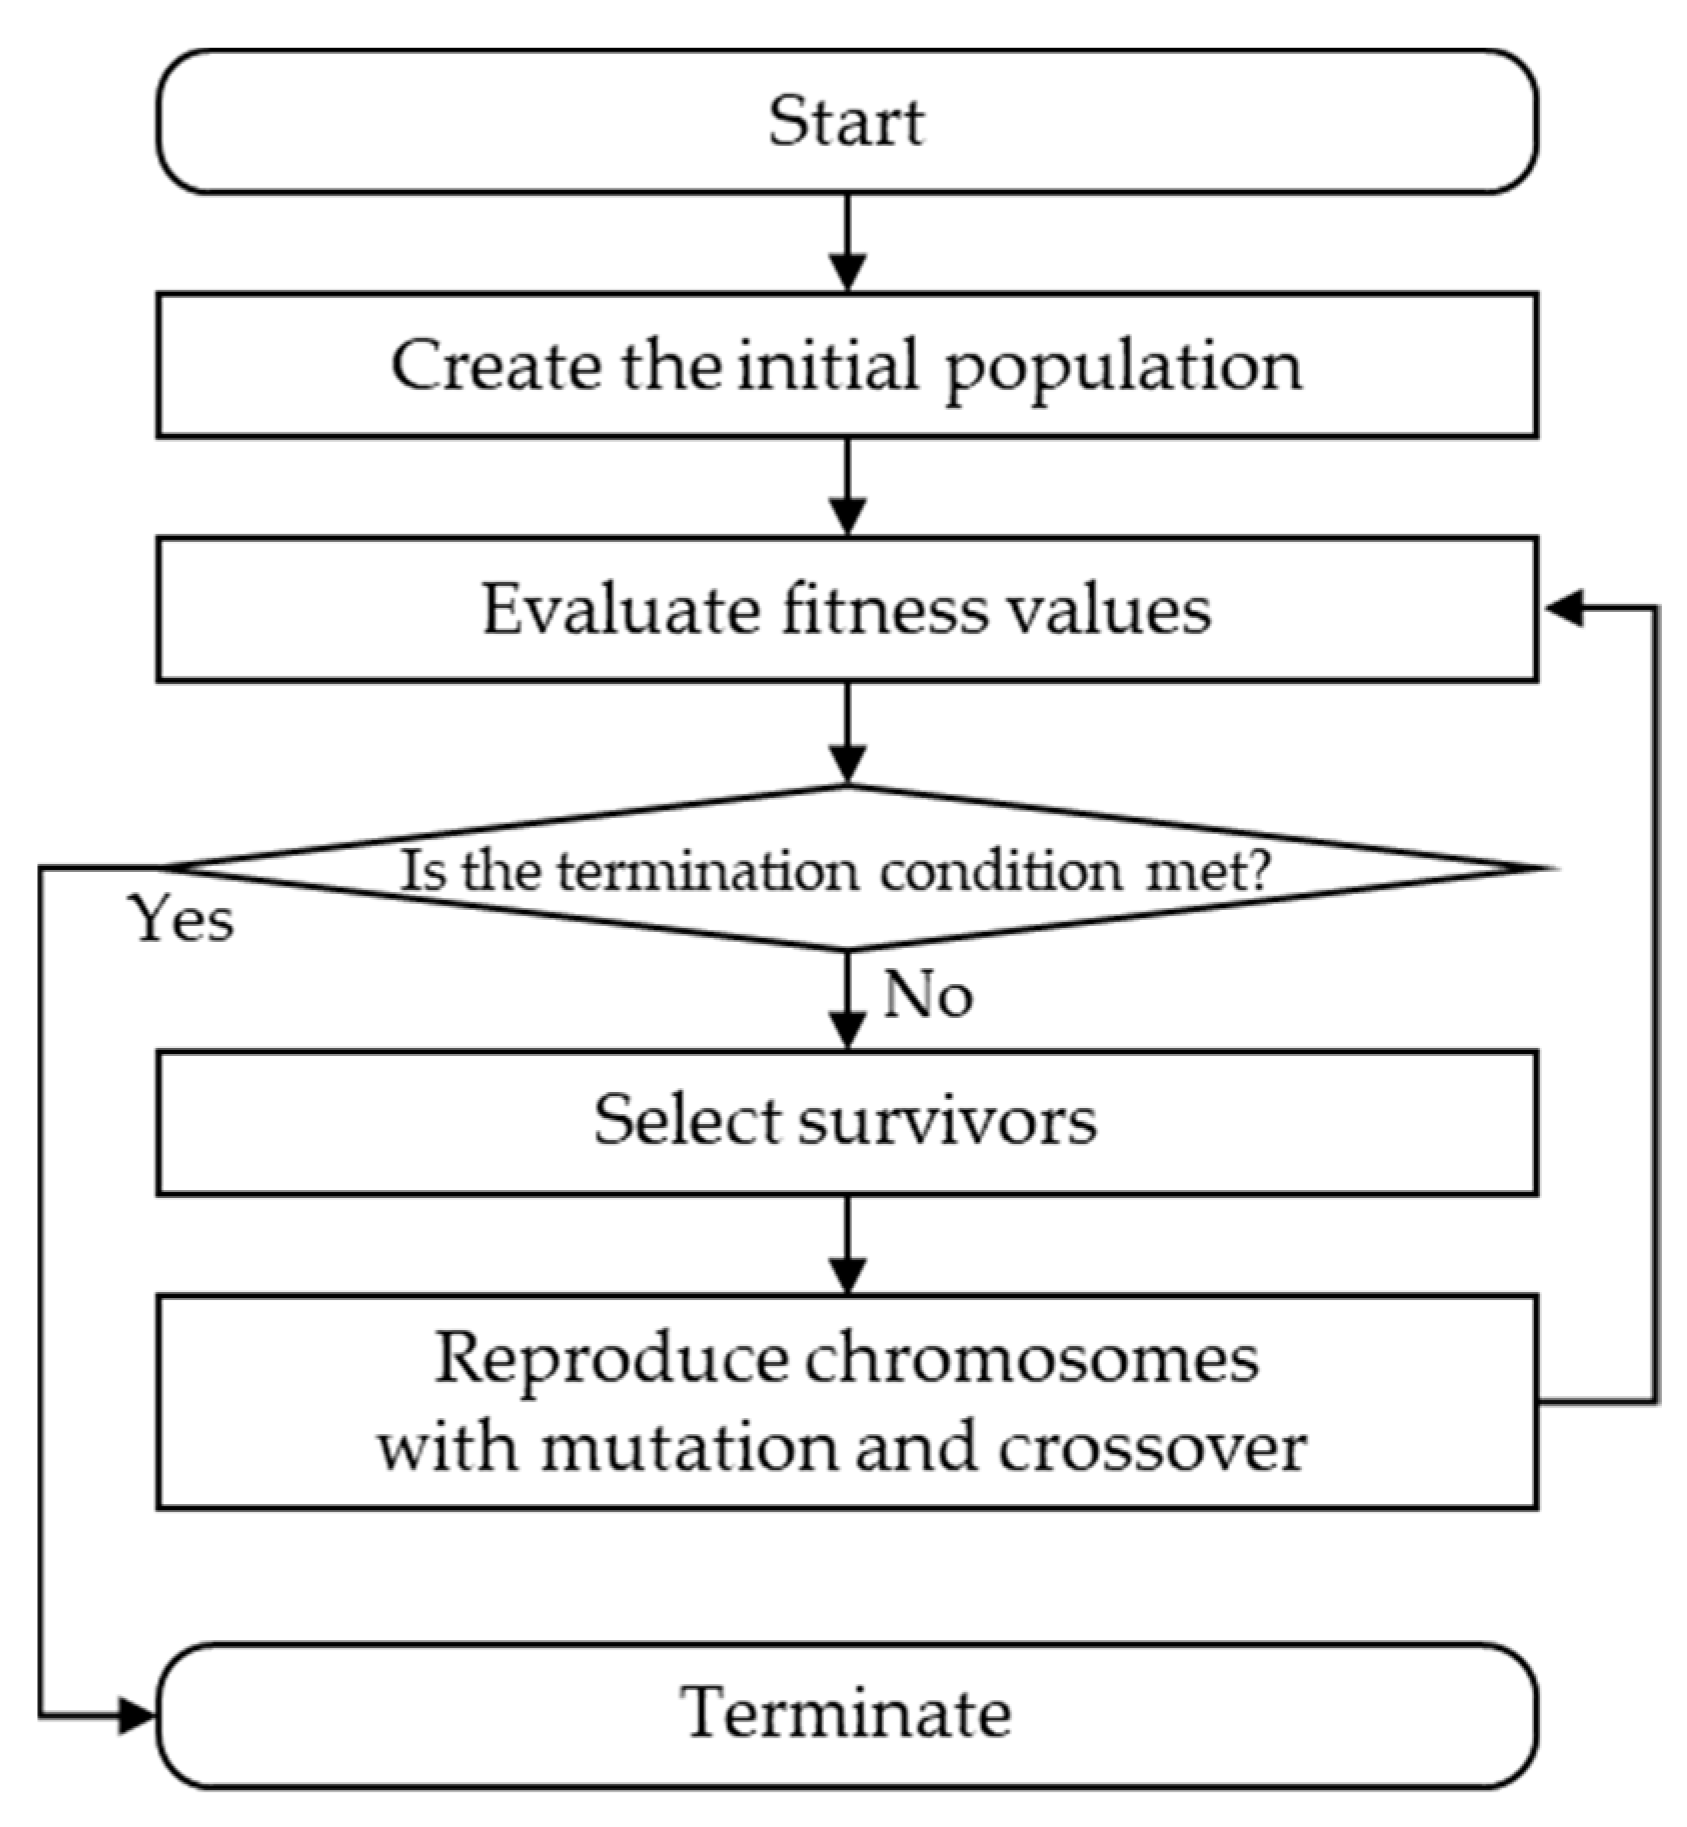
In this section, a novel evolutionary algorithm for global discretization called Decision tree Improved by Multiple sPLits with Evolutionary algorithm for Discretization (DIMPLED) is proposed. The proposed DIMPLED algorithm gradually improves the discretization strategy for better performance while maintaining the appropriate level of interpretability with a single decision tree. Also, in combination with k-means clustering for global discretization, DIMPLED allows a tree to have multiple splits that can be interpretable and meaningful for practitioners. The entire framework is first described, and then its detailed procedures are explained. The proposed DIMPLED framework can be summarized in Figure 2.
3.1. Chromosome Design
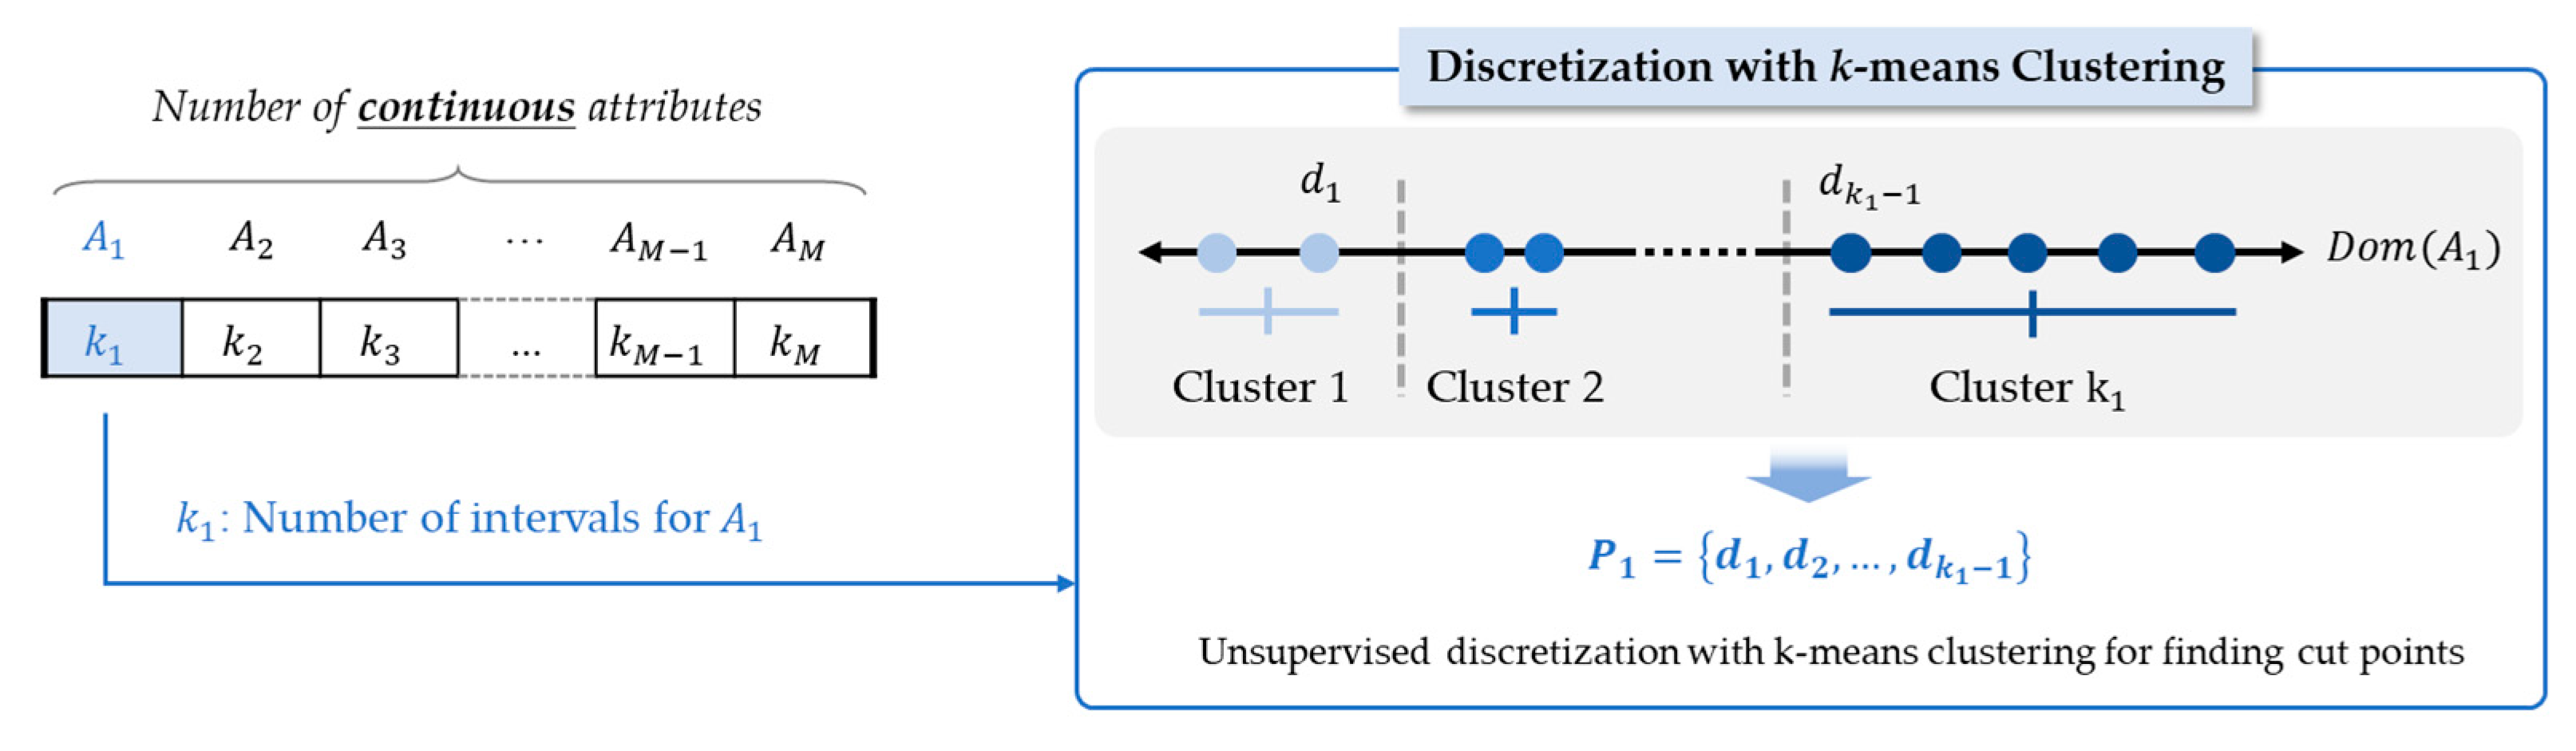
Each chromosome consists of a given number of genes as shown in Figure 3. The length of a chromosome represents the number of continuous attributes that can be discretized. Each gene stores a discretization strategy that partitions a continuous attribute into the number of discrete intervals , which is determined with consideration of the level of interpretability.
The initial population is generated by determining the number of classes for each continuous attribute randomly between 2 (not to be discretized, because binary split is the default) to the maximum number of intervals. The initial population with randomly generated chromosomes has been widely used in EMD, because it can cover the complete search space as much as possible and enhance the diversity as well [37,38,39]. For discretization of a continuous attribute with the given number of intervals in a chromosome, k-mean clustering algorithm partitions the values of continuous attributes into k clusters with the objective of making the clusters as separated as possible [42]. k-mean clustering has been used in unsupervised and global discretization to assist comprehension by grouping together multiple values of a continuous attribute [43]. In this study, the associated cost function is defined in terms of the distances between the cluster objects and the cluster center, and the objective is to find the best combination of intervals that maximizes the accuracy.
3.2. Reproduction
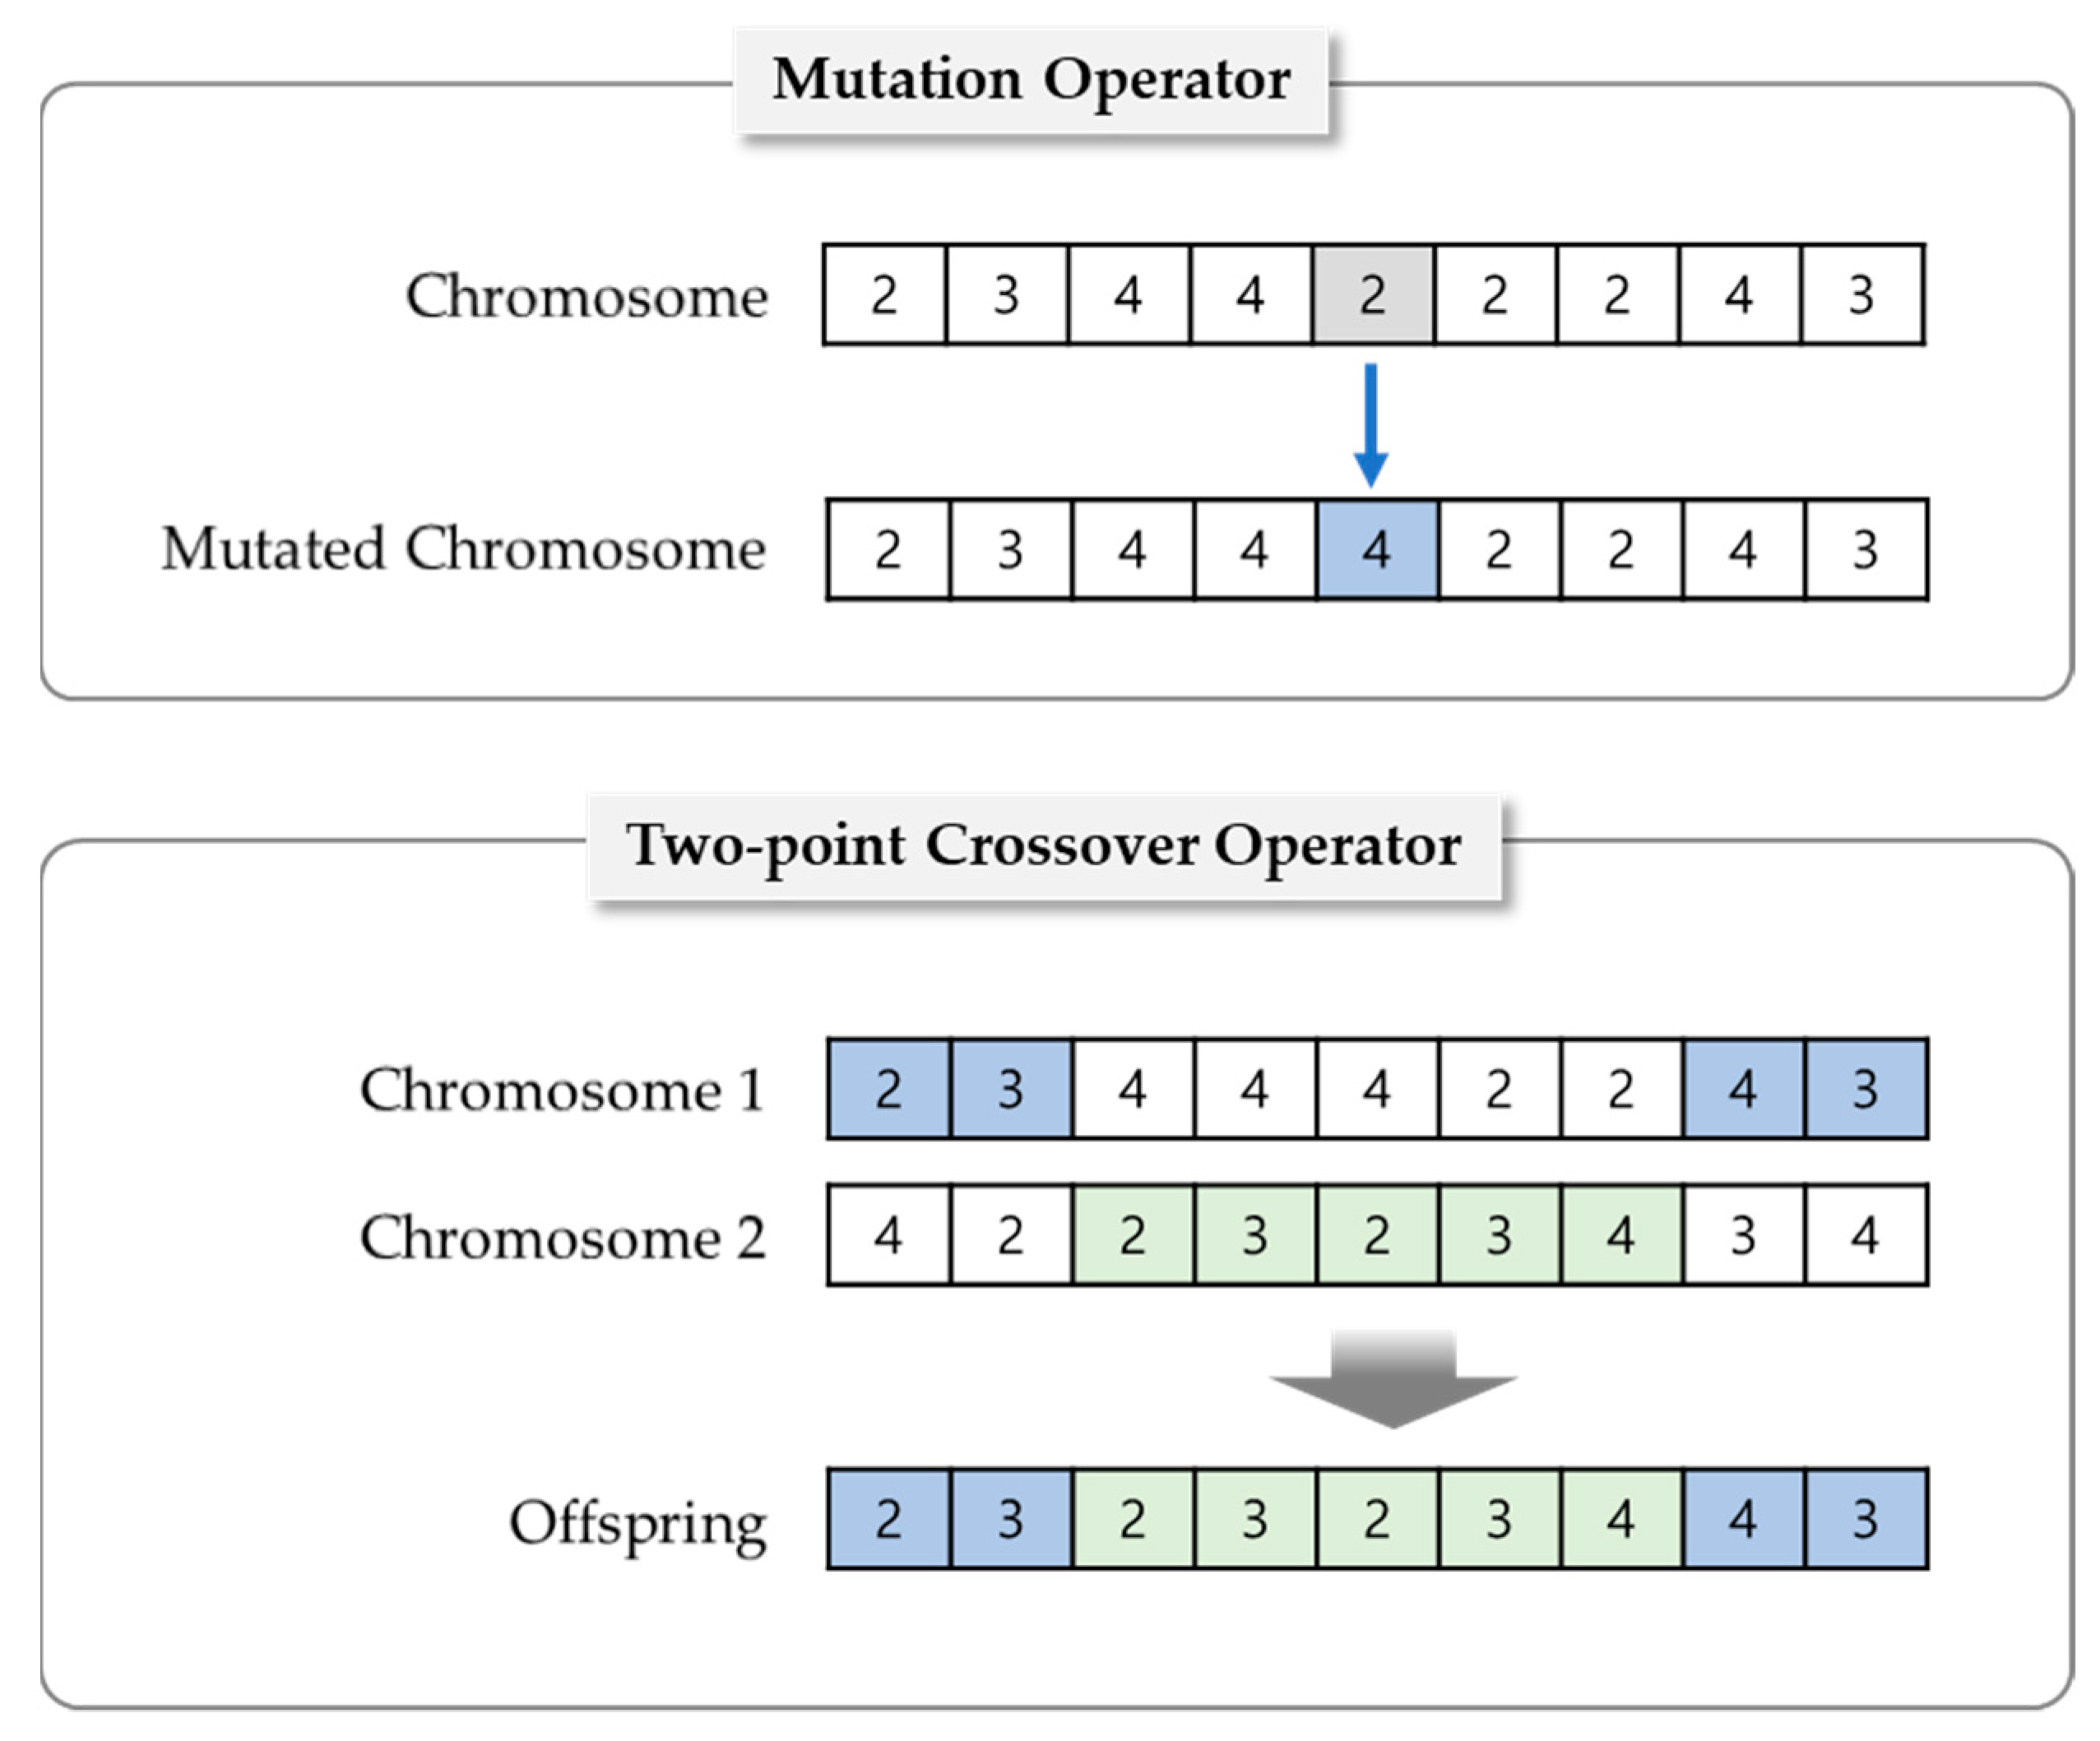
As shown in Figure 4, a set of new chromosomes for the next generation is generated by reproduction with two operators (mutation and crossover) based on the surviving chromosomes after selection. To make a change in a discretization strategy, the mutation operator randomly selects a gene in a single chromosome and reassigns it to another number of intervals. In the case of crossover, a two-point crossover operator is applied, and it changes only a certain part between two points.
3.3. Evaluation
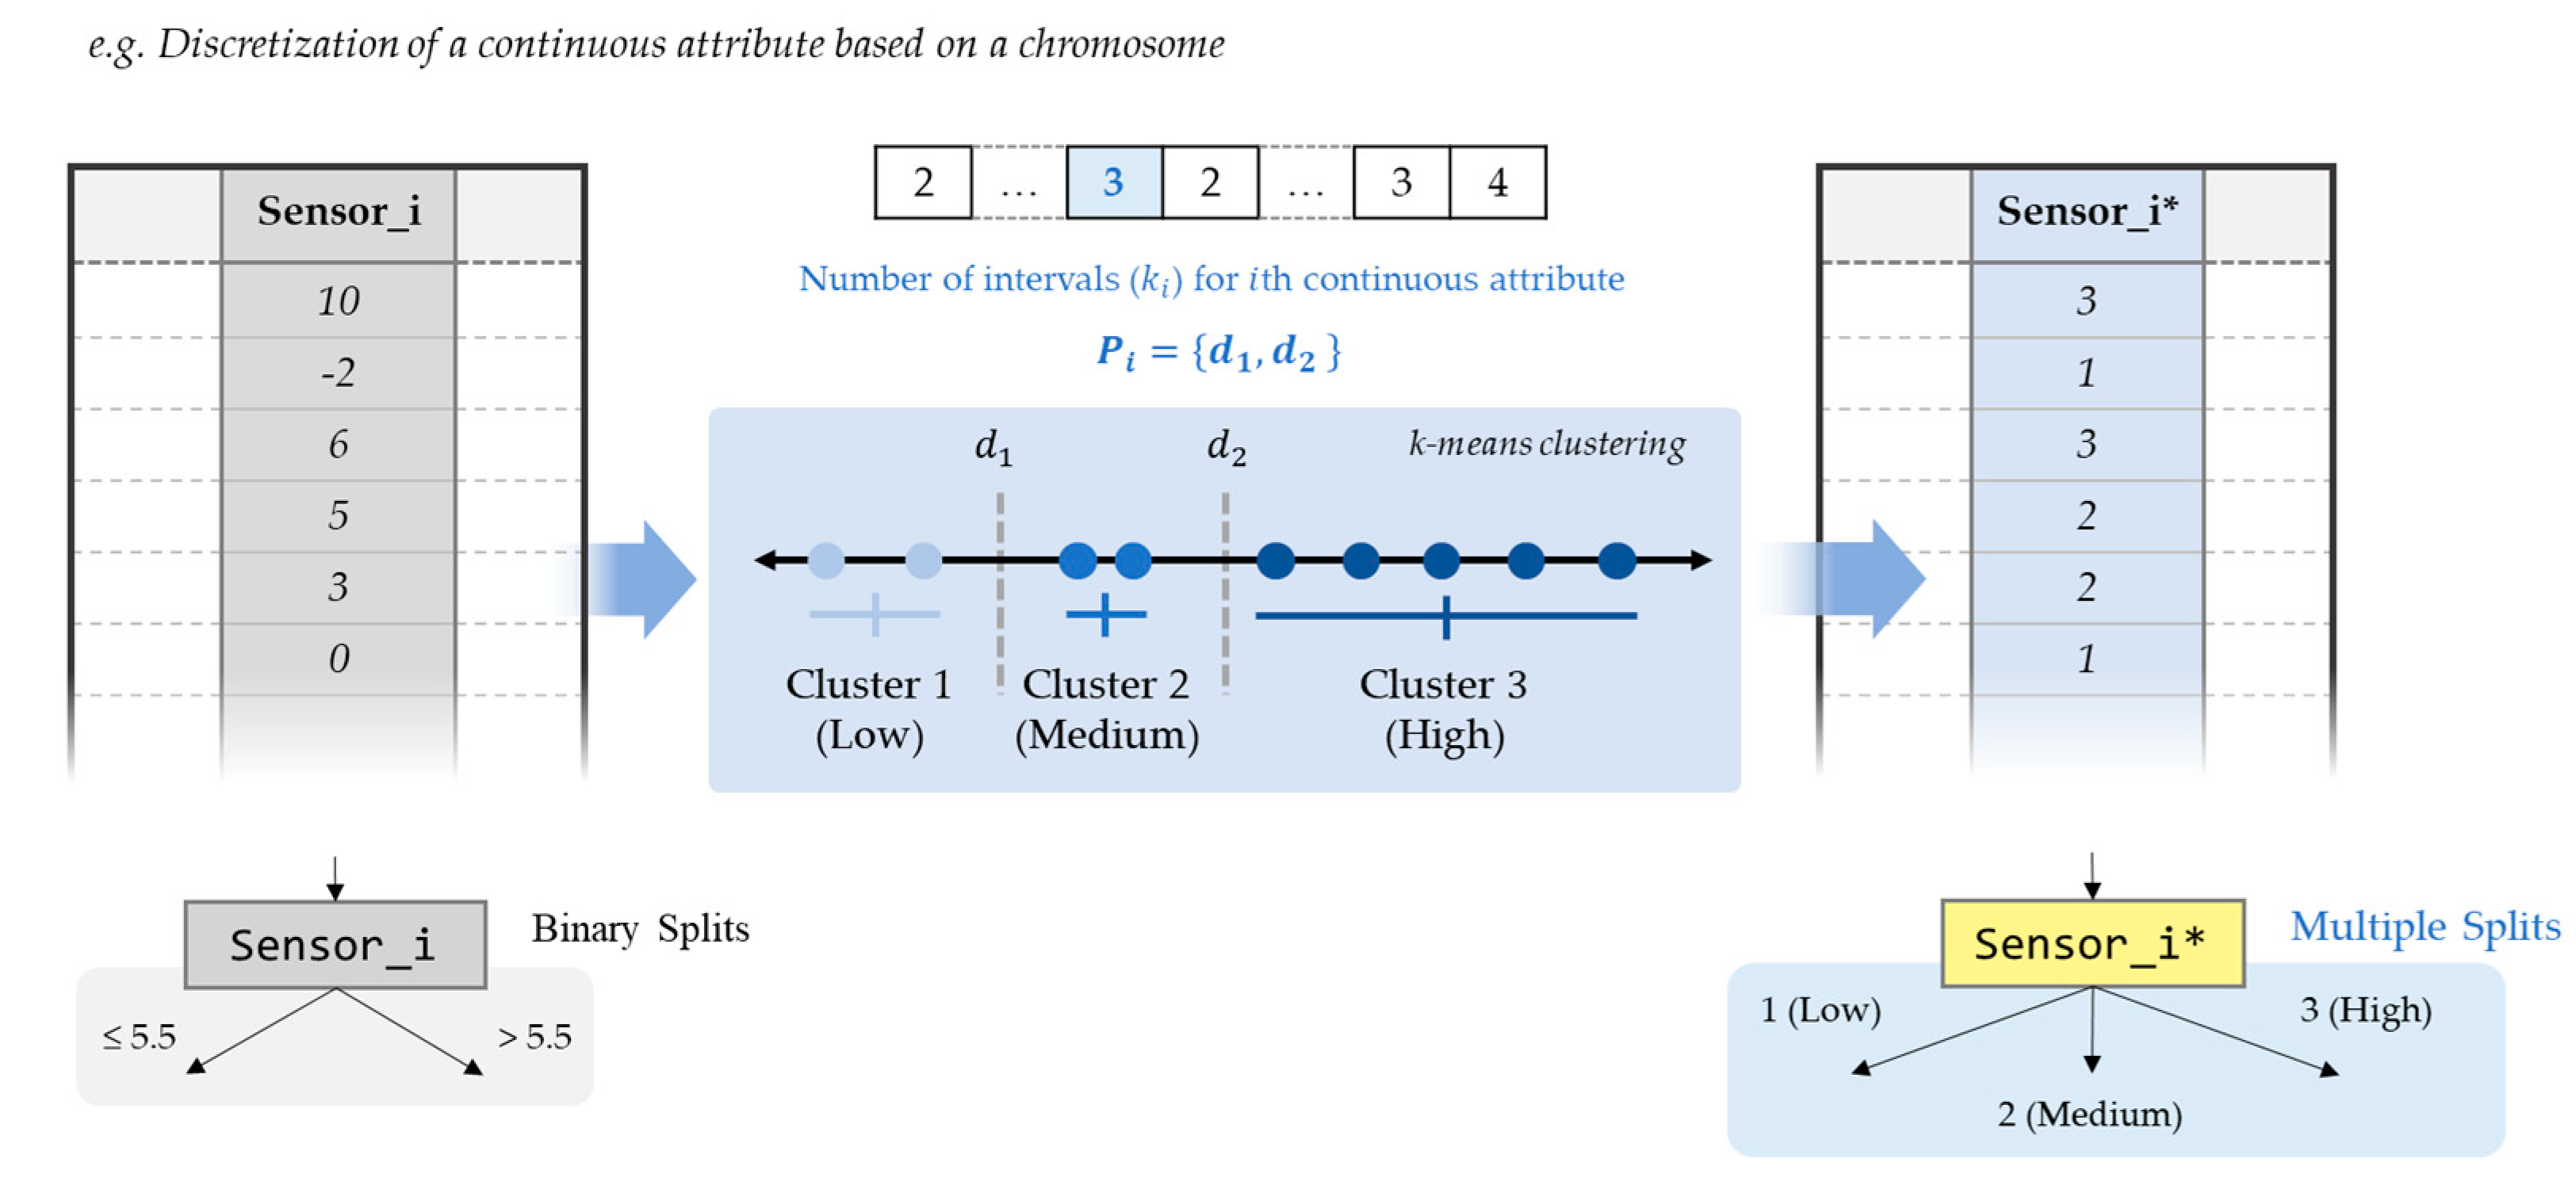
After the generation of chromosomes up to the given size of population, the chromosomes are evaluated by their accuracy with different discretization strategies. To calculate the accuracy of a chromosome, the continuous attributes in the training dataset are first discretized according to genes, which represent different number of intervals for attributes. If the number of intervals in a gene is greater than 2, values in the corresponding attribute are converted to discrete values (such as low, medium, and high), as shown in Figure 5. As a result of the global discretization with combination of C4.5, a smaller decision tree with multi-interval splits can be constructed, and it can be more accurate in some domains [34]. Also, by dividing the continuous values into interpretable intervals, discretization can improve the clarity of rule sets that are interpretable and meaningful to domain experts [44,45].
When making a set of multiple branches for an attribute, a decision tree may encounter missing classes at the bottom of the tree when the size of the training data is not sufficient [19]. In order to deal with those missing values, the missing class at the bottom is randomly labeled as one of classes as an interim measure, and the tree is reconstructed with the updated training data when the corresponding instances are supplemented.
3.4. Selection
In order to preserve the desirable characteristics of chromosomes for the next generations, the tournament selection selects surviving chromosomes and a fitness function is represented as the accuracy. The tournament selection has been widely used and implemented in evolutionary algorithms including EMD due to its lack of stochastic noise [38,46]. The tournament selection runs several tournaments among a set of chromosomes randomly selected from the population, and the winner of each tournament is elected for the next survivor. The termination criterion is the maximum number of generations.
4. Experimental Design
4.1. Data Description
To validate the performance of DIMPLED with real-world datasets from sensors, two classification datasets (CNC and Pasteurizer) of fault detection in manufacturing were used. The datasets were collected by Korea AI Manufacturing Platform (KAMP) from sensors on the shop floor, and they were pre-processed to eliminate noises and inadequate values [47]. The summary of the datasets is shown in Table 2. As shown in the table, the CNC dataset has a larger number of continuous attributes with a smaller number of instances than the Pasteurizer dataset. Attributes of two datasets were collected from sensors with binary quality labels (“Faulty” or “Normal”). The detailed descriptions about the datasets are presented in the following sections.
4.2. Computerized Numerical Control (CNC) Dataset
When processing jobs in CNC Machines, the precision of products varies according to various factors, such as the velocity of a certain axis and positions. Thus, predictive models are necessary to prevent expected faults and schedule maintenance for achieving higher productivity. The dataset was collected from sensors attached to CNC machines in a factory producing automotive parts. The detailed descriptions of attributes in the CNC dataset are shown in Table 3.
4.3. Pasteurizer Dataset
In the pasteurizing process, it is important to identify the factors that may affect the quality for final products, such as taste and flavor. Specifically, the temperature of pasteurizer is the key element for predicting the quality. In order to analyze the factors and predict the quality, the dataset was collected for 8.5 months from programmable logic controllers (PLCs) that the pasteurizers were equipped with and the database management system in a factory producing powdered dairy products. In the factory, two different pasteurizers (A and B) are used in parallel to accelerate the process and the dataset consists of the state and temperature of the two pasteurizers, and the quality of the final product. The state of the pasteurizer can be categorized into two values: 1 (RUN) and 0 (STOP). The detailed descriptions of attributes in the Pasteurizer dataset are summarized in Table 4.
5. Results and Discussions
This section presents the experimental results and compares the performance of the proposed DIMPLED algorithm to other tree-based algorithms, including ensemble learning methods, such as Random Forest, AdaBoost, and Gradient Boosting. The maximum tree height may impact how a tree-based algorithm attains interpretable structures, including the logic as well as the accuracy. Thus, in order to maintain the appropriate level of interpretability through tree-based models, the maximum tree height is determined as 3 based on the previous literature on tree-based algorithms [48,49]. Note that the level of interpretability of the DIMPLED can be also tuned by changing the maximum tree height. In a similar vein, the maximum number of intervals was limited to 4 for maintaining the interpretability. The detailed parameters for the algorithms are listed in Table 5. In the case of other tree-based algorithms, scikit-learn packages were used with the default setting, except for the maximum tree depth. The experiments were run on an Intel i9 10,900 3.7 GHz processor with 32 GB of RAM and GeForce RTX 2080 Ti.
To compare the performance of the tree-based algorithms, the performances obtained by the five algorithms are compared in terms of the average accuracy and interpretability using the CNC and Pasteurizer datasets described in Section 4. First, the average accuracy was calculated by the well-known tenfold cross-validation, which divides the dataset into 10 mutually exclusive and exhaustive partitions. In this paper, two datasets were partitioned using the stratified tenfold cross-validation. Also, the interpretability of the resulting trees was evaluated by splitting each dataset into two sets such that 70% of the data was used for training and 30% was used for testing.
5.1. Comparison Between Algorithms for Average Performance
To compare the performance of the tree-based algorithms, the average classification accuracy obtained by DIMPLED and the other algorithms are compared in Table 6. The table also includes the standard deviation for further comparisons. Among the tree-based algorithms, the gradient boosting algorithm outperformed the others in terms of the average accuracy and standard deviation for the two datasets. Also, in the case of the Pasteurizer dataset, the performances of some ensemble methods (Random Forest and AdaBoost) were significantly weakened compared to the result of the CNC dataset due to the limited tree depth. However, even though ensemble methods produced better performances than single-tree-based algorithms (C4.5, CART, and DIMPLED), the level of interpretability for ensemble models may not be appropriate for practitioners, because they have a lot of trees having different structures. In addition, decision trees generated by DIMPLED showed competitive performance compared to the widely-used ensemble methods in practice.
Furthermore, DIMPLED could produce significantly better performance than C4.5 and CART without loss of its interpretability. One possible explanation for this result is that the performance and generalizability of a single decision tree could be improved by having multiple splits with discretization.
5.2. Comparison Between Algorithms for Interpretability
To compare the interpretability of DIMPLED and the tree-based algorithms, each dataset was split into two sets: 70% of the data was used for training and 30% was used for testing. Based on the training and test datasets, tree-based models were generated, and their performances were compared in terms of the training and test accuracies, which are summarized in Table 7. In order to compare the interpretability of models in detail, the decision trees are depicted in Figure 6, Figure 7 and Figure 8.
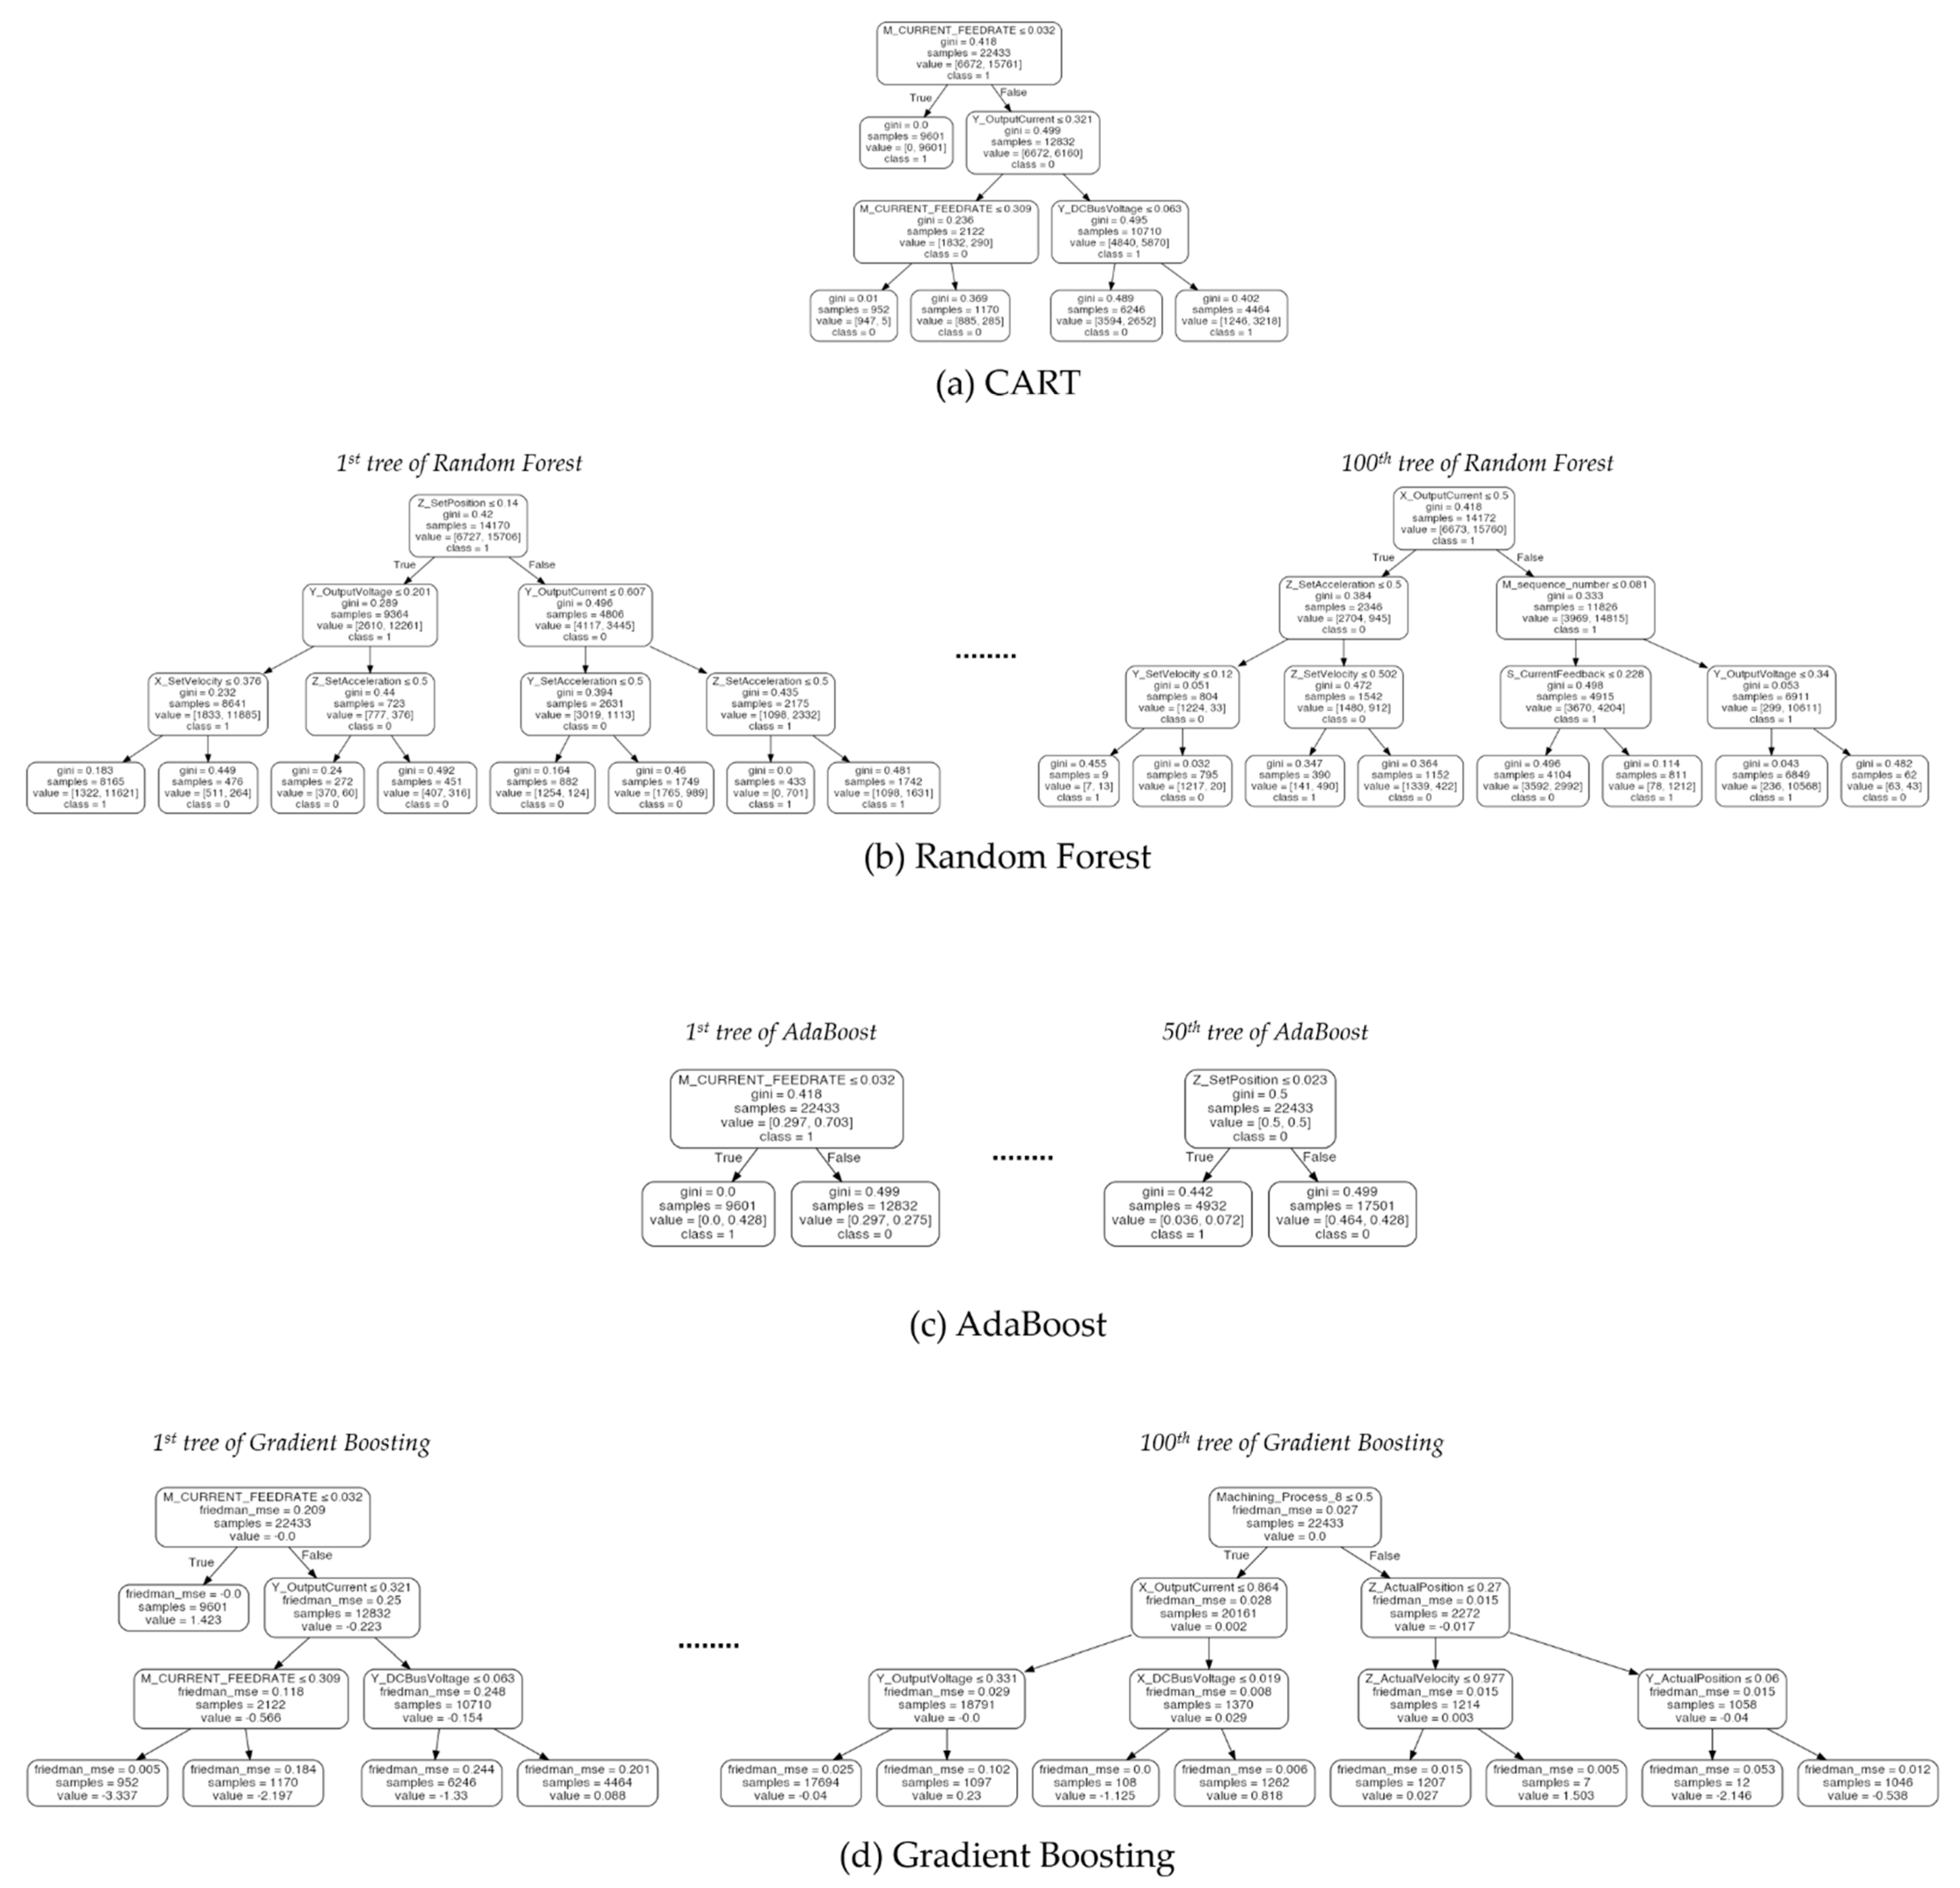
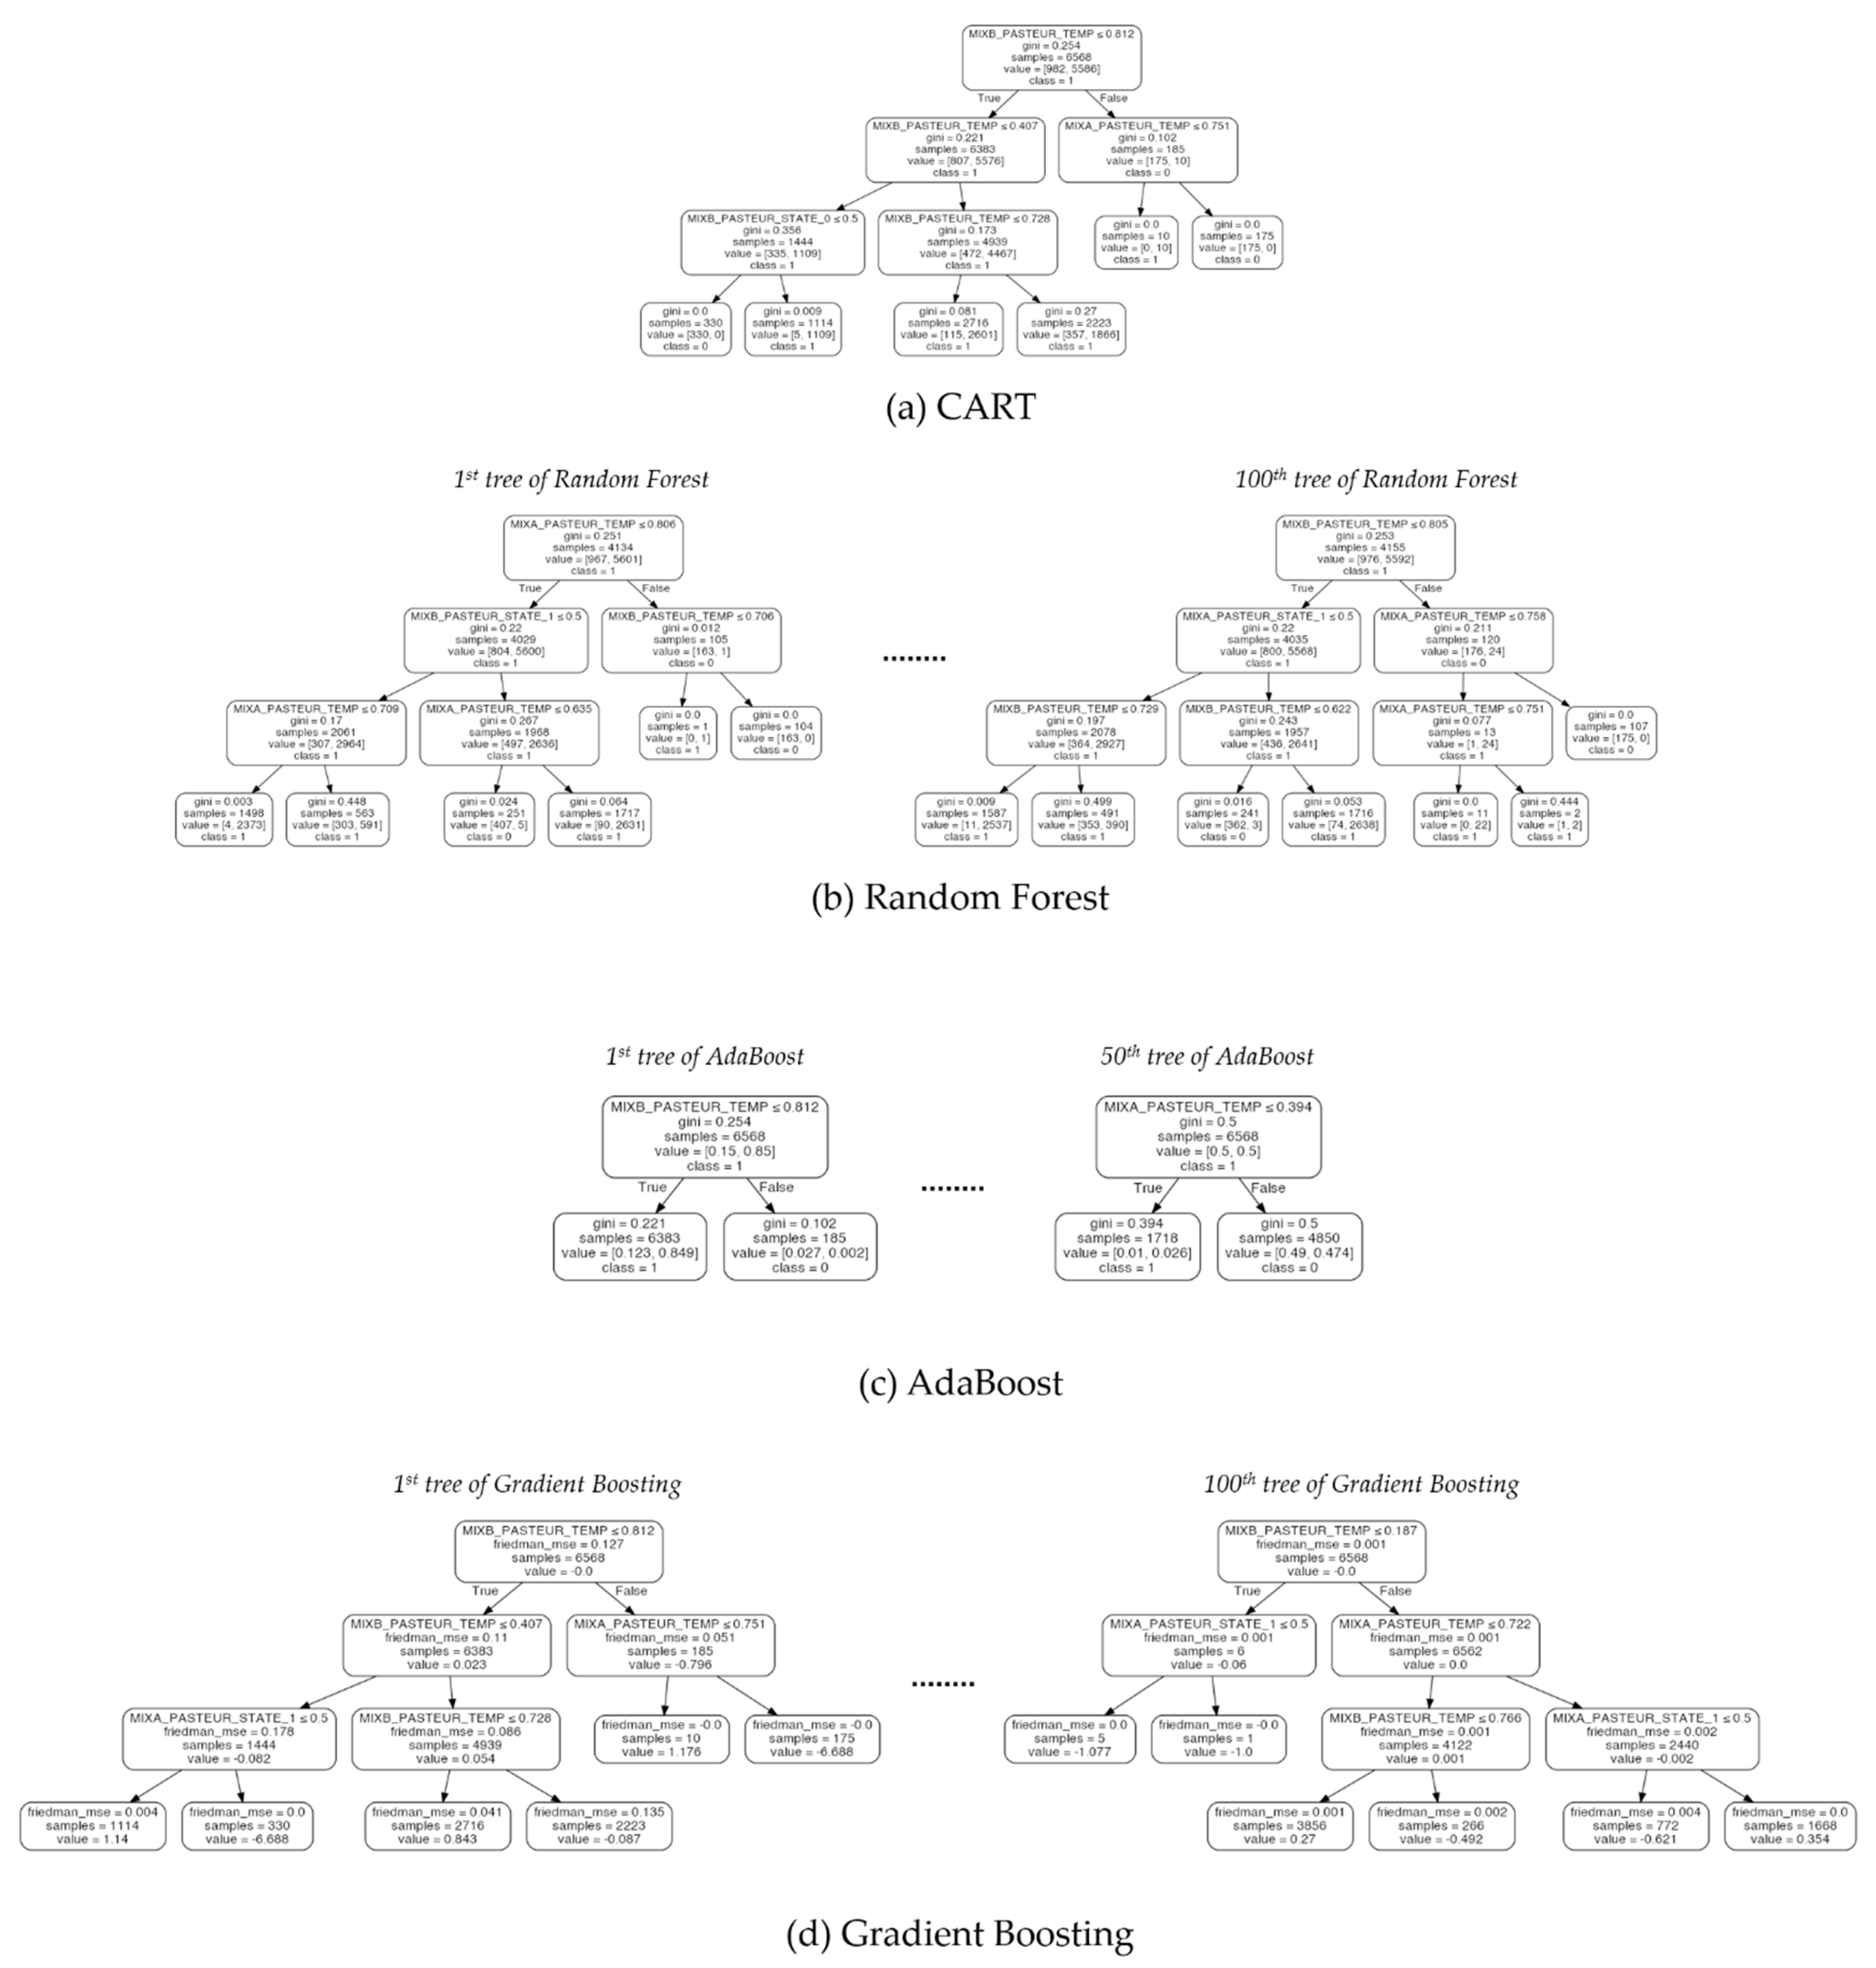
In terms of the training and test accuracies, the results showed that gradient boosting algorithm outperformed the other tree-based algorithms. Similarly to the result of cross-validation, the benefits from combining multiple classifiers in Random Forest and Adaboost were not significant in the Pasteurizer dataset. However, in spite of its high performance, the interpretability of gradient boosting algorithm was significantly lower than the models based on a single decision tree as shown in Figure 6, Figure 7 and Figure 8. In the case of single decision trees, CART and DIMPLED are much easier to understand than the other algorithms, due to their simple and compact structures.
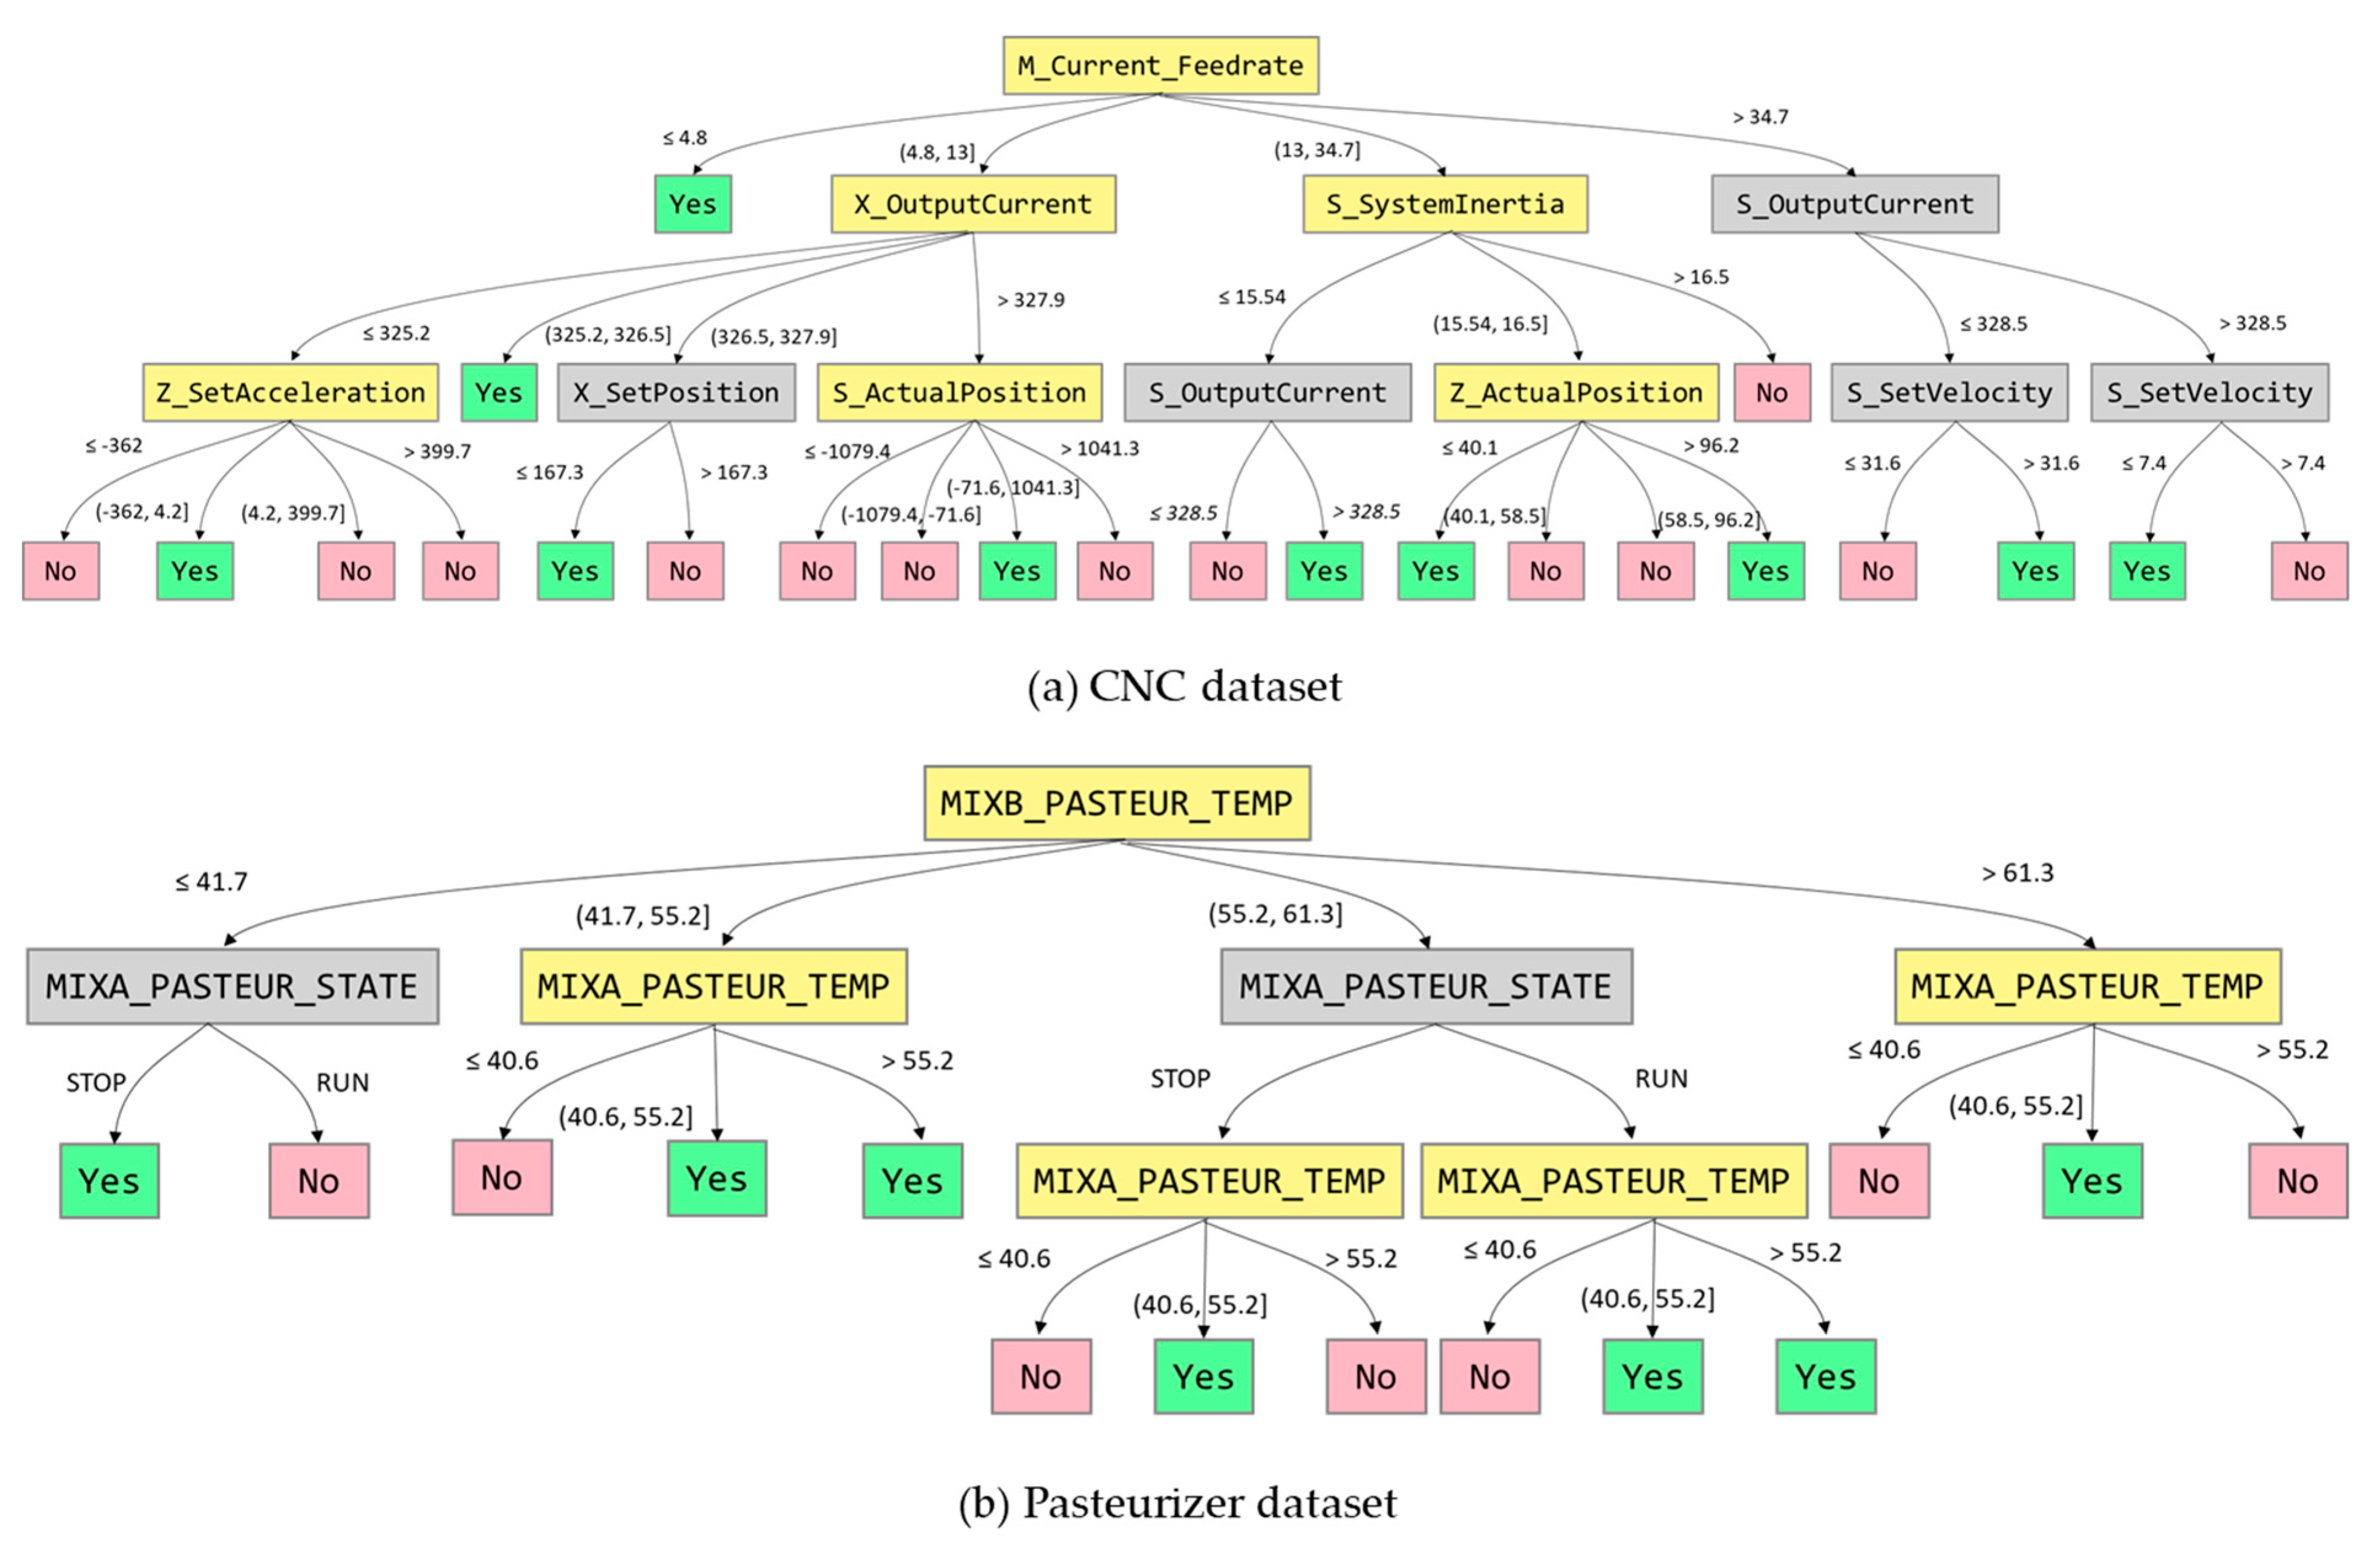
Even though CART and DIMPLED have a similar power of interpretability, DIMPLED significantly outperformed CART in terms of both the training and test accuracies as shown in Table 6. Furthermore, DIMPLED could identify the root causes and their interdependencies as shown in Figure 6. For example, in the case of Pasteurizer dataset, when Pasteurizer B’s temperature was low-to-medium (between 41.7 and 55.2 °C) and Pasteurizer A’s temperature was over 40.6 °C, faulty products were observed in the training data. Also, in the case of CNC dataset, when the current feed rate was low-medium (between 4.8 and 13 mm/s) and the current of X output was low-to-medium (between 325.2 and 326.5 A), faulty products were observed in the training data.
In summary, the results demonstrate that DIMPLED can offer good interpretability compared with the other tree-based algorithms. In addition, DIMPLED appears to find an improved decision tree with the evolutionary process for global discretization, because the tree provides significantly better performance than does C4.5 and CART. Also, the model and its discretized attributes are completely transparent and interpretable, which can make the manufacturing systems more understandable, and thus reliable to human operators.
6. Conclusions and Future Work
This paper addressed the classification model for fault detection in manufacturing. In order to identify the root causes on the shop floor, interpretable ML models that can provide insights as an understandable form are crucial to improving the product quality. However, due to the recent trend of IoT, the number of sensors is exploding, and thus the generation of ML models with high-performance and appropriate level of interpretability is becoming more complicated. To deal with the fault detection problem effectively, a new approach called DIMPLED for evolutionary discretization is proposed. The proposed DIMPLED algorithm improves the structure of a single decision tree by evolving discretization strategies so that it enables the tree to have multiple splits. The experimental results with two datasets in manufacturing show that the decision tree improved by DIMPLED outperformed the performance of C4.5 and CART used widely in practice and it was competitive compared to the ensemble methods, which require multiple decision trees. Even though the ensemble methods could produce slightly better performances, the proposed DIMPLED has more interpretable structure while maintaining the appropriate performance level.
The major contribution of this paper is the development of a new approach for capturing insights with the appropriate level of interpretability. To improve the accuracy with the limited tree height, the proposed DIMPLED enables a tree to have multiple splits with automated discovery process of the best discretization strategy. Also, by the benefit of the reduced set of rules from a simple decision tree, the models generated by DIMPLED have the capability for fault prediction in real-time. Moreover, based on the improved tree, human operators can improve the product quality by identifying the root causes as a set of IF-THEN rules and thus DIMPLED is expected to be utilized to various fault detection problems without the black-box issue.
Future work can proceed in several directions. First, considerations of other interpretable algorithms are interesting and worthy for investigation. Additionally, applications of DIMPLED to other types of classification problems can be studied. Finally, feature extraction techniques can be supplemented to DIMPLED for consideration of their potential effects.
Funding
This research received no external funding
Acknowledgments
This work was supported in part by the Basic Science Research Program through the National Research Foundation of Korea (NRF) under Grant NRF-2021R1C1C100343311 funded by the Ministry of Education and in part by the Dongguk University Research Fund of 2021.
Conflicts of Interest
The author declares no conflict of interest.
References
- Kapteyn, M.G.; Knezevic, D.J.; Willcox, K. Toward predictive digital twins via component-based reduced-order models and interpretable machine learning. In Proceedings of the AIAA Scitech 2020 Forum; Orlando, FL, USA, 6–10 January 2020, American Institute of Aeronautics and Astronautics: Reston, VA, USA, 2020; p. 418. [Google Scholar]
- Fan, S.-K.S.; Lin, S.-C.; Tsai, P.-F. Wafer fault detection and key step identification for semiconductor manufacturing using principal component analysis, AdaBoost and decision tree. J. Ind. Prod. Eng. 2016, 33, 151–168. [Google Scholar] [CrossRef]
- Wuest, T.; Weimer, D.; Irgens, C.; Thoben, K.-D. Machine learning in manufacturing: advantages, challenges, and applications. Prod. Manuf. Res. 2016, 4, 23–45. [Google Scholar] [CrossRef] [Green Version]
- Last, M.; Danon, G.; Biderman, S.; Miron, E. Optimizing a batch manufacturing process through interpretable data mining models. J. Intell. Manuf. 2009, 20, 523–534. [Google Scholar] [CrossRef]
- Ghose, A.; Ravindran, B. Interpretability With Accurate Small Models. Front. Artif. Intell. 2020, 3, 3. [Google Scholar] [CrossRef] [Green Version]
- Mapa, J.S.; Sison, A.; Medina, R.P. A Modified C4.5 Classification Algorithm: With the Discretization Method in Calculating the Goodness Score Equivalent. In Proceedings of the 2019 IEEE 6th International Conference on Engineering Technologies and Applied Sciences (ICETAS), Kuala Lumpur, Malaysia, 20–21 December 2019; Institute of Electrical and Electronics Engineers (IEEE): Piscataway, NJ, USA, 2019; pp. 1–4. [Google Scholar]
- Cahyani, N.; Muslim, M.A. Increasing Accuracy of C4. 5 Algorithm by Applying Discretization and Correlation-based Feature Selection for Chronic Kidney Disease Diagnosis. J. Telecommun. Electron. Comput. Eng. (JTEC), 2020; 12, 25–32. [Google Scholar]
- Dash, R.; Paramguru, R.L.; Dash, R. Comparative analysis of supervised and unsupervised discretization techniques. Int. J. Adv. Sci. Technol. 2011, 2, 29–37. [Google Scholar]
- Ramírez-Gallego, S.; García, S.; Benítez, J.M.; Herrera, F. A Wrapper Evolutionary Approach for Supervised Multivariate Discretization: A Case Study on Decision Trees. In Proceedings of the 9th International Conference on Computer Recognition Systems CORES 2015; Springer: Cham, Switzerland, 2016; pp. 47–58. [Google Scholar]
- Kaya, F. Discretizing Continuous Features for Naïve Bayes and C4. 5 Classifiers; University of Maryland Publications: College Park, MD, USA, 2008. [Google Scholar]
- Lee, K.B.; Cheon, S.; Kim, C.O. A convolutional neural network for fault classification and diagnosis in semiconductor manufacturing processes. Ieee Trans. Semicond. Manuf. 2017, 30, 135–142. [Google Scholar] [CrossRef]
- Ragab, A.; El-Koujok, M.; Poulin, B.; Amazouz, M.; Yacout, S. Fault diagnosis in industrial chemical processes using interpretable patterns based on Logical Analysis of Data. Expert Syst. Appl. 2018, 95, 368–383. [Google Scholar] [CrossRef]
- Grezmak, J.; Zhang, J.; Wang, P.; Loparo, K.A.; Gao, R.X. Interpretable convolutional neural network through layer-wise relevance propagation for machine fault diagnosis. Ieee Sens. J. 2019, 20, 3172–3181. [Google Scholar] [CrossRef]
- Hansen, L.K.; Rieger, L. Interpretability in intelligent systems–a new concept? In Explainable AI: Interpreting, Explaining and Visualizing Deep Learning; Springer: Cham, Switzerland, 2019; pp. 41–49. [Google Scholar]
- Quinlan, J.R. Unknown attribute values in induction. In Proceedings of the Sixth International Workshop on Machine Learning; Morgan Kaufmann: Burlington, MA, USA, 1989; pp. 164–168. [Google Scholar]
- Quinlan, J.R. C4. 5: Programs for Machine Learning; Morgan Kaufmann: Burlington, MA, USA, 1993. [Google Scholar]
- Barros, R.C.; Basgalupp, M.P.; De Carvalho, A.C.P.L.F.; Freitas, A.A. Automatic Design of Decision-Tree Algorithms with Evolutionary Algorithms. Evol. Comput. 2013, 21, 659–684. [Google Scholar] [CrossRef] [PubMed] [Green Version]
- Breiman, L.; Friedman, J.; Stone, C.J.; Olshen, R.A. Classification and Regression Trees; CRC Press: Boca Raton, FL, USA, 1984. [Google Scholar]
- Singh, S.; Gupta, P. Comparative study ID3, cart and C4. 5 decision tree algorithm: A survey. Int. J. Adv. Inf. Sci. Technol. (IJAIST) 2014, 27, 97–103. [Google Scholar]
- Zhao, Y.; Zhang, Y. Comparison of decision tree methods for finding active objects. Adv. Space Res. 2008, 41, 1955–1959. [Google Scholar] [CrossRef] [Green Version]
- Elith, J.; Leathwick, J.R.; Hastie, T. A working guide to boosted regression trees. J. Anim. Ecol. 2008, 77, 802–813. [Google Scholar] [CrossRef]
- Breiman, L. Random forests. Mach. Learn. 2008, 45, 5–32. [Google Scholar] [CrossRef] [Green Version]
- Freund, Y.; Schapire, R.E. Game theory, on-line prediction and boosting. In Proceedings of the Ninth Annual Conference on Computational Learning Theory, Desenzano del Garda, Italy, 28 June–1 July 1996; Association for Computing Machinery: New York, NY, USA, 1996; pp. 325–332. [Google Scholar]
- Vezhnevets, A.; Vezhnevets, V. Modest AdaBoost-teaching AdaBoost to generalize better. Graphicon 2005, 12, 987–997. [Google Scholar]
- Friedman, J.H. Stochastic gradient boosting. Comput. Stat. Data Anal. 2002, 38, 367–378. [Google Scholar] [CrossRef]
- Fan, J.; Yue, W.; Wu, L.; Zhang, F.; Cai, H.; Wang, X.; Lu, X.; Xiang, Y. Evaluation of SVM, ELM and four tree-based ensemble models for predicting daily reference evapotranspiration using limited meteorological data in different climates of China. Agric. For. Meteorol. 2018, 263, 225–241. [Google Scholar] [CrossRef]
- Zorman, M.; Štiglic, M.M.; Kokol, P.; Malčić, I. The limitations of decision trees and automatic learning in real world medical decision making. J. Med Syst. 1997, 21, 403–415. [Google Scholar] [CrossRef] [PubMed]
- Lakkaraju, H.; Bach, S.H.; Leskovec, J. Interpretable decision sets: A joint framework for description and prediction. In Proceedings of the 22nd ACM SIGKDD International Conference on Knowledge Discovery and Data Mining, San Francisco, CA, USA, 13–17 August 2016; Association for Computing Machinery: New York, NY, USA, 2016; pp. 1675–1684. [Google Scholar]
- Angelino, E.; Larus-Stone, N.; Alabi, D.; Seltzer, M.; Rudin, C. Learning Certifiably Optimal Rule Lists for Categorical Data. J. Mach. Learn. Res. 2018, 18, 1–78. [Google Scholar]
- Liu, H.; Hussain, F.; Tan, C.L.; Dash, M. Discretization: An Enabling Technique. Data Min. Knowl. Discov. 2002, 6, 393–423. [Google Scholar] [CrossRef]
- Garcia, S.; Luengo, J.; Sáez, J.A.; Lopez, V.; Herrera, F. A survey of discretization techniques: Taxonomy and empirical analysis in supervised learning. Ieee Trans. Knowl. Data Eng. 2012, 25, 734–750. [Google Scholar] [CrossRef]
- Kwedlo, W.; Krętowski, M. An evolutionary algorithm using multivariate discretization for decision rule induction. In Proceedings of the European Conference on Principles of Data Mining and Knowledge Discovery, Prague, Czech Republic, 15–18 September 1999; Springer: Heidelberg, Germany, 1999; pp. 392–397. [Google Scholar]
- Dougherty, J.; Kohavi, R.; Sahami, M. Supervised and unsupervised discretization of continuous features. In Machine Learning Proceedings 1995; Morgan Kaufmann: Burlington, MA, USA, 1995; pp. 194–202. [Google Scholar]
- Quinlan, J.R. Improved use of continuous attributes in C4.5. J. Artif. Intell. Res. 1996, 4, 77–90. [Google Scholar] [CrossRef] [Green Version]
- Tsai, C.F.; Chen, Y.C. The optimal combination of feature selection and data discretization: An empirical study. Inf. Sci. 2019, 505, 282–293. [Google Scholar] [CrossRef]
- Valdes, J.J.; Molina, L.C.; Peris, N. An evolution strategies approach to the simultaneous discretization of numeric attributes in data mining. In Proceedings of the 2003 Congress on Evolutionary Computation, 2003. CEC’03, Canberra, ACT, Australia, 8–12 December 2003; IEEE: New York, NY, USA, 2003; Volume 3, pp. 1957–1964. [Google Scholar]
- Ramírez-Gallego, S.; García, S.; Benítez, J.M.; Herrera, F. Multivariate discretization based on evolutionary cut points selection for classification. Ieee Trans. Cybern. 2015, 46, 595–608. [Google Scholar] [CrossRef] [PubMed]
- Zamudio-Reyes, R.; Cruz-Ramírez, N.; Mezura-Montes, E. A multivariate discretization algorithm based on multiobjective optimization. In Proceedings of the 2017 International Conference on Computational Science and Computational Intelligence (CSCI), Las Vegas, NV, USA, 14–16 December 2017; IEEE: New York, NY, USA, 2017; pp. 375–380. [Google Scholar]
- Tahan, M.H.; Asadi, S. MEMOD: A novel multivariate evolutionary multi-objective discretization. Soft Comput. 2018, 22, 301–323. [Google Scholar] [CrossRef]
- Maslove, D.M.; Podchiyska, T.; Lowe, H.J. Discretization of continuous features in clinical datasets. J. Am. Med Inform. Assoc. 2013, 20, 544–553. [Google Scholar] [CrossRef] [Green Version]
- Catlett, J. On changing continuous attributes into ordered discrete attributes. In European Working Session on Learning; Springer: Berlin/Heidelberg, Germany, 1991; pp. 164–178. [Google Scholar]
- MacQueen, J. Some methods for classification and analysis of multivariate observations. In Proceedings of the Fifth Berkeley Symposium on Mathematical Statistics and Probability; University of California: Berkeley, CA, USA, 1967; Volume 1, pp. 281–297. [Google Scholar]
- Gupta, A.; Mehrotra, K.G.; Mohan, C. A clustering-based discretization for supervised learning. Stat. Probab. Lett. 2010, 80, 816–824. [Google Scholar] [CrossRef] [Green Version]
- Lustgarten, J.L.; Visweswaran, S.; Gopalakrishnan, V.; Cooper, G.F. Application of an efficient Bayesian discretization method to biomedical data. BMC Bioinform. 2011, 12, 1–15. [Google Scholar] [CrossRef] [Green Version]
- Vannucci, M.; Colla, V. Meaningful discretization of continuous features for association rules mining by means of a SOM. In Proceedings of the ESANN, Bruges, Belgium, 28–30 April 2004; pp. 489–494. [Google Scholar]
- Blickle, T.; Thiele, L. A comparison of selection schemes used in evolutionary algorithms. Evol. Comput. 1996, 4, 361–394. [Google Scholar] [CrossRef]
- Ministry of SMEs and Startups of Korea & Korea AI Manufacturing Platform (KAMP). CNC Machine and Pasteurizer AI Datasets. 2021. Available online: https://kamp-ai.kr/front/dataset (accessed on 15 March 2021).
- Vandewiele, G.; Steenwinckel, B.; De Turck, F.; Ongenae, F. MINDWALC: Mining interpretable, discriminative walks for classification of nodes in a knowledge graph. Bmc Med Inform. Decis. Mak. 2020, 20, 1–15. [Google Scholar] [CrossRef]
- Hwang, S.; Yeo, H.G.; Hong, J.S. A new splitting criterion for better interpretable trees. IEEE Access 2020, 8, 62762–62774. [Google Scholar] [CrossRef]
Figure 1.
Illustration of a decision tree generated by CART and another tree generated by C4.5 with discretization. The discretized attributes are highlighted in yellow.
Figure 1.
Illustration of a decision tree generated by CART and another tree generated by C4.5 with discretization. The discretized attributes are highlighted in yellow.

Figure 2.
Overall framework of DIMPLED.

Figure 3.
Chromosome representation.

Figure 4.
Illustration of mutation and crossover operations.

Figure 5.
Evaluation of a chromosome with k-means clustering for discretization.

Figure 6.
Illustration of two decision trees improved by DIMPLED. The decision trees contain discretized attributes highlighted in yellow, which have multiple branches.
Figure 6.
Illustration of two decision trees improved by DIMPLED. The decision trees contain discretized attributes highlighted in yellow, which have multiple branches.

Figure 7.
Illustration of decision trees generated by four tree-based algorithms (CART, Random Forest, AdaBoost, and Gradient Boosting) for the CNC dataset. Ensemble methods producing different decision trees are illustrated by visualizing only the first and last models.
Figure 7.
Illustration of decision trees generated by four tree-based algorithms (CART, Random Forest, AdaBoost, and Gradient Boosting) for the CNC dataset. Ensemble methods producing different decision trees are illustrated by visualizing only the first and last models.

Figure 8.
Illustration of decision trees generated by four tree-based algorithms (CART, Random Forest, AdaBoost, and Gradient Boosting) for the Pasteurizer dataset. Ensemble methods producing different decision trees are illustrated by visualizing only the first and last models.
Figure 8.
Illustration of decision trees generated by four tree-based algorithms (CART, Random Forest, AdaBoost, and Gradient Boosting) for the Pasteurizer dataset. Ensemble methods producing different decision trees are illustrated by visualizing only the first and last models.


Table 1.
Overview of research related to multivariate discretization with interpretable ML models.
| Discretization Algorithm | Classifier | Reference |
|---|---|---|
| Minimum Description Length (MDL) | C4.5 | [34] |
| Equal Frequency Binning (EFB), Equal Width Binning (EWB), MDL, and ChiMerge | C4.5 and SVM | [35] |
| Evolutionary Decision Rule Learner with Multivariate Discretization (EDRL-MD) | C4.5 | [32] |
| Evolution-Strategies-based discretization Algorithms | ID3, C4.5, and C4.5-rules | [36] |
| Evolutionary algorithm for multivariate discretization based on a wrapper fitness function | C4.5 and Naive Bayes | [37] |
| Multivariate discretization algorithm (multiCAIM) based on NSGA-II | C4.5, Naive Bayes, and k-nearest neighbors (KNN) | [38] |
| Multivariate Evolutionary Multi-Objective Discretization (MEMOD) | C4.5 | [39] |
Table 2.
Summary of two datasets (CNC and Pasteurizer).
| Dataset | Number of Instances | Class Distribution (Faulty/Normal) | Number of Categorical Attributes | Number of Continuous Attributes |
|---|---|---|---|---|
| CNC | 32,048 | 22,645/9403 | 2 | 46 |
| Pasteurizer | 210,794 | 77,784/133,010 | 2 | 2 |
Table 3.
Description of attributes in CNC dataset.
| Source (Number of Attributes) | Attribute Name (Unit of Continuous Attribute or Description of Categorical Attribute) |
|---|---|
| X-axis | X_ActualPosition (mm), X_ActualVelocity (mm/s), X_ActualAcceleration (mm/s/s), X_SetPosition (mm), X_SetVelocity (mm/s), X_SetAcceleration (mm/s/s), X_CurrentFeedback (A), X_DCBusVoltage (V), X_OutputCurrent (A), X_OutputVoltage (V), X_OutputPower (kw) |
| (11) | |
| Y-axis | Y_ActualPosition (mm), Y_ActualVelocity (mm/s), Y_ActualAcceleration (mm/s/s), Y_SetPosition (mm), Y_SetVelocity (mm/s), Y_SetAcceleration (mm/s/s), Y_CurrentFeedback (A), Y_DCBusVoltage (V), Y_OutputCurrent (A), Y_OutputVoltage (V), Y_OutputPower (kw) |
| (11) | |
| Z-axis | Z_ActualPosition (mm), Z_ActualVelocity (mm/s), Z_ActualAcceleration (mm/s/s), Z_SetPosition (mm), Z_SetVelocity (mm/s), Z_SetAcceleration (mm/s/s), Z_CurrentFeedback (A), Z_DCBusVoltage (V), Z_OutputCurrent (A), Z_OutputVoltage (V) |
| (10) | |
| Spin | S_ActualPosition (mm), S_ActualVelocity (mm/s), S_ActualAcceleration (mm/s/s), S_SetPosition (mm), S_SetVelocity (mm/s), S_SetAcceleration (mm/s/s), S_CurrentFeedback (A), S_DCBusVoltage (V), S_OutputCurrent (A), S_OutputVoltage (V), S_OutputPower (kw), S_SystemInertia (kg·m2) |
| (12) | |
| Others | M_CURRENT_PROGRAM_NUMBER (3 categorical values), M_sequence_number (sequence number), M_CURRENT_FEEDRATE (mm/s), Machining_Process (9 categorical values) |
| (4) |
Table 4.
Description of attributes in Pasteurizer dataset.
| Source (Number of Attributes) | Attribute Name (Unit of Continuous Attribute or Description of Categorical Attribute) |
|---|---|
| Pasteurizer A (2) | MIXA_PASTEUR_TEMP (°C), MIXA_PASTEUR_STATE (2 categorical values) |
| Pasteurizer B (2) | MIXB_PASTEUR_TEMP (°C), MIXB_PASTEUR_STATE (2 categorical values) |
Table 5.
Parameters for DIMPLED and other tree-based algorithms.
| Algorithm | Parameter | Value |
|---|---|---|
| DIMPLED | Population size | 500 |
| Number of generations | 20 | |
| Mutation rate | 0.3 | |
| Crossover rate | 0.3 | |
| Tournament size | 5 | |
| Survivor size | 50 | |
| Maximum number of intervals | 4 | |
| AdaBoost | Number of trees | 50 |
| Random Forest | Number of trees | 100 |
| Gradient Boosting | Number of trees | 100 |
Table 6.
Average test performances of DIMPLED and tree-based algorithms for CNC and Pasteurizer datasets in cross-validation.
Table 6.
Average test performances of DIMPLED and tree-based algorithms for CNC and Pasteurizer datasets in cross-validation.
| CNC | Pasteurizer | |||||||||
|---|---|---|---|---|---|---|---|---|---|---|
| Accuracy | Avg. Precision | Avg. Recall | Avg. F1 | Accuracy | Avg. Precision | Avg. Recall | Avg. F1 | |||
| Avg. | S.D. | Avg. | S.D. | |||||||
| C4.5 | 66.66 | ±19.99 | 0.8078 | 0.7439 | 0.6994 | 91.01 | ±0.85 | 0.9211 | 0.9779 | 0.9486 |
| CART | 75.52 | ±15.95 | 0.8276 | 0.836 | 0.818 | 92.77 | ±0.74 | 0.922 | 0.9995 | 0.9592 |
| Random Forest | 81.79 | ±17.09 | 0.8766 | 0.8741 | 0.8662 | 92.93 | ±0.81 | 0.9232 | 1.0 | 0.9601 |
| AdaBoost | 80.62 | ±17.35 | 0.8919 | 0.8226 | 0.8409 | 91.04 | ±0.88 | 0.924 | 0.9746 | 0.9486 |
| Gradient Boosting | 87.03 | ±12.56 | 0.9287 | 0.8946 | 0.9008 | 99.7 | ±0.24 | 0.9979 | 0.9985 | 0.9982 |
| DIMPLED | 84.81 | ±10.43 | 0.8862 | 0.9118 | 0.8956 | 95.49 | ±5.18 | 0.9861 | 0.9607 | 0.9722 |
Table 7.
Training and test performances of DIMPLED and tree-based algorithms for CNC and Pasteurizer datasets.
Table 7.
Training and test performances of DIMPLED and tree-based algorithms for CNC and Pasteurizer datasets.
| CNC | Pasteurizer | |||||||||
|---|---|---|---|---|---|---|---|---|---|---|
| Train Accr. | Test Accr. | Precision | Recall | F1 | Train Accr. | Test Accr. | Precision | Recall | F1 | |
| C4.5 | 75.11 | 74.63 | 1.0 | 0.6457 | 0.7847 | 90.68 | 91.23 | 0.9228 | 0.9782 | 0.9497 |
| CART | 81.33 | 81.2 | 0.9195 | 0.8981 | 0.8602 | 92.74 | 93.0 | 0.9239 | 0.9996 | 0.9603 |
| Random Forest | 90.58 | 90.71 | 0.9286 | 0.9427 | 0.9356 | 93.38 | 93.64 | 0.9301 | 1.0 | 0.9638 |
| AdaBoost | 92.99 | 93.39 | 0.9513 | 0.9566 | 0.9539 | 90.64 | 91.55 | 0.9227 | 0.9824 | 0.9516 |
| Gradient Boosting | 96.56 | 96.71 | 0.9773 | 0.9799 | 0.9771 | 99.92 | 99.47 | 0.9962 | 0.9945 | 0.9969 |
| DIMPLED | 91.19 | 91.89 | 0.9421 | 0.9448 | 0.9434 | 98.11 | 98.05 | 0.9874 | 0.9895 | 0.9885 |
Publisher’s Note: MDPI stays neutral with regard to jurisdictional claims in published maps and institutional affiliations. |
© 2021 by the author. Licensee MDPI, Basel, Switzerland. This article is an open access article distributed under the terms and conditions of the Creative Commons Attribution (CC BY) license (https://creativecommons.org/licenses/by/4.0/).
Share and Cite
MDPI and ACS Style
Jun, S. Evolutionary Algorithm for Improving Decision Tree with Global Discretization in Manufacturing. Sensors 2021, 21, 2849. https://doi.org/10.3390/s21082849
AMA Style
Jun S. Evolutionary Algorithm for Improving Decision Tree with Global Discretization in Manufacturing. Sensors. 2021; 21(8):2849. https://doi.org/10.3390/s21082849
Chicago/Turabian StyleJun, Sungbum. 2021. "Evolutionary Algorithm for Improving Decision Tree with Global Discretization in Manufacturing" Sensors 21, no. 8: 2849. https://doi.org/10.3390/s21082849
Note that from the first issue of 2016, this journal uses article numbers instead of page numbers. See further details here.