Preparation of Silver Nanoparticle and Its Application to the Determination of ct-DNA

1
College of Chemistry, Sichuan University, Chengdu 610064, P. R. China
2
College of Chemical Engineering, Sichuan University, Chengdu 610064, P. R. China
3
College of Chemistry and Chemical Engineering, China West Normal University, Nanchong, 637002, P. R. China
*
Author to whom correspondence should be addressed.
Sensors 2007, 7(5), 708-718; https://doi.org/10.3390/s7050708
Submission received: 16 March 2007
/
Accepted: 29 May 2007
/
Published: 31 May 2007
(This article belongs to the Special Issue Optical Biosensors)
Abstract
:new method to prepare silver nanoparticles was reported in this paper, which based on aqueous-gaseous phase reaction of silver nitrate solution and ammonia gas. The proposed method is effective, rapid, and convenient. Transmission electron microscope (TEM) and X-ray diffraction (XRD) were used to characterize the structure of the particles, respectively. It was found that the average diameter of the particles was about 10 nm and the shape was spherical. And the strong fluorescence signal of the silver nanoparticles solution can be quenched after the adding of the calf thymus DNA (ct-DNA) solution. The quenched fluorescence intensity was linear with the concentration of ct-DNA in the range of 0.5 to 5.0 × 10⁴ ng mL-1 with a detection limit of 0.3 ng mL-1.
1. Introduction
In recent years, noble metal nanoparticles have been extensively studied and various approaches have been employed for the preparation of metal nanoparticles [1-6]. Among the noble metal nanoparticles, silver nanoparticles have attracted more attention [7-13] for their advantage on various studies such as photosensitive components [14], catalysts [15-17], and surface-enhanced Raman spectroscopy [18-19]. In this paper, we prepared a kind of silver nanoparticles by the reaction of silver nitrate solution and ammonia gas. The products were characterized by powder X-ray diffraction (XRD), transmission electron microscope (TEM) and fluorescence spectrophotometer, respectively. The results showed that the particles were about 10 nm average diameter and spherical shape. And the strong fluorescence signal would emit when exciting the solution of the nanoparticles by the light with appropriate wavelength. To our best knowledge, quantitative analysis of DNA is very important for medical and biological research [20-23]. A number of methods for the determination of DNA have been established. However, many of them require special reaction conditions. Here, we proposed a new spectrofluorimetric method to determine ct-DNA rapidly by fluorescence characteristic of the silver nanoparticles. In our work, we found that strong fluorescence signal generated from the silver nanoparticles solution can be quenched when a ct-DNA solution was added in. Based on these observations, a new spectrofluorimetric method was proposed for the determination of ct-DNA, with a wide linear range of 0.5 to 5.0 × 10 ng mL-1 and the detection limit of 0.3 ng mL-1.
2. Experimental
Fluorescence spectra were recorded on a F-4500 fluorescence spectrophotometer (Hitachi, Japan). Morphological measurement of the silver nanoparticles was performed by a JEM-100CX transmission electron microscopy (JEOL, Japan). XRD pattern of the silver nanoparticles was obtained by a DX-1000 X-ray powder diffractometer (Dandong, China). UV absorption spectrum was recorded on a UV-1100 spectrophotometer (Shanghai, China).
All reagents used were of analytical grade without any further purification. Calf thymus DNA (ct-DNA) was purchased from Sigma (U.S.). Silver nitrate and ammonia solution were purchased from Chengdu Chemical Reagent Corporation (Chengdu, China). Double distilled water was used throughout the experiment.
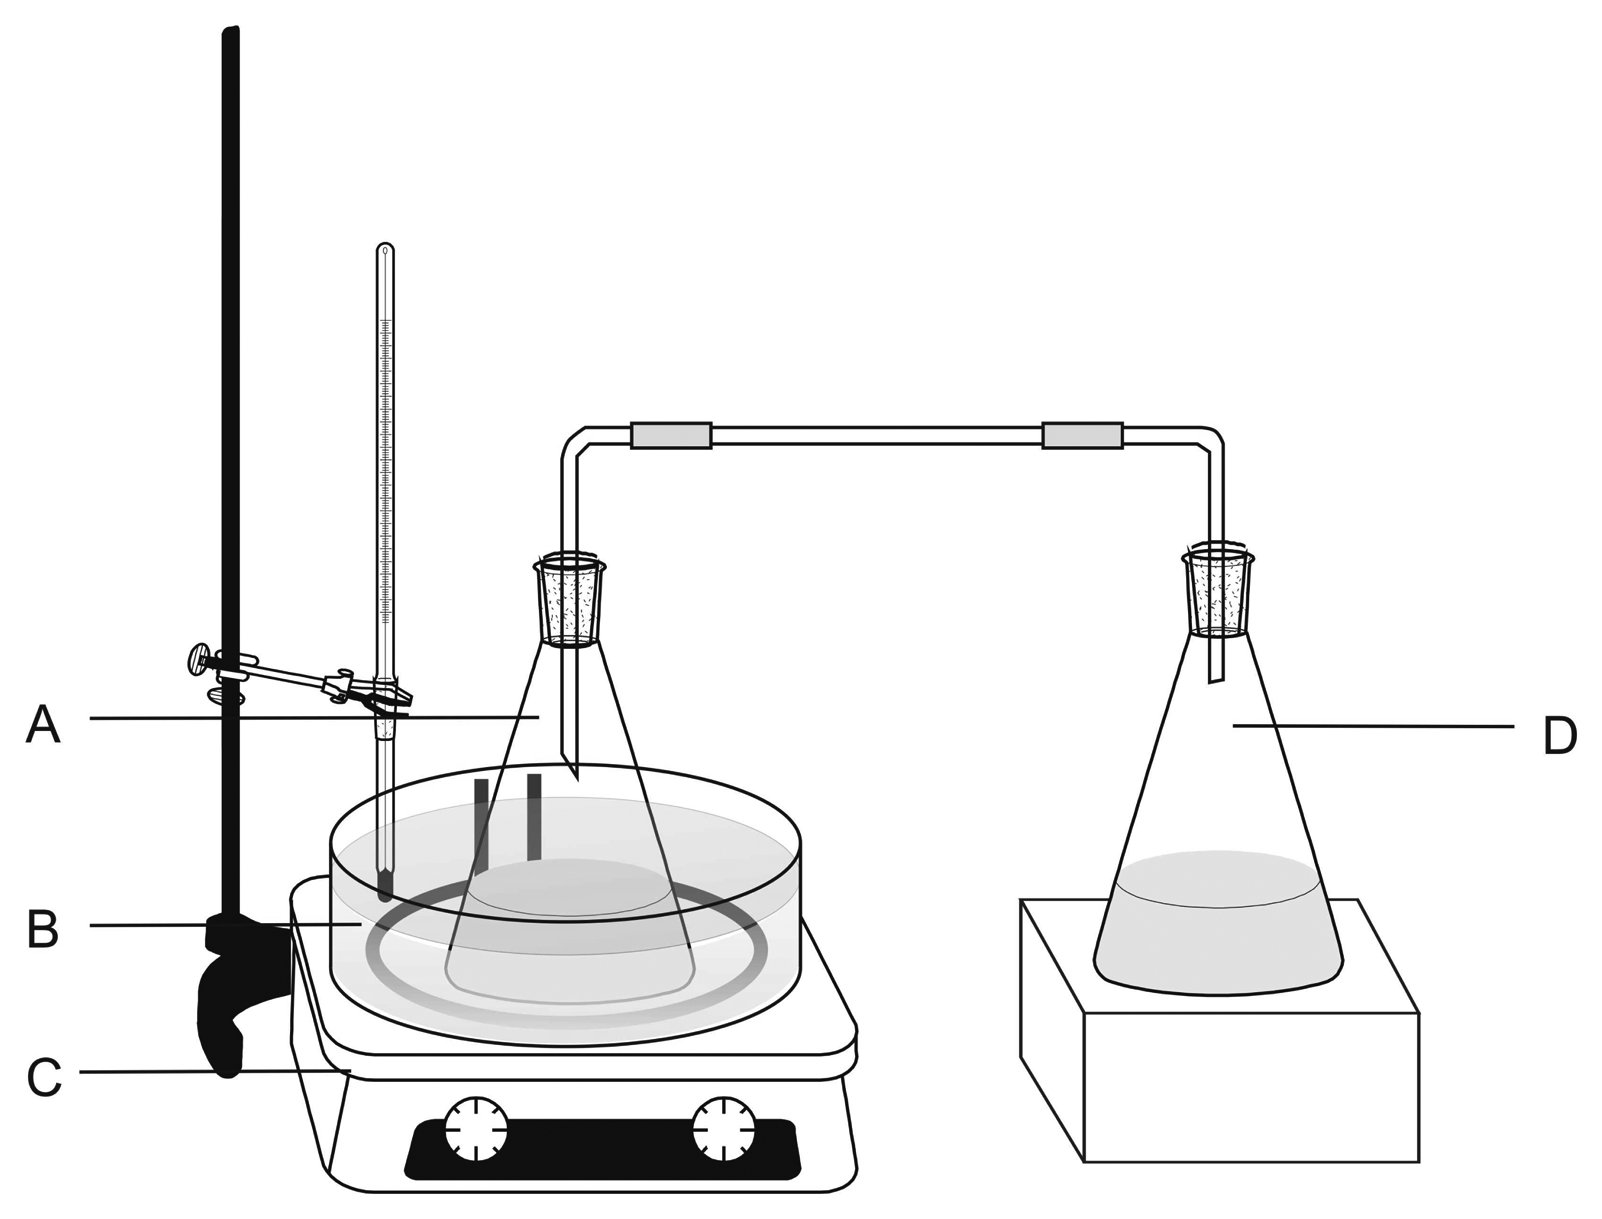
The apparatus used in the experiment is shown in Fig. 1. Added 50 mL silver nitrate solution (1.0 × 10⁻³ mol L-1) into a 500 mL flask (A), which was placed into a constant temperature water bath on a magnetic stirrer. Then 50 mL ammonia solution (1.0 mol L-1) was added into another 500 mL flask (D). Flasks A and D were connected with glass tubes and short pieces of rubber tubes, through which the ammonia gas in flask D volatilized and diffused slowly into the flask A and reacted with the silver nitrate solution. In all stirring procedures of preparing silver nanoparticles, the vessel was exposed to the light of a daylight lamp (40 W) at a distance of 100 cm. The whole experiment lasted 54 hours. The detailed procedure of preparing silver nanoparticles contained five steps: (1) keep the reaction 11 hours under stirring (~39 °C water bath); (2) keep the reaction for 13 hours without stirring and heating; (3) keep the reaction for 10 hours (conditions are same as step 1); (4) repeat the step 2; (5) keep the reaction for 7 hours (conditions are same as step 1). This synthetic method, which proposed in this work, was based on the following reactions:
3. Results and Discussion
3.1. Optimization of General Procedure
3.1.1. Effect of Reactant Concentrations
In the course of preparing silver nanoparticles, the concentration of silver nitrate solution and ammonia solution played an important role. The different experimental phenomena depended on the preparation conditions were listed in Table 1. Hence, their concentrations should be carefully optimized to ensure preparation success. Under the appropriate condition, the solution of nanoparticles should have strong fluorescence without any precipitation, which can not be observed when the concentrations of silver nitrate and ammonia solutions were too low or too high. Finally, the optimum concentrations of silver nitrate and ammonia solutions were set to 1.0 × 10⁻³ mol L-1 and 1.0 mol L-1, respectively. Under the optimum conditions, the produced particles exhibited highest fluorescence intensity and no precipitation occurred as listed in Table 1.
3.1.2. Effect of Reaction Time
Due to a significant effect of the reaction time of the preparation, different reaction time experiments were carried out. From Table 2, it is found that no precipitation and fluorescence were observed when the reaction time was less than 20 hours. The fluorescence began to appear after 20 hours' reaction and increased with the reaction time. However, the fluorescence intensity of nanoparticles was low between 20 and 40 hours. After reacting 60 hours, obvious precipitation occurred. Therefore, the optimum reaction time for the preparation was selected to be 54 hours.
3.2. Fluorescence Spectral Characteristics of the Silver Nanoparticles
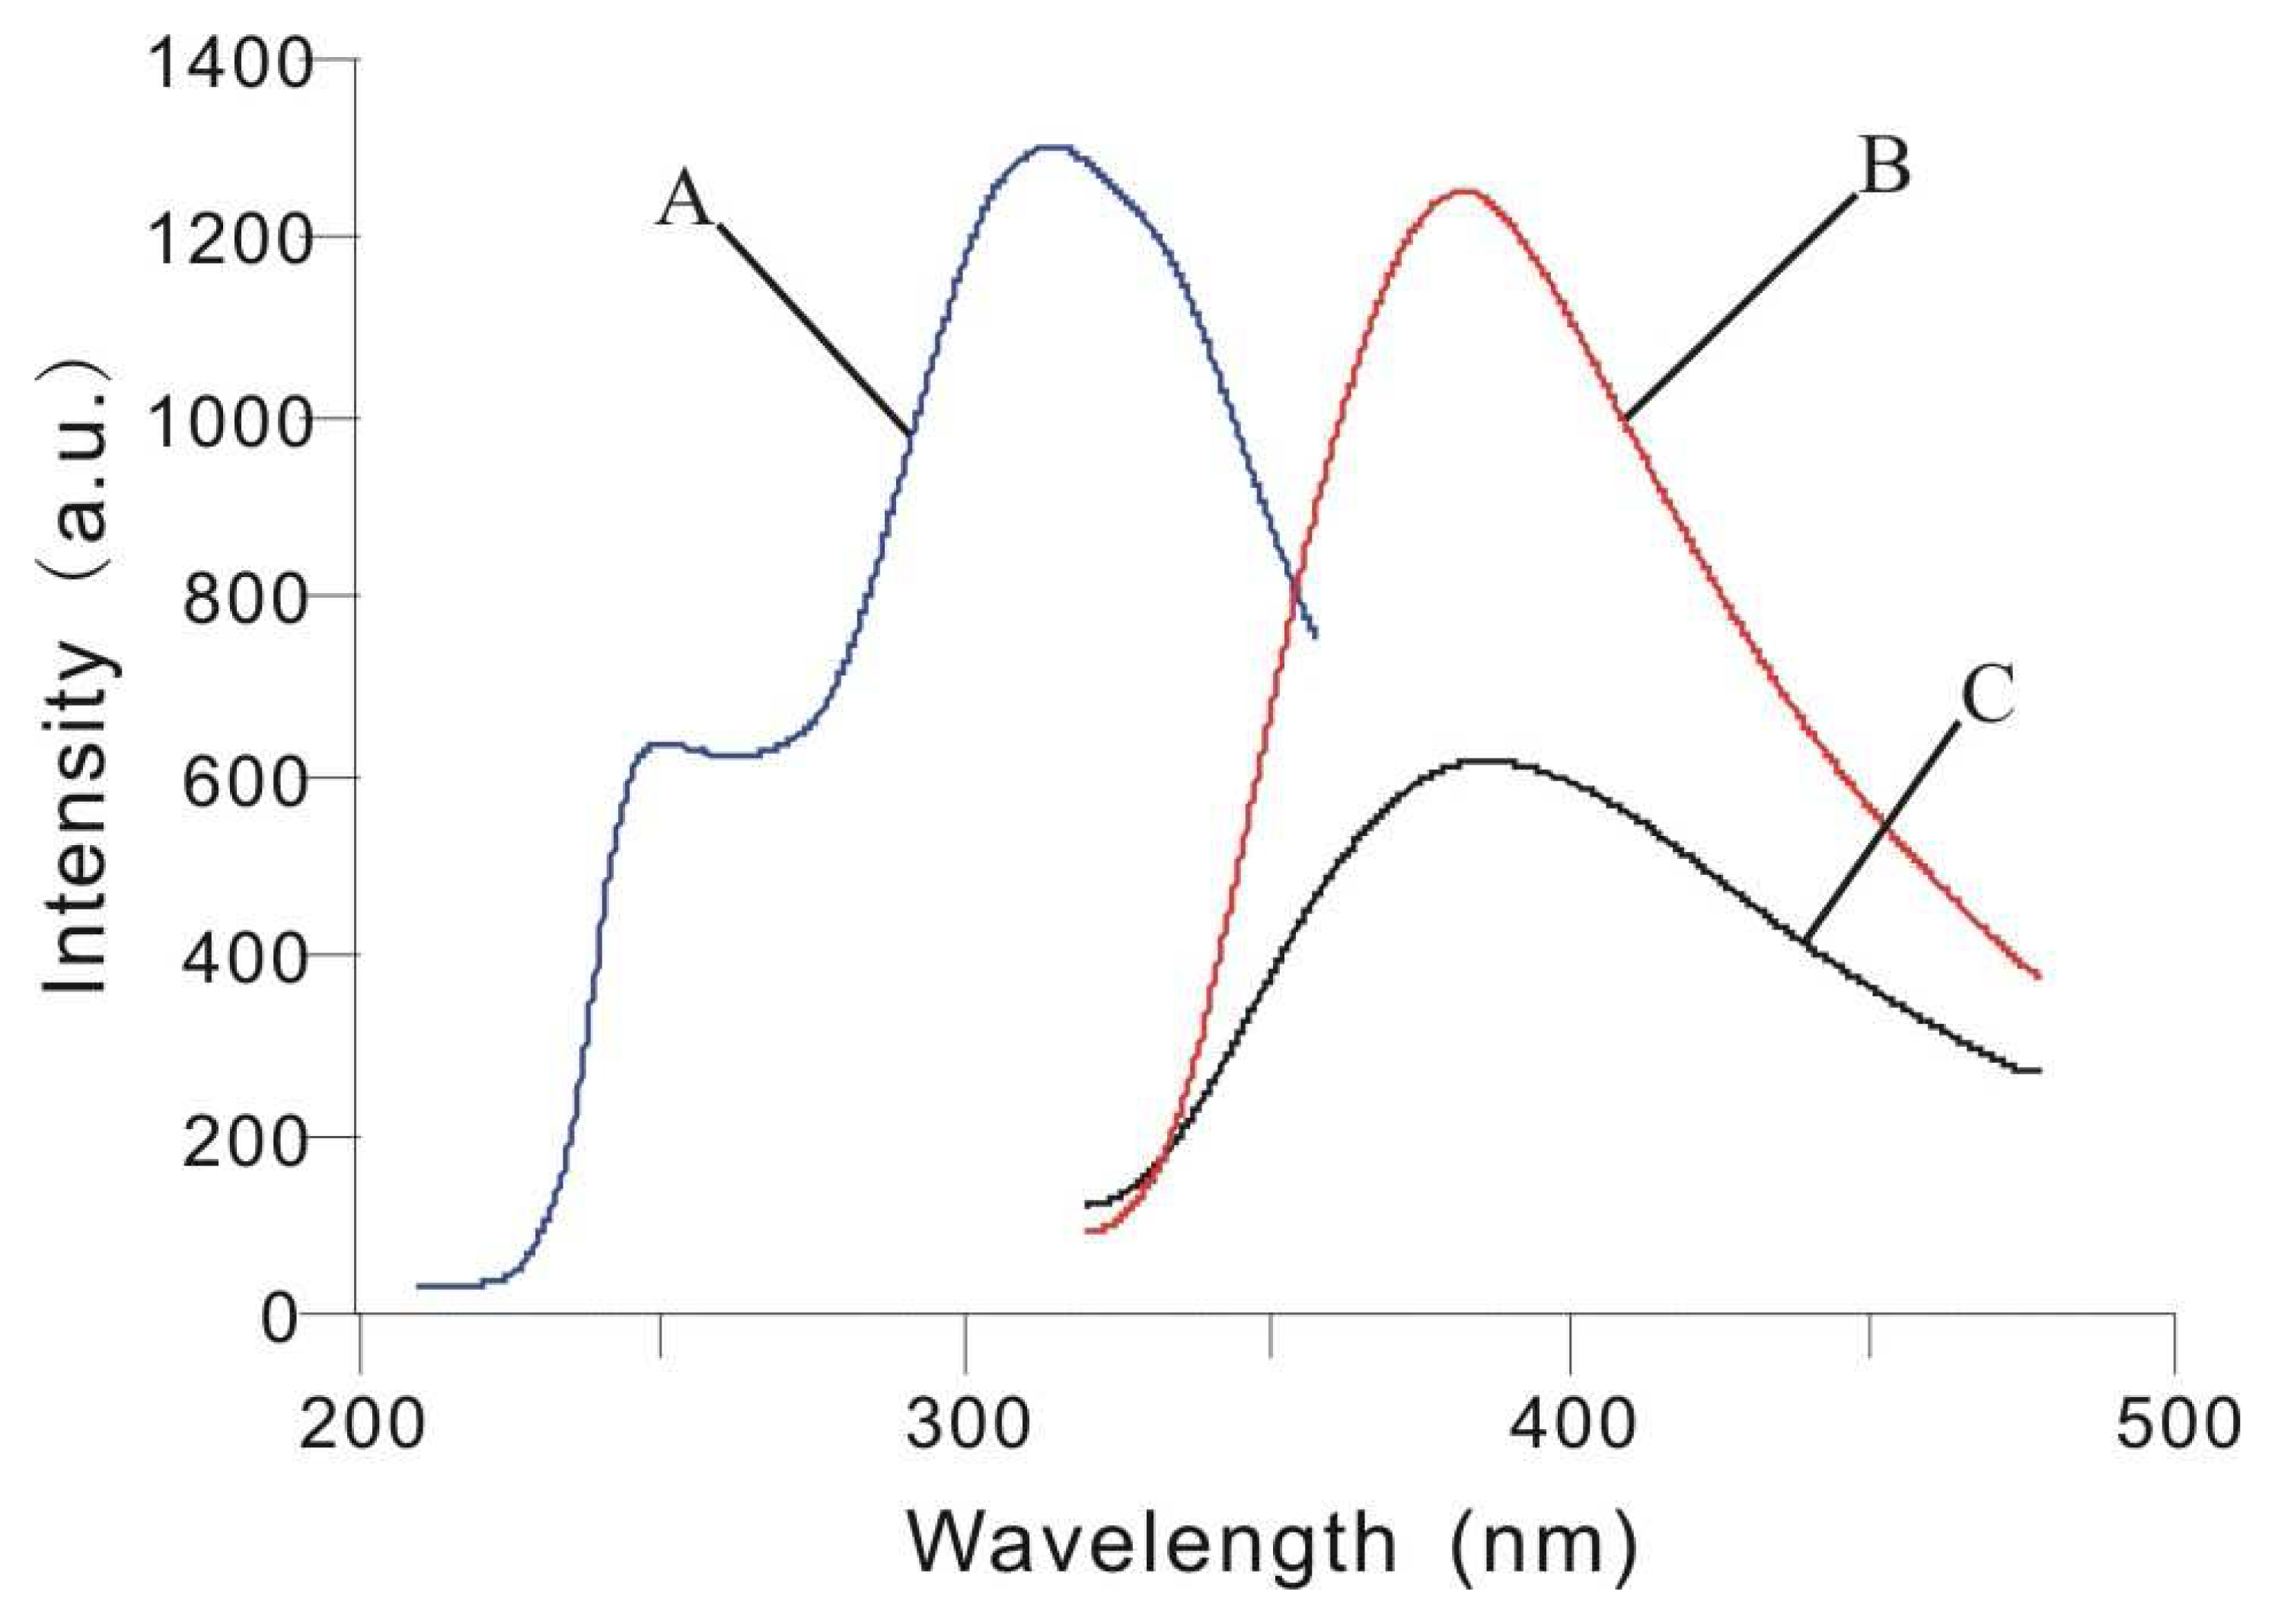
Fig. 2 shows the excitation and emission spectra of the silver nanoparticles. Two excitation peaks appeared at the wavelength of 239 and 314 nm respectively by emitting at 384 nm. In aqueous medium, the silver nanoparticles had a peak at 384 nm (curve C) with an excitation at 239 nm. Another emission peak (curve B) of the nanoparticles also occurred at 384 nm without any shift by changing excitation wavelength from 239 nm to 314 nm, which indicated that curve B and C were not scattering peaks but fluorescence peaks. The shape and intensity of the two peaks in excitation spectrum A are well in agreement with the curve B and C, respectively. In addition, no significant change was observed in the repetitive experiments within one month, which exhibited excellent stability of the nanoparticles.
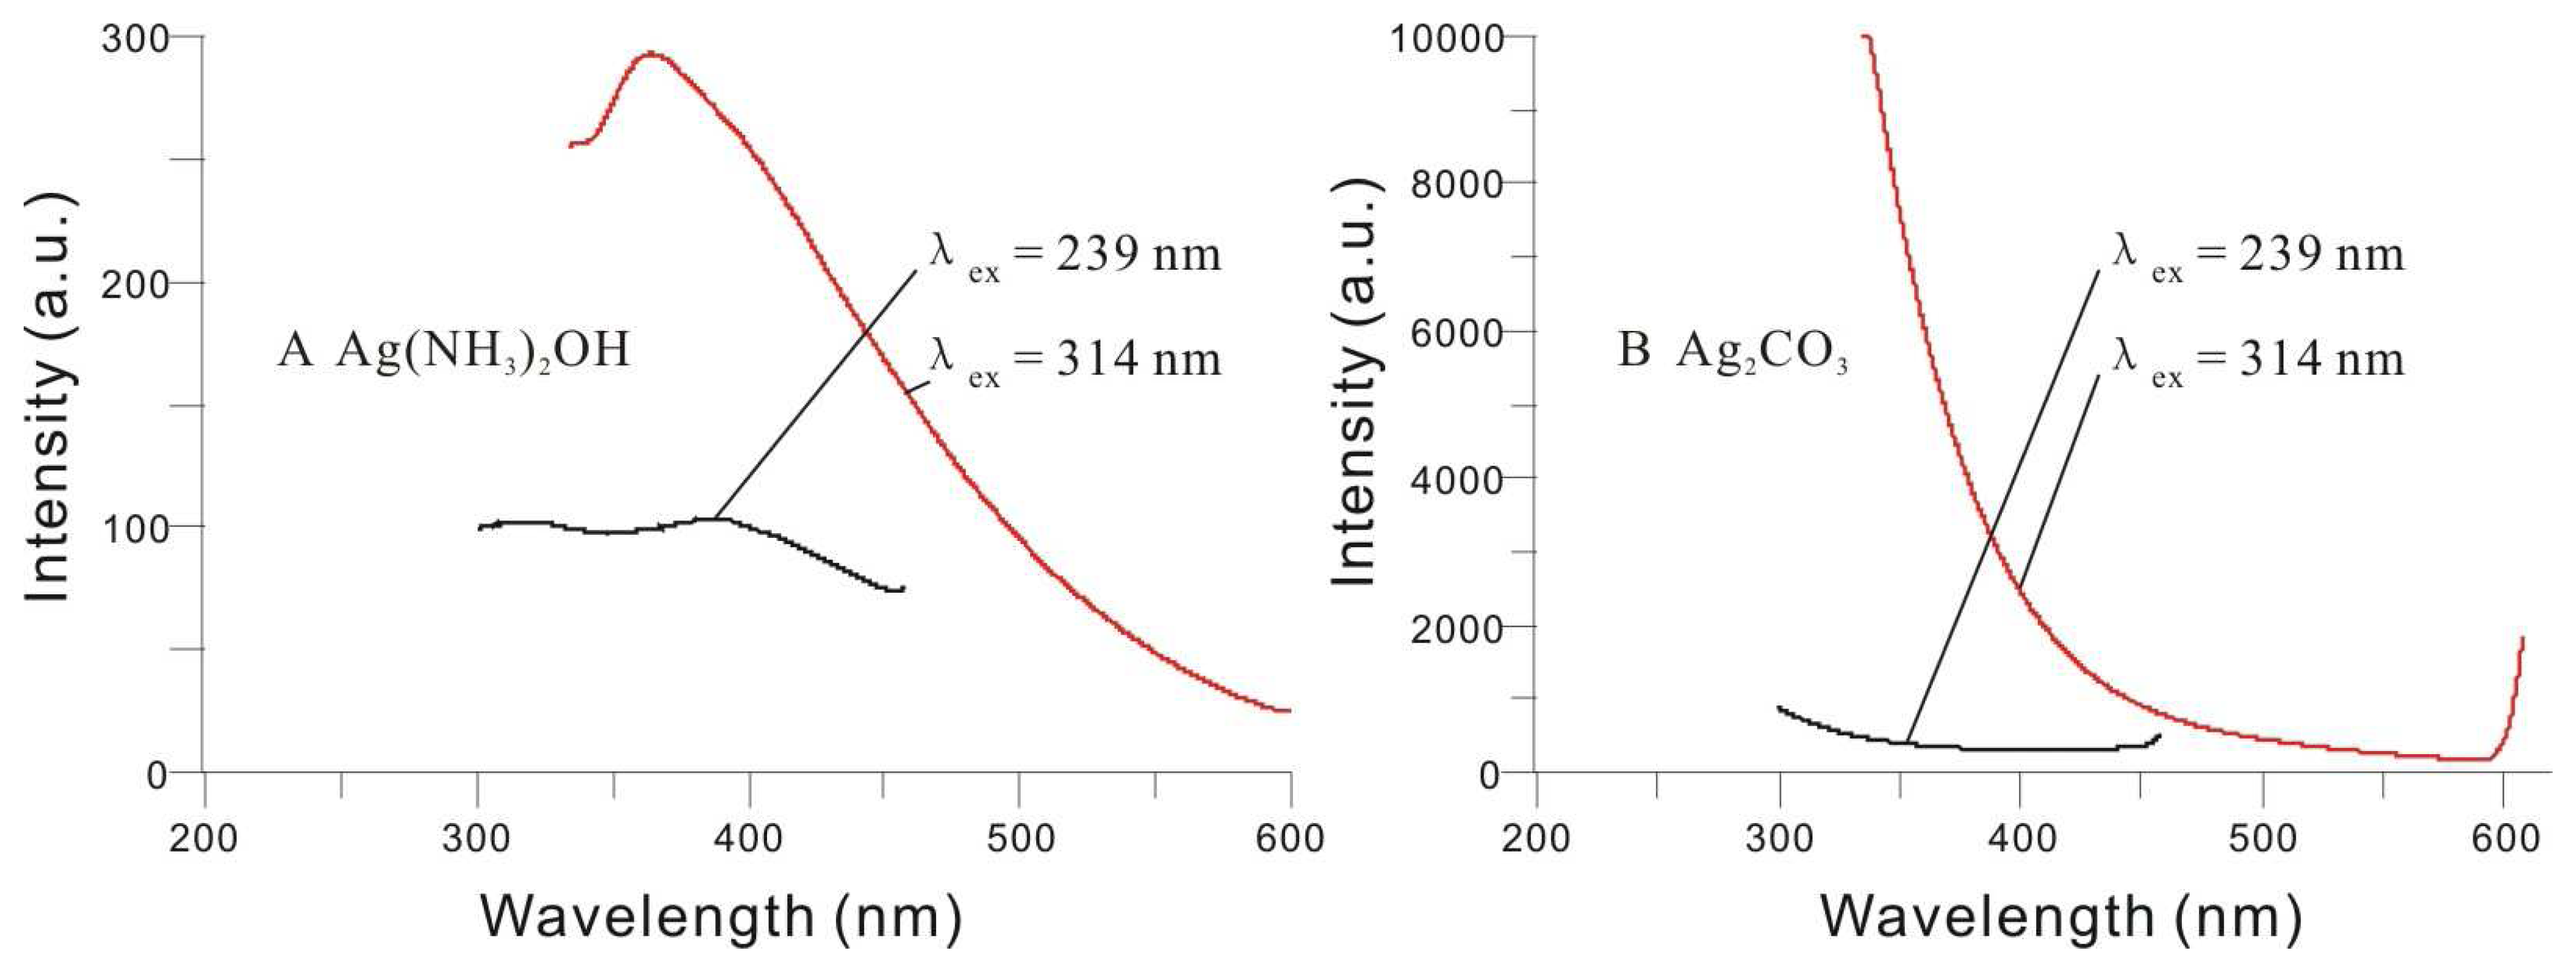
Fluorescence tests of regents used in the experiment and by-products were carried out in order to confirm the fluorescence emitted from the nanoparticles. In any spectrogram of Fig. 3, shape and location of the peak excited at 239 nm (black line) are all different from the peak excited at 314 nm (red line), which indicates all these peaks are scattering peaks but not fluorescence peaks. We also investigated spectra of possible by-products, Ag(NH3)2OH and Ag2CO3, as shown in Fig. 4. For the same reason, the peaks are not fluorescence peaks either. By thorough analysis, we excluded the possibility of fluorescence emitted from regents and possible by-products.
3.3. TEM, ED and XRD Analysis
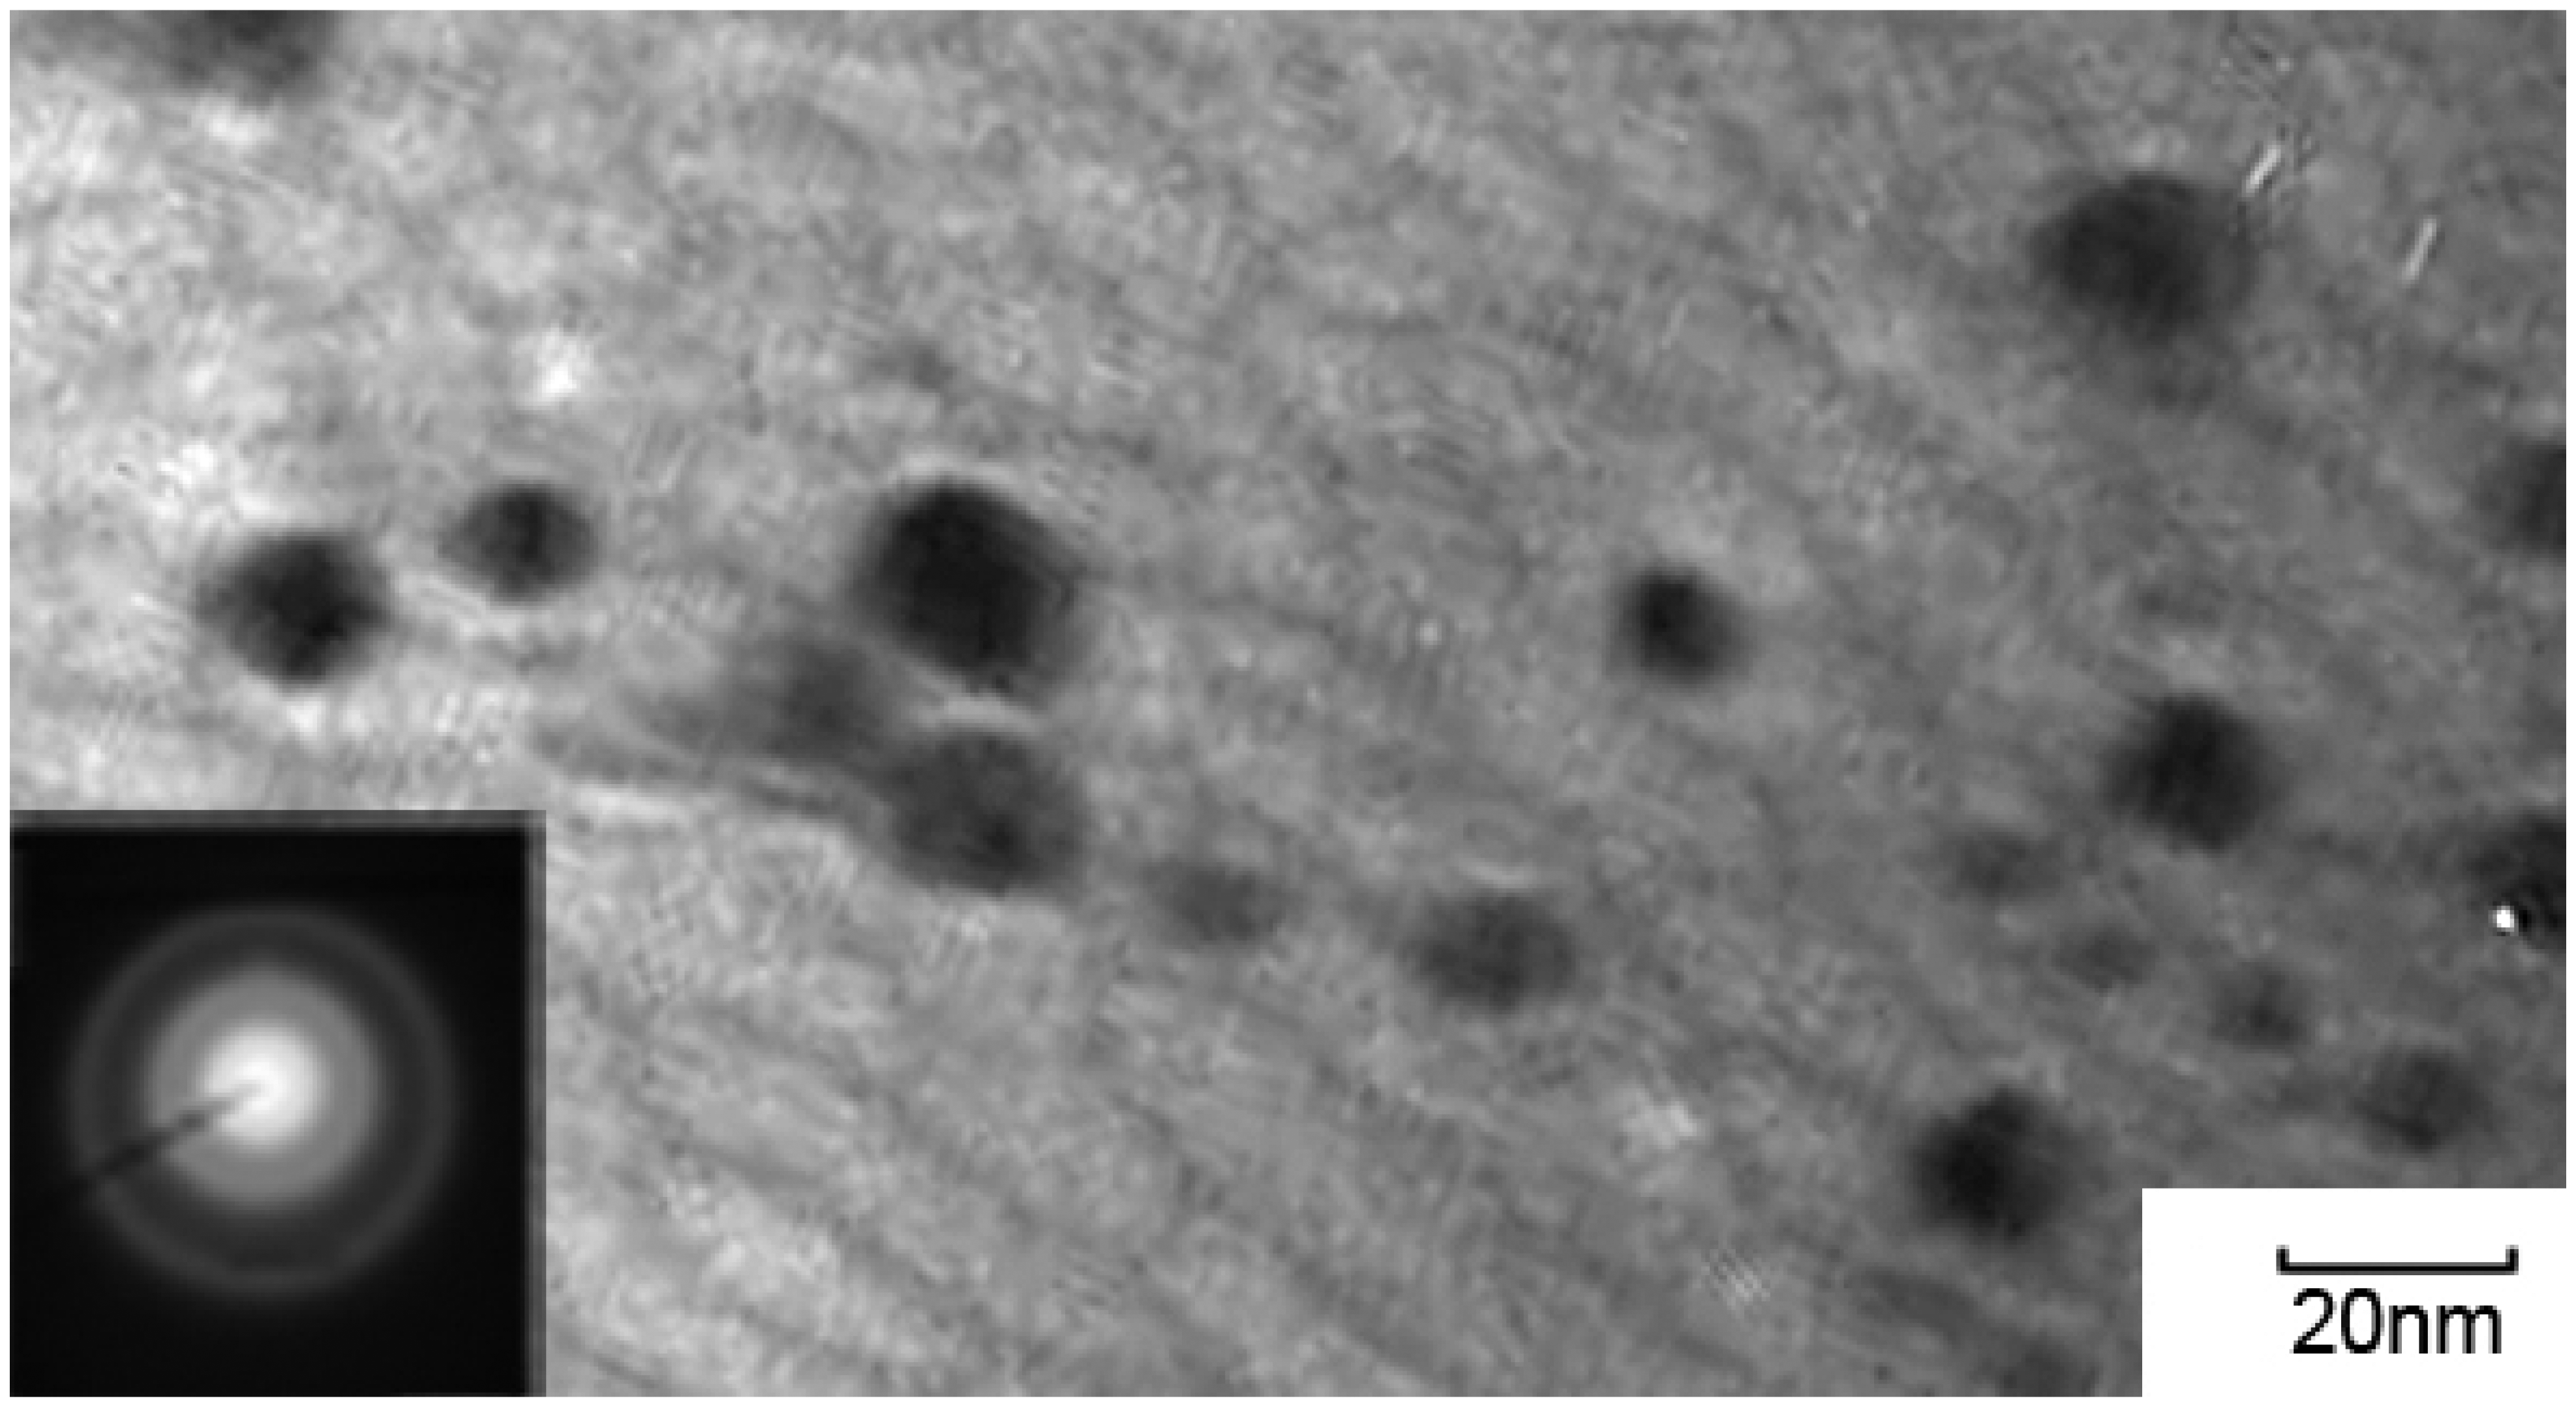
The size and morphology of particles were investigated by TEM (transmission electron microscope) and ED (electron diffraction) (Fig. 5). The TEM image indicates that the silver particles are about 10 nm average diameter and spherical shape. And ED image reveals that the silver nanoparticles are polycrystalline structure.
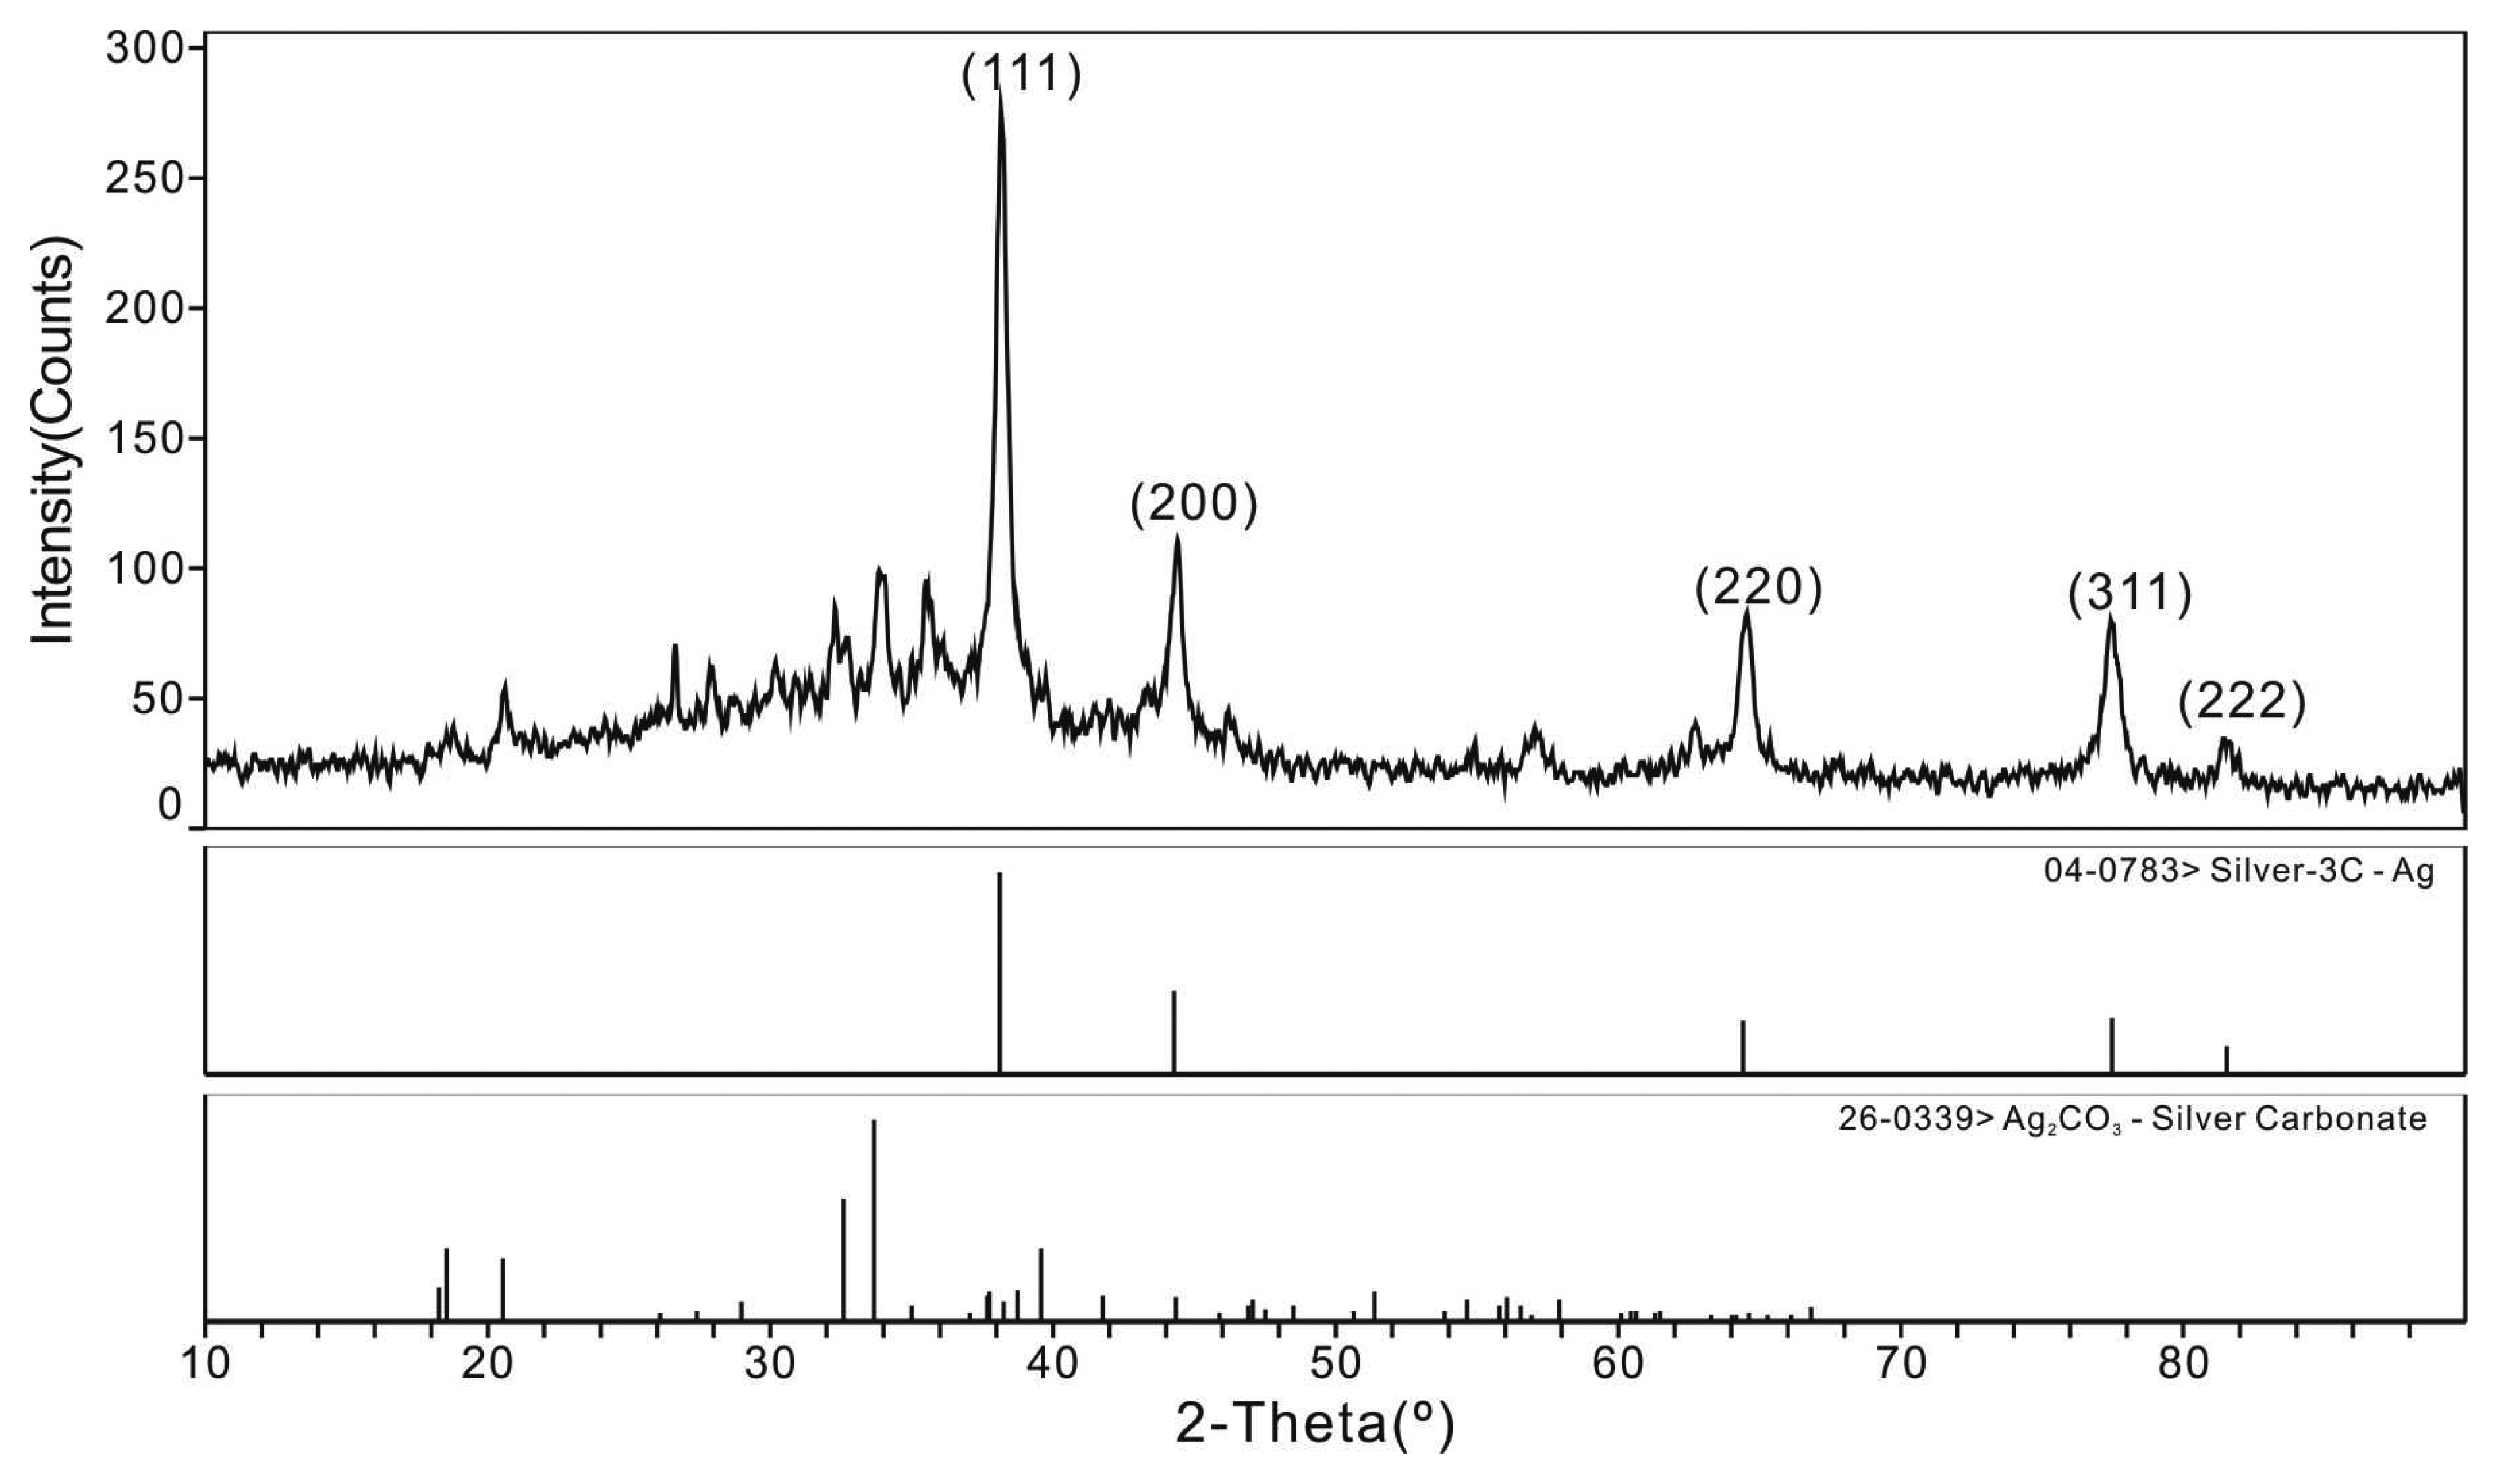
The typical powder XRD pattern of the prepared nanoparticles is shown in Fig. 6. The data shows diffraction peaks at 2θ = 38.2°, 44.4°, 64.6°, 77.5°, and 81.7°, which can be indexed to (111), (200), (220), (311), and (222) planes of pure silver (PDF № 04-0783). It confirmed that the main composition of the nanoparticles was silver. It is also found that there are some little peaks which match with the standard XRD data of Ag2CO3 (PDF № 26-0339). The silver carbonate formation may be attributed to carbon dioxide in atmosphere. Therefore the product should be preserved in an airproof condition.
3.4. Determination of ct-DNA
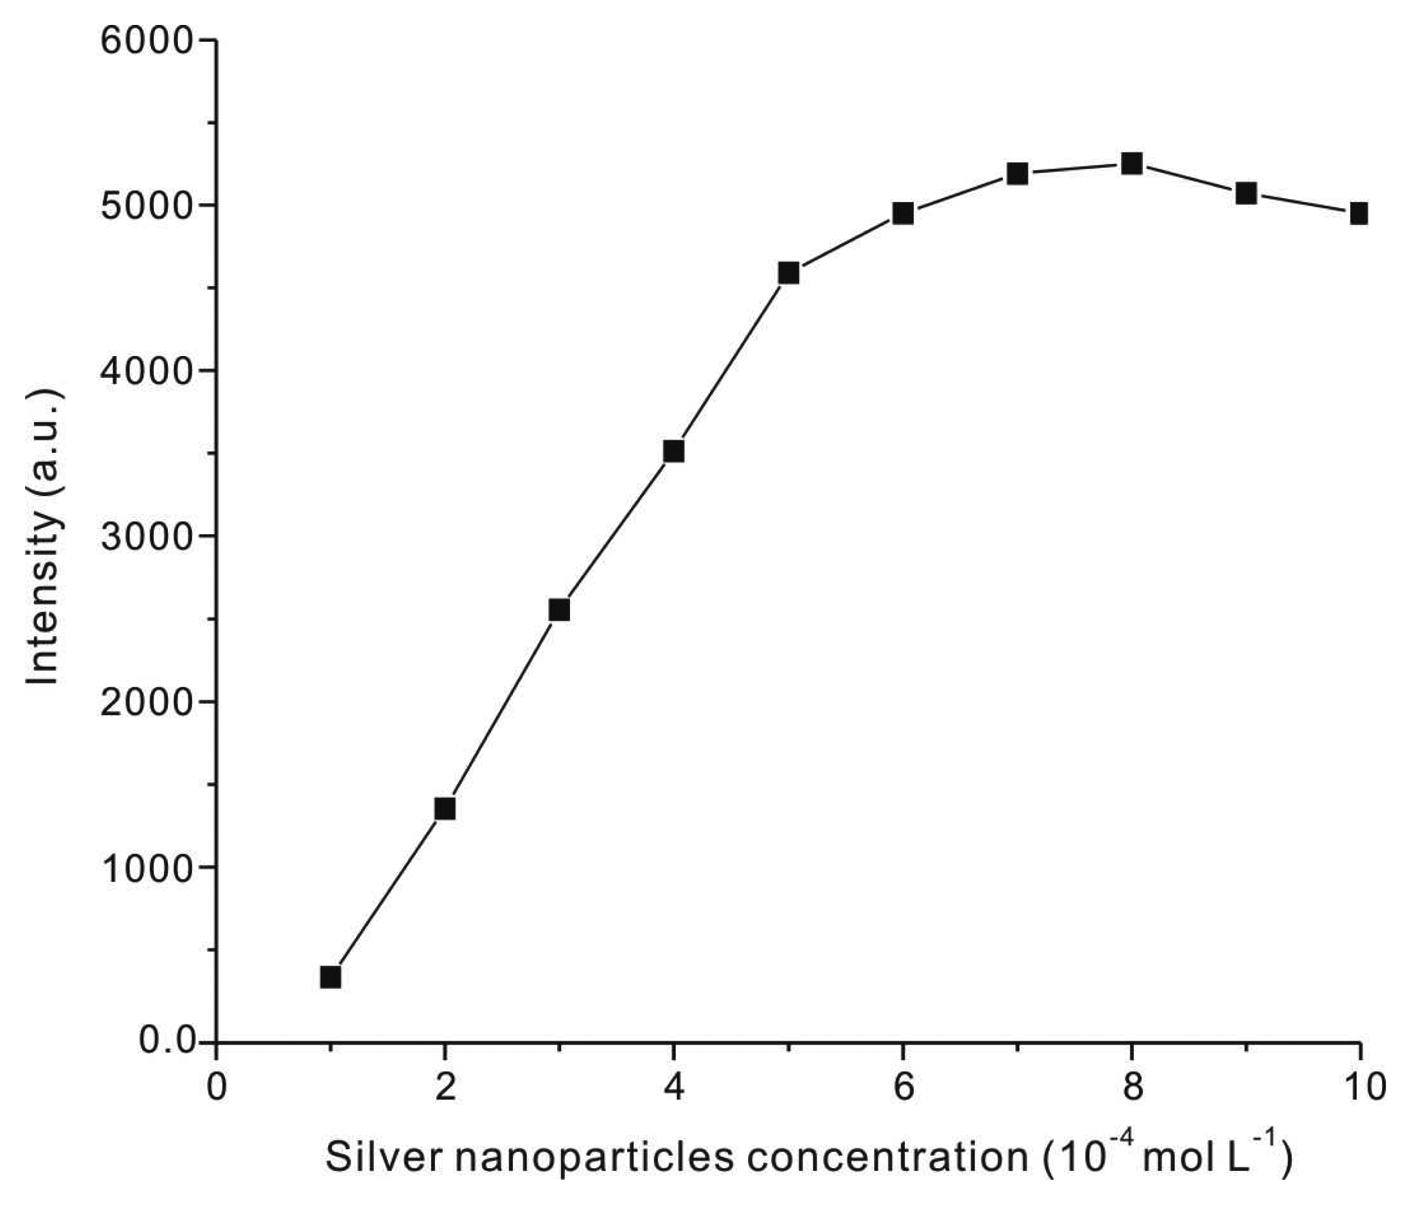
As shown in Fig. 7, the effect of the concentration of the silver nanoparticles has also been investigated. At the beginning, with increasing the concentration of the nanoparticles solution, the fluorescence intensity of the system increased. However, the intensity increased very slightly after the concentration of the nanoparticles reached 5.0 × 10⁻⁴ mol L-1, and it dropped slowly when the concentration of nanoparticles reached 8.0 × 10⁻⁴ mol L-1.
When the concentration of the nanoparticles solution was low, the fluorescence intensity decreased which resulted in narrow linear range of detection of ct-DNA. However, sensitivity can be improved because of obvious quenching response to adding little ct-DNA. Increasing the concentration of the nanoparticles solution to a high value, the enhanced fluorescence led to a wide linear range of detection with sensitivity reducing. At last, in order to acquire both high sensitivity, and wide linear range, the nanoparticles concentration of 5.0 × 10⁻⁴ mol L-1 is recommended.
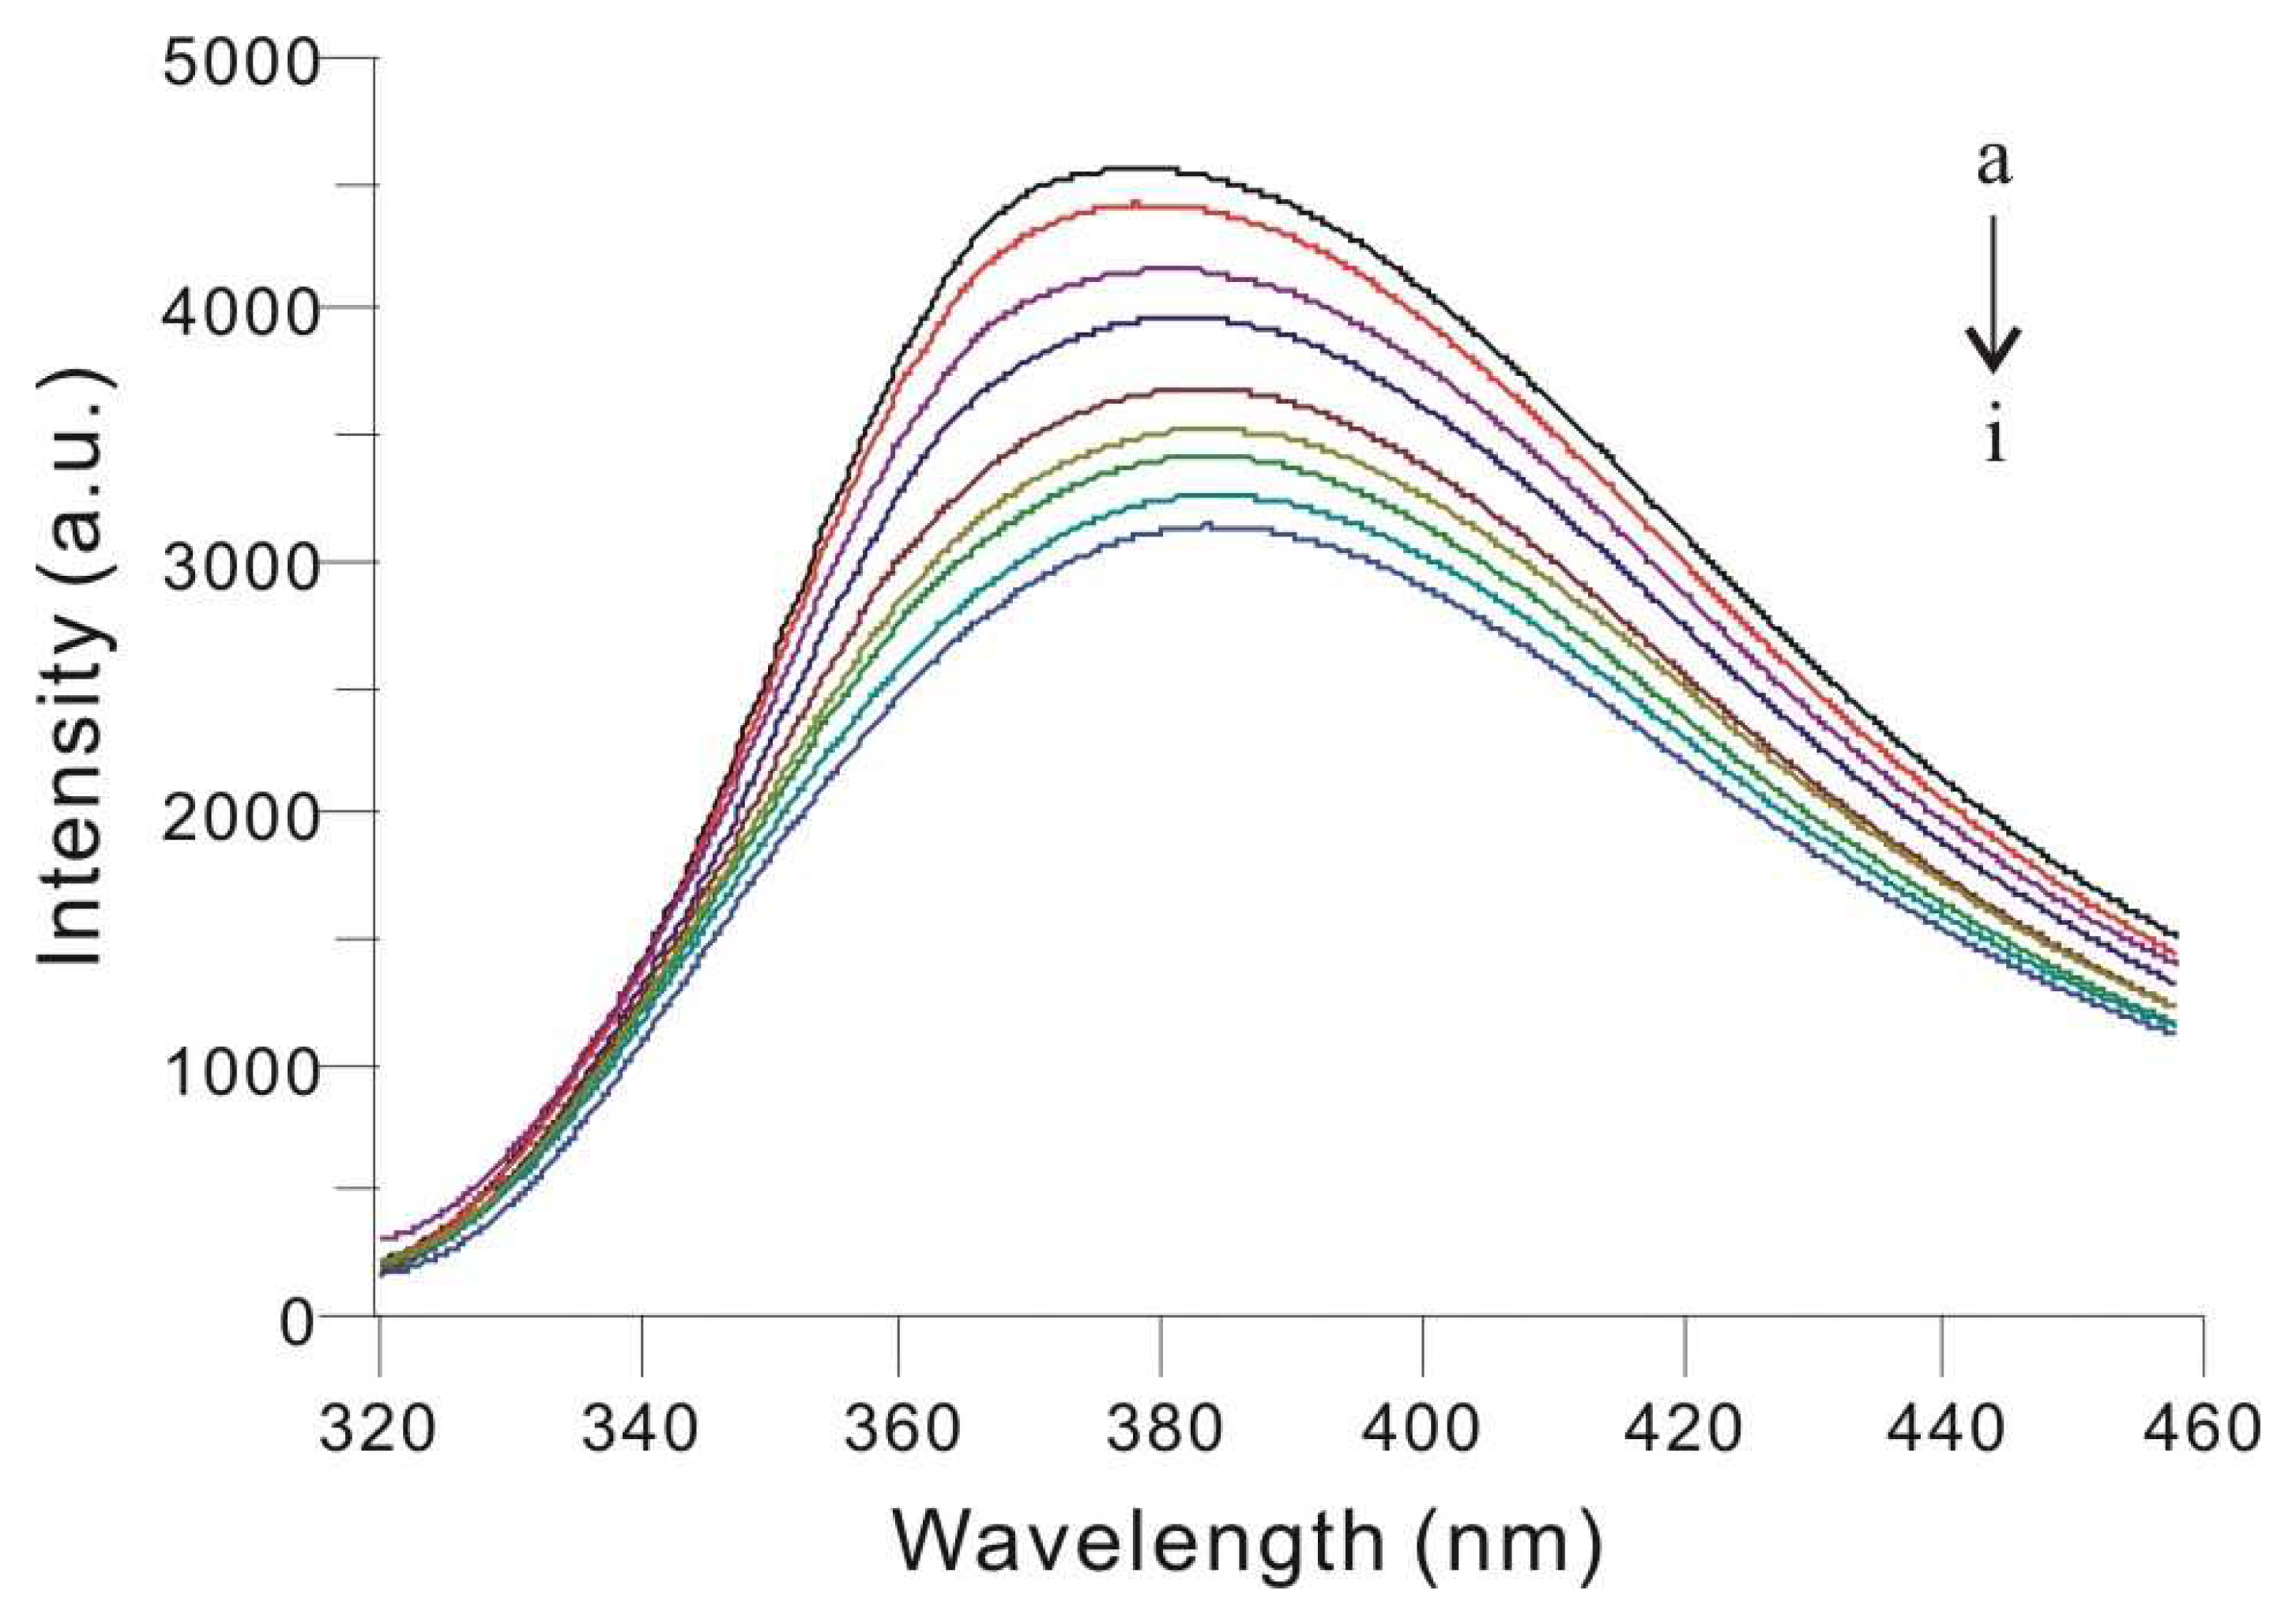
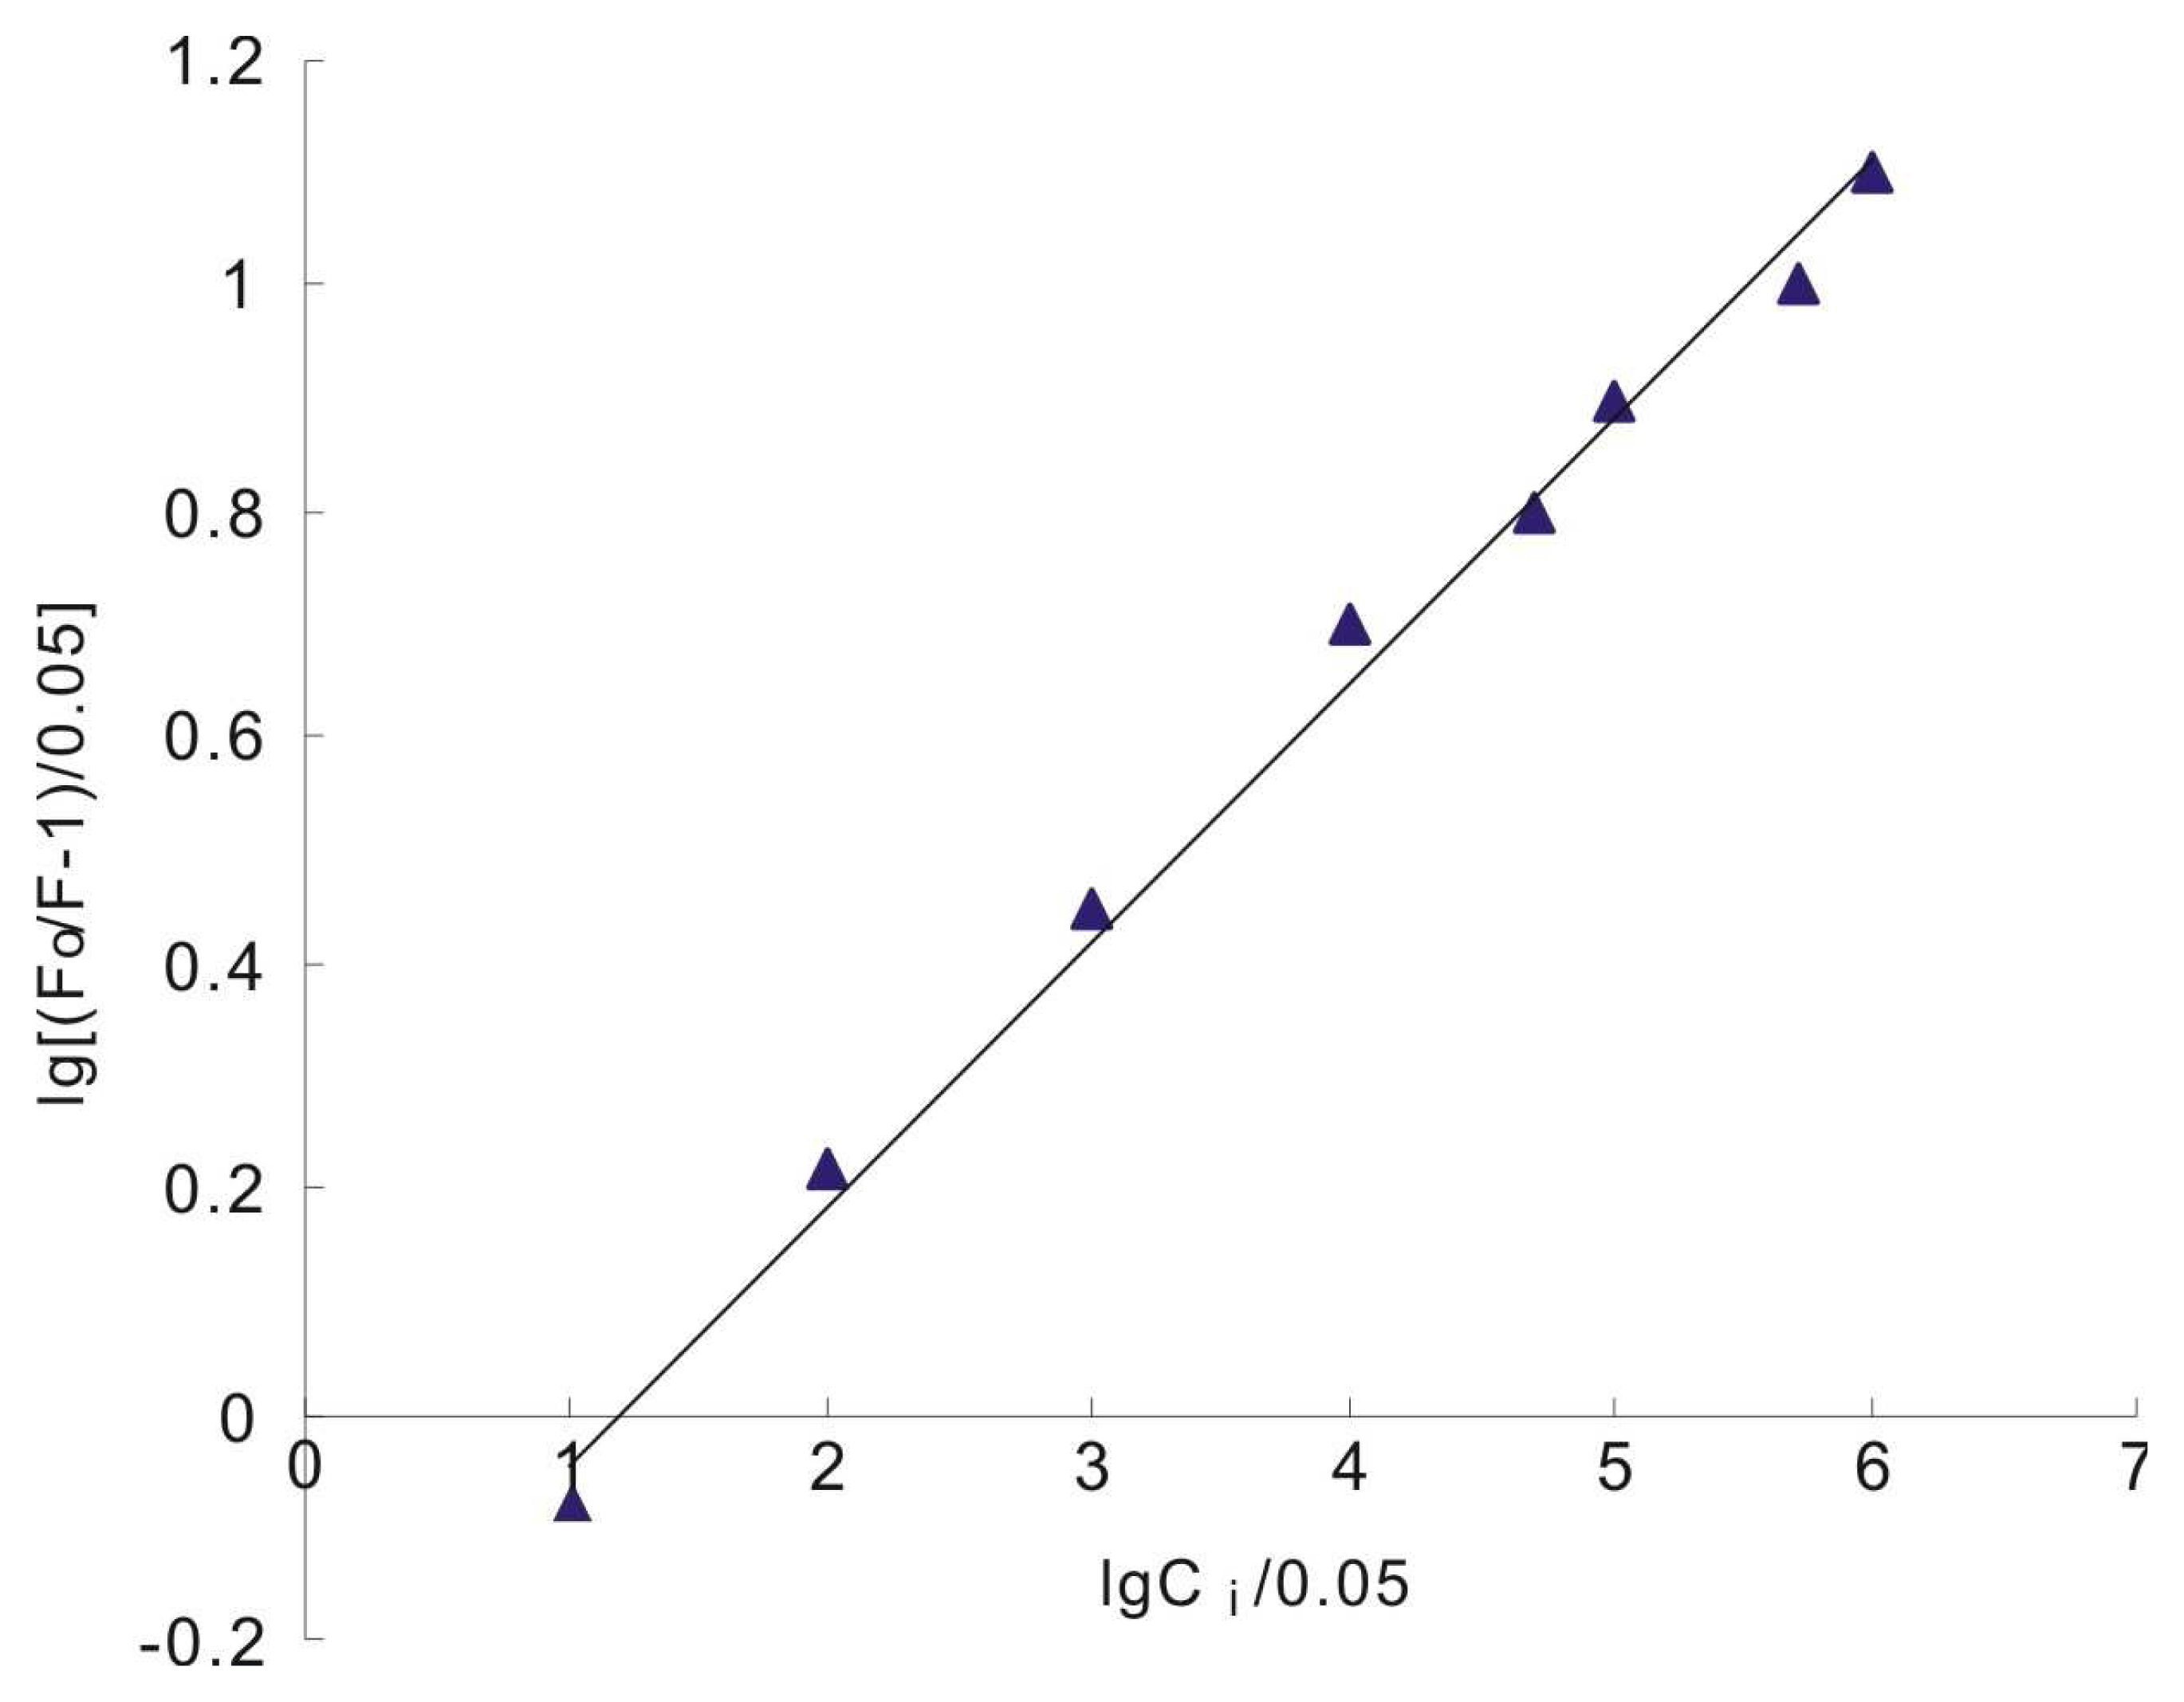
Under the optimum conditions defined, spectra of fluorescence quenching of the nanoparticles solutions containing different concentrations of ct-DNA are shown in Fig. 8. The strong fluorescence of silver nanoparticles can be quenched in the presence of ct-DNA (shown in Fig. 8 b-i). As can be seen in Fig. 9, the linear detection range from 0.5 to 5.0 × 10⁴ ng mL-1 was achieved. The calibration equation of the best fitted line was lg[(F0/F−1)/0.05]=0.2319lg(Ci/0.05)–0.2777, with a correlation coefficient of 0.9953 (n = 11, RSD = 3.6 %), and a detection limit of 0.3 ng mL-1. F0 and F were the fluorescence intensities before and after the addition of ct-DNA, respectively, and Ci was the concentration of ct-DNA.
3.5. Energy Transfer between the Silver Nanoparticles and ct-DNA
The overlap of the UV absorption spectrum of ct-DNA with the fluorescence emission spectrum of the nanoparticles is shown in Fig. 10. It is found that there is an intersection of UV absorption spectrum and fluorescence emission spectrum. Thus the energy transfer from nanoparticles to ct-DNA can be happened, which can lead to the quenching of fluorescence. The more clear mechanism of the fluorescence quenching in this experiment still requires further study, which is on progress in our lab.
3.6 Interference of the Coexisting Foreign Substances
The influences of foreign coexisting substances such as bovine serum albumin, glucose, amino acid and ions were tested. As listed in Table 3, most of the examined coexisting substances had no remarkable interference on the assay. From the results, we can see that interference of bovine serum albumin, amino acid and glucose were very weak. Among the tested ions, Mg2+, Zn2+, Fe3+, Ca2+, SO42-, Cl- and I- can be allowed with relatively higher concentrations, but Cu2+ and PO43- ions can only be allowed with relatively low concentrations. The allowed concentrations of these interfering substances, however, were still rather higher than that of ct-DNA, which indicated that this method had a high selectivity.
4. Conclusions
In summary, silver nanoparticles were prepared by the gas-solution reaction of silver nitrate solution and ammonia gas. The silver nanoparticles were about 10 nm average diameters and spherical shape. The fluorescence of silver nanoparticles was quenched by adding ct-DNA, which provided a simple and rapid spectrofluorimetric method for the determination of ct-DNA. The linear range of concentration of ct-DNA was 0.5–5.0×10⁴ ng mL-1 and the limit of detection was 0.3 ng mL-1.
Acknowledgments
This work was supported by the National Natural Science Foundation of China (20575042) and the Science Foundation of the Chinese Education Commission (105141).
References
- Yin, B.; Ma, H.; Wang, S.; Chen, S. Electrochemical synthesis of silver nanoparticles under protection of poly(N-vinylpyrrolidone). J. Phys. Chem. B. 2003, 107, 8898–8904. [Google Scholar]
- Penner, R.M. Mesoscopic metal particles and wires by electrodeposition. J. Phys. Chem. B. 2002, 106, 3339–3353. [Google Scholar]
- Raveendran, P.; Fu, J.; Wallen, S.L. Completely “green” synthesis and stabilization of metal nanoparticles. J. Am. Chem. Soc. 2003, 125, 13940–13941. [Google Scholar]
- Lin, X.Z.; Teng, X.; Yang, H. Direct synthesis of narrowly dispersed silver nanoparticles using a single-source precursor. Langmuir 2003, 19, 10081–10085. [Google Scholar]
- Carotenuto, G. Synthesis and characterization of poly(N-vinylpyrrolidone) filled by monodispersed silver clusters with controlled size. Appl. Organometal. Chem. 2001, 15, 344–351. [Google Scholar]
- Okitsu, K.; Yue, A.; Tanabe, S.; Matsumoto, H. Sonochemical preparation and catalytic behavior of highly dispersed palladium nanoparticles on alumina. Chem. Mater. 2000, 12, 3006–3011. [Google Scholar]
- Ghosh, K.; Maiti, S.N. Mechanical properties of silver-powder-filled polypropylene composites. J. Appl. Polym. Sci. 1996, 60, 323–331. [Google Scholar]
- Nersisyan, H.H.; Lee, J.H.; Son, H.T.; Won, C.W.; Maeng, D.Y. A new and effective chemical reduction method for preparation of nanosized silver powder and colloid dispersion. Mater. Res. Bull. 2003, 38, 949–956. [Google Scholar]
- Rabin, I.; Schulze, W.; Ertl, G.; Felix, C.; Sieber, C.; Harbich, W.; Buttet, J. Absorption and fluorescence spectra of Ar-matrix-isolated Ag3 clusters. J. Chem. Phys. Lett. 2000, 320, 59–64. [Google Scholar]
- Geddes, C.D.; Parfenov, A.; Gryczynski, I.; Lakowicz, J.R. Luminescent blinking from silver nanostructures. J. Phys. Chem. B. 2003, 107, 9989–9993. [Google Scholar]
- Jiang, Z.; Yuan, W.; Pan, H. Luminescence effect of silver nanoparticle in water phase. Spectrochim. Acta A. 2005, 61, 2488–2494. [Google Scholar]
- Maali, A.; Cardinal, T.; Tréguer-Delapierre, M. Intrinsic fluorescence from individual silver nanoparticles. Physica E. 2003, 17, 559–560. [Google Scholar]
- Evanoff, D.D., Jr.; Chumanov, G. Size-controlled synthesis of nanoparticles. 1. “silver-only” aqueous suspensions via hydrogen reduction. J. Phys. Chem. B. 2004, 108, 13948–13956. [Google Scholar]
- Hailstone, R.K. Computer simulation studies of silver cluster formation on AgBr microcrystals. J. Phys. Chem. 1995, 99, 4414–4428. [Google Scholar]
- Shiraishi, Y.; Toshima, N. Colloidal silver catalysts for oxidation of ethylene. J. Mol. Catal. A: Chem. 1999, 141, 187–192. [Google Scholar]
- Sclafani, A.; Mozzanega, M.; Pichat, P. Effect of silver deposits on the photocatalytic activity of titanium dioxide samples for the dehydrogenation or oxidation of 2-propanol. J. Photochem. Photobiol. A: Chem. 1991, 59, 181–189. [Google Scholar]
- Tada, H.; Teranishi, K.; Inubushi, Y.-i.; Ito, S. Ag nanocluster loading effect on TiO2 photocatalytic reduction of bis(2-dipyridyl)disulfide to 2-mercaptopyridine by H2O. Langmuir 2000, 16, 3304–3309. [Google Scholar]
- Shirtcliffe, N.; Nickel, U.; Schneider, S. Reproducible preparation of silver sols with small particle size using borohydride reduction: for use as nuclei for preparation of larger particles. J. Colloid. Interface. Sci. 1999, 211, 122–129. [Google Scholar]
- Bright, R.M.; Musick, M.D.; Natan, M.J. Preparation and characterization of Ag colloid monolayers. Langmuir 1998, 14, 5695–5701. [Google Scholar]
- Wang, X.M.; Li, Y.; Gong, S.J.; Fu, D.G. A spectroscopic study on the DNA binding behavior of the anticancer drug dacarbazine. Spectrosc. Lett. 2002, 35, 751–756. [Google Scholar]
- Park, S.J.; Taton, T. A.; Mirkin, C. A. Arry-based electrical detection of DNA with nanoparticle. Scienc. 2002, 295, 1503–1506. [Google Scholar]
- Li, J.; Xue, M.; Wang, H.; Cheng, L.; Gao, L.; Lu, Z.; Chan, M. Amplifying the electrical hybridization signals of DNA array by multilayer assembly of Au nanoparticles probes. Analyst 2003, 128, 917–923. [Google Scholar]
- Zhang, Y.; Kim, H.H.; Heller, A. Enzyme-amplified amperometric detection of 3000 copies of DNA in a 10 μL droplet. Anal. Chem. 2003, 75, 3267–3269. [Google Scholar]
Figure 1.
Apparatus for silver nanoparticles synthesis (A. conical flask with AgNO3 solution; B. constant temperature water bath; C. magnetic stirrer; D. conical flask with NH3.H2O).
Figure 1.
Apparatus for silver nanoparticles synthesis (A. conical flask with AgNO3 solution; B. constant temperature water bath; C. magnetic stirrer; D. conical flask with NH3.H2O).

Figure 2.
Fluorescence spectra of silver nanoparticles (A. excitation spectra emitted at 384 nm; B. emission spectra excited at 314 nm; C. emission spectra excited at 239 nm).
Figure 2.
Fluorescence spectra of silver nanoparticles (A. excitation spectra emitted at 384 nm; B. emission spectra excited at 314 nm; C. emission spectra excited at 239 nm).

Figure 3.
Scattering spectra of reagents (Red lines represent peaks excited at 314 nm, and black lines represent peaks excited at 239 nm. A. H2O; B. AgNO3; C. NH3.H2O).
Figure 3.
Scattering spectra of reagents (Red lines represent peaks excited at 314 nm, and black lines represent peaks excited at 239 nm. A. H2O; B. AgNO3; C. NH3.H2O).

Figure 4.
Scattering spectra of Ag(NH3)2OH and Ag2CO3 (Red lines represent peaks excited at 314 nm, and black lines represent peaks excited at 239 nm).
Figure 4.
Scattering spectra of Ag(NH3)2OH and Ag2CO3 (Red lines represent peaks excited at 314 nm, and black lines represent peaks excited at 239 nm).

Figure 5.
TEM image and the corresponding ED pattern (inset) of silver nanoparticles sample.

Figure 6.
XRD pattern of the silver nanoparticles.

Figure 7.
Effect of the concentration of the silver nanoparticles on the relative fluorescence intensity.
Figure 7.
Effect of the concentration of the silver nanoparticles on the relative fluorescence intensity.

Figure 8.
Fluorescence quenching of the nanoparticles solutions containing different concentrations of ct-DNA. λem = 384 nm. The nanoparticles concentration (mol L-1): 5.0×10⁻⁴. ct-DNA concentration (ng mL-1 ): a.0; b. 0.5; c. 5.0; d. 5.0×10; e. 5.0×10²; f. 2.5×10³; g. 5.0×10³; h. 2.5×10⁴; i. 5.0×10⁴.

Figure 9.
Plot of fluorescence of silver nanoparticles solution quenching by ct-DNA (The nanoparticles concentration: 5.0×10⁻⁴ mol L-1).
Figure 9.
Plot of fluorescence of silver nanoparticles solution quenching by ct-DNA (The nanoparticles concentration: 5.0×10⁻⁴ mol L-1).

Figure 10.
The overlap of the fluorescence spectrum of the silver nanoparticles (λem = 384 nm) (A) with the absorption spectrum of ct-DNA (B).
Figure 10.
The overlap of the fluorescence spectrum of the silver nanoparticles (λem = 384 nm) (A) with the absorption spectrum of ct-DNA (B).


| No. | Reagents | Concentration (mol L-1) | Phenomena | |
|---|---|---|---|---|
| Precipitation | Fluorescence | |||
| 1 | AgNO3 | 1.0 × 10⁻⁵ | No | No |
| NH3.H2O | 1.0 × 10⁻⁵ | |||
| 2 | AgNO3 | 1.0 × 10⁻⁵ | No | No |
| NH3.H2O | 1.0 | |||
| 3 | AgNO3 | 1.0 × 10⁻⁴ | No | No |
| NH3.H2O | 1.0 | |||
| 4 | AgNO3 | 1.0 × 10⁻³ | No | Yes |
| NH3.H2O | 1.0 | |||
| 5 | AgNO3 | 1.0 × 10⁻² | Yes | Yes |
| NH3.H2O | 1.0 | |||
| 6 | AgNO3 | 1.0 | Yes | Yes |
| NH3.H2O | 1.0 | |||
| No. | Reaction time (hours) | Phenomena | |
|---|---|---|---|
| Precipitation | Fluorescence | ||
| 1 | 2 | No | No |
| 2 | 6 | No | No |
| 3 | 10 | No | No |
| 4 | 20 | No | No |
| 5 | 30 | No | Weak |
| 6 | 40 | No | Weak |
| 7 | 53 | No | Strong |
| 8 | 54 | No | Strong |
| 9 | 55 | No | Strong |
| 10 | 60 | Yes | Strong |
| Co-existing Substance | Co-existing concentration (μg mL-1) | Change in intensity of fluorescence (%) |
|---|---|---|
| Bovine Serum Albumin | 5.0 | +2.1 |
| Glucose | 20.0 | +2.0 |
| L-Lysine | 15.0 | -3.3 |
| L-Tyrosine | 10.0 | -4.0 |
| Glutamic acid | 16.0 | +1.5 |
| Glysine | 13.0 | +2.1 |
| L-Histidine | 5.0 | +1.2 |
| SO42- | 5.5 | +1.5 |
| PO43- | 2.0 | +4.0 |
| Cl- | 6.0 | +3.5 |
| I- | 5.5 | +3.7 |
| Zn2+ | 10.0 | +1.6 |
| Cu2+ | 2.0 | +4.1 |
| Mg2+ | 15.0 | +1.8 |
| Fe3+ | 6.0 | +3.5 |
| Ca2+ | 15.0 | +1.9 |
Silver nanoparticles, 5.0 × 10⁻⁴ mol L−1 and ct-DNA, 1.0 μg mL−1.
© 2007 by MDPI ( http://www.mdpi.org). Reproduction is permitted for noncommercial purposes.
Share and Cite
MDPI and ACS Style
Liu, C.; Yang, X.; Yuan, H.; Zhou, Z.; Xiao, D. Preparation of Silver Nanoparticle and Its Application to the Determination of ct-DNA. Sensors 2007, 7, 708-718. https://doi.org/10.3390/s7050708
AMA Style
Liu C, Yang X, Yuan H, Zhou Z, Xiao D. Preparation of Silver Nanoparticle and Its Application to the Determination of ct-DNA. Sensors. 2007; 7(5):708-718. https://doi.org/10.3390/s7050708
Chicago/Turabian StyleLiu, Chunhua, Xiupei Yang, Hongyan Yuan, Zaide Zhou, and Dan Xiao. 2007. "Preparation of Silver Nanoparticle and Its Application to the Determination of ct-DNA" Sensors 7, no. 5: 708-718. https://doi.org/10.3390/s7050708