Analyzing Land Use Changes in the Metropolitan Jilin City of Northeastern China Using Remote Sensing and GIS

Abstract
:1. Introduction
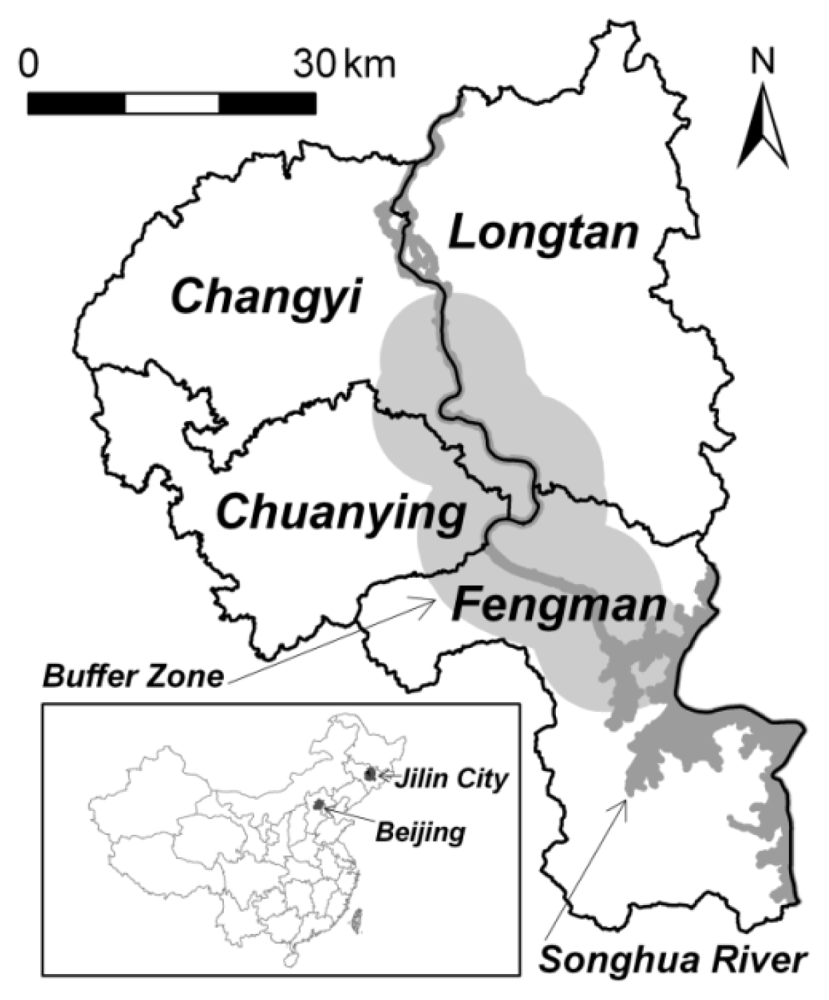
2. Study area
3. Methods
3.1. Change detection
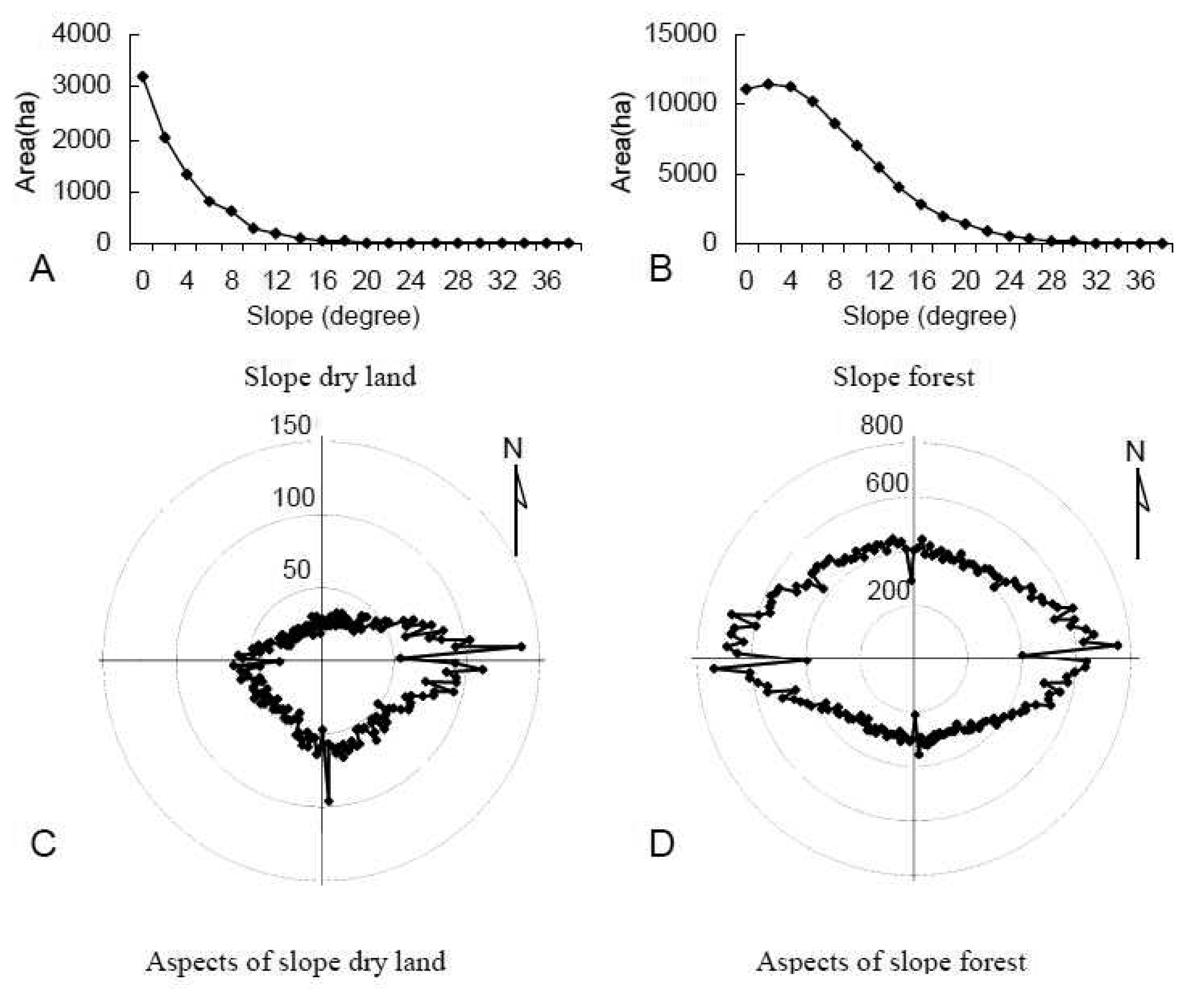
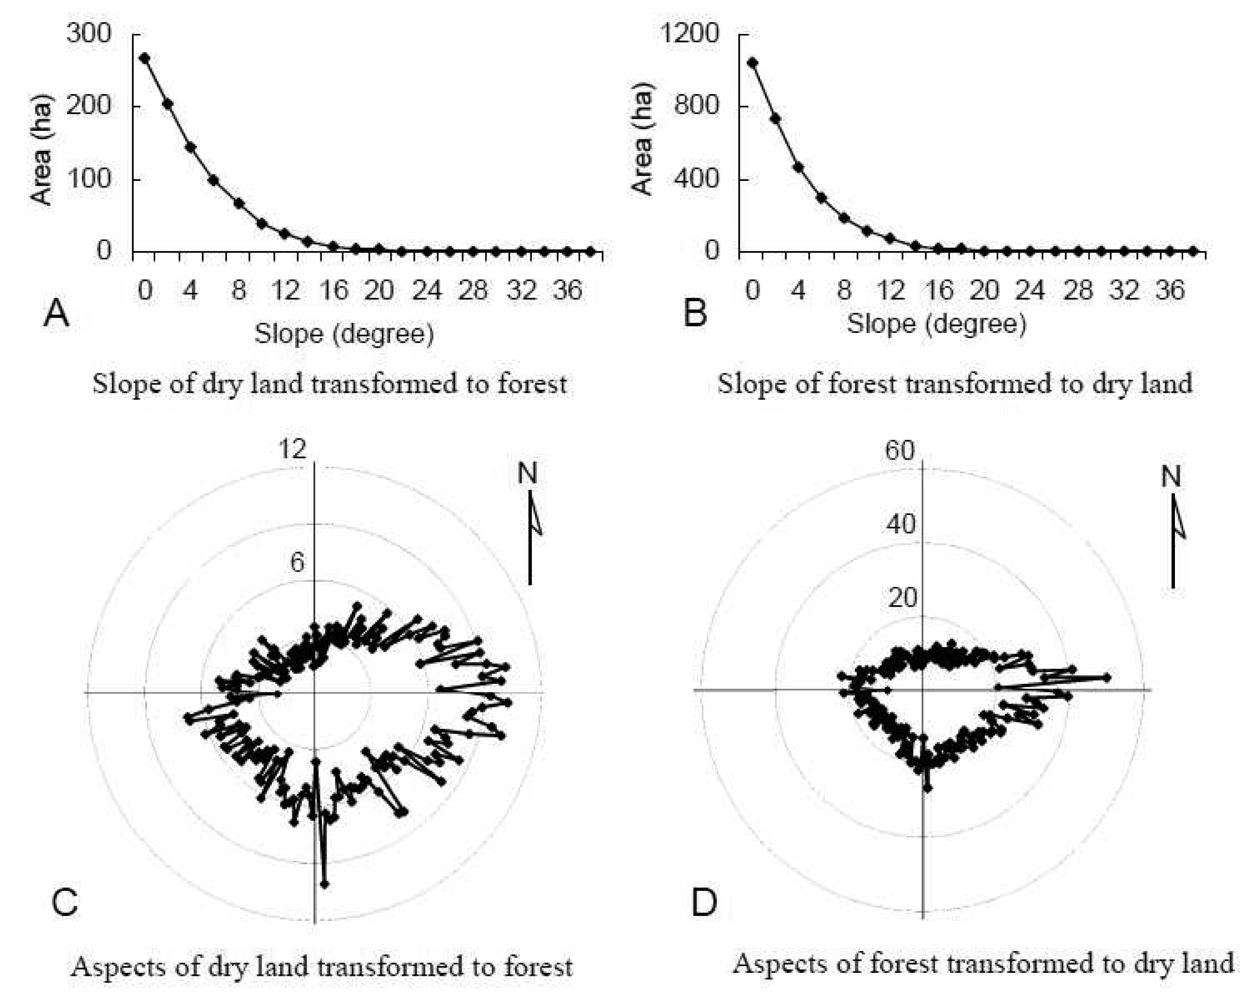
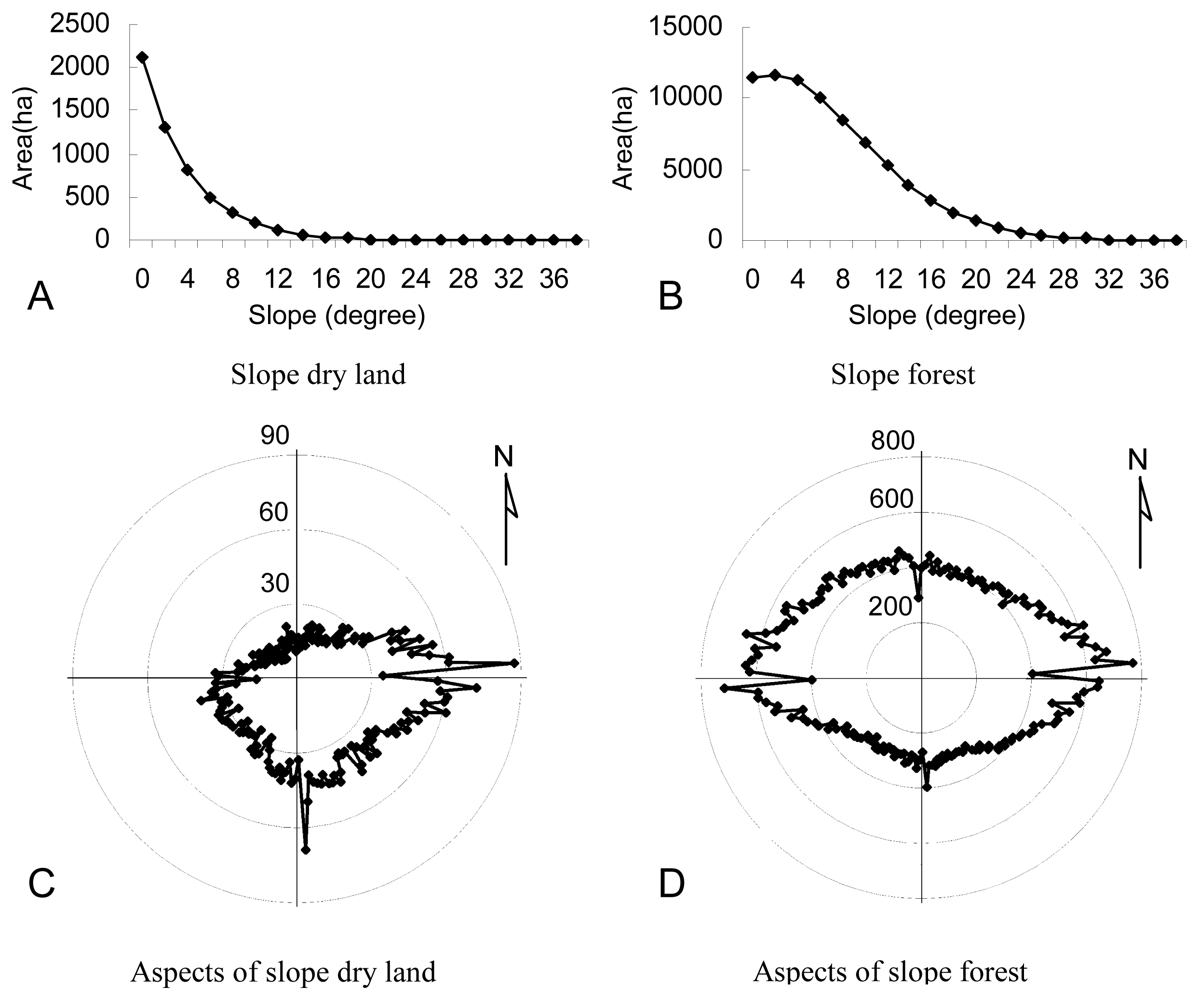
3.2. Change between forest and dry land on slope land
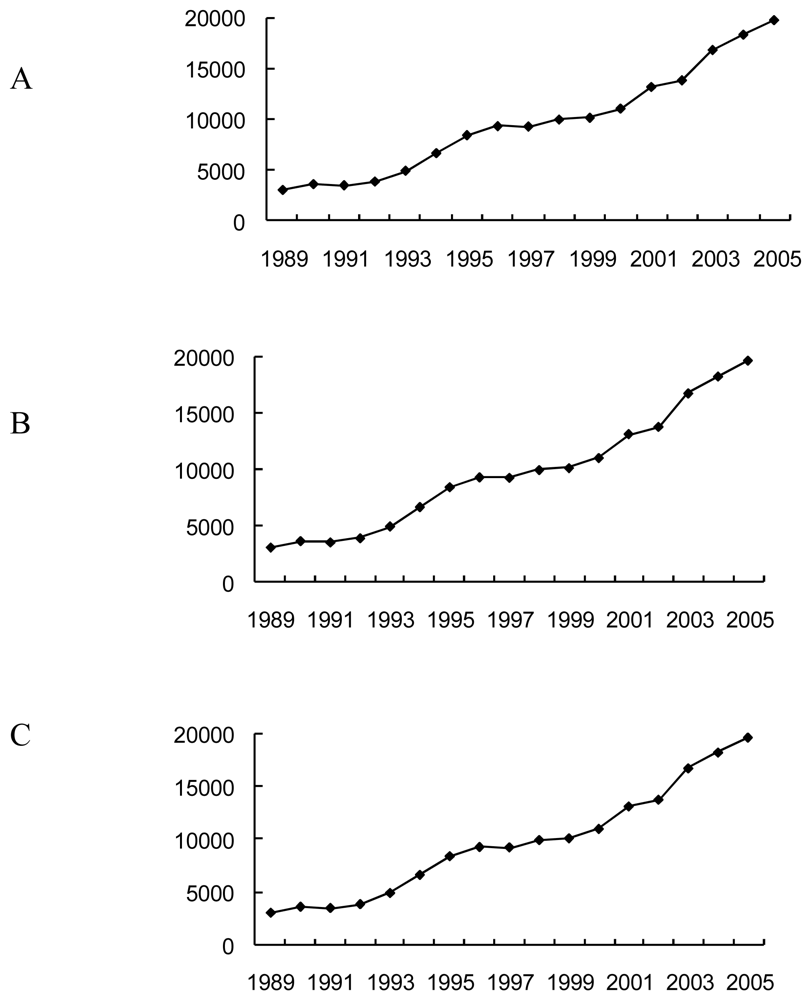
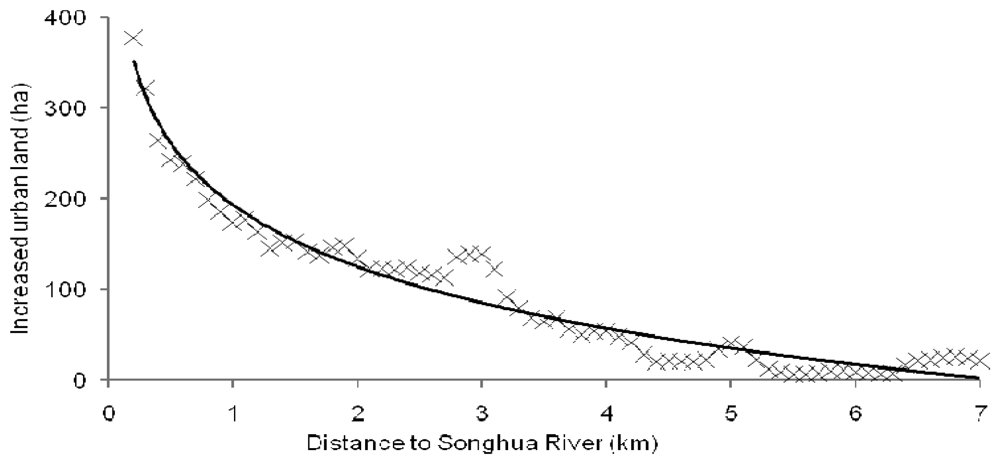
3.3. Analysis of spatial dependency of urban expansion
4. Results
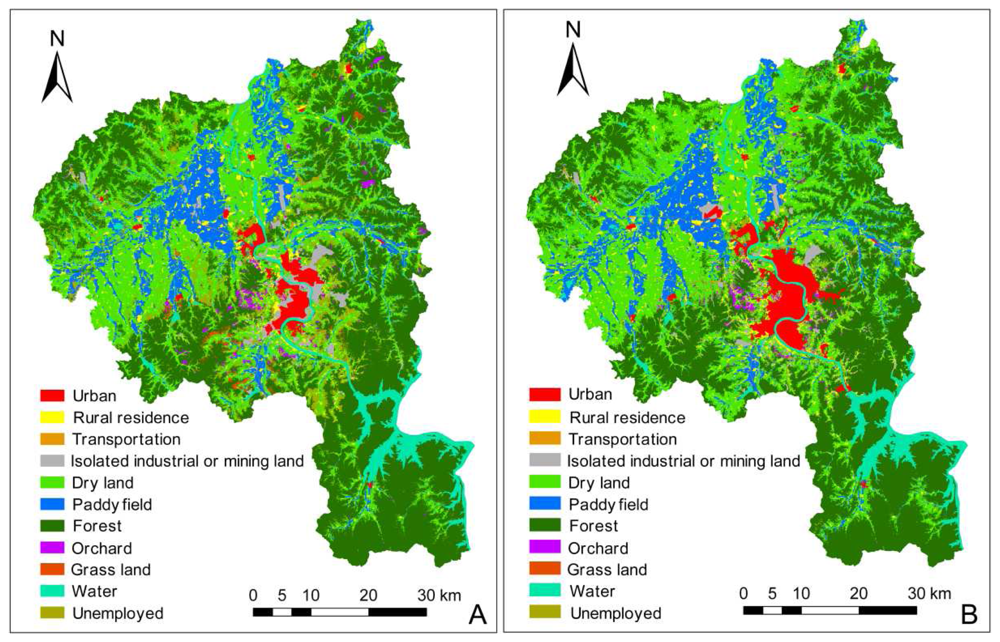
4.1. Land use change in the metropolitan area of Jilin City
4.3. Land use changes between dry land and forest on slope land
4.3. Spatial dependency of urban expansion
5. Conclusions and Discussion
Acknowledgments
References and Notes
- Vitousek, P.M. Beyond global warming: ecology and global change. Ecology 1994, 75, 1861–1876. [Google Scholar]
- Taniguchi, M.; Uemura, T. Effects of urbanization and groundwater flow on the subsurface temperature in Osaka, Japan. Phys. Earth Planet. Int. 2005, 152, 305–313. [Google Scholar]
- Chalmers, A.T.; Van Metre, P.C.; Callender, E. The chemical response of particle-associated contaminants in aquatic sediments to urbanization in New England, U.S.A. J. Contam. Hydrol. 2007, 91, 4–25. [Google Scholar]
- Zilberbrand, M.; Rosenthal, E.; Shachnai, E. Impact of urbanization on hydrochemical evolution of groundwater and on unsaturated-zone gas composition in the coastal city of Tel Aviv, Israel. J. Contam. Hydrol. 2001, 50, 175–208. [Google Scholar]
- Al-Kharabsheh, A.A. Influence of urbanization on water quality at Wadi Kufranja Basin (Jordan). J. Arid Environ. 1999, 43, 79–89. [Google Scholar]
- Rose, S. The effects of urbanization on the hydrochemistry of base flow within the Chattahoochee River Basin (Georgia, USA). J. Hydrol. 2007, 341, 42–54. [Google Scholar]
- Berry Lyons, W.; Fitzgibbon, T.O.; Welch, K.A.; Carey, A. E. Mercury geochemistry of the Scioto River, Ohio: Impact of agriculture and urbanization. Appl. Geochemistry 2006, 21, 1880–1888. [Google Scholar]
- Jeong, C.H. Effect of land use and urbanization on hydrochemistry and contamination of groundwater from Taejon area, Korea. J. Hydrol. 2001, 253, 194–210. [Google Scholar]
- Civerolo, K.; Hogrefe, C.; Lynn, B.; Rosenthal, J.; Ku, J.; Solecki, W.; Cox, J.; Small, C.; Rosenzweig, C.; Goldberg, R.; Knowlton, K.; Kinney, P. Estimating the effects of increased urbanization on surface meteorology and ozone concentrations in the New York City metropolitan region. Atmos. Environ. 2007, 41, 1803–1818. [Google Scholar]
- Yamada, T. A numerical simulation of urbanization on the local climate. J. Wind Eng. Ind. Aerod. 1999, 81, 1–19. [Google Scholar]
- Pauchard, A.; Aguayo, M.; Peña, E.; Urrutia, R. Multiple effects of urbanization on the biodiversity of developing countries: The case of a fast-growing metropolitan area (Concepción, Chile). Biol. Conserv. 2006, 127, 272–281. [Google Scholar]
- Alig, R.J.; Kline, J.D.; Lichtenstein, M. Urbanization on the US landscape: looking ahead in the 21st century. Landscape Urban Plan. 2004, 69, 219–234. [Google Scholar]
- Hathout, S. The use of GIS for monitoring and predicting urban growth in East and West St Paul, Winnipeg, Manitoba, Canada. J. Environ. Manage. 2002, 66, 229–238. [Google Scholar]
- Jensen, J.R.; Cowen, D.C. Remote sensing of urban suburban infrastructure and socio-economic attributes. Photogramm. Eng. Rem. S. 1999, 65, 611–622. [Google Scholar]
- Ningal, T.; Hartemink, A.E.; Bregt, A.K. Land use change and population growth in the Morobe Province of Papua New Guinea between 1975 and 2000. J. Environ. Manage. in press.
- Shajaat Ali, A.M. Rice to shrimp: Land use/land cover changes and soil degradation in Southwestern Bangladesh. Land Use Policy 2006, 23, 421–435. [Google Scholar]
- Seto, K.C.; Kaufmann, R.K. Modelling the drivers of urban land use change in the Pearl River Delta, China: integrating remote sensing with socioeconomic data. Land Econ. 2003, 79, 106–121. [Google Scholar]
- Ren, W.; Zhong, Y.; Meligrana, J.; Anderson, B.; Edgar Watt, W.; Chen, J.; Leung, H. Urbanization, land use, and water quality in Shanghai 1947–1996. Environ. Int. 2003, 29, 649–659. [Google Scholar]
- Zhao, B.; Kreuter, U.; Li, Bo.; Ma, Z.; Chen, J.; Nakagoshi, N. An ecosystem service value assessment of land-use change on Chongming Island, China. Land Use Policy 2004, 21, 139–148. [Google Scholar]
- Long, H.; Tang, G.; Li, X.; Heilig, G.K. Socio-economic driving forces of land-use change in Kunshan, the Yangtze River Delta economic area of China. J. Environ. Manage. 2007, 83, 351–364. [Google Scholar]
- Xie, Y.; Yu, M.; Bai, Y.; Xing, X. Ecological analysis of an emerging urban landscape pattern— desakota: a case study in Suzhou, China. Landscape ecol. 2006, 21, 1297–1309. [Google Scholar]
- Weng, Q.H. Land use change analysis in the Zhujiang Delta of China using satellite remote sensing, GIS and stochastic modelling. J. Environ. Manage. 2002, 64, 273–284. [Google Scholar]
- Fan, F.; Weng, Q.; Wang, Y. Land Use and Land Cover Change in Guangzhou, China, from 1998 to 2003, Based on Landsat TM /ETM+ Imagery. Sensors 2007, 7, 1323–1342. [Google Scholar]
- Qian, L.; Cut, H.; Chang, J. Impacts of Land Use and Cover Change on Land Surface Temperature in the Zhujiang Delta. Pedosphere 2006, 16, 681–689. [Google Scholar]
- Li, X.; Yeh, A.G. Analyzing spatial restructuring of land use patterns in a fast growing region using remote sensing and GIS. Landscape Urban Plan. 2004, 69, 335–354. [Google Scholar]
- Li, X.; Yeh, A.G. Principal component analysis of stacked multitemporal images for the monitoring of rapid urban expansion in the Pearl River Delta. Int. J. Remote. Sens. 1998, 19, 1501–1518. [Google Scholar]
- Quan, B.; Chen, J.; Qiu, H.; ROMKENS, M.J.M.; Yang, X.; Jiang, S.; Li, B. Spatial-Temporal Pattern and Driving Forces of Land Use Changes in Xiamen. Pedosphere 2006, 16, 477–488. [Google Scholar]
- Chen, J.; Wei, S.; Chang, K.; Tsai, B. A comparative case study of cultivated land changes in Fujian and Taiwan. Land Use Policy 2007, 24, 386–395. [Google Scholar]
- Cao, W.; Zhu, H.; Chen, S. Impacts of urbanization on topsoil nutrient balances—a case study at a provincial scale from Fujian, China. CATENA 2007, 69, 36–43. [Google Scholar]
- Xinhua News Agency. Northeastern China was expected to be the fourth economic increase pole. http://news.xinhuanet.com/fortune/2006-09/26/content_5140003.htm.
- Consolidation patterns and emperies of slope black cropland for the Northeastern China. http://www.swcc.org.cn/zhuanti2_view_content.asp?id=15880.
- Lunetta, R.S.; Knight, J.F.; Ediriwickrema, J.; Lyon, J.G.; Worthy, L.D. Land-cover change detection using multi-temporal MODIS NDVI data. Remote Sens. Environ. 2006, 105, 142–154. [Google Scholar]
- Xiao, H.; Weng, Q. The impact of land use and land cover changes on land surface temperature in a karst area of China. J. Environ. Manage. 2007, 85, 245–257. [Google Scholar]
- Turner, M.G. Landscape changes in nine rural counties in Georgia. Photogramm. Eng. Rem. S. 1990, 56, 379–386. [Google Scholar]
- Harris, P.M.; Ventura, S.J. The integration of geographic data with remotely sensed imagery to improve classification in an urban area. Photogramm. Eng. Rem. S. 1995, 61, 993–998. [Google Scholar]
- Assali, S.; Menenti, M. Mapping vegetation–soil–climate complexes in southern Africa using temporal Fourier analysis of NOAA-AVHRR NDVI data. Int. J. Remote Sens. 2000, 21, 973–996. [Google Scholar]
- Homer, C.; Huang, C.; Limin, Y.; Wylie, B.; Coan, M. Development of a 2001 national land cover database for the United States. Photogramm. Eng. Rem. S. 2004, 70, 829–840. [Google Scholar]
- Knight, J.K.; Lunetta, R.L.; Ediriwickrema, J.; Khorram, S. Regional scale land-cover characterization using MODIS-NDVI 250 m multi-temporal imagery: A phenology based approach. GIScience and Remote Sensing (Special Issue on Multi-Temporal Imagery Analysis) 2006, 43, 1–23. [Google Scholar]
- Loveland, T.R.; Merchant, J.W.; Ohlen, D.O.; Brown, J.F. Development of a land cover characteristics data base for the conterminous U.S. Photogramm. Eng. Rem. S. 1991, 57, 1453–1463. [Google Scholar]
- Lambin, E.F.; Ehrlich, D. Land-cover changes in Sub-Saharan Africa (1982–1991): Application of a change index based on remotely sensed surface temperature and vegetation indices at a continental scale. Remote Sens. Environ. 1997, 61, 181–200. [Google Scholar]
- People's government of Jilin municipality. The 11th five year social and economic development plan of Jilin City. http://www.jlcity.gov.cn/jl_577/infocontent.jsp?infoid=6730.
- Development and Reform Commission of Jilin City. Guide lines of the 10th five year social and economic development plan of Jilin City. http://www.jlsdrc.gov.cn/fazhan/.


| A | 1989 | 2005 | change | |||
|---|---|---|---|---|---|---|
| Area (ha) | Area (%) | Area (ha) | Area (%) | Area (ha) | Area (%) | |
| URB | 7166.6 | 1.9 | 13906.29 | 3.68 | 6739.69 | 94.04 |
| IIM | 8380.98 | 2.22 | 5904.84 | 1.56 | -2476.14 | -29.54 |
| RR | 14025.94 | 3.72 | 17739.43 | 4.7 | 3713.49 | 26.48 |
| TRN | 677.93 | 0.18 | 2109.75 | 0.56 | 1431.82 | 211.2 |
| DL | 104412.4 | 27.66 | 120784.1 | 32 | 16371.72 | 15.68 |
| PAD | 37331.82 | 9.89 | 41731.14 | 11.06 | 4399.32 | 11.78 |
| FOR | 154559 | 40.95 | 146415.5 | 38.79 | -8143.48 | -5.27 |
| ORC | 3677.64 | 0.97 | 3507.98 | 0.93 | -169.66 | -4.61 |
| GRS | 1554 | 0.41 | 13.73 | 0 | -1540.27 | -99.12 |
| WAT | 21974.9 | 5.82 | 22041.44 | 5.84 | 66.54 | 0.3 |
| UNE | 23700.72 | 6.28 | 3307.69 | 0.88 | -20393 | -86.04 |
| B | 1989 | 2005 | change | |||
|---|---|---|---|---|---|---|
| Area (ha) | Area (%) | Area (ha) | Area (%) | Area (ha) | Area (%) | |
| URB | 3365.98 | 3.93 | 4560.27 | 5.32 | 1194.29 | 35.48 |
| IIM | 2221.05 | 2.59 | 1537.21 | 1.79 | -683.84 | -30.79 |
| RR | 4263.31 | 4.97 | 4881.79 | 5.7 | 618.48 | 14.51 |
| TRN | 278.72 | 0.33 | 433.66 | 0.51 | 154.94 | 55.59 |
| DL | 30210.5 | 35.25 | 33954.48 | 39.62 | 3743.98 | 12.39 |
| PAD | 15734.52 | 18.36 | 17449.9 | 20.36 | 1715.38 | 10.9 |
| FOR | 21956.03 | 25.62 | 18836.03 | 21.98 | -3120 | -14.21 |
| ORC | 355.2 | 0.41 | 332.64 | 0.39 | -22.56 | -6.35 |
| GRS | 7.81 | 0.01 | 13 | 0.02 | 5.19 | 66.45 |
| WAT | 3365.98 | 3.93 | 4560.27 | 5.32 | 1194.29 | 35.48 |
| UNE | 2221.05 | 2.59 | 1537.21 | 1.79 | -683.84 | -30.79 |
| C | 1989 | 2005 | change | |||
|---|---|---|---|---|---|---|
| Area (ha) | Area (%) | Area (ha) | Area (%) | Area (ha) | Area (%) | |
| URB | 1174.48 | 1.71 | 2362.15 | 3.45 | 1187.67 | 101.12 |
| IIM | 1316.11 | 1.92 | 1137 | 1.66 | -179.11 | -13.61 |
| RR | 3214.1 | 4.69 | 4269.41 | 6.23 | 1055.31 | 32.83 |
| TRN | 20.49 | 0.03 | 394.75 | 0.58 | 374.26 | 1826.55 |
| DL | 25740.12 | 37.54 | 28435.31 | 41.47 | 2695.19 | 10.47 |
| PAD | 6757.47 | 9.86 | 7867.33 | 11.47 | 1109.86 | 16.42 |
| FOR | 20769.62 | 30.29 | 20390.83 | 29.74 | -378.79 | -1.82 |
| ORC | 1414.17 | 2.06 | 1430.63 | 2.09 | 16.46 | 1.16 |
| GRS | 796.59 | 1.16 | 0.3 | 0 | -796.29 | -99.96 |
| WAT | 1481.81 | 2.16 | 1597.63 | 2.33 | 115.82 | 7.82 |
| UNE | 5878.85 | 8.57 | 678.47 | 0.99 | -5200.38 | -88.46 |
| D | 1989 | 2005 | change | |||
|---|---|---|---|---|---|---|
| Area (ha) | Area (%) | Area (ha) | Area (%) | Area (ha) | Area (%) | |
| URB | 541.98 | 0.51 | 2281.74 | 2.15 | 1739.76 | 321 |
| IIM | 1020.59 | 0.96 | 1021.7 | 0.96 | 1.11 | 0.11 |
| RR | 2142.55 | 2.02 | 3499.97 | 3.3 | 1357.42 | 63.36 |
| TRN | 124.47 | 0.12 | 297.03 | 0.28 | 172.56 | 138.64 |
| DL | 14799.34 | 13.95 | 16886.54 | 15.92 | 2087.2 | 14.1 |
| PAD | 2322.76 | 2.19 | 2599.64 | 2.45 | 276.88 | 11.92 |
| FOR | 64277.16 | 60.58 | 65052.09 | 61.31 | 774.93 | 1.21 |
| ORC | 736.3 | 0.69 | 992.71 | 0.94 | 256.41 | 34.82 |
| GRS | 536.6 | 0.51 | 0.43 | 0 | -536.17 | -99.92 |
| WAT | 12925.59 | 12.18 | 12693.12 | 11.96 | -232.47 | -1.8 |
| UNE | 6667.97 | 6.28 | 770.34 | 0.73 | -5897.63 | -88.45 |
| E | 1989 | 2005 | change | |||
|---|---|---|---|---|---|---|
| Area (ha) | Area (%) | Area (ha) | Area (%) | Area (ha) | Area (%) | |
| URB | 2084.16 | 1.78 | 4702.13 | 4.02 | 2617.97 | 125.61 |
| IIM | 3823.23 | 3.27 | 2208.93 | 1.89 | -1614.3 | -42.22 |
| RR | 4405.98 | 3.76 | 5088.26 | 4.35 | 682.28 | 15.49 |
| TRN | 254.25 | 0.22 | 984.31 | 0.84 | 730.06 | 287.14 |
| DL | 33662.43 | 28.75 | 41507.78 | 35.45 | 7845.35 | 23.31 |
| PAD | 12517.07 | 10.69 | 13814.27 | 11.8 | 1297.2 | 10.36 |
| FOR | 47556.21 | 40.61 | 42136.59 | 35.99 | -5419.62 | -11.4 |
| ORC | 1171.97 | 1 | 752 | 0.64 | -419.97 | -35.83 |
| GRS | 213 | 0.18 | 0 | 0 | -213 | -100 |
| WAT | 4429.62 | 3.78 | 4782.74 | 4.08 | 353.12 | 7.97 |
| UNE | 6973.84 | 5.96 | 1114.75 | 0.95 | -5859.09 | -84.02 |
| URB | IIM | RR | TRN | DL | PAD | FOR | ORC | GRS | WAT | UNE | 1989 | |
|---|---|---|---|---|---|---|---|---|---|---|---|---|
| URB | 7122.77 | 0.00 | 0.00 | 43.06 | 0.00 | 0.00 | 0.00 | 0.00 | 0.00 | 0.00 | 0.77 | 7166.60 |
| IIM | 3247.78 | 2879.25 | 287.61 | 61.15 | 350.21 | 455.45 | 538.75 | 10.11 | 0.00 | 382.22 | 168.45 | 8380.98 |
| RR | 869.22 | 255.26 | 12752.20 | 149.24 | 0.00 | 0.00 | 0.00 | 0.00 | 0.00 | 0.00 | 0.00 | 14025.94 |
| TRN | 114.17 | 5.02 | 17.30 | 442.63 | 40.16 | 29.79 | 20.25 | 0.39 | 0.00 | 0.98 | 7.24 | 677.93 |
| DL | 1237.47 | 673.75 | 2730.10 | 509.70 | 90972.77 | 2936.36 | 3508.70 | 738.17 | 0.02 | 700.30 | 405.05 | 104412.39 |
| PAD | 325.67 | 549.43 | 383.00 | 325.37 | 0.00 | 34808.85 | 311.84 | 34.75 | 5.45 | 465.56 | 121.90 | 37331.82 |
| FOR | 465.86 | 760.49 | 610.37 | 251.02 | 16862.60 | 769.91 | 131914.70 | 818.13 | 0.28 | 1134.54 | 971.12 | 154559.02 |
| ORC | 58.01 | 43.33 | 98.17 | 17.01 | 658.89 | 11.90 | 1375.95 | 1327.28 | 0.05 | 25.99 | 61.06 | 3677.64 |
| GRS | 0.16 | 9.15 | 20.52 | 0.00 | 448.75 | 19.71 | 964.23 | 22.61 | 7.48 | 23.83 | 37.56 | 1554.00 |
| WAT | 173.20 | 175.12 | 180.31 | 79.56 | 1341.17 | 1185.74 | 558.70 | 11.60 | 0.07 | 18123.65 | 145.78 | 21974.90 |
| UNE | 291.98 | 554.04 | 659.83 | 231.01 | 10109.56 | 1513.43 | 7222.42 | 544.94 | 0.38 | 1184.37 | 1388.76 | 23700.72 |
| 2005 | 13906.30 | 5904.84 | 17739.4 | 2109.75 | 120784.11 | 41731.14 | 146415.54 | 3507.98 | 13.73 | 22041.44 | 3307.69 | 377461.94 |
| URB | IIM | RR | TRN | DL | PAD | FOR | ORC | GRS | WAT | UNE | 1989 | |
|---|---|---|---|---|---|---|---|---|---|---|---|---|
| URB | 3353.68 | 0.00 | 0.00 | 12.00 | 0.00 | 0.00 | 0.00 | 0.00 | 0.00 | 0.00 | 0.30 | 3365.98 |
| IIM | 644.49 | 824.58 | 77.00 | 8.01 | 68.69 | 429.33 | 36.74 | 0.37 | 0.00 | 122.45 | 9.39 | 2221.05 |
| RR | 73.03 | 36.80 | 4133.63 | 19.85 | 0.00 | 0.00 | 0.00 | 0.00 | 0.00 | 0.00 | 0.00 | 4263.31 |
| TRN | 4.69 | 0.63 | 1.93 | 241.51 | 3.40 | 18.6 | 6.58 | 0.00 | 0.00 | 0.50 | 0.88 | 278.72 |
| DL | 148.67 | 113.38 | 408.53 | 43.49 | 27275.60 | 1251.03 | 700.83 | 12.05 | 0.00 | 219.30 | 37.64 | 30210.50 |
| PAD | 274.57 | 418.35 | 109.93 | 54.65 | 0.00 | 14651.20 | 64.88 | 0.01 | 5.45 | 144.79 | 10.70 | 15734.52 |
| FOR | 8.93 | 74.12 | 53.44 | 2.61 | 4385.82 | 127.81 | 17072.03 | 21.76 | 0.00 | 125.40 | 84.11 | 21956.03 |
| ORC | 20.37 | 2.83 | 3.83 | 0.51 | 19.61 | 1.39 | 12.46 | 293.95 | 0.00 | 0.00 | 0.25 | 355.20 |
| GRS | 0.00 | 0.00 | 0.00 | 0.00 | 0.32 | 0.00 | 0.01 | 0.00 | 7.48 | 0.00 | 0.00 | 7.81 |
| WAT | 19.48 | 20.85 | 37.92 | 21.72 | 348.05 | 495.68 | 52.03 | 0.08 | 0.07 | 2122.10 | 19.86 | 3137.88 |
| UNE | 12.36 | 45.67 | 55.58 | 29.31 | 1853.01 | 474.87 | 890.47 | 4.42 | 0.00 | 233.37 | 581.00 | 4180.06 |
| 2005 | 4560.27 | 1537.21 | 4881.79 | 433.66 | 33954.50 | 17449.9 | 18836.03 | 332.64 | 13.00 | 2968.00 | 744.13 | 85711.06 |
| URB | IIM | RR | TRN | DL | PAD | FOR | ORC | GRS | WAT | UNE | 1989 | |
|---|---|---|---|---|---|---|---|---|---|---|---|---|
| URB | 1171.41 | 0.00 | 0.00 | 2.88 | 0.00 | 0.00 | 0.00 | 0.00 | 0.00 | 0.00 | 0.19 | 1174.48 |
| IIM | 627.26 | 377.99 | 88.36 | 8.31 | 120.76 | 6.02 | 40.31 | 2.10 | 0.00 | 4.56 | 40.44 | 1316.11 |
| RR | 308.35 | 56.9 | 2821.55 | 27.30 | 0.00 | 0.00 | 0.00 | 0.00 | 0.00 | 0.00 | 0.00 | 3214.10 |
| TRN | 0.49 | 0.84 | 0.88 | 6.82 | 6.41 | 0.32 | 2.92 | 0.20 | 0.00 | 0.02 | 1.59 | 20.49 |
| DL | 151.27 | 230.91 | 874.07 | 178.14 | 22360.52 | 591.25 | 803.43 | 331.32 | 0.02 | 100.21 | 118.98 | 25740.12 |
| PAD | 6.70 | 36.03 | 92.70 | 63.92 | 0.00 | 6395.19 | 52.64 | 7.28 | 0.00 | 84.71 | 18.30 | 6757.47 |
| FOR | 28.69 | 229.33 | 120.32 | 45.82 | 2309.63 | 123.15 | 17348.60 | 243.09 | 0.28 | 127.06 | 193.70 | 20769.62 |
| ORC | 8.69 | 21.58 | 48.38 | 3.21 | 208.23 | 2.57 | 443.56 | 638.15 | 0.00 | 5.14 | 34.66 | 1414.17 |
| GRS | 0.01 | 5.89 | 12.86 | 0.00 | 256.86 | 16.84 | 449.94 | 19.21 | 0.00 | 14.62 | 20.36 | 796.59 |
| WAT | 21.19 | 14.36 | 50.34 | 4.03 | 208.24 | 205.30 | 39.98 | 2.00 | 0.00 | 919.17 | 17.20 | 1481.81 |
| UNE | 38.09 | 163.17 | 159.95 | 54.32 | 2964.66 | 526.69 | 1209.50 | 187.28 | 0.00 | 342.14 | 233.05 | 5878.85 |
| 2005 | 2362.15 | 1137.00 | 4269.41 | 394.75 | 28435.31 | 7867.33 | 20390.80 | 1430.60 | 0.30 | 1597.63 | 678.47 | 68563.81 |
| URB | IIM | RR | TRN | DL | PAD | FOR | ORC | GRS | WAT | UNE | 1989 | |
|---|---|---|---|---|---|---|---|---|---|---|---|---|
| URB | 541.93 | 0.00 | 0.00 | 0.00 | 0.00 | 0.00 | 0.00 | 0.00 | 0.00 | 0.00 | 0.05 | 541.98 |
| IIM | 468.05 | 253.53 | 68.48 | 10.78 | 51.21 | 1.51 | 81.68 | 5.32 | 0.00 | 22.65 | 57.38 | 1020.59 |
| RR | 143.22 | 43.42 | 1934.32 | 21.59 | 0.00 | 0.00 | 0.00 | 0.00 | 0.00 | 0.00 | 0.00 | 2142.55 |
| TRN | 25.83 | 3.40 | 7.98 | 57.93 | 11.85 | 4.78 | 8.73 | 0.19 | 0.00 | 0.27 | 3.51 | 124.47 |
| DL | 580.39 | 168.75 | 768.18 | 74.46 | 11491.77 | 221.39 | 998.95 | 276.88 | 0.00 | 104.32 | 114.25 | 14799.34 |
| PAD | 3.04 | 37.36 | 59.58 | 22.73 | 0.00 | 2065.42 | 55.92 | 19.08 | 0.00 | 40.14 | 19.49 | 2322.76 |
| FOR | 303.36 | 239.45 | 257.32 | 29.93 | 2556.86 | 100.87 | 59985.55 | 181.43 | 0.00 | 387.52 | 234.87 | 64277.16 |
| ORC | 17.73 | 7.45 | 31.58 | 6.60 | 219.09 | 3.34 | 174.08 | 245.64 | 0.05 | 11.82 | 18.92 | 736.30 |
| GRS | 0.15 | 3.26 | 7.59 | 0.00 | 155.56 | 1.31 | 351.39 | 3.40 | 0.00 | 8.86 | 5.08 | 536.60 |
| WAT | 79.31 | 82.56 | 53.48 | 29.65 | 229.03 | 80.67 | 345.02 | 7.64 | 0.00 | 11979.2 | 39.04 | 12925.59 |
| UNE | 118.73 | 182.52 | 311.46 | 43.36 | 2171.17 | 120.35 | 3050.77 | 253.13 | 0.38 | 138.35 | 277.75 | 6667.97 |
| 2005 | 2281.74 | 1021.7 | 3499.97 | 297.03 | 16886.54 | 2599.64 | 65052.09 | 992.71 | 0.43 | 12693.10 | 770.34 | 106095.31 |
| 1989 | Plain | % | Slope | % | 2005 | Plain | % | Slope | % | |||
|---|---|---|---|---|---|---|---|---|---|---|---|---|
| URB | IIM | RR | TRN | DL | PAD | FOR | ORC | GRS | WAT | UNE | 1989 | |
| URB | 2055.75 | 0.00 | 0.00 | 28.18 | 0.00 | 0.00 | 0.00 | 0.00 | 0.00 | 0.00 | 0.23 | 2084.16 |
| IIM | 1507.98 | 1423.15 | 53.77 | 34.05 | 109.55 | 18.59 | 380.02 | 2.32 | 0.00 | 232.56 | 61.24 | 3823.23 |
| RR | 344.62 | 118.14 | 3862.72 | 80.50 | 0.00 | 0.00 | 0.00 | 0.00 | 0.00 | 0.00 | 0.00 | 4405.98 |
| TRN | 83.16 | 0.15 | 6.51 | 136.37 | 18.50 | 6.09 | 2.02 | 0.00 | 0.00 | 0.19 | 1.26 | 254.25 |
| DL | 357.14 | 160.71 | 679.32 | 213.61 | 29844.9 | 872.69 | 1005.49 | 117.92 | 0.00 | 276.47 | 134.18 | 33662.43 |
| PAD | 41.36 | 57.69 | 120.79 | 184.07 | 0.00 | 11697.1 | 138.4 | 8.38 | 0.00 | 195.92 | 73.41 | 12517.07 |
| FOR | 124.88 | 217.59 | 179.29 | 172.66 | 7610.29 | 418.08 | 37508.57 | 371.85 | 0.00 | 494.56 | 458.44 | 47556.21 |
| ORC | 11.22 | 11.47 | 14.38 | 6.69 | 211.96 | 4.60 | 745.85 | 149.54 | 0.00 | 9.03 | 7.23 | 1171.97 |
| GRS | 0.00 | 0.00 | 0.07 | 0.00 | 36.01 | 1.56 | 162.89 | 0.00 | 0.00 | 0.35 | 12.12 | 213.00 |
| WAT | 53.22 | 57.35 | 38.57 | 24.16 | 555.85 | 404.09 | 121.67 | 1.88 | 0.00 | 3103.15 | 69.68 | 4429.62 |
| UNE | 122.80 | 162.68 | 132.84 | 104.02 | 3120.72 | 391.52 | 2071.68 | 100.11 | 0.00 | 470.51 | 296.96 | 6973.84 |
| 2005 | 4702.13 | 2208.93 | 5088.26 | 984.31 | 41507.78 | 13814.3 | 42136.59 | 752 | 0.00 | 4782.74 | 1114.75 | 117091.76 |
| DL | 104412.39 | 98868.62 | 94.69 | 5543.77 | 5.31 | 120784.11 | 112168.95 | 92.87 | 8615.16 | 7.13 |
| FOR | 154559.02 | 77453.45 | 50.11 | 77105.57 | 49.89 | 146415.54 | 68618.90 | 46.87 | 77796.64 | 53.13 |
© 2008 by the authors; licensee Molecular Diversity Preservation International, Basel, Switzerland. This article is an open-access article distributed under the terms and conditions of the CreativeCommons Attribution license (http://creativecommons.org/licenses/by/3.0/).
Share and Cite
Hu, D.; Yang, G.; Wu, Q.; Li, H.; Liu, X.; Niu, X.; Wang, Z.; Wang, Q. Analyzing Land Use Changes in the Metropolitan Jilin City of Northeastern China Using Remote Sensing and GIS. Sensors 2008, 8, 5449-5465. https://doi.org/10.3390/s8095449
Hu D, Yang G, Wu Q, Li H, Liu X, Niu X, Wang Z, Wang Q. Analyzing Land Use Changes in the Metropolitan Jilin City of Northeastern China Using Remote Sensing and GIS. Sensors. 2008; 8(9):5449-5465. https://doi.org/10.3390/s8095449
Chicago/Turabian StyleHu, Dan, Guodong Yang, Qiong Wu, Hongqing Li, Xusheng Liu, Xuefeng Niu, Zhiheng Wang, and Qiong Wang. 2008. "Analyzing Land Use Changes in the Metropolitan Jilin City of Northeastern China Using Remote Sensing and GIS" Sensors 8, no. 9: 5449-5465. https://doi.org/10.3390/s8095449