Environmental Implications of Eco-Labeling for Rice Farming Systems


1
Institute of Green Bio Science Technology, Seoul National University, Pyeongchang 25354, Korea
2
Institute on the Environment, University of Minnesota, St. Paul, MN 55108, USA
3
Department of Bioproducts and Biosystems Engineering, and Institute on the Environment, University of Minnesota, St. Paul, MN 55108, USA
4
Graduate School of International Agricultural Technology, and Institute of Green Bio Science Technology, Seoul National University, Pyeongchang 25354, Korea
*
Author to whom correspondence should be addressed.
Sustainability 2018, 10(4), 1050; https://doi.org/10.3390/su10041050
Submission received: 26 January 2018
/
Revised: 26 March 2018
/
Accepted: 28 March 2018
/
Published: 2 April 2018
(This article belongs to the Section Economic and Business Aspects of Sustainability)
Abstract
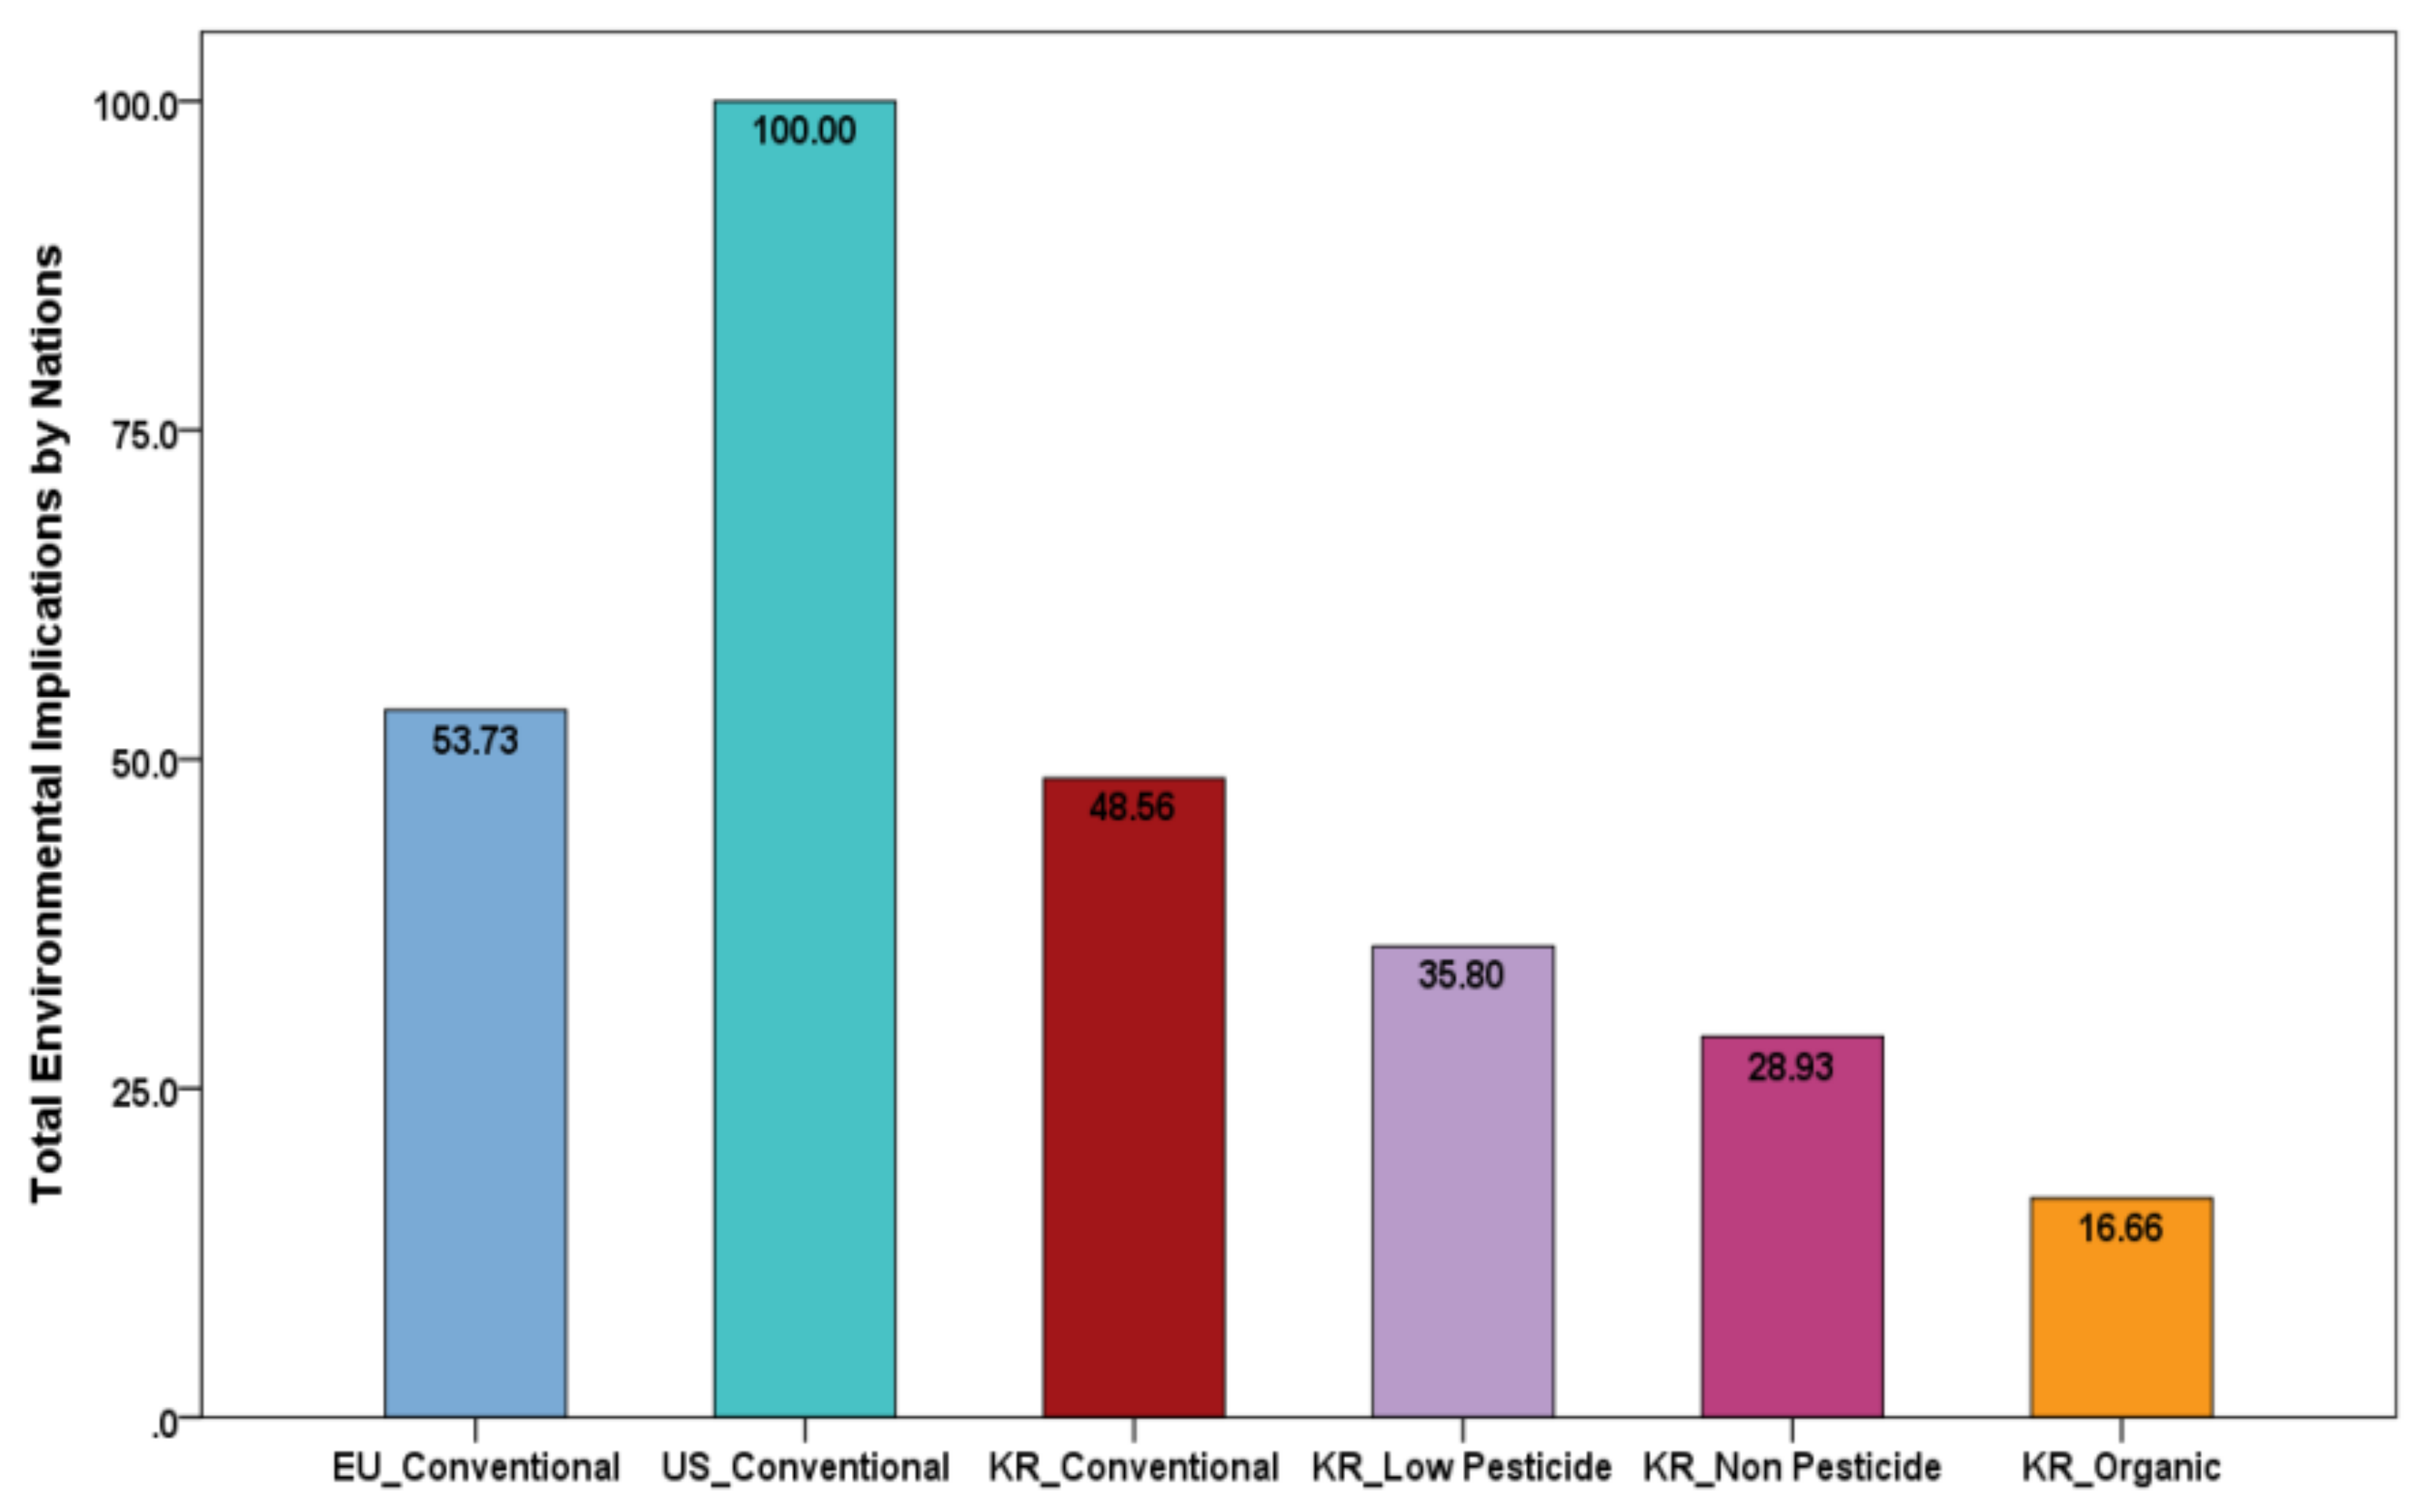
:Concerns about climate change have forced countries to strengthen regulations, standards, and certifications related to greenhouse gas emissions. Various policies targeting farm products, such as carbon labeling and the Environmentally-Friendly Agricultural Product Certification (EFAPC) for agricultural products, have been implemented in South Korea to reduce greenhouse gas emissions in the agricultural sector. The purpose of this study was to evaluate the implications of the various certification systems for rice farming, including organic farming, non-pesticide farming, and low-pesticide farming. For this study, we constructed a life cycle inventory (LCI) of rice farming systems including conventional, low-pesticide, non-pesticide, and organic farming systems in South Korea. Finally, we compared international farming systems in South Korea, the U.S., and the EU. The rice farming systems with eco-labeling certifications have reduced the environmental impacts. The environmental impacts of rice farming by country were highest in the U.S. (100.0), followed by the EU (53.7), and Korea’s conventional (48.6), low-pesticide (35.8), non-pesticide (28.9), and organic (16.7) farming practices. These results may be useful in proliferating and improving the methodology to evaluate eco-labeling and carbon labeling systems.
1. Introduction
Concerns about climate change have driven countries to strengthen their greenhouse gas (GHG) emission reduction regulations, guidelines, standards, and certifications [1,2,3,4]. The Paris Agreement is a representative policy on climate change aimed at the mitigation of GHG emissions [5]. This is an agreement of the United Nations Framework Convention on Climate Change (UNFCCC) in the Organization for Economic Cooperation and Development (OECD). The Paris Agreement, adopted by 195 countries at the Conference of the Parties (COP21) in regular session on 12 December 2015, replaced the Kyoto Protocol, which was adopted in 1997. Unlike the Kyoto Protocol, which obliged only developed countries to reduce GHG, the Paris Climate Change Accord demands that each of the 195 participating nations adopt the reduction objectives, which accounts for over 90 percent of global GHG emissions.
Several environmental policies have been established to meet the reduction guidelines of environmental impacts in various sectors, including the agricultural sector [1,6]. The agricultural sector produces greenhouse gases that account for about 10–20% of global GHG emissions [7,8,9]. These policies include environmental policies related to agriculture [10], including eco-labeling for agricultural products (e.g., carbon labeling and organic labeling), payments for ecosystem services (PES) (e.g., conservation programs to protect natural resources in the marketplace) [11], and best management practices (BMP) (e.g., to control various pollutants during crop production). In addition, several certifications are available globally, including carbon labeling in Europe, the United States, and Asia. Similarly, numerous policies targeting farm products in the agricultural sector have been established to reduce GHG emissions [1,9,12]. For example, the Codex Alimentarius (Latin for “food code”) was put forth by the Codex Alimentarius Commission (CAC), an agency run jointly by the Food and Agriculture Organization (FAO) of the United Nations and the World Health Organization (WHO) [13,14]. This policy provides guidelines for the production, processing, labeling, and marketing of organically produced food [15,16].
Agriculture plays a role in both the sink and source of carbon emissions [17]. However, a high degree of uncertainty exists about which agriculture characteristics contribute to carbon emissions; therefore, all agricultural activities require environmental consideration. For example, since the primary goal in agriculture until the 1990s was to pursue higher production, fertilizer and agricultural chemicals were used in abundance; however, they have caused many environmental problems, such as pest tolerance to insecticides, emissions of human and ecologically toxic substances, and soil acidification. Concerns about such environmental problems began a movement to promote sustainable agriculture [18]. These concerns have changed the paradigm of agricultural production systems from high input agriculture to more environmentally friendly agriculture to minimize environmental impacts. Thus, the agricultural certificate in South Korea has become more important due to these environmental concerns [19,20]. The policy in South Korea, which is part of an eco-labeling program targeting farming systems, established carbon labeling and environmentally-friendly agricultural product certification. This certification has been effectively enforced upon producers and consumers in South Korea.
When evaluating the effect of environmental improvement, it is also important to consider the life cycle of agricultural production [21,22,23]. Life cycle assessment (LCA) is an effective tool to evaluate life cycle environmental implications in the field of agriculture [18,24,25]. According to ISO 14040:2006, LCA is the compiling and evaluation of the inputs and outputs and the potential environmental impacts of a product system during the lifetime of a product [26]. To use LCA for the agriculture sector, it is necessary to quantify the environmental influences of agriculture, to objectively assess them, and to reduce their negative impact while maintaining the positive functions of agriculture [27,28,29].
The environmental impact of eco-labeling typically only focuses on the carbon footprint, but this focus does not address environmental concerns such as potential acidification and eutrophication. From a life cycle perspective, quantitative evaluation is needed for effective certification of agricultural products to identify the agricultural effects on environmental improvement and on changing inputs involved in cultivation. In South Korea, the eco-friendly certification of agricultural products only focuses on the absence of chemical fertilizers and pesticides used in cultivation; it lacks the ability to evaluate the overall environmental implications of agricultural products [30].
Although attempts have been made to evaluate the impact of agricultural products and processes on the environment, previous studies have found that it is difficult to differentiate environmentally between domestic organic products and imported organic processed food [31]. In addition, fossil fuels and GHG emissions involved in transportation are not accounted for. To adequately evaluate the environmental conservation value of imported food, it is necessary to evaluate many elements including energy consumption, eutrophication, and GHGs. These elements also apply to the assessment of the environmental conservation value of domestic organic products and other agricultural products.
The purpose of this study is to evaluate the environmental implications of eco-labeling of the various rice farming systems, i.e., conventional, low-pesticide, non-pesticide, and organic farming specifically as they pertain to rice farming. The environmental implications of eco-labeling for the Korean rice farming systems are compared to determine the impacts of conventional rice farming. The life cycle inventory (LCI) provided in the U.S. and European databases are used to identify how Korean eco-friendly rice farming practices compare with other countries’ farming systems.
2. Materials and Methods
2.1. Agricultural Product: Rice
The Food and Agriculture Organization (FAO) reported that rice is one of the most important food crops in Asia [32] (Table 1). Although the global production of rice has been declining for decades, an estimated 491.7 million tons was produced in 2015. The majority (87%) of rice is produced in Asia, particularly China (29.0%), India (21.2%), Indonesia (9.3%), Bangladesh (7.1%), Vietnam (6.0%), the Philippines (2.3%), Japan (1.5%), and Korea (1.0%) [32]. Rice is the main agricultural produce in some Asian countries. For example, 90 percent of the total agricultural area in Cambodia is used for rice production. In South Korea, rice accounts for about 79.0 percent of staple grains [33]. The farmland area in 2016 is 1,644,000 hectares (896,000 hectares of rice paddies (54.5%) and 748,000 hectares of fields (45.5%)) and the farmland area per household is 1.46 hectares.
In 2015 and 2016, the worldwide consumption of rice was 495.3 million metric tons of paddy equivalents with the largest number of consumers in China, by far, consuming 145.4 million metric tons of paddy equivalents and India consuming 97.5 million metric tons of paddy equivalents. In the same years, the United States consumed 3.6 million metric tons of paddy equivalents and the production quantity was 6.1 million metric tons. The annual consumption of rice per capita in most Asian areas is high. For instance, FAO reported in 2017 that the higher annual consumption of rice per capita was 77.2 kg in China, 76.0 kg in Korea, and 50.3 kg in Japan [32]. In contrast, the per capita annual consumption of rice in the United States was only 8.9 kg, which was about 8.7 times lower than China’s per capita consumption.
2.2. Eco-Labeling System for Agricultural Products
Eco-labels are a labeling system for food and consumer products. Eco-labels can provide useful information to consumers about agricultural products that are not only produced using eco-friendly methods but also are healthy, fresh, and more nutritious [34,35,36]. For these reasons, many countries make an effort to offer clear information about the “green” characteristics of food products.
There are several examples of eco-labels for agricultural and food products. Biodynamics is one farming system that uses eco-labeling. It is an organic farming system that supplies farms with a living, dynamic, spiritual entity that attempts to bring food into balance [37,38]. For example, Certified Naturally Grown (CNG) is a grassroots alternative to the National Organic Program (NOP) of the United States Department of Agriculture (USDA) that puts less emphasis on some NOP rules and more emphasis on NOP production practices as the basis for its own organic standards [39]. Another eco-label term is “environmentally friendly”, which is a general term used to describe products or services that result in minimal to no harm to the environment during production or processing.
According to the Environmentally-Friendly Agriculture Promotion Act [40] enacted in 1999 in South Korea, the term “eco-friendly agricultural products” refers to products that either do not use or that minimize the use of synthetic pesticides, chemical fertilizers, antibiotics, bactericides, and other chemical materials, and recycle the byproducts of farming, animal husbandry, and forestry. Through eco-friendly agriculture, the farming ecosystem and the environment are maintained and preserved when producing agricultural products [41]. These eco-friendly agricultural products can be categorized according to the production methods and materials used: organic, non-pesticide (pesticide-free), and low-pesticide agricultural products [42].
The Environmentally-Friendly Agricultural Products Certification (EFAPC) standards in South Korea are defined as follows (Table 2). The low-pesticide agricultural standard includes agricultural products that have been cultivated without the use of organo-synthetic agricultural pesticides, less than double dosage on the final day of application, and with less than one-half of the recommended amount of applied fertilizer consisting of chemical fertilizer. The non-pesticide certification standard pertains to agricultural products that have been cultivated without the use of organo-synthetic agricultural pesticides and less than one-third of the recommended amount of applied fertilizer consisting of chemical fertilizer. The organic certification standard includes agricultural products that have been cultivated without the use of organo-synthetic agricultural pesticides or chemical fertilizer.
Among the eco-friendly agricultural products produced in 2016 in South Korea, about 233,403 tons of grain (40.9%) were produced, making it the most productive crop [43]. The Korean Rural Economic Institutes (KREI) expects a 5.3% annual growth of the environmentally-friendly market for agricultural products by 2017 [44]. The shares of organic rice (43,538 tons) and non-pesticide rice (126,191 tons) in 2015 were 1.0% and 2.92%, respectively.
2.3. Life Cycle Assessment for Rice Farming Systems
2.3.1. Goal and Scope Definition
The goal of this study was to evaluate the environmental implications of eco-labeling in South Korean rice farming systems by conducting an LCI and performing a life cycle impact analysis of eco-labeling for four systems: conventional, low-pesticide, non-pesticide, and organic rice farming systems.
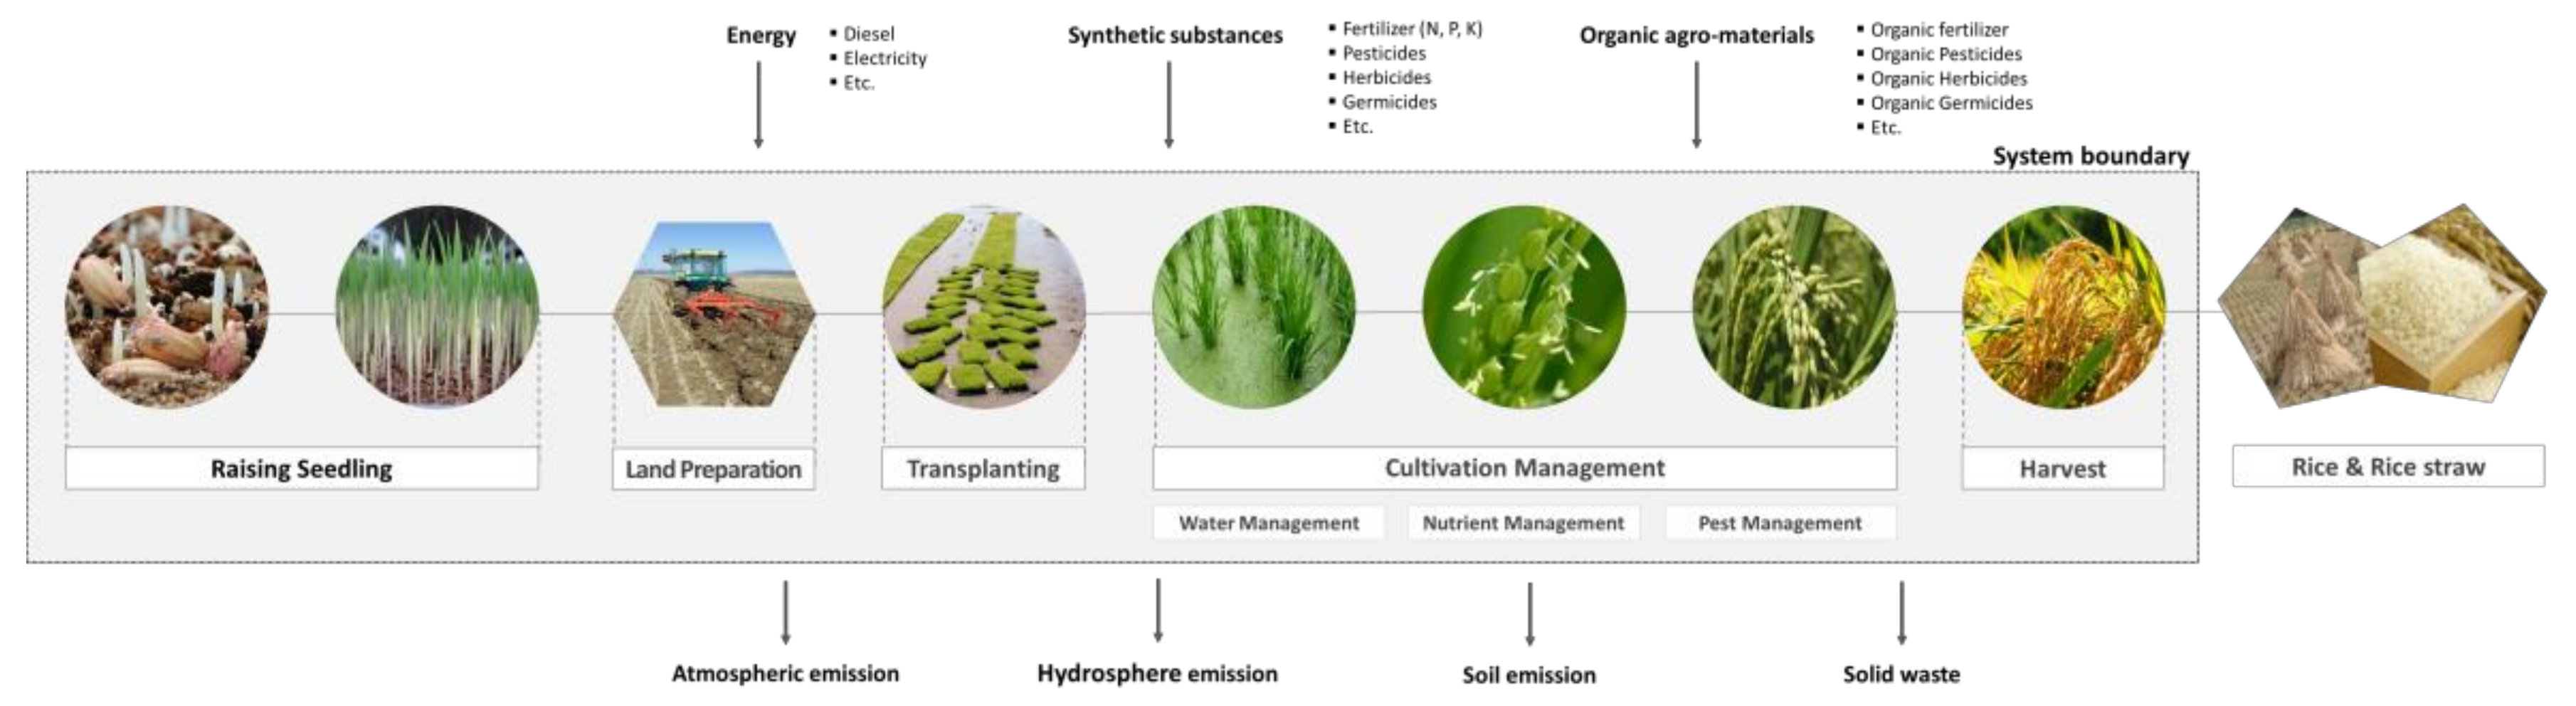
Agricultural products are generally based on a mass reference of 1 kg of output of farm products [47,48,49]. For the purposes of the present analysis, the functional unit was set at 1 kg of paddy rice production, as measured in an unpackaged state at the farm exit gate. The system boundary in this study was established using a gate-to-gate (GtG) perspective. All agricultural systems generally consist of seeding, preparation of the soil, cultivation, and harvest according to rice farming steps. The materials needed to produce agricultural products include raw materials (e.g., seeds and nursery), sub-materials (e.g., agricultural pesticides, fertilizers, and other agromaterials), and energy (e.g., electricity, diesel, and coal).
Examining the full life cycle is also important since rice production releases emissions into the atmosphere, hydrosphere, and soil. The life cycle of rice production includes four stages: pre-production, production, consumption, and disposal. Rice farming pre-production includes inputs of farming systems such as agricultural pesticides, fertilizers, and fuel. The production stage refers to all phases associated with cultivation and harvest including sterilizing seeds, plowing rice fields, planting rice, spraying agricultural pesticides and fertilizers, harvesting, drying cereals, and polishing. The consumption stage includes manufacturing, packaging, distribution, and consumption of the produced rice. The final disposal stage involves treatment and disposal including making fodder, composting, landfill, water treatment, and methanation.
In general, a cradle-to-gate (CtG) perspective is the standard system boundary for crop production systems [50]. However, the system boundary is set up for the present study according to a gate-to-gate (GtG) principle, excluding the consumption and disposal stages since endemic databases for chemical materials used in the agricultural sector have not been established yet in South Korea. The system boundaries for rice farming systems are illustrated in Figure 1.
2.3.2. Life Cycle Inventory Analysis
In preparation for collecting data as established in the goal and scope definition for this study, an LCI was conducted to derive a quantitative input–output inventory based on ISO 14040:2006 standards [26]. To set up the LCI for conventional rice farming, some statistical survey data from the Agricultural Production Cost Survey (APCS) [51] and the Income of Agricultural and Livestock Products (IALP) [52] in South Korea were used. The Rural Development Administration (RDA) provided the standard rate of fertilizer.
For data on the amount of agrochemicals used in low-pesticide, non-pesticide, and organic rice farming systems, this study used the maximum amount of the standard permissible value as suggested by the National Agricultural Products Quality Management Service (NAQS) in South Korea. To conduct the LCI of organo-synthetic agriculture chemicals used in rice farming, the study also referenced the RDA’s information regarding agricultural chemicals used in the production of agricultural products. The LCI of pesticides in this study used the original ingredients of agricultural chemicals, the amounts of active components of the chemicals, and the excretion pathways to atmospheric, hydrosphere, and soil [53]. The yields of conventional and environmentally-friendly rice were applied considering the production efficiency according to different rice farming systems [54,55].
This study also used the agriculture light and heat expenses data from the Income of Agricultural and Livestock Products (IALP) published by the RDA [52] for figures on energy consumption. The publication includes (1) information about consumption of electricity for agriculture; (2) oil types such as diesel, gasoline, and kerosene; and (3) the amounts of atmospheric emissions when these are used in farming. In general, only physical inputs and outputs of rice farming were quantified, with the exceptions of environmental loads related to manufacturing agricultural machinery, economic costs, input of man-power, and construction of agriculture infrastructures such as agricultural reservoirs, irrigation canals, and roads [31].
The total amounts of fertilizer used in rice farming per kg of rice were as follows (Table 3): 1.53 × 10⁻² kg in conventional farming, 7.64 × 10⁻³ kg in low-pesticide farming, and 5.05 × 10⁻³ kg in non-pesticide farming. The organo-synthetic agricultural chemicals used, including germicides, insecticides, and herbicides, were 1.05 × 10⁻³ kg in conventional farming per kg of rice, 5.27 × 10⁻⁴ kg in low-pesticide farming, and none in non-pesticide and organic farming. In addition, vinyl and non-woven fabrics were used in equal amounts in all rice farming systems.
The environmental implications of rice farming systems in the U.S. and Europe were analyzed using the U.S. LCI database provided by NREL for U.S. figures [56] and the ecoinvent database for European figures [57]. Ecoinvent is a systematically and diversely established database of agricultural products, covering all agriculture and stockbreeding matters, including agricultural products, agriculture infrastructures, agromaterials, and farm machinery. Ecoinvent provides more detail about fertilizers, pesticides, and agricultural work processes than the U.S. LCI database. GaBi software, an LCA software invented by PE International Sustainability Performance, was used to conduct and assess the environmental impact of the rice farming systems.
According to the U.S. LCI, electricity, diesel, liquefied petroleum gas, and natural gas are used for energy in producing rice in the U.S. Lime, nitrogen fertilizer, phosphorous, and potash are used as fertilizers and make up 4.03 × 10⁻² kg of the fertilizers used in the production of 1 kg of rice. In contrast, according to ecoinvent, pesticides, work processes, fertilizers, and inorganics are all used in European rice production. The total amount of pesticide used to produce 1 kg of rice is 5.62 × 10⁻⁴ kg and the total amount for fertilizer is 1.93 × 10⁻² kg. One difference between the two databases is that the ecoinvent database lists the work processes for agriculture inventories in terms of usable area while energy consumption is used in the U.S. LCI.
2.3.3. Life Cycle Impact Analysis
Agricultural production contributes significantly to environmental implications on climate change potential, acidification potential, and eutrophication potential [58,59,60,61]. Thus, the International Reference Life Cycle Data System (ILCD) recommendations include several impact categories [62]. Of these, the following impact categories were used to evaluate the environmental implications of rice farming systems. The categories related to agricultural production are climate change potential (CCP), terrestrial eutrophication potential (TEP), aquatic eutrophication potential (AEP), and acidification potential (AP). Other categories are cancerous human toxicity potential (HTP-CE), non-cancerous human toxicity potential (HTP-NCE), particulate matter or respiratory inorganics potential (PMP), photochemical ozone formation potential (POFP), and freshwater aquatic ecotoxicity potential (FAEP).
Characterization describes and quantifies the environmental impact of the analyzed product system. Characterization provides a way to directly compare the LCI results within each impact category. Characterization factors, also commonly called equivalent factors, translate different inventory inputs into directly comparable impact indicators, which are typically characterized using Equation (1):
where is the indicator value per functional unit for impact category ; is the release of emission (or consumption of resource) per functional unit; is the characterization factor for emission (or resource) contributing to impact category .
Although normalization is an optional LCIA tool, the normalized impact indicator results are non-dimensional quantities that allow for a comparison between different impact categories to show which impact category has a normal amount and which one is relatively larger. The indicator results per functional unit (e.g., a kilogram of grain) are related to the respective indicator results for a defined reference area according to Equation (2):
where is the normalization result per functional unit for impact category ; is the indicator value per functional unit for impact category ; is the indicator value for a reference situation (e.g., per person in Europe) for impact category , which is also called a normalization value or factor. We used the ILCD normalization factors as a guide. These factors are provided in the ILCD handbook, which was produced in 2011 by the Institute for Environment and Sustainability in the European Commission’s Joint Research Centre (JRC-IES).
Weighting is also an optional element of the LCIA. This step assigns a weight or relative value to the different impact categories based on the value choices and not on scientific principles. Weighting is used to compare different impact indicator results based on their significance. We used the weighting sets for midpoint weighting factors suggested by Huppes et al. [63].
2.3.4. Interpretation
Life cycle interpretation is a systematic technique to identify, quantify, check, and evaluate information from the results of the LCI and the LCIA, and to then communicate them effectively. The International Standards Organization (ISO) has defined the objectives of life cycle interpretation [26] in two categories. The first category includes analyzing results, reaching conclusions, explaining limitations, and providing recommendations based on the findings of the preceding phases of the LCA, and then reporting the results of the life cycle interpretation in a transparent manner. The second category entails providing a readily understandable, complete, and consistent presentation of the results of an LCA study in accordance with the goal and scope of the study. The ISO standards, especially ISO 14040:2006 [26], lay out the steps for several processes: (1) conducting a life cycle interpretation; (2) identifying the significant issues based on the LCI and LCIA; (3) evaluating the completeness, sensitivity, and consistency checks; and (4) concluding, recommending, and reporting.
The major GHG emissions in agriculture can be divided into direct emissions and indirect emissions. Direct emissions mean emissions through land use during crop cultivation. Indirect emissions include GHG emissions from the production of inputs such as fertilizers and pesticides and fuel combustion from agricultural machinery. However, this study did not consider the direct field emission from land use in the rice growing process. Only indirect emissions from farming materials and energy input were considered since the environmentally friendly agricultural products certificate system operates based on the amount of agricultural materials that is used when cultivating the crops. Methane emissions from rice field cultivation using direct field emissions in paddy fields were estimated using the agricultural sector GHG emissions formula presented in the 2006 IPCC Guidelines. To calculate the amount of greenhouse gas emissions, the Tier 1 value of IPCC 1996/2006 was applied to the rice cultivation area and it was calculated using the organic fertilizer application, the presence of water management, the number of cultivation days, and the number of days of water lodging.
The ecoinvent database was used for the life cycle inventory of agricultural materials such as fertilizers, organo-synthetic pesticides, and energy to evaluate environmental implications on rice farming systems in South Korea. The evaluations have been conducted based on the assumption that the manufacturing processes of inputs for the production of agricultural materials such as fertilizers and pesticides are the same in Europe and Korea [31,64]. However, since the environmental impacts on farming materials may vary depending on each country’s characteristics, the existing U.S. and EU databases were compared to determine whether these databases do differ by country. In particular, this study conducted a comparative analysis to evaluate how the environmental impact of the ecoinvent [57] and the U.S. LCI databases [56] differ for the same process. Energy and fertilizers, which are important processes in the eco-labeling system, were selected to compare these databases. Characterization, normalization, and weighting were performed on the same proceedings as in previous environmental impact methods for the same processes including Nitrogen (N) fertilizers and diesel.
3. Results and Discussion
3.1. LCA of Rice Farming Systems in South Korea
The findings of this study indicate that the climate change potential (CCP) of conventionally farmed rice is 1.01 kg carbon dioxide (CO2) equivalents per 1 kg of rice, which is a larger value than the CCP of environmentally-friendly rice. The low-pesticide rice CCP value is 0.701 kg CO2-equiv. per 1 kg of rice or 69.41% of the conventional rice CCP value. The non-pesticide rice CCP value is 0.537 kg CO2-equiv. per 1 kg of rice or 53.17% of conventional rice impact. The organic rice CCP value is 0.234 kg CO2-equiv. per 1 kg of rice, which is only 23.17% of the impact of conventional rice.
Through the eco-labeling system of rice farming, a reduction in chemical fertilizers and organo-synthetic agricultural chemicals has a measurable effect on CCP. By cutting the amount of fertilizers and pesticides in half, as in the case of low-pesticide rice farming, the potential of aquatic eutrophication can be reduced up to 49.02%. Furthermore, by decreasing the chemical fertilizer by one-third, the potential of aquatic eutrophication is reduced 46.83% and uses no agricultural chemicals (organic farming); therefore, chemicals are reduced by 76.83% (Table 4).
Domestic South Korean research on rice farming, particularly by Ryu et al., has reported that the national average of carbon emissions of a top-down research method is 2.39 kg CO2-equiv. Their case analysis of a bottom-up research method reported carbon emissions at 1.04 kg CO2-equiv. per 1 kg of conventional rice farming. The results of their case study were that carbon emissions are 103% higher than the results of conventional rice in this study. In addition, Ryu et al.’s national average for carbon emissions is 237% higher than that of conventional rice in the present study. These differences may be attributed to variances in the amounts of fertilizer, organo-synthetic chemicals, and agromaterials, and differences in yield production among crop seasons. Lower GHG emissions may also be the result of lower crop yields and may not be related to the farming system [65,66].
Hokazono et al. evaluated the CCP of rice farming including organic agro-materials in Japan and found the following values: conventional rice is 1.50 kg CO2-equiv., sustainable rice is 1.30 kg CO2-equiv., and organic rice is 1.65 kg CO2-equiv. The differences in the consequence value of climate change with Korean rice farming in this study may be due to establishing different system boundaries than Japanese rice farming research considering organic agromaterials for organic farming. According to these differences in system boundaries, the CCP of Japanese rice is 149% higher than Korean conventional rice farming and 705% higher than Korean organic farming per kg of rice. When farming 1 kg of rice in Thailand, the potential of climate change is 2.93 kg CO2-equiv., as reported by Kasmaprapruet et al. [67]. However, the Thailand study’s system boundary included transportation, drying, and milling, which may account for the resulting CCP being 290% higher than the current study’s Korean conventional rice farming CCP. Blengini and Busto [65] also established a system boundary for their study of rice produced in Vercelli, Italy, which included the milling process and found the potential of climate change to be 2.9 kg CO2-equiv., which is 287% higher than 1 kg of Korean conventional rice farming.
The acidification potential (AP) of conventional rice has 6.33 × 10⁻⁴ mole of hydrogen ion (H+) equivalents per 1 kg of rice. This impact value is also the largest value among rice farming systems. The low-pesticide rice AP value is 4.91 × 10⁻⁴ mole of H+-equiv. per 1 kg of rice or 77.57% of the conventional rice impact. The non-pesticide rice AP value is 68.72% that of conventional rice at 4.35 × 10⁻⁴ mole of H+-equiv. per 1 kg of rice. The organic rice AP value is 49.45% of the conventional rice AP impact at 3.13 × 10⁻⁴ mole of H+-equiv. per 1 kg of rice.
The eutrophication potential (EP) is divided into terrestrial and aquatic eutrophication. In terms of terrestrial eutrophication (EP-T), the EP-T value of conventional rice is 3.02 × 10⁻³ mole of nitrogen (N) equivalents. The low-pesticide rice EP-T value is 2.48 × 10⁻³ mole of N-equiv., which is 82.12% of the impact of conventional rice. The non-pesticide rice EP-T value is 77.15% that of conventional rice, which is 2.33 × 10⁻³ mole of N-equiv. Finally, the organic rice EP-T value is 57.28% that of the impact of conventional rice at 1.73 × 10⁻³ mole of N-equiv.
As for the aquatic eutrophication (EP-A) values, conventional rice is measured at 6.03 × 10⁻⁶ kg of phosphorus (P) equivalents. Low-pesticide rice is measured at 3.02 × 10⁻⁶ kg of P-equiv. (50.08% of conventional rice). Non-pesticide rice is measured at 0.52% of the value of conventional rice at 3.13 × 10⁻⁸ kg of P-equiv. Finally, organic rice is measured at 0.11% of the impact of conventional rice at 6.47 × 10⁻⁹ kg of P-equiv.
Through the eco-labeling system of rice farming, the reduction in chemical fertilizers and organo-synthetic agricultural chemicals has a great effect on aquatic eutrophication potential. For low-pesticide rice farming, when cutting the amount of fertilizer and pesticide in half, the potential of aquatic eutrophication can be reduced to 48.5% that of conventional farming. Furthermore, aquatic eutrophication potential can be reduced by up to 99.9% by decreasing the chemical fertilizer to one-third of conventional methods or by eliminating agricultural chemicals.
The human toxicity potential (HTP) is divided into cancerous toxicity and non-cancerous toxicity in humans. The cancerous human toxicity potential (HTP-CE) of conventional rice has 8.02 × 10⁻¹⁰ comparative toxic units for humans (CTUh) per 1kg of rice. This impact value is the highest of all rice farming systems. The HTP-CE value of low-pesticide rice is 4.13 × 10⁻¹⁰ CTUh per 1 kg of rice (51.50% of conventional rice). The non-pesticide value of rice is 45.26% that of the impact of conventional rice at 3.63 × 10⁻¹⁰ CTUh per 1 kg of rice. The HTP-CE value of organic rice is 5.04% of the impact of conventional rice at 4.04 × 10⁻¹¹ CTUh per 1 kg of rice.
The non-cancerous human toxicity potential (HTP-NCE) of conventional rice is 1.19 × 10⁻⁷ CTUh per 1 kg of rice. The HTP-NCE value of low-pesticide rice is 1.03 × 10⁻⁷ CTUh per 1 kg of rice, 86.55% that of conventional rice. The HTP-NCE value of non-pesticide rice is 75.97% that of conventional rice at 9.04 × 10⁻⁸ CTUh per 1 kg of rice. The value of organic rice is 61.09% that of conventional rice at 7.27 × 10⁻⁸ CTUh per 1 kg of rice.
The particulate matter potential (PMP), also called respiratory inorganics potential, of conventional rice farming is 7.28 × 10⁻⁵ kg ultrafine particle (PM2.5) equivalents per 1 kg of rice. The PMP value of low-pesticide rice is 5.94 × 10⁻⁵ kg PM2.5-equiv. per 1 kg of rice or 81.59% that of conventional rice. The PMP value of non-pesticide rice is 5.54 × 10⁻⁵ kg PM2.5-equiv. per 1 kg of rice or 76.10% that of conventional rice. The impact of organic rice is 4.10 × 10⁻⁵ kg PM2.5–equiv. per 1 kg of rice, which is 56.32% that of conventional rice.
The photochemical ozone formation potential (POFP) of conventional rice is 6.38 × 10⁻⁴ kg of non-methane volatile organic compound (NMVOC) equivalents. The POFP value of low-pesticide rice is 5.66 × 10⁻⁴ kg NMOVOC-equiv. (88.71% that of conventional rice); the POFP value of non-pesticide rice is 5.21 × 10⁻⁴ kg NMOVOC-equiv. (81.66% that of conventional rice), and the POFP value of organic rice is 4.44 × 10⁻⁴ kg NMOVOC-equiv. (69.59% that of conventional rice).
The freshwater aquatic ecotoxicity potential (FAEP) of conventional rice has 0.111 comparative toxic units for ecosystems (CTUe) per 1 kg of rice. The potential of low-pesticide rice is 7.70 × 10⁻² CTUe (69.37% that of conventional rice), non-pesticide rice is 5.18 × 10⁻² CTUe (46.67% of conventional rice), and organic rice is 3.63 × 10⁻² CTUe (32.70% that of conventional rice).
Environmental indicators may be evaluated according to and using data from each environmental impact category. However, these indicators have limitations in that a quantitative assessment of the practical emissions is difficult. For this reason, normalization was employed to quantitatively evaluate how rice-farming systems affect the amount of emissions created on a global, per person, or specific area scale. Normalization allows comparisons of environmental indicators between impact categories.
Data on the environmental load of the reference area is necessary to accurately attribute the environmental load to an impact category. However, it is impossible to evaluate the total environmental impact of domestic activity in South Korea, since pollutant emissions are announced for only some pollutants in some organizations such as the Environment Department [68]. Thus, since there is little accurate information for South Korea, the present study instead used figures derived from 27 EU countries, provided by ILCD Recommendations.
As an example, the climate change potential of 1.01 to 0.224 kg CO2-equiv. resulting from the production of 1 kg of rice may be analyzed on its face as having a relatively large influence on the environment. However, normalization may show that it is, in reality, a significantly small value of about 1.0 × 10⁻¹³ of total emissions of the 27 EU countries. In another example, freshwater aquatic ecotoxicity potential was analyzed with results ranging from 0.111 to 0.036 CTUe depending on the farming system. However, as a result of normalization, the annual environmental impact in Europe is a smaller value of 1.0 × 10⁻¹⁴.
Among the nine environmental impact categories, non-cancerous human toxicity was analyzed as having the greatest influence. The production of 1 kg by conventional farming contributes to about 4.47 × 10⁻¹³ of all non-cancerous human toxicity occurring in European countries. In the current study, the low-pesticide rice rate is 3.87 × 10⁻¹³, the non-pesticide rice rate is 3.40 × 10⁻¹³, and the organic farming rate is 2.73 × 10⁻¹³.
Weighting is a process that determines the rank of the results of characterization or normalization indicators. The ratio of each indicator is set by analyzing the indicators divided by a standardized weight. The relative environmental influence of the production of Korean environmentally-friendly rice is the same as shown in Table 4 when the value of the influence of conventional farming is set at 100. The influence of each farming system is expressed in proportion to that value [69]. Conventional farming is ranked first, followed by low-pesticide farming (73.73), non-pesticide farming (59.57), and organic farming (34.31).
3.2. Interpretations of Rice Farming Systems
3.2.1. Direct Field GHG Emissions
Thanawong et al. [70] reported about 2.84 to 3.45 kg of CO2-equiv. in 1 kg of rice grown in rain-fed rice and 4.51 to 5.12 kg of CO2-equiv. in wet-season irrigated rice. Direct field emissions (greenhouse gas) accounted for the following percentages: 61.88% in rain-fed paddy rice, 27.29% in field operations, 8.68% in fertilizers including manufacturing and transport, 0.02% in pesticides, and 2.13% in rice seed production. In other words, in the case of wet-season irrigated rice, 2.79–3.17 kg CO2-equiv. at 4.51–5.12 kg CO2-equiv. is the carbon dioxide equivalents generated during the rice growing process. Brodt et al. [71] evaluated GHG and CO2-equiv. emissions for baseline rice production processes. The annual field emissions of direct GHG emissions are 1.02 kg CO2-equiv. per kg of rice, which accounts for 64.1% of the total CO2-equiv. emissions. Regarding indirect emissions for rice farming (including land preparation, fertilizer production and application, seed production and seeding, pest management, harvest and straw management, transportation, and the drying and milling processes), 0.57 kg CO2-equiv. are emitted in indirect field emissions. For comparison, Blengini and Busto [65] evaluated global warming potential (GWP) for Italian rice farming and found indirect and direct field emissions of about 32% and 68%, respectively, among the total GHG emissions (1.59 kg CO2-equiv. per kg of rice).
Previous research [65,70,71] has also estimated the ratio of indirect GHG emissions to the direct emissions. In these studies [65,70,71], the direct GHG emissions from methane production by anaerobic conditions in rice paddy fields occupies approximately 61.9–68.0%. In addition, the indirect GHG emissions from input agromaterials in rice farming account for about 32.0–38.1%. The direct emissions are 1.64–1.97, accounting for about 61.9% to 68.0% of the total GHG emissions. Conventional rice farming produces 2.65–2.98kg CO2-equiv. of rice 1kg. The GHG reduction effects of low-pesticide farming are 11–13% GHG reduction compared to conventional farming; non-pesticide is 18–21% and organic farming is 35–42% (Table 5).
3.2.2. Feasibility Test of Applicable National LCI
Since N fertilizers are the most commonly used fertilizer in rice cultivation, it was selected as the environmental impact comparison for fertilizer. We considered 1 kg of N fertilizer provided in the U.S. LCI database, but N fertilizer in the ecoinvent database is divided into urea, ammonium sulfate, ammonium nitrate, and ammonium phosphorus. In Ryu et al. [72], urea and ammonium sulfate were used for N fertilizer in Korea. Therefore, urea and ammonium sulfate were considered in the current study for the N fertilizer provided by ecoinvent. Since these two fertilizers have different nitrogen content, they were assigned 46% for urea and 21% for ammonium sulfate after evaluating the environmental impact for each kilogram.
For the weighting results comparing 1 kg of N fertilizer in the U.S. LCI and ecoinvent databases, the environmental impact of N fertilizer in the ecoinvent database (6.88 × 10⁻¹¹) was estimated to be 2.33 times higher than that of the U.S. LCI (2.95 × 10⁻¹¹) (Figure 2). In most categories, including climate change potential, the ecoinvent database was found to be about 106% to 349% higher than the U.S. LCI database. Specifically, the cancerous human toxicity potential was analyzed at 154 times higher than the ecoinvent database. In contrast, the particulate matter potential and acidification potential were found to be 93% and 41% higher in the U.S. LCI database than in the ecoinvent, respectively.
Unlike fertilizer, the environmental impact of 1 kg diesel based on the U.S. LCI database (4.10 × 10⁻¹¹) is about 2.94 times higher than that of the ecoinvent database (1.39 × 10⁻¹¹) (Figure 2). The U.S. LCI values are higher than the ecoinvent values in most environmental impact categories, except for climate change potential and cancerous human toxicity potential. In particular, non-cancerous human toxicity is about 896% higher than that of ecoinvent, with a U.S. LCI value of 8.06 × 10⁻¹². Similarly, the acidification potential is also about 338% higher for the U.S. LCI. In contrast, climate change and cancerous human toxicity are 85% and 7% higher in the U.S. LCI database than in ecoinvent, respectively.
The environmental impact can vary greatly given the different characteristics of the countries in which the databases are constructed. It is assumed that the production of the European and Korean production equipment is the same but more accurate results can be achieved by using the unique life cycle database reflecting the characteristics of Korea. These results suggest that Korea needs to build a life cycle inventory of all its agricultural materials, including fertilizers and pesticides.
3.3. Comparison of Environmental Implications of Rice Farming Systems by Country
The environmental implications of rice farming based on the databases in the U.S. and Europe are shown Table 6. All characterized impact indicators of U.S. rice farming, except for cancerous human toxicity potential, have higher values than those of European conventional rice farming.
The analysis revealed the following data. The impacts of CCP are 1.14 kg carbon dioxide (CO2) equivalents per kg of conventional rice in Europe and 1.62 kg CO2-equiv. in the United States. Acidification potential rates are 8.50 × 10⁻⁴ mole H+-equiv. and 5.83 × 10⁻³ mole H+-equiv. for Europe and the U.S., respectively. The eutrophication potential in Europe is 5 × 10⁻³ mole N-equiv. for terrestrial and 1.47 × 10⁻⁶ kg P-equiv. for aquatic. The U.S. results are 1.21 × 10⁻² mole N-equiv. for terrestrial and 3.05 × 10⁻⁵ kg P-equiv. for aquatic. The potential of cancerous human toxicity is 1.04 × 10⁻⁹ CTUh per kg of conventional rice in Europe, while it is 6.28 × 10⁻¹⁰ CTUh per kg rice in the U.S. Non-cancerous human toxicity is at 1.12 × 10⁻⁷ CTUh in Europe and 2.48 × 10⁻⁷ CTUh in the U.S. For 1 kg of conventional rice farming in Europe, the particulate matter rate is 9.25 × 10⁻⁵ kg PM2.5-equiv. and photochemical ozone formation 9.89 × 10⁻⁴ kg NMVOC-equiv. Ecotoxicity for aquatic fresh water is at 0.100 CTUe. Production of 1 kg of conventional rice in the U.S. results in 1.76 × 10⁻⁴ kg PM2.5-equiv. in particulate matter potential and 4.32 × 10⁻³ kg NMVOC-equiv. in photochemical ozone formation potential. Ecotoxicity for aquatic fresh water is at 0.408 CTUe.
The normalization phase uses normalizing factors recommended by the ILDC to identify the issues that are considered substantive by countries in various environmental implication categories. All of the environmental impacts of U.S. conventional rice farming are higher than Korean and European rice farming impacts except for cancerous human toxicity. Post-normalization, the most pressing potential environmental indicator emerged as non-cancerous human toxicity potential among the nine environmental impact categories, followed by climate change potential and photochemical ozone formation potential.
U.S. rice farming inputs such as fertilizer, agrochemicals, and energy are higher than those of the other countries in this study. These amounts have a decisive influence on environmental implications. However, the potential for cancerous human toxicity has low implications because it is considered to be influenced by the two different databases used and some different types of fertilizers and agrochemicals. When assessing the environmental implications, the present study consulted the U.S. LCI provided by NREL for U.S. rice farming figures, and the ecoinvent database was used for the Korean and European rice farming figures.
The relative environmental influences of the production of environmentally-friendly rice in the three studied areas are as follows when the impact value of conventional farming in the U.S. was set at 100 in weight (Figure 3). The highest ranked impacts are from conventional farming in the U.S., followed by European (53.73) and Korean farming, including conventional (48.56), low-pesticide (35.80), non-pesticide (28.93), and organic (16.66) farming.
4. Conclusions
This study evaluated the environmental implications of eco-labeling for rice farming systems, including conventional, low-pesticide, non-pesticide, and organic rice farming. The eco-labeling for Korean rice farming systems was compared with the environmental implications of the U.S. and European conventional rice farming to identify how eco-friendly Korean rice farming is compared to other countries’ farming systems. In particular, the environmental impact of Korean rice farming was quantitatively reviewed. The LCA was used in this study to evaluate the effects of environmental improvement since it is important to consider the life cycle of agricultural production.
The results show that eco-labeling systems can reduce the environmental impact of farming. In this study, we estimated the national level implications of organic and non-pesticide farming systems based on the impact of each unit. The annual reduction of GHGs can be expected to be up to 327 tons with a 10% share of the organic farming system. This study’s outputs can help the Korean government propagate the share of eco-friendly farming systems to reduce environmental impacts.
The present study had some limitations when conducting the LCA for eco-labeling. No unique LCI was available for agromaterials in South Korea. Thus, the figures for inventory of agromaterials were taken from the ecoinvent inventory database using the same production process assumptions.
It should be noted that there is no LCI information available for materials such as fertilizers and pesticides in South Korea. Thus, the ecoinvent database was used in this study to evaluate environmental implications for Korean rice farming systems with the assumption that Korean emissions would be similar to those of European countries. The accuracy of the results of the current study, therefore, depends on the similarity of materials from region to region, which may be affected by the different characteristics of the regions in question.
The findings of the present study contribute to our knowledge about the environmental impact of eco-labeling; however, more primary research on the LCI of agricultural materials in South Korea is needed, including fertilizers, other chemical input, and energy. Once these data have been collected, future research on the environmental impact of rice cultivation in South Korea will be more accurate.
The results of this study also support a recommendation for agricultural policies including direct payment for environmentally friendly farming, marketing for agro-food industries, and an environmental assessment of the agricultural sector. In addition, these results may be useful in proliferating and improving the methodology used to further evaluate eco-labeling and carbon labeling systems.
Acknowledgments
This research was supported by Basic Science Research Program through the National Research Foundation of Korea (NRF) funded by the Ministry of Science, ICT & Future Planning (NRF-2012R1A1A1015755).
Author Contributions
Solhee Kim designed and conducted the study, analyzed the data, and wrote the manuscript; Taegon Kim and Timothy M. Smith provided various materials and methods related to the research and reviewed and reformatted the overall paper; Kyo Suh developed the concept and supervised the project. All authors have read and approved the final manuscript.
Conflicts of Interest
The authors declare no conflict of interest.
References
- Agriculture and Climate Change in the EU: An Overview. Available online: http://climatepolicyinfohub.eu/agriculture-and-climate-change-eu-overview (accessed on 27 October 2015).
- Haines, A.; McMichael, A.J.; Smith, K.R.; Roberts, I.; Woodcock, J.; Markandya, A.; Armstrong, B.G.; Campbell-Lendrum, D.; Dangour, A.D.; Davies, M.; et al. Public health benefits of strategies to reduce greenhouse-gas emissions: Overview and implications for policy makers. Lancet 2009, 374, 2104–2114. [Google Scholar] [CrossRef]
- Leggett, J.A. China’s greenhouse gas emissions and mitigation policies. Curr. Politics Econ. North. West. Asia 2011, 20, 533–560. [Google Scholar]
- Parry, I.W.H. Are the costs of reducing greenhouse gases from passenger vehicles negative? J. Urban Econ. 2007, 62, 273–293. [Google Scholar] [CrossRef]
- UNTC. Paris Agreement; United Nations Treaty Collection: Paris, France, 2016. [Google Scholar]
- Smith, P.; Martino, D.; Cai, Z.; Gwary, D.; Janzen, H.; Kumar, P.; McCarl, B.; Ogle, S.; O’Mara, F.; Rice, C.; et al. Policy and technological constraints to implementation of greenhouse gas mitigation options in agriculture. Agric. Ecosyst. Environ. 2007, 118, 62–68. [Google Scholar] [CrossRef]
- Lehuger, S.; Gabrielle, B.; Laville, P.; Lamboni, M.; Loubet, B.; Cellier, P. Predicting and mitigating the net greenhouse gas emissions of crop rotations in Western Europe. Agric. For. Meteorol. 2011, 151, 1654–1671. [Google Scholar] [CrossRef]
- Smith, P.; Martino, D.; Cai, Z.; Gwary, D.; Janzen, H.; Kumar, P.; McCarl, B.; Ogle, S.; O’Mara, F.; Rice, C. Agriculture In ‘Climate Change 2007: Mitigation—Contribution of Working Group III to The Fourth Assessment Report of The Intergovernmental Panel on Climate Change’; Cambridge University Press: Cambridge, UK, 2007. [Google Scholar]
- Smith, P.; Martino, D.; Cai, Z.; Gwary, D.; Janzen, H.; Kumar, P.; McCarl, B.; Ogle, S.; Mara, F.; Rice, C.; et al. Greenhouse gas mitigation in agriculture. Philos. Trans. R. Soc. Lond. B Biol. Sci. 2008, 363, 789–813. [Google Scholar] [PubMed]
- Weersink, A.; Livernois, J.; Shogren, J.F.; Shortle, J.S. Economic instruments and environmental policy in agriculture. Can. Public Policy Anal. Politiques 1998, 24, 309–327. [Google Scholar] [CrossRef]
- Tacconi, L. Redefining payments for environmental services. Ecol. Econ. 2012, 73, 29–36. [Google Scholar] [CrossRef]
- Friel, S.; Dangour, A.; Garnett, T.; Lock, K.; Chalabi, Z.; Roberts, I.; Butler, A.; Butler, C.; Waage, J.; McMichael, A.; et al. Public health benefits of strategies to reduce greenhouse-gas emissions: Food and agriculture. Lancet 2009, 374, 2016–2025. [Google Scholar] [CrossRef]
- Codex Alimentarius Commission; Joint FAO/WHO Food Standards Programme; World Health Organization. Codex Alimentarius Commission: Procedural Manual; Food & Agriculture Organization: Rome, Italy, 2007. [Google Scholar]
- Codex Alimentarius: How It All Began. Available online: http://www.fao.org/docrep/v7700t/v7700t09.htm (accessed on 1 April 2018).
- Scott, J. The WTO Agreement on Sanitary and Phytosanitary Measures: A Commentary; OUP Catalogue: Geneva, Switzerland, 2009. [Google Scholar]
- WHO. Understanding the Codex Alimentarius; World Health Organization: Geneva, Switzerland, 2006. [Google Scholar]
- Suh, S.; Choi, E.; Jeong, H.; Lee, J. Study on evaluation of carbon emission and sequestration in pear orchard. Korean J. Environ. Biol. 2016, 34, 257–263. [Google Scholar] [CrossRef]
- Life Cycle Assessment in Agriculture. Available online: http://www1.agric.gov.ab.ca/$Department/deptdocs.nsf/all/sag15417/$FILE/LifeCycle-Assessment.pdf (accessed on 15 May 2016).
- Directions toward Sustainable Agriculture. Com 22: Final; Commission of the European Communities: Brussels, Belgium, 1999.
- UN-DSD. Improving Governments’ Role in The Promotion of Environmental Managerial Accounting; United Nations Publications: New York, NY, USA, 2000. [Google Scholar]
- Brentrup, F.; Küsters, J.; Kuhlmann, H.; Lammel, J. Environmental impact assessment of agricultural production systems using the life cycle assessment methodology: I. Theoretical concept of a LCA method tailored to crop production. Eur. J. Agron. 2004, 20, 247–264. [Google Scholar] [CrossRef]
- Ryu, J.; Kim, K. Application of LCA methodology on lettuce cropping systems in protected cultivation. Korean J. Soil Sci. Fertil. 2010, 43, 705–715. [Google Scholar]
- Stoessel, F.; Juraske, R.; Pfister, S.; Hellweg, S. Life cycle inventory and carbon and water footprint of fruits and vegetables: Application to a Swiss retailer. Environ. Sci. Technol. 2012, 46, 3253–3262. [Google Scholar] [CrossRef] [PubMed]
- Kalhor, T.; Rajabipour, A.; Akram, A.; Sharifi, M. Environmental impact assessment of chicken meat production using life cycle assessment. Inf. Process. Agric. 2016, 3, 262–271. [Google Scholar] [CrossRef]
- The World Food LCA Database Project: Towards More Accurate Food Datasets. Available online: http://lcafood2014.org/papers/19.pdf (accessed on 1 April 2018).
- ISO. ISO 14040:2006—Environmental Management—Life Cycle Assessment–Principles and Framework; International Organization for Standardization: Geneva, Switzerland, 2006. [Google Scholar]
- Boyd, C.; Cady, R. A 50-Year Comparison of the Carbon Footprint of the U.S. Swine Herd: 1959–2009; Camco: London, UK, 2012. [Google Scholar]
- Capper, J. The environmental impact of United States beef production: 1997 compared with 2007. J. Anim. Sci. 2011, 89, 4249–4261. [Google Scholar] [CrossRef] [PubMed]
- Capper, J.; Cady, R.; Bauman, D. The environmental impact of dairy production: 1944 compared with 2007. J. Anim. Sci. 2009, 87, 2160–2167. [Google Scholar] [CrossRef] [PubMed]
- Shim, K.; Jeong, J.; So, K.; Lim, S.; Roh, K.; Kim, G.; Jeong, H.; Lee, D. Environmental Impact Assessmentimpact assessment of Agricultural Systems Usingagricultural systems using the Life Cycle Assessmentlife cycle assessment. Korean J. Soil Sci. Fertil. 2010, 43, 237–241. [Google Scholar]
- Lim, S.; Lee, C.; Yang, S. Environmental impact and external cost analysis by LCA: Conventional vs. organic rice. Korean J. Org. Agric. 2010, 18, 1–19. [Google Scholar]
- FAO. Food Outlook; Food and Agriculture Organization of the United Nations: Rome, Italy, 2017. [Google Scholar]
- KOSIS. Trend of Arable Land Area; Korean Statistics: Daejeon, Korea, 2017. [Google Scholar]
- Choi, Y. A Study on The Recognition And Purchase of Environmental-Friendly Agricultural Products—Focus on The Housewives in Chungnam Area. Master’s Thesis, Gongju University, Chngnam, Korea, 2014. [Google Scholar]
- Borregaard, N.; Dufey, A. Challenging Preconceptions about Trade In Sustainable Products—Toward Win-Win-Win For Developing Countries; International Institute for Environment and Development: London, UK, 2005. [Google Scholar]
- Komatsuzaki, M.; Syuaib, M.F. Comparison of the farming system and carbon sequestration between conventional and organic rice production in West Java, Indonesia. Sustainability 2010, 2, 833. [Google Scholar] [CrossRef]
- Perception of Eco-Labels: Organic and Biodynamic Wines. Available online: https://www.researchgate.net/profile/Magali_Delmas2/publication/265928639_PERCEPTION_OF_ECO-LABELS_ORGANIC_AND_BIODYNAMIC_WINES/links/54c011e50cf28eae4a6704af/PERCEPTION-OF-ECO-LABELS-ORGANIC-AND-BIODYNAMIC-WINES.pdf (accessed on 1 April 2018).
- McCullough, M.; Qenani, E.; MacDougall, N. Biodynamic practices, eco-label wines and Millennial consumers. J. Agric. Sci. Technol. A 2012, 2, 1364. [Google Scholar]
- Participatory Guarantee Systems—PGS; Swedish Society for Nature Conservation. Available online: https://www.ifoam.bio/sites/default/files/page/files/pgsstudybyssnc_2008.pdf (accessed on 20 May 2017).
- MAFRA. Environmental—Friendly Agricultural Promotion Act; Ministry of Agriculture, Food and Rural Affairs: Seoul, Korea, 2017; Volume 14305. [Google Scholar]
- Uphoff, N.; Dazzo, F.B. Making Rice Production More Environmentally-Friendly. Environments 2016, 3, 12. [Google Scholar] [CrossRef]
- Young, R.A.; Akhtar, M. Environmentally Friendly Technologies for The Pulp and Paper Industry; John Wiley & Sons: Hoboken, NJ, USA, 1998. [Google Scholar]
- NAQS. Certification Application Infomation; National Agricultural Products Quality Management Service: Seoul, Korea, 2017. [Google Scholar]
- Sung, J.; Lee, H. Domestic and Foreign Production and Market Outlook of Environmentally-Friendly; Agricultural Products Korea Rural Economic Institiute: Seoul, Korea, 2017; Volume 39. [Google Scholar]
- MAFRA. Fertilizer Control Act. Ministry of Agriculture. Available online: http://www.law.go.kr/lsSc.do?tabMenuId=tab18&p1=&subMenu=1&nwYn=1§ion=&tabNo=&query=%EB%B9%84%EB%A3%8C%EA%B4%80%EB%A6%AC%EB%B2%95#undefined (accessed on 15 September 2017).
- MAFRA. Pesticide Control Act. Ministry of Agriculture. Available online: http://www.law.go.kr/lsSc.do?tabMenuId=tab18&p1=&subMenu=1&nwYn=1§ion=&tabNo=&query=%EB%B9%84%EB%A3%8C%EA%B4%80%EB%A6%AC%EB%B2%95#undefined (accessed on 15 September 2017).
- Costello, C.; Xue, X.; Howarth, R. Comparison of production-phase environmental impact metrics derived at the farm-and national-scale for United States agricultural commodities. Environ. Res. Lett. 2015, 10, 114004. [Google Scholar] [CrossRef]
- World Food LCA Database Methodological Guidelines for the Life Cycle Inventory of Agricultural Products. Available online: https://www.researchgate.net/publication/264942094_World_Food_LCA_Database_Methodological_Guidelines_for_the_Life_Cycle_Inventory_of_Agricultural_Products (accessed on 20 May 2017).
- Lin, H.; Fukushima, Y. Rice cultivation methods and their sustainability aspects: Organic and conventional rice production in industrialized tropical monsoon Asia with a dual cropping system. Sustainability 2016, 8, 529. [Google Scholar] [CrossRef]
- Corrado, S.; Ardente, F.; Sala, S.; Saouter, E. Modelling of food loss within life cycle assessment: From current practice towards a systematisation. J. Clean. Prod. 2017, 140, 847–859. [Google Scholar] [CrossRef]
- RDA. Agricultural Production Cost Survey; The Rural Development Administration: Jeonju, Korea, 2015. [Google Scholar]
- RDA. The Income of Agricultural and Livestock Products; The Rural Development Administration: Jeonju, Korea, 2015. [Google Scholar]
- KCPA. Agrochemicals Use Guide Book (Annually); Korea Crop Protection Association: Seoul, Korea, 2003. [Google Scholar]
- Kang, C.; Park, H. Analysis of production efficiency of environmentally-friendly rice. J. Rural Dev. 2005, 28, 19–30. [Google Scholar]
- Thanh Nguyen, T.; Hoang, V.N.; Seo, B. Cost and environmental efficiency of rice farms in South Korea. Agric. Econ. 2012, 43, 369–378. [Google Scholar] [CrossRef]
- Smith, K.W. Drone technology: Benefits, risks, and legal considerations. Seattle J. Environ. Law 2015, 5, 290–302. [Google Scholar]
- Ecoinvent. Ecoinvent DATA v2.2. Ecoinvent Reports No. 1-25; Swiss Centre for Life Cycle Inventories: Dubendorf, Germany, 2012. [Google Scholar]
- Pardo, G.; Zufía, J. Life cycle assessment of food-preservation technologies. J. Clean. Prod. 2012, 28, 198–207. [Google Scholar] [CrossRef]
- Roy, R.; Misra, R.; Lesschen, J.; Smaling, E. Assessment of Soil Nutrient Balance: Approaches and Methodologies; Food and Agriculture Organization: Rome, Italy, 2003. [Google Scholar]
- Ruviaro, C.F.; Gianezini, M.; Brandão, F.S.; Winck, C.A.; Dewes, H. Life cycle assessment in Brazilian agriculture facing worldwide trends. J. Clean. Prod. 2012, 28, 9–24. [Google Scholar] [CrossRef]
- Saarinen, M.; Kurppa, S.; Virtanen, Y.; Usva, K.; Makela, J.; Nissinen, A. Life cycle assessment approach to the impact of home-made, ready-to-eat and school lunches on climate and eutrophication. J. Clean. Prod. 2012, 28, 177–186. [Google Scholar] [CrossRef]
- FAO. Internatioanl Reference Life Cycle Data System (Ilcd) Handbook—General Guide For Life Cycle Assessment—Detailed Guidance; First Edition March 2010 ed.; EUR 247108 EN; European Commision; Joint Research Centre; Institute for Environment and Sustainability: Luxembourg, 2010. [Google Scholar]
- Huppes, G.; van Oers, L.; Pretato, U.; Pennington, D.W. Weighting environmental effects: Analytic survey with operational evaluation methods and a meta-method. Int. J. Life Cycle Assess. 2012, 17, 876–891. [Google Scholar] [CrossRef]
- Ryu, J.; Lee, J.; Kim, K.; Kim, G.; Choi, E. A case study to estimate the greenhouse-gas mitigation potential on conventional rice production system. Korean J. Soil Sci. Fertil. 2013, 46, 502–509. [Google Scholar] [CrossRef]
- Blengini, G.; Busto, M. The life cycle of rice: LCA of alternative agri-food chain management systems in Vercelli (Italy). J. Environ. Manag. 2009, 90, 1512–1522. [Google Scholar] [CrossRef] [PubMed]
- Hokazono, S.; Hayashi, K. Variability in environmental impacts during conversion from conventional to organic farming: A comparison among three rice production systems in Japan. J. Clean. Prod. 2012, 28, 101–112. [Google Scholar] [CrossRef]
- Kasmaprapruet, S.; Paengjuntuek, W.; Saikhwan, P.; Phungrassami, H. Life cycle assessment of milled rice production: Case study in Thailand. Eur. J. Sci. Res. 2009, 30, 195–203. [Google Scholar]
- Chung, Y.; Kim, S.; Moon, J.; Lee, K. Determination of the Korean normalization scores for the life cycle assessment. J. Korea Soc. Environ. Eng. 1997, 19, 269–279. [Google Scholar]
- Noh, J.; Lee, K.; Kim, S. Methodology for the Key Issue Identification in Life Cycle Assessment. J. Korean Soc. Environ. Eng. 1997, 19, 1233–1245. [Google Scholar]
- Thanawong, K.; Perret, S.; Basset-Mens, C. Eco-efficiency of paddy rice production in Northeastern Thailand: A comparison of rain-fed and irrigated cropping systems. J. Clean. Prod. 2014, 73, 204–217. [Google Scholar] [CrossRef]
- Brodt, S.; Kendall, A.; Mohammadi, Y.; Arslan, A.; Yuan, J.; Lee, I.-S.; Linquist, B. Life cycle greenhouse gas emissions in California rice production. Field Crops Res. 2014, 169, 89–98. [Google Scholar] [CrossRef]
- Ryu, J.; Jung, S.; Kim, G.; Lee, J.; Kim, K. LCA (Life Cycle Assessment) for evaluating carbon emission from conventional rice cultivation system: Comparison of top-down and bottom-up methodology. Korean J. Soil Sci. Fertil. 2012, 45, 1143–1152. [Google Scholar] [CrossRef]
Figure 1.
System boundary for rice production in South Korea: gate-to-gate perspective. This system boundary includes raising seedlings, land preparation, transplanting, cultivation management (i.e., water, nutrients, and pest management), and harvest for rice farming of 1 kg.
Figure 1.
System boundary for rice production in South Korea: gate-to-gate perspective. This system boundary includes raising seedlings, land preparation, transplanting, cultivation management (i.e., water, nutrients, and pest management), and harvest for rice farming of 1 kg.

Figure 2.
Life-cycle assessment (LCA) results of nitrogen (N) fertilizer (1 kg) and diesel (1 kg) using the ecoinvent and the U.S. LCI databases. The results value for the unit process (1 kg of nitrogen fertilizer and diesel) are the total value after the normalization and weighting steps. In the case of environmental impacts of nitrogen fertilizer (a), the ecoinvent database ((a)-1) is 233% higher than the U.S. LCI ((a)-2). In contrast, the environmental impact of diesel based on the U.S. LCI database ((b)-2) is 295% higher than the ecoinvent database (b)-1).

Figure 3.
Environmental implications of rice farming systems by country. Each environmental impact value represents a relative value to the total value of the U.S. LCI that is the highest value compared to others. When setting the value of the total environmental impact based on the U.S. LCI as 100.0, the results of the environmental impacts on rice farming are ecoinvent (53.7), CRF (48.6), LRF (35.8), NRF (28.9), and ORF (16.7).


Table 1.
Worldwide rice production, consumption, and per capita consumption provided by the Food and Agriculture Organization (FAO) Food Outlook [32].
Table 1.
Worldwide rice production, consumption, and per capita consumption provided by the Food and Agriculture Organization (FAO) Food Outlook [32].
| Country | Rice Production in 2015 (Million Tons) | Rice Utilization in 2015/16 (Million Tons) | Per Capita Consumption of Rice in 2015/16 (kg/year) |
|---|---|---|---|
| China | 142.6 (29.0%) | 145.4 (29.4%) | 77.2 |
| India | 104.4 (21.2%) | 97.5 (19.7%) | 48.2 |
| Indonesia | 45.8 (9.3%) | 46.8 (9.4%) | 135.0 |
| Bangladesh | 35.0 (7.1%) | 35.8 (7.2%) | 180.8 |
| Vietnam | 29.4 (6.0%) | 21.8 (4.4%) | 155.7 |
| Thailand | 18.9 (3.8%) | 14.6 (2.9%) | 102.3 |
| Myanmar | 16.5 (3.4%) | 15.2 (3.1%) | 193.6 |
| Philippines | 11.4 (2.3%) | 12.7 (2.6%) | 116.3 |
| Brazil | 8.5 (1.7%) | 7.8 (1.6%) | 33.9 |
| Japan | 7.6 (1.5%) | 8.5 (1.7%) | 50.3 |
| Pakistan | 6.8 (1.4%) | 2.7 (0.5%) | 11.7 |
| United States | 6.1 (1.2%) | 3.6 (0.7%) | 8.9 |
| South Korea | 4.1 (0.9%) | 4.5 (0.9%) | 76.0 |
| World | 491.7 (100.0%) | 495.3 (100.0%) | 54.0 (average) |
| Asia | 428.8 (87.2%) | 434.3 (87.7%) | 78.1 (average) |
Table 2.
Certificated Standard of Environmentally-Friendly Agricultural Products Based on Certification-related Legislation in South Korea.
Table 2.
Certificated Standard of Environmentally-Friendly Agricultural Products Based on Certification-related Legislation in South Korea.
| Standards for Agricultural Products | Low Pesticide | Non-Pesticide | Organic | |
|---|---|---|---|---|
| Chemical fertilizer | less than half of the recommended amount of applied fertilizer | less than one-third of the recommended amount of applied fertilizer | without the use | |
| Organo-synthetic pesticide | Dosage | less than half of the recommended amount of applied pesticide | without the use | without the use |
| Spray time | two multiples in the period of the safety use standard | without the use | without the use | |
Notes: Standard for low-pesticide agricultural products was abolished in 2016. In the case of chemical fertilizer, the fertilizer ingredient content was recommended by the administrator of Rural Development Administration (RDA) or Agricultural Technology Center (ATC) for farming fields in South Korea. Also, fertilizer usage is the only use of fertilizer allowed by the Fertilizer Control Act in South Korea [45]. Crop dusting with organo-synthetic pesticide is the guideline for the safe use of pesticides according to Para. 2 of Art. 23 of the Agrochemicals Control Act in South Korea [46]. In addition, the timing at which the pesticide is sprayed for low-pesticide farm products applies to two multiples in the period of the safety use standard (Example: Use three days before harvest → Use six days before harvest).
Table 3.
Life cycle inventory of inputs for 1 kg of rice cultivation in South Korea.
| Input | Life Cycle Inventory | Unit | CRF | LRF | NRF | ORF | Sources |
|---|---|---|---|---|---|---|---|
| Fertilizer | Urea | kg | 1.25 × 10⁻³ | 6.26 × 10⁻⁴ | 4.13 × 10⁻⁴ | - | RDA |
| Ammonium sulfate | kg | 6.48 × 10⁻⁴ | 3.24 × 10⁻⁴ | 2.14 × 10⁻⁴ | - | RDA | |
| Fused phosphate | kg | 2.03 × 10⁻⁴ | 1.02 × 10⁻⁴ | 6.72 × 10⁻⁵ | - | RDA | |
| Fused superphosphate | kg | 9.94 × 10⁻⁶ | 4.97 × 10⁻⁶ | 3.28 × 10⁻⁶ | - | RDA | |
| Potassium chloride | kg | 1.83 × 10⁻⁴ | 9.13 × 10⁻⁵ | 6.02 × 10⁻⁵ | - | RDA | |
| Potassium sulfate | kg | 1.42 × 10⁻⁵ | 7.11 × 10⁻⁶ | 4.70 × 10⁻⁶ | - | RDA | |
| Calcium carbonate | kg | 1.82 × 10⁻³ | 9.08 × 10⁻⁴ | 5.99 × 10⁻⁴ | - | RDA | |
| Calcium silicate | kg | 2.76 × 10⁻³ | 1.38 × 10⁻³ | 9.12 × 10⁻⁴ | - | RDA | |
| Compound fertilizer | Nitrogen fertilizer | kg | 3.17 × 10⁻³ | 1.58 × 10⁻³ | 1.05 × 10⁻³ | - | RDA |
| Phosphorous fertilizer | kg | 2.64 × 10⁻³ | 1.32 × 10⁻³ | 8.72 × 10⁻⁴ | - | RDA | |
| Potassium fertilizer | kg | 2.60 × 10⁻³ | 1.30 × 10⁻³ | 8.58 × 10⁻⁴ | - | RDA | |
| Germicide | Thiocarbamate compound | kg | 6.64 × 10⁻⁶ | 3.32 × 10⁻⁶ | - | - | KCPA |
| Acetamide-anilide compound | kg | 2.32 × 10⁻⁷ | 1.16 × 10⁻⁷ | - | - | KCPA | |
| Benzimidazole compound | kg | 1.17 × 10⁻⁶ | 5.85 × 10⁻⁷ | - | - | KCPA | |
| Cyclic N compound | kg | 8.86 × 10⁻⁶ | 4.43 × 10⁻⁶ | - | - | KCPA | |
| Organophosphorus compound | kg | 1.46 × 10⁻⁴ | 7.29 × 10⁻⁵ | - | - | KCPA | |
| Pesticide unspecified | kg | 1.52 × 10⁻⁴ | 7.59 × 10⁻⁵ | - | - | KCPA | |
| Insecticide | Thiocarbamate compound | kg | 2.19 × 10⁻⁴ | 1.10 × 10⁻⁴ | - | - | KCPA |
| Organophosphorus compound | kg | 6.50 × 10⁻⁵ | 3.25 × 10⁻⁵ | - | - | KCPA | |
| Pesticide unspecified | kg | 1.31 × 10⁻⁴ | 6.53 × 10⁻⁵ | - | - | KCPA | |
| Pyretroid compound | kg | 1.21 × 10⁻⁶ | 6.07 × 10⁻⁷ | - | - | KCPA | |
| Herbicide | Sulfonyl urea compound | kg | 7.57 × 10⁻⁶ | 3.79 × 10⁻⁶ | - | - | KCPA |
| Thiocarbamate compound | kg | 6.75 × 10⁻⁵ | 3.38 × 10⁻⁵ | - | - | KCPA | |
| Benzothiadiazole compound | kg | 2.47 × 10⁻⁵ | 1.23 × 10⁻⁵ | - | - | KCPA | |
| Dinitroaniline compound | kg | 2.44 × 10⁻⁶ | 1.22 × 10⁻⁶ | - | - | KCPA | |
| Diphenylether compound | kg | 3.60 × 10⁻⁶ | 1.80 × 10⁻⁶ | - | - | KCPA | |
| Organophosphorus compound | kg | 5.16 × 10⁻⁷ | 2.58 × 10⁻⁷ | - | - | KCPA | |
| Pesticide unspecified | kg | 2.09 × 10⁻⁴ | 1.05 × 10⁻⁴ | - | - | KCPA | |
| Phenoxy compound | kg | 5.89 × 10⁻⁶ | 2.95 × 10⁻⁶ | - | - | KCPA | |
| Triazine compound | kg | 6.32 × 10⁻⁷ | 3.16 × 10⁻⁷ | - | - | KCPA | |
| Deposition | Sulfonyl urea compound | kg | 6.73 × 10⁻¹¹ | 3.37 × 10⁻¹¹ | - | - | NAQS |
| Thiocarbamate compound | kg | 9.39 × 10⁻⁸ | 4.69 × 10⁻⁸ | - | - | NAQS | |
| Bipyridylium compound | kg | 3.26 × 10⁻⁷ | 1.63 × 10⁻⁷ | - | - | NAQS | |
| Cyclic N compound | kg | 8.07 × 10⁻⁷ | 4.03 × 10⁻⁷ | - | - | NAQS | |
| Pesticide unspecified | kg | 3.32 × 10⁻⁴ | 1.66 × 10⁻⁴ | - | - | NAQS | |
| Energy | Electricity | kW | 4.11 × 10⁻³ | 3.61 × 10⁻³ | 2.30 × 10⁻³ | 2.05 × 10⁻³ | RDA |
| Diesel | m3 | 5.18 × 10⁻³ | 4.55 × 10⁻³ | 2.90 × 10⁻³ | 2.59 × 10⁻³ | RDA | |
| Kerosene | m3 | 7.61 × 10⁻⁴ | 7.61 × 10⁻⁴ | 7.61 × 10⁻⁴ | 7.61 × 10⁻⁴ | RDA | |
| Gasoline | m3 | 2.03 × 10⁻³ | 1.79 × 10⁻³ | 1.14 × 10⁻³ | 1.02 × 10⁻³ | RDA |
Notes: The types of rice farming consist of CRF (conventional rice farming), LRF (low-pesticide rice farming), NRF (non-pesticide rice farming), and ORF (organic rice farming). The life cycle inventory for rice farming of 1 kg consists of fertilizers, compound fertilizers, germicides, insecticides, herbicides, deposition, and energy.
Table 4.
Environmental implications of rice farming systems by impact category in South Korea.
| Impact Category | Characterized Value | Normalized Value | |||||||
|---|---|---|---|---|---|---|---|---|---|
| CRF | LRF | NRF | ORF | CRF | LRF | NRF | ORF | ||
| CCP | kg CO2-equiv. | 1.01 (100.00) | 0.701 (69.41) | 0.537 (53.17) | 0.234 (23.17) | 2.20 × 10⁻¹³ | 1.52 × 10⁻¹³ | 1.17 × 10⁻¹³ | 5.09 × 10⁻¹⁴ |
| HTP-CE | CTUh | 8.02 × 10⁻¹⁰ (100.00) | 4.13 × 10⁻¹⁰ (51.50) | 3.63 × 10⁻¹⁰ (45.26) | 4.04 × 10⁻¹¹ (5.04) | 4.36 × 10⁻¹⁴ | 2.24 × 10⁻¹⁴ | 1.97 × 10⁻¹⁴ | 2.20 × 10⁻¹⁵ |
| HTP-NCE | CTUh | 1.19 × 10⁻⁷ (100.00) | 1.03 × 10⁻⁷ (86.55) | 9.04 × 10⁻⁸ (75.97) | 7.27 × 10⁻⁸ (61.09) | 4.47 × 10⁻¹³ | 3.87 × 10⁻¹³ | 3.40 × 10⁻¹³ | 2.73 × 10⁻¹³ |
| PMP | kg PM2.5-equiv. | 7.28 × 10⁻⁵ (100.00) | 5.94 × 10⁻⁵ (81.59) | 5.54 × 10⁻⁵ (76.10) | 4.10 × 10⁻⁵ (56.32) | 3.83 × 10⁻¹⁴ | 3.13 × 10⁻¹⁴ | 2.92 × 10⁻¹⁴ | 2.16 × 10⁻¹⁴ |
| POFP | kg NMVOC-equiv. | 6.38 × 10⁻⁴ (100.00) | 5.66 × 10⁻⁴ (88.71) | 5.21 × 10⁻⁴ (81.66) | 4.44 × 10⁻⁴ (69.59) | 4.04 × 10⁻¹⁴ | 3.58 × 10⁻¹⁴ | 3.30 × 10⁻¹⁴ | 2.81 × 10⁻¹⁴ |
| AP | mole of H+-equiv. | 6.33 × 10⁻⁴ (100.00) | 4.91 × 10⁻⁴ (77.57) | 4.35 × 10⁻⁴ (68.72) | 3.13 × 10⁻⁴ (49.45) | 2.68 × 10⁻¹⁴ | 2.08 × 10⁻¹⁴ | 1.84 × 10⁻¹⁴ | 1.33 × 10⁻¹⁴ |
| EP-T | mole of N-equiv. | 3.02 × 10⁻³ (100.00) | 2.48 × 10⁻³ (82.12) | 2.33 × 10⁻³ (77.15) | 1.73 × 10⁻³ (57.28) | 3.45 × 10⁻¹⁴ | 2.83 × 10⁻¹⁴ | 2.66 × 10⁻¹⁴ | 1.97 × 10⁻¹⁴ |
| EP-A | Mole of P-equiv. | 6.03 × 10⁻⁶ (100.00) | 3.02 × 10⁻⁶ (50.08) | 3.13 × 10⁻⁸ (0.52) | 6.47 × 10⁻⁹ (0.11) | 8.14 × 10⁻¹⁵ | 4.08 × 10⁻¹⁵ | 4.22 × 10⁻¹⁷ | 8.73 × 10⁻¹⁸ |
| FATP | CTUe | 0.111 (100.00) | 7.70 × 10⁻² (69.37) | 5.18 × 10⁻² (46.67) | 3.63 × 10⁻² (32.70) | 2.55 × 10⁻¹⁴ | 1.77 × 10⁻¹⁴ | 1.19 × 10⁻¹⁴ | 8.33 × 10⁻¹⁵ |
| Weighted value | 8.11 × 10⁻¹² (100.00) | 5.98× 10⁻¹² (73.73) | 4.83× 10⁻¹² (59.57) | 2.78× 10⁻¹² (34.31) | |||||
Notes: The types of rice farming consist of CRF (conventional rice farming), LRF (low-pesticide rice farming), NRF (non-pesticide rice farming), and ORF (organic rice farming). Impact categories show CCP (climate change potential), HTP-CE (cancerous effects human toxicity potential), HTP-NCE (non-cancerous effect human toxicity potential), PMP (particulate matter potential), POFP (photochemical ozone formation potential), AP (acidification potential), EP-T (terrestrial eutrophication potential), EP-A (aquatic eutrophication potential), and FATP (freshwater aquatic ecotoxicity potential). The normalization step was conducted using a normalization factor [62]. The weighting step used midpoint weighting factors [63]. When setting the environmental impacts of CRF in the weighting step as 100, LRF, NRF, and ORF are 73.7%, 59.6%, and 34.3%, respectively.
Table 5.
Comparison of direct and indirect greenhouse gas (GHG) emissions in paddy fields.
| Comparison | Greenhouse Gas Emissions (kg CO2–Equiv. per kg Rice) | |||
|---|---|---|---|---|
| Total | Direct | Indirect | ||
| Thanawong et al. | 4.51–5.12 (100.0%) | 2.79–3.17 (61.9%) | 1.72–1.95 (38.1%) | |
| Brodt et al. | 1.59 (100.0%) | 1.02 (64.1%) | 0.57 (35.9%) | |
| Blengini and Busto | 2.90 (100.0%) | 1.97 (68.0%) | 0.93 (32.0%) | |
| Current study | CRF | 2.65–2.98 | 1.64–1.97 (61.9–68.0%) | 1.01 |
| LRF | 2.34–2.67 | 0.70 | ||
| NRF | 2.18–2.51 | 0.54 | ||
| ORF | 1.87–2.20 | 0.23 | ||
Notes: In the current study, the direct GHG emissions were calculated using a portion of the indirect GHG emissions with references, the direct GHG emission is 1.64–1.97 kg CO2-equiv. per 1 kg rice. In short, the total GHG emissions from 1 kg of rice farming in this study are 2.65–2.98 kg CO2-equiv. in CRF, 2.34–2.67 kg CO2-equiv. in LRF, 2.18–2.51 kg CO2-equiv. in NRF, and 1.87–2.20 kg CO2-equiv. in ORF.
Table 6.
Environmental impact of rice farming based on the U.S. and the EU life cycle inventory databases.
Table 6.
Environmental impact of rice farming based on the U.S. and the EU life cycle inventory databases.
| Impact Category | Unit | Characterized Value | Normalized Value | ||
|---|---|---|---|---|---|
| Ecoinvent (EU) | U.S. LCI (U.S.) | Ecoinvent (EU) | U.S. LCI (U.S.) | ||
| CCP | kg CO2-equiv. | 1.14 | 1.62 | 2.48 × 10⁻¹³ | 3.52 × 10⁻¹³ |
| HTP-CE | CTUh | 1.04 × 10⁻⁹ | 6.28 × 10⁻¹⁰ | 5.65 × 10⁻¹⁴ | 3.41 × 10⁻¹⁴ |
| HTP-NCE | CTUh | 1.12 × 10⁻⁷ | 2.48 × 10⁻⁷ | 4.21 × 10⁻¹³ | 9.32 × 10⁻¹³ |
| PMP | kg PM2.5-equiv. | 9.92 × 10⁻⁵ | 1.76 × 10⁻⁴ | 5.22 × 10⁻¹⁴ | 9.26 × 10⁻¹⁴ |
| POFP | kg NMVOC-equiv. | 9.89 × 10⁻⁴ | 4.32 × 10⁻³ | 6.26 × 10⁻¹⁴ | 2.73 × 10⁻¹³ |
| AP | mole of H+-equiv. | 8.50 × 10⁻⁴ | 5.83 × 10⁻³ | 3.60 × 10⁻¹⁴ | 2.47 × 10⁻¹³ |
| EP-T | mole of N-equiv. | 4.14 × 10⁻³ | 1.21 × 10⁻² | 4.73 × 10⁻¹⁴ | 1.38 × 10⁻¹³ |
| EP-A | Mole of P-equiv. | 1.47 × 10⁻⁶ | 3.05 × 10⁻⁵ | 1.98 × 10⁻¹⁵ | 4.12 × 10⁻¹⁴ |
| FATP | CTUe | 0.100 | 0.408 | 2.29 × 10⁻¹⁴ | 9.36 × 10⁻¹⁴ |
| Weighted value | 8.97 × 10⁻¹² | 1.67 × 10⁻¹¹ | |||
Notes: Impact categories show climate change potential (CCP), cancerous effects human toxicity potential (HTP-CE), HTP-NCE (non-cancerous effect human toxicity potential), PMP (particulate matter potential), POFP (photochemical ozone formation potential), AP (acidification potential), EP-T (terrestrial eutrophication potential), EP-A (aquatic eutrophication potential), and FATP (freshwater aquatic ecotoxicity potential). The normalization step was conducted using a normalization factor [62]. The weighting step used midpoint weighting [63]. The environmental impact of rice farming based on the U.S. LCI database (1.67 × 10⁻¹¹) is 186% higher than ecoinvent database (8.97 × 10⁻¹²).
© 2018 by the authors. Licensee MDPI, Basel, Switzerland. This article is an open access article distributed under the terms and conditions of the Creative Commons Attribution (CC BY) license (http://creativecommons.org/licenses/by/4.0/).
Share and Cite
MDPI and ACS Style
Kim, S.; Kim, T.; Smith, T.M.; Suh, K. Environmental Implications of Eco-Labeling for Rice Farming Systems. Sustainability 2018, 10, 1050. https://doi.org/10.3390/su10041050
AMA Style
Kim S, Kim T, Smith TM, Suh K. Environmental Implications of Eco-Labeling for Rice Farming Systems. Sustainability. 2018; 10(4):1050. https://doi.org/10.3390/su10041050
Chicago/Turabian StyleKim, Solhee, Taegon Kim, Timothy M. Smith, and Kyo Suh. 2018. "Environmental Implications of Eco-Labeling for Rice Farming Systems" Sustainability 10, no. 4: 1050. https://doi.org/10.3390/su10041050
Note that from the first issue of 2016, this journal uses article numbers instead of page numbers. See further details here.