Sustainability Assessment of Fuel Cell Buses in Public Transport


1
Department of Life Cycle Engineering (GaBi), Institute for Acoustics and Building Physics (IABP), University of Stuttgart, 70563 Stuttgart, Germany
2
Thinkstep AG, 70771 Leinfelden-Echterdingen, Germany
3
Department of Life Cycle Engineering (GaBi), Institute for Acoustics and Building Physics (IABP), University of Stuttgart, 70563 Stuttgart, Germany
*
Author to whom correspondence should be addressed.
Sustainability 2018, 10(5), 1480; https://doi.org/10.3390/su10051480
Submission received: 28 March 2018
/
Revised: 4 May 2018
/
Accepted: 5 May 2018
/
Published: 8 May 2018
(This article belongs to the Section Sustainable Transportation)
Abstract
:Hydrogen fuel cell (H2FC) buses operating in every day public transport services around Europe are assessed for their sustainability against environmental, economic and social criteria. As part of this assessment the buses are evaluated against diesel buses both in terms of sustainability and in terms of meeting real world requirements with respect to operational performance. The study concludes that H2FC buses meet operability and performance criteria and are sustainable environmentally when ‘green’ hydrogen is used. The economic sustainability of the buses, in terms of affordability, achieves parity with their fossil fuel equivalent by 2030 when the indirect costs to human health and climate change are included. Societal acceptance by those who worked with and used the buses supports the positive findings of earlier studies, although satisfactory operability and performance are shown to be essential to positive attitudes. Influential policy makers expressed positive sentiments only if ‘green’ hydrogen is used and the affordability issues can be addressed. No “show-stopper” is identified that would prevent future generations from using H2FC buses in public transport on a broad scale due to damage to the environment or to other factors that impinge on quality of life.

1. Introduction
There is an urgent need to find and develop alternative energy sources for stationary and mobility applications [1,2]. Climate change, local pollution, fossil fuel use and lack of energy security pose significant risks for people and ecosystems [3]. In response to these risks, the European Union (EU) has been facilitating the development of public transport vehicles that support the energy decarbonisation strategy for general mobility [4]. This has resulted in a number of Public-Private Partnerships to develop local zero emission public transport technology, including a succession of hydrogen fuel cell (H2FC) bus projects: CUTE (2001–2006) [5], HyFLEET:CUTE (2006–2009) [6], CHIC (2010–2016) [7] and JIVE (2017–2020) [8].
H2FC buses are being evaluated from many different perspectives. Life Cycle Assessments of H2FC buses [9,10] show that green H2 is key for significant environmental benefits compared with fossil driven diesel buses. Technical information on H2FC buses and their use in demonstration projects are also available [11,12,13,14,15]. Exergetic evaluation of H2FC buses have also been conducted [16]. Work on effects of light weighting has also been performed for automotive applications [17,18] as well as dealing with the challenges for modelling and integrating of light weighting into concept design [19]. However, there are no studies available on the effects of light weighting in relation to buses in general and H2FC buses in particular. Therefore, fuel consumption in real life operations was chosen in this article as the basis for the evaluation. While there are regulations for limiting the fuel consumption and accordingly the CO2 emissions per km of passenger cars and light duty vehicles [20] there is nothing similar for buses which makes the work on alternative low CO2 emission fuels in this field even more important.
There have also been two major cost studies conducted [21,22]. These two studies evaluate H2FC buses using a Total Cost of Ownership approach. However, they neglect the indirect cost of emission impacts on climate and human health and these impacts have been included in the study reported here.
Studies on the social aspects of the introduction of H2FC bus technology have focused on acceptance of the use of H2 as a fuel [23,24,25,26,27] and on the willingness to pay a price premium [28,29,30]. The work of these evaluations is extended in this report by examining the view of those responsible for the implementation of H2FC buses, of direct users and of those who are critical and/or sceptical of the technology.
Furthermore, none of the studies and articles mentioned incorporates all three pillars of sustainability in their evaluation of H2FC buses for an overall view of the technology.
H2FC powered buses are now a viable technological alternative to diesel powered buses [31]. However, it is essential that the technology delivers transport services that are truly sustainable and not just another contributor to environmental impact problems.
This article presents a broad assessment of the sustainability of H2FC buses against environmental, economic and social criteria.
2. Materials and Methods
The following chapter forms the basis for the methodological approach in this article. Commencing with a working definition of Sustainability, existing and available measures from real life application of, and experiences with the H2FC Buses are used. This is done by addressing all three pillars of sustainability and, additionally, evaluating the technical performance of the buses, as to be sustainable they have to fulfil the same duty as diesel buses.
2.1. Sustainability: A Working Definition
This article uses the definition of sustainability articulated by the UN World Commission on Environment and Development (the ‘Brundtland Report’). This report defines sustainable development as: “development that meets the needs of the present without compromising the ability of future generations to meet their own needs” [32]. In the context of H2FC buses, this can be re-phrased as follows:
“If we use H2FC buses today, can future generations also use them on a broad-scale, without damaging the environment or their quality of life?”
While commentators have been critical of the Brundtland definition, noting that it is paradoxical, confused and fraught with contradictions [33], it provides a useful and simple starting point for discussion. It acknowledges inter-generational equity and that a new technology may alter the natural and social environment with either a “sustaining” or destructive impact.
Since the publication of the “Brundtland Report,” the discourse on sustainability has morphed into a focus on the complex and dynamic interaction of environment, economy and society [34]. These three ‘pillars’ are constantly addressed in the literature on sustainability and issues around establishing a balance between the pillars remains a subject of considerable debate [2,35]. To understand the full implications of a new technology on sustainable development clearly requires a range of studies that target these complexities. This article seeks to extend that understanding by addressing all three pillars.
2.2. Boundary Conditions
The FC buses under evaluation are from different manufacturers and vary in several technical characteristics, such as capacity, length, weight and drivetrain (Table 1).
To facilitate the sustainability assessment of the buses it was decided to use an average bus. This would avoid the impacts of any specific local circumstances and enable general conclusions to be drawn. An example of the impact of local conditions is fuel consumption which has a major impact on sustainability. This can vary for the same bus type between 8.0 kg H2/100 km in one city up to 9.9 kg H2/100 km in another city depending on the local boundary conditions.
Table 2 shows the site-specific fuel consumption of the FC buses measured over up to 5 years in real time operations in daily revenue service over all four seasons and under typical operating conditions.
The environmental and economic sustainability evaluations reported in this paper are based on the 12 m H2FC and diesel non-articulated bus which is one of the most commonly used buses in Europe. It is also the basis for the Total Cost of Ownership calculation. The fuel consumption of similar diesel buses running under the same conditions was measured concurrently in order to provide a valid comparison.
Table 3 shows the consumption and expected lifetime of the buses. The bus lifetime of 720,000 km was used in previously reported studies [9,36,37] and was agreed by bus operators as a realistic average lifetime for current buses. Fuel cell (FC) stack lifetime is currently a key factor influencing H2FC bus lifetime. The expectation for the current stack generation is 12,000 h/Stack. Using an average speed of 20 km/h this results in 240,000 km stack lifetime. As the stack lifetime in the current generation is less than the bus lifetime, the stack has to be exchanged twice over the bus lifetime. It can be expected that future FCs will have a longer stack lifetime in the range of 20,000 to 25,000 h which would result in one stack change during the bus lifetime. This expectation is realistic as one fuel cell stack in the study exceeded 22,000 h and was still operating at the time of writing [37].
2.3. Technology and Operability Evaluation Methodology
The functionality of the technology from an engineering point of view is critical as H2FC buses must fulfil the same duty as the incumbent diesel buses. For public transport this can be assessed by the measurement of certain operating factors:
- Operating hours per day [h/d],
- Speed of refuelling [kg H2/min],
- Bus availability [%].
If the H2FC buses are found to offer the same operability as diesel buses, then attention can focus on the sustainability of the new technology in terms of the three pillars of environment, economics and society.
2.4. Environmental Sustainability Methodology
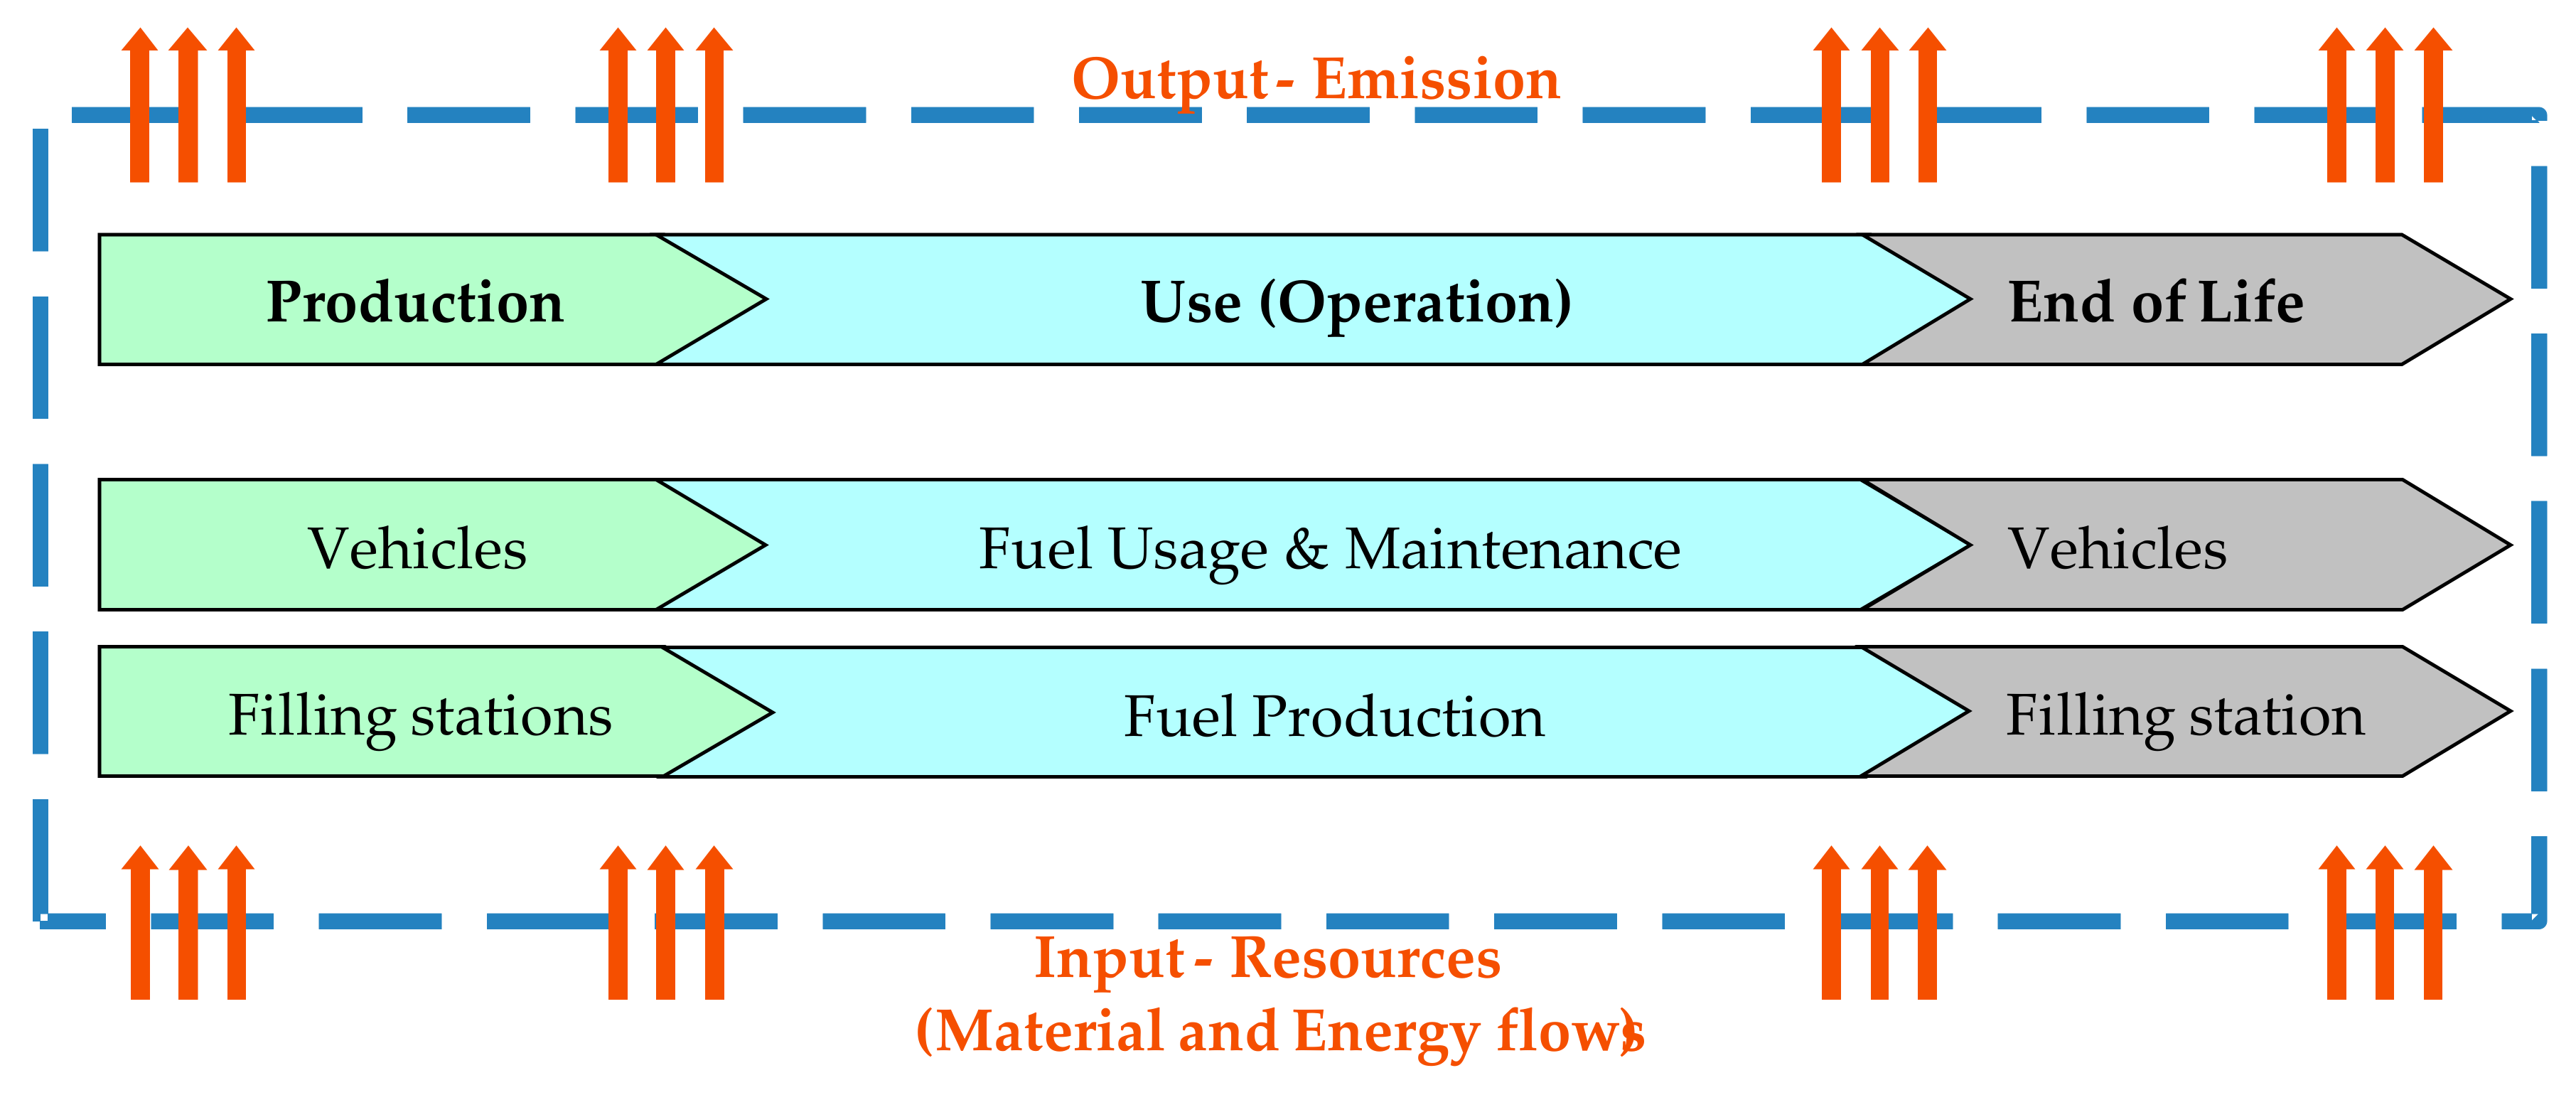
A comprehensive LCA on H2FC buses was performed. The functional unit used was 1 km of bus driving. The system boundary included production of the vehicles and refuelling infrastructure, fuel production and usage as well as maintenance through to the end of life (Figure 1). Data on the production of the vehicles and refuelling infrastructure are based on primary data from the manufacturers. Consumption data in the use phase is based on real life measurements in various cities over several years (Table 2). Assumptions regarding bus and FC lifetime are shown in the boundary conditions in Table 3. End of life was modelled by recycling the metal components and giving a credit for avoided primary production and waste incineration of the remainder. As the buses have the sole purpose of driving there was no multi-functionality. Multi-functionality in the end of life phase was resolved by giving credits and is not detailed due to its minor impact over the life cycle. The software used to undertake the calculations was GaBi [38]. In this article focus has been on the impact of the buses on climate change described through the impact category Global Warming Potential (GWP). Other environmental impact categories can be found in (Lozanovski, Horn, & Ko, 2016; Lozanovski, Ko, Faltenbacher, & Bos, 2014).
2.5. Economic Sustainability Methodology
There are many different economic sustainability evaluations that can be performed, all of which help inform the overall picture. For example, the investment cost of H2 infrastructure and H2FC buses are important for cities considering deploying H2FC buses in addition to the operational expenditure [37,39,40]. For a more comprehensive cost overview of H2FC buses, this article has used the Total Cost of Ownership (TCO) methodology which includes the individual costs mentioned above plus others described below.
The TCO used in this article includes the production of the good, including the margin of the producer. Next to the running and purchase costs, the financing and infrastructure costs are considered. In addition, the ‘conventional’ TCO is extended in this article by calculating the indirect costs caused by emissions impacting on human health and climate change. The indirect costs of local emissions are evaluated using the measurement of the emissions of a diesel bus per km line service in inner London and combining this with evaluations on cost per emission. These extra costs are added to the TCO to provide a more comprehensive measure of the economic sustainability of the H2FC buses when compared with their diesel counterpart.
2.6. Social Sustainability Methodology
Studies of H2FC buses and their relationship with the community have concentrated largely on the acceptance of the technology [23,24,25,26,27], in particular acceptance of the use of hydrogen fuel in public transport and on the willingness of the community to pay for the higher costs of the technology [28,29,30]. The additional research reported in this article examines the views of those responsible for implementing the technology and immediate users in the community and those known to be critical and/or sceptical of the use of H2 as a transport energy vector. This work also reflects more heavily on the factors influencing acceptance rather than just levels of acceptance per se.
In relation to implementers and users, 185 face-to-face, one-hour interviews were conducted in five European regions between 2011–2013 [41]. In order to identify influencing factors in relation to acceptance, most interview regions were visited twice, before and after the start of operation of H2FC buses and hydrogen refuelling station/s.
A study was also conducted to gather the views of potential ‘critics and/or sceptics’ of hydrogen use in transport [42,43]. The criteria for choosing the interviewees were (1) they were known critics or sceptics of the technology and (2) they were in a position to influence the future uptake of the technology. In the initial part of the study, 50 one hour interviews were conducted using a flexible, open-ended question approach [42]. In a follow up study a limited number of participants in the first round were re-interviewed using the same methodology [43].
3. Results
After an initial overview of the boundary conditions used for the evaluation in this article, the operability of the technology and the three sustainability pillars are assessed separately. A discussion follows which includes a teasing out of the dynamic inter-relationship between the pillars.
3.1. Technology and Operability Analysis and Results
H2FC bus range and operating hours per day were found to be comparable with the typical diesel buses. The current generation of H2FC buses can operate long daily shifts of up to 22 h and 260 km per day in revenue service without the need to be refuelled [37]. This is comparable to the service capabilities of diesel buses.
High speed refuelling is necessary as buses are commonly refuelled after returning to the depot, occasioning a peak time during which many buses have to be refuelled. The speed of refuelling determines the number of buses that can be refuelled per dispenser and the resulting infrastructure and staff costs. This has been an issue in previous trials of H2FC bus fleets as slow refuelling limited the numbers of buses per dispenser. Refuelling time has been significantly enhanced with most stations being able to fill a bus in less than 10 min, typically 6 to 8 min for the average hydrogen amount dispensed (17 kg H2). Recent studies show that with refuelling times of less than 10 min, 4 dispenser points are sufficient for refuelling a fleet of 100 H2FC buses within 5 h. This is comparable with the diesel based system and presents no “real world” problems [44].
High bus availability is a crucial aspect of operating a public transport system. A bus requiring downtime means committing resources (time and money) to repair the vehicle, as well as costs for replacement buses. The availability of the H2FC buses was tracked over several years. Availability of 100% is not theoretically possible as scheduled maintenance is included in the availability calculation. After a teething period in the first years of operation (2010–2013), the availability of the H2FC buses averaged 70%. By the end of the trial the H2FC buses achieved closer to 85% [31]. Some of the reasons for unavailability arose from the small number of buses and limited availability of some resources. For example, spare part availability was inconsistent. This issue is expected to improve once a critical mass of buses is in operation. Bus technicians also experienced a significant learning curve resulting in higher availability as they became more familiar with the new technology. A comparable diesel bus has an availability target of 85–95% depending on the site. Improvement in H2FC bus availability is necessary to provide an acceptable level of operability.
Overall there appears to be no ‘show stopper’ relating to the technical performance of the buses.
3.2. Environmental Analysis and Results
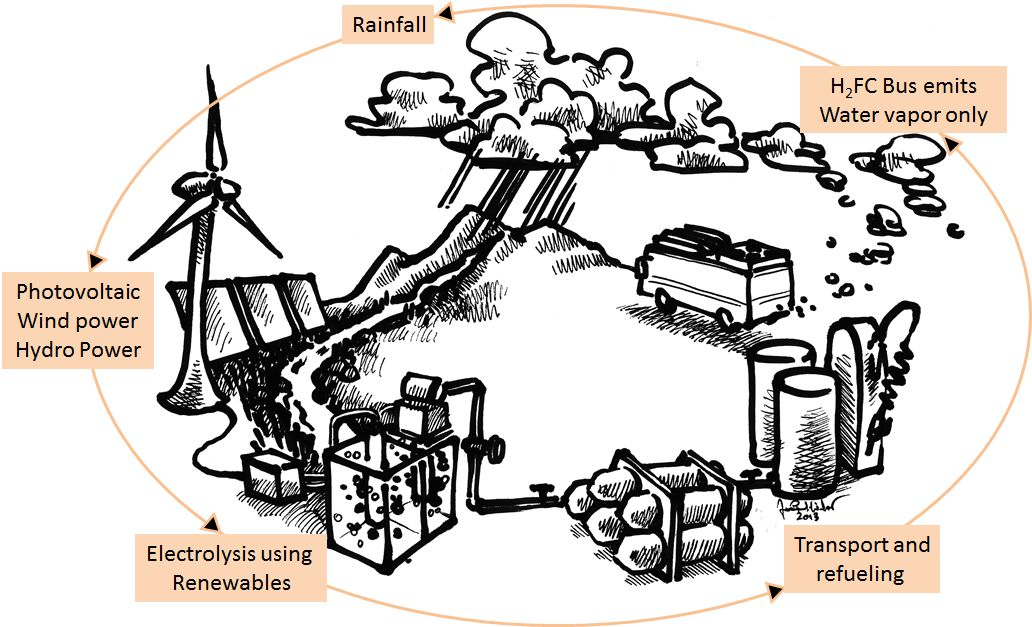
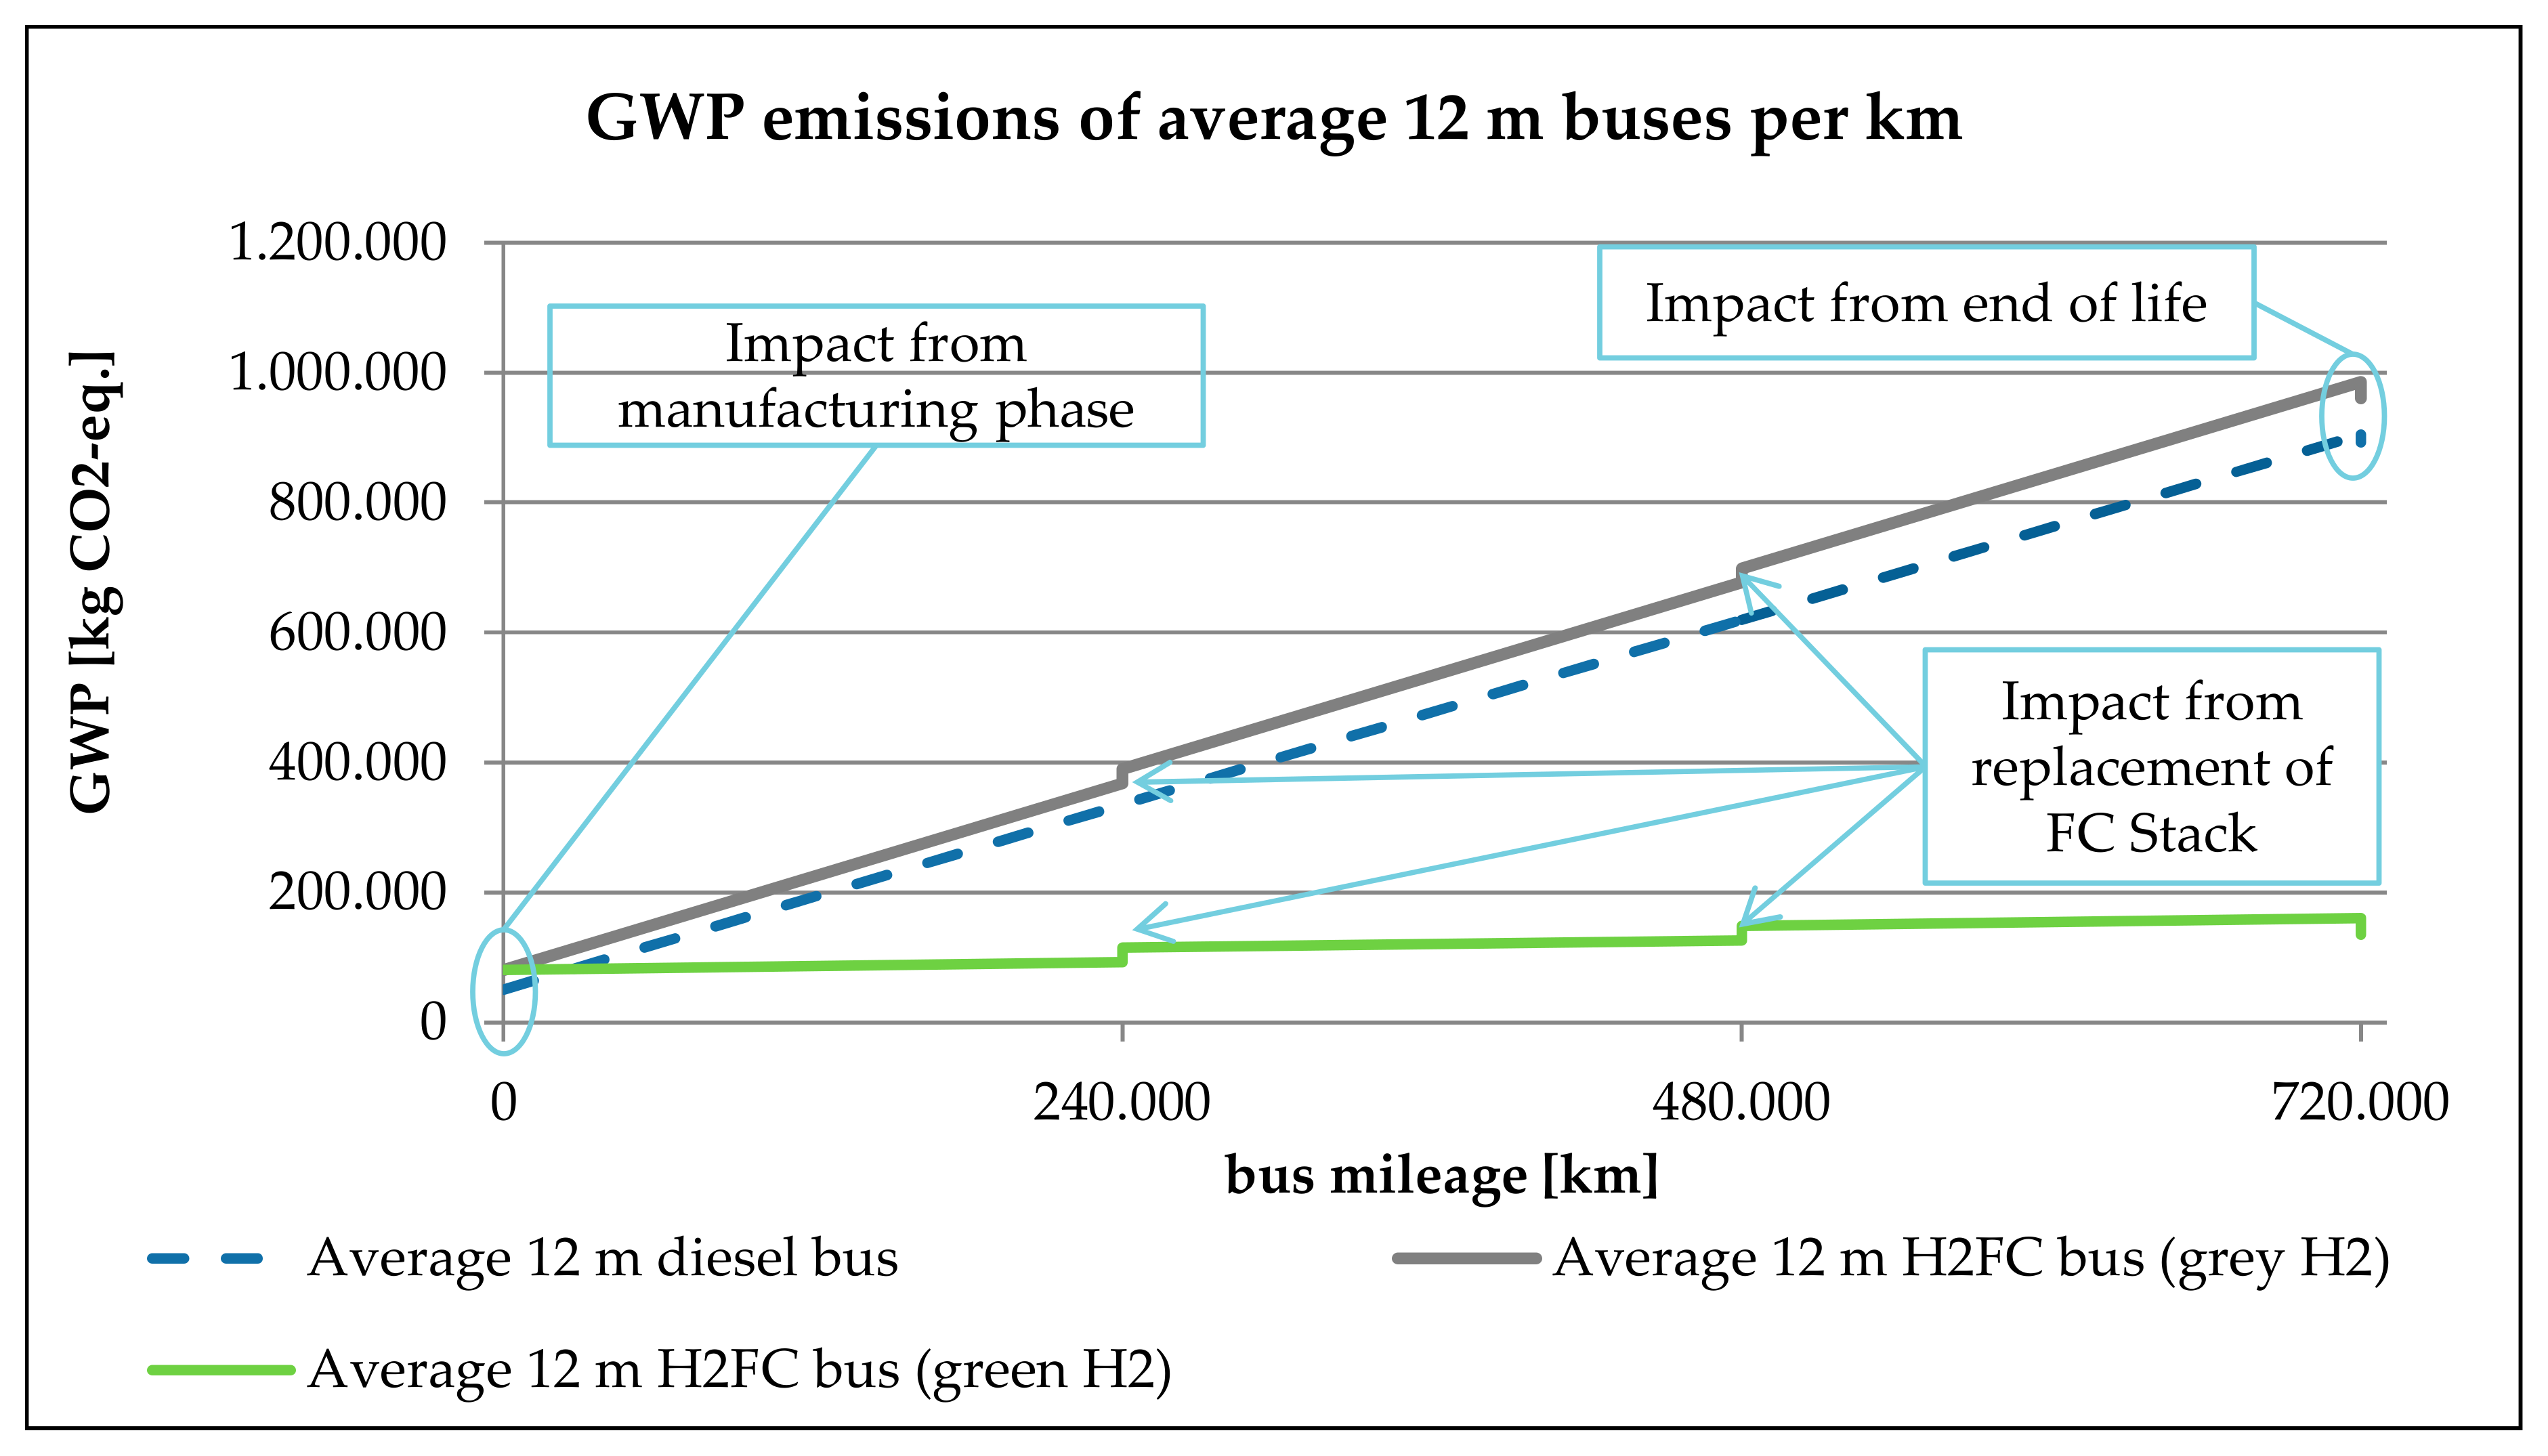
The Environmental Analysis was performed across the full life cycle. This comprised the manufacture of the buses and the refuelling infrastructure, the operation and production of fuel and maintenance up to the end of life. Overwhelmingly, the results were determined by the method of H2 production. Hence two scenarios are considered here to illustrate the possible range of results. One scenario is for ‘grey’ H2 produced by a central steam methane reformer, compressed to 200 bar, stored in gas bottle bundles on a trailer, transported for 200 km to the bus refuelling station and finally compressed at the refuelling station (13.2 kg CO2 eq. per kg H2 at nozzle). The second scenario is H2 produced on-site using an electrolyser, powered by renewable energy available on-site (either wind or hydro) and including final compression (from 0.5 to 0.7 kg CO2 eq. per kg H2 at nozzle). This is a production scenario referred to as ‘green’ hydrogen.
Figure 2 shows the GWP emissions for the two scenarios and the comparison with the diesel bus. It is clear that using green H2 is highly advantageous compared with a diesel bus, providing around 85% savings in Greenhouse emissions. The result for the H2FC bus using H2 from a steam methane reformer is slightly higher than the diesel bus.
The results of this analysis clearly show that from an environmental point of view, a pathway using green H2 has great potential to deliver a sustainable system with fewer environmental impacts compared to fossil fuel use. There are numerous other studies using LCA which support this conclusion [9,10,45,46,47,48,49,50,51,52]
3.3. Economics Analysis and Results
In the first instance this evaluation considered the indirect costs of local transport emissions to human health and the environment. This is followed by a calculation of the total cost of ownership, including the indirect health costs arising from the use of fossil fuel in diesel buses. An economic comparison of H2FC buses with diesel equivalents is then calculated.
3.3.1. Indirect Costs of Transport Emissions
The indirect costs of transport emissions have been the focus of previous studies. Kontou et al. [53] and Liu et al. [54] for example included indirect costs related to climate change in their studies of low carbon vehicles. However, they did not include the indirect costs of other emissions such as Particulate Matter (PM2.5) and Nitrogen Oxides (NOx) emissions and the cost of these on human health.
In this article, the indirect costs for human health and climate change from local transport emission impacts were evaluated using data from London as an example. London was chosen because measurements are available for emissions of diesel buses as well as studies estimating the indirect costs of PM2.5 and NOx emissions for the specific circumstances in London. These measures were combined with information from the German Federal Environmental Agency to provide estimates of values for indirect costs of climate change, NOx, PM2.5 and non-methane volatile organic compound (NMVOC) for the European Union.
The Walton et al. study [55] derived the indirect costs of transport emissions for PM2.5 and NOx as £/t in 2014 prices. The average exchange rate for 2014 [56] was used to calculate the values in Table 4. The study by the German Federal Environment Agency provided values in Euro [57].
Table 4 shows the indirect costs of transport emissions for Inner London and EU27 urban. Walton et al. [55] used two methodologies: “core” and “extended.” The main difference is that “extended” includes effects of long-term exposure to NOx, which are less certain. As the cost in Table 4 varies also, the results derived also vary. It should be noted that the authors of the study state that indirect costs were estimated rather than calculated [55].
The results of the emission measurement in London are given in g/km (Table 5). The NOx, PM and Total Hydrocarbon (THC) measurements are not based on a standard driving test cycle. Rather they are drawn from the Millbrook London Transport Bus (MLTB) cycle which is based on real time data collected from a bus serving route 159 in inner London [58]. The consumption and CO2 emissions were measured on the same route as the H2FC bus (RV1 route in inner London).
Combining the information on indirect costs of harmful emissions and the tailpipe emission results provides the indirect costs of the use phase in €/km. Table 6 neglects the differences between NMVOC and THC (Table 4 and Table 5) as it was not possible to reconcile these due to different data sources but also because the resulting values are very small and the impacts minor compared with the NOx Values for example.
As the input values vary greatly (Table 4) the results also vary from 0.02 €/km up to 0.74 €/km (values rounded to full euro-cents). The average from all three values is 0.32 €/km which is used in the subsequent evaluation. If climate cost is added to the Inner London NOx and PM cost, the resulting range is 0.10 €/km up to 0.82 €/km.
3.3.2. Total Cost of Ownership
Two major studies have been undertaken on the TCO of H2FC Buses [21,22]. All major stakeholders, including the operators of the H2FC Buses, were involved in these studies.
However, both studies calculated the TCO using the conventional definition, which omits indirect costs. Their results are extended in this study to include the indirect costs from emission impact on human health and climate change as calculated above—the extended TCO. The results in Table 7 show that in the immediate future, the H2FC buses will remain more expensive in terms of the extended TCO when compared with diesel buses. The gap reduces in the 2020 and 2030 projections. The extended TCO for H2FC buses approaches parity with the diesel buses by 2030.
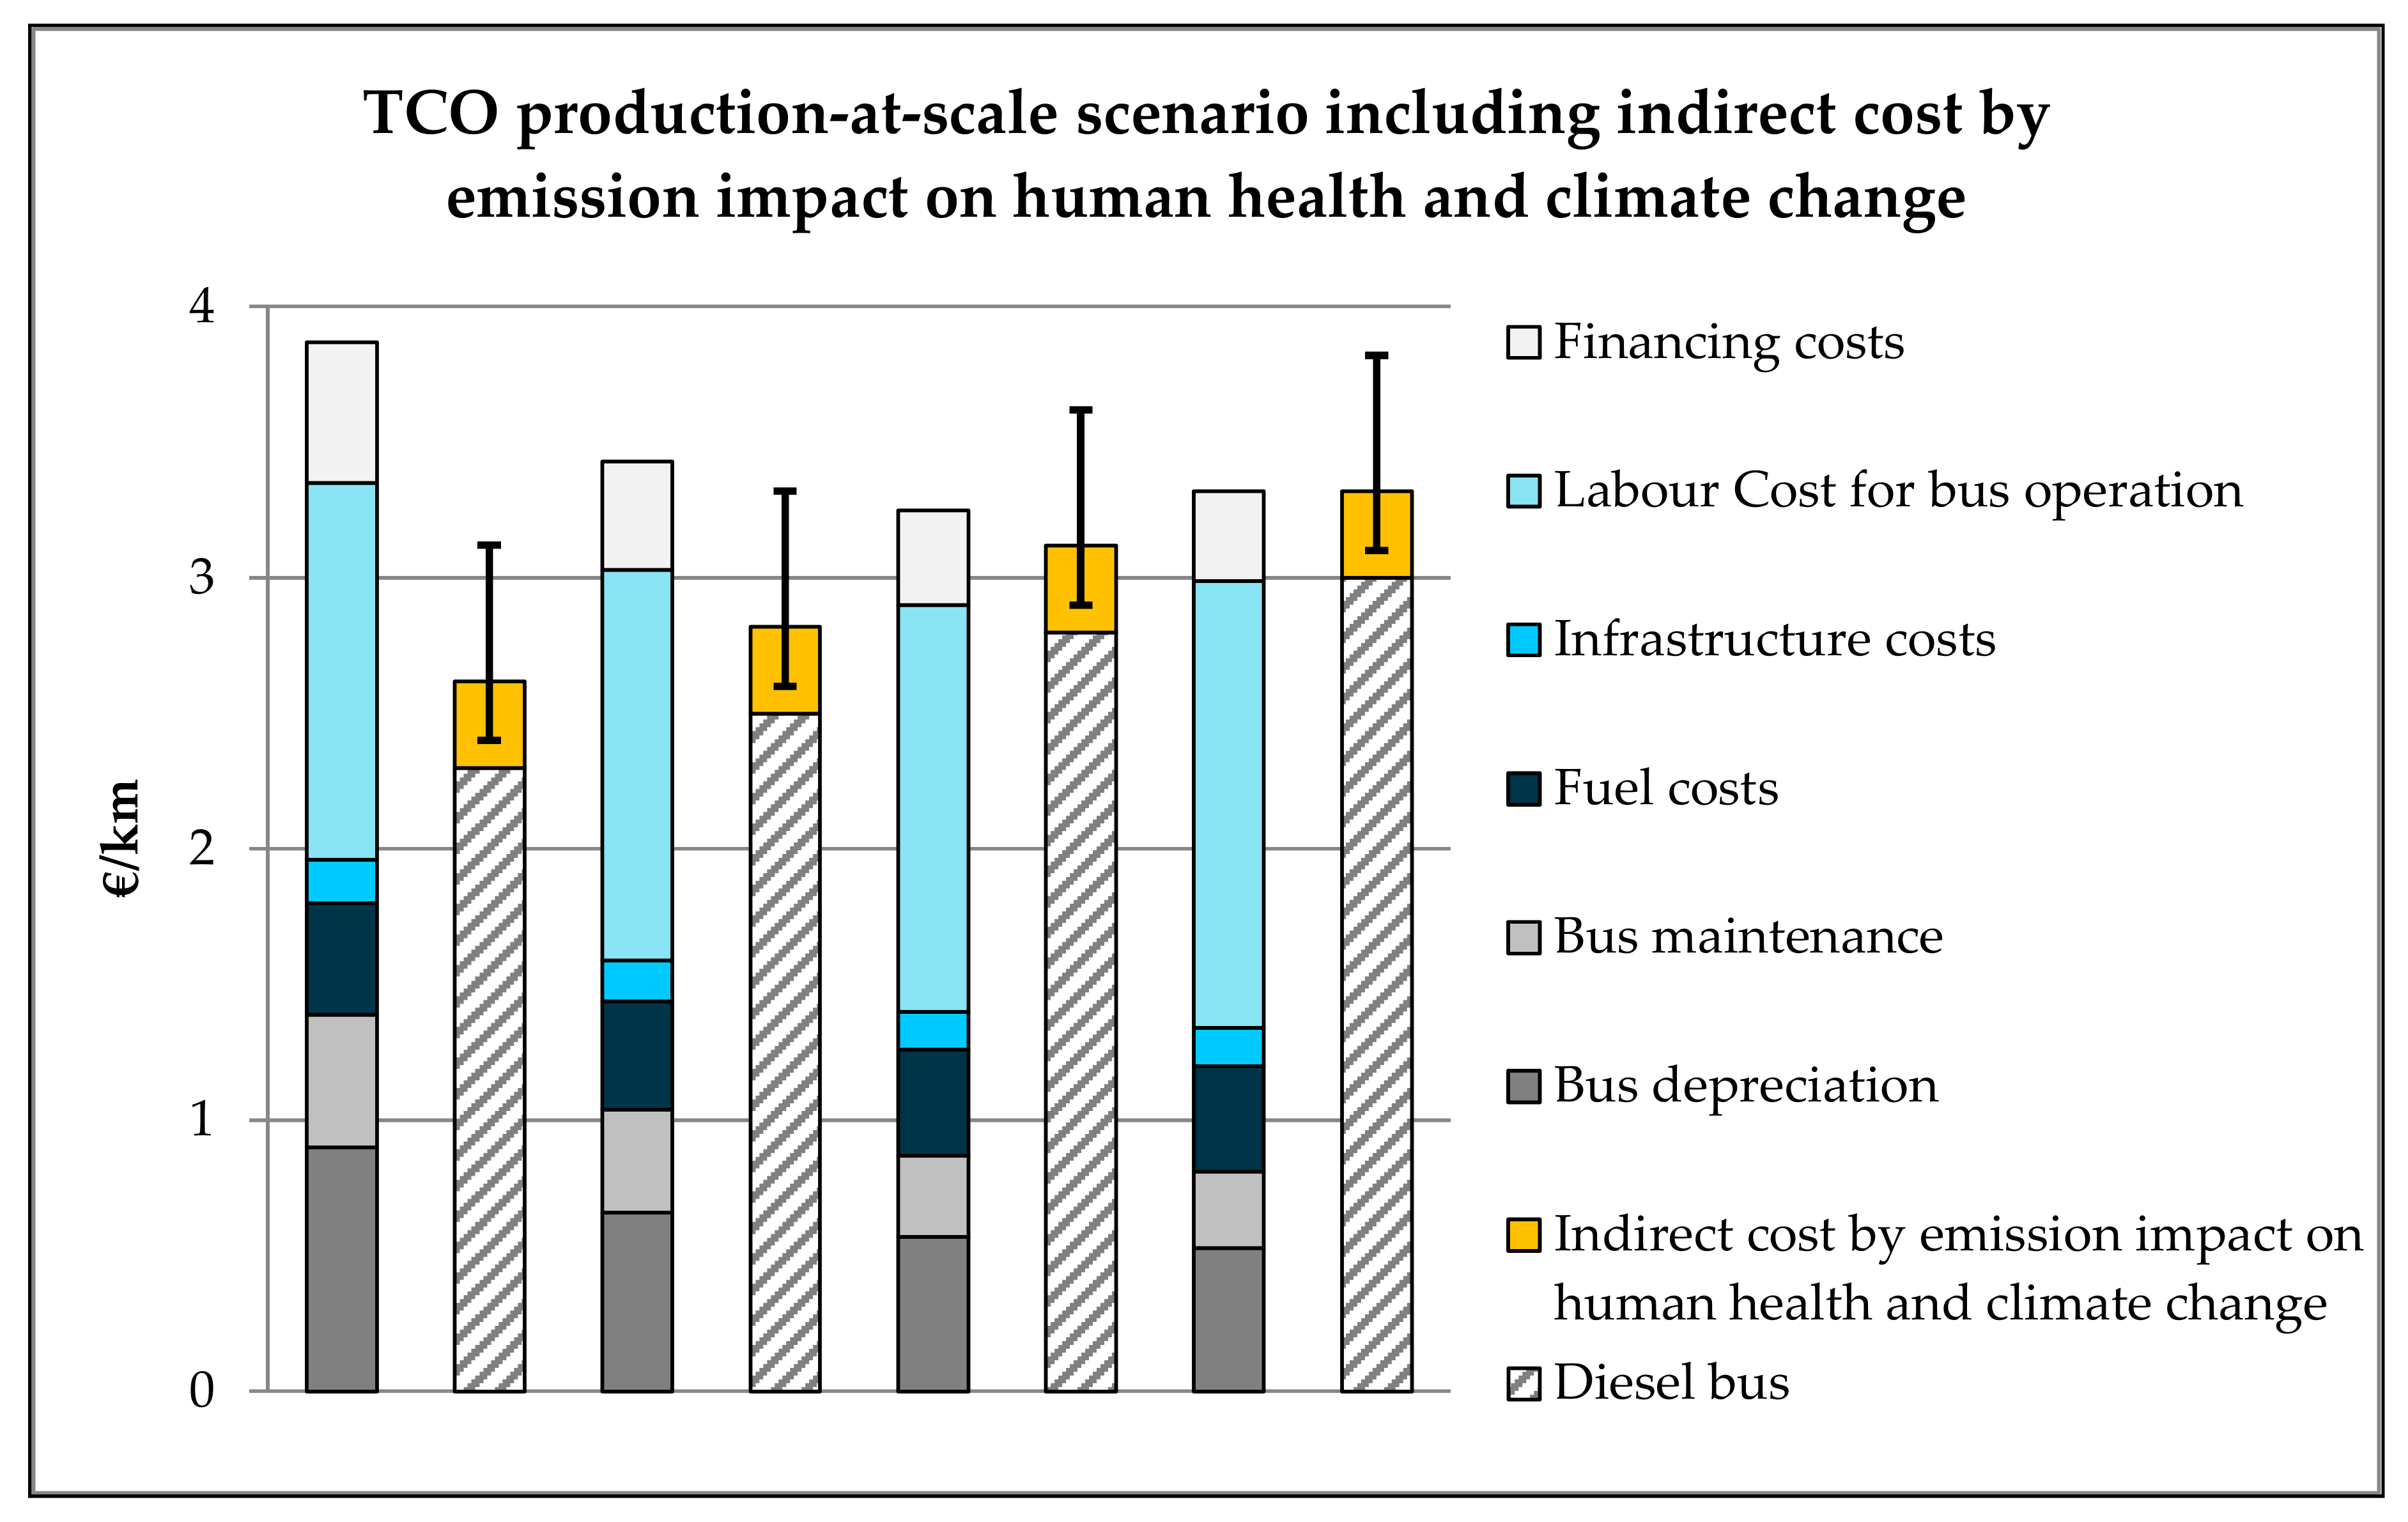
Figure 3 uses the production-at-scale scenario from Roland Berger GmbH [21] and shows the split of the TCO components. The depreciation and financing costs are the largest share of the H2FC bus specific costs. This is mainly due to the purchase price of the H2FC buses, which is mainly determined by the H2FC stack (22% of purchase cost in 2012), balance of plant (14% in 2012) and the H2 tank (14% in 2012). While the higher purchase price for H2FC buses is predicted to continue into the immediate future, it is expected that the maintenance cost will be comparable with diesel buses after 2020 [21].
The indirect costs have been added to the diesel bus cost in Figure 3. There is also a range for the indirect costs (indicated by the bar lines), which on the basis of the currently available calculations, reflect the large range inherent in the indirect costs (0.10 to 0.82 €/km).
Table 7 and Figure 3 show that if the benefits of avoiding local emissions are monetized, the H2FC bus will reach parity with a diesel bus in the extended TCO in the medium term. However, the indirect costs by emission impact on human health and climate change were calculated for a Euro V diesel bus. If future diesel buses have considerably fewer emissions, this calculation would need to be updated concurrently with updating costs per emission. Given these unknowns, it is not possible to predict if these updated costs will be lower or higher than today.
It is important to note the imbalance in the distribution of indirect costs and benefits. While the indirect costs caused by emissions from fossil fuel burning buses and impacting on human health and climate change are paid by society as a whole, the cost for avoiding such emissions currently has to be carried by the bus operators. Options to deal with this imbalance in the distribution of costs and benefits by, for example, introducing penalty taxes, have to be evaluated and considered in the future.
3.4. Social Analysis and Results
Previous studies on social acceptance of H2FC technology in transport have returned largely positive views although they have tended to concentrate on the attitudes of the general public [28] or on stakeholders within the hydrogen industry [25].
While certainly incomplete in terms of examining the broader concept of social impact and therefore social ‘sustainability,’ these acceptance studies can be placed in the theoretical framework of ‘technology assessment’ explored by Grunwald [60] in relation to responsible innovation. This theoretical base posits that the early and broad participation of actors during the early stages of technology use and development will help to ward off “undesirable and possibly disastrous” side effects [60] (p. 18). Grunwald also notes that engaging with citizens early in the process of innovation informs policy on regulation and “improved the practical and political legitimacy of decisions on technology” [60] (p. 20).
3.4.1. Acceptance among Implementers and Users
Interviews with H2FC bus drivers before and after driving the buses found that the driver attitudes were highly sensitive to their experiences with the technology. These ranged from “enthusiastic as long as the technology worked” to “frustrated when it failed” [41].
Partners in the demonstration project and other people working within a H2FC bus operation environment were also interviewed to ascertain their attitudes. As the H2FC bus technology still needs external support to reach full maturity and to be financially competitive, stakeholder support (particularly that of influential decision makers) is of crucial importance. The level of integration of the project into local and regional contexts was significant in attracting positive attitudes to the technology. Among local decision-makers, attitudes ranged from H2FC buses being “already a [serious] alternative to other bus technologies and fuels” to “only an alternative, still having to compete with alternative technologies and fuels” [41].
Interviews were also undertaken with community members who lived in the H2FC bus demonstration regions and were chosen according to certain statistical characteristics (Age, Sex, Education, using public transport). The interviewees believed that the “priority role of public transport services was expected to remain [that of] securing quality ... transport” [41]. While this seemed to be the main driver for acceptance of a new technology, the users interviewed did see the potential environmental benefits of the H2FC buses as a bonus.
In summary, among ‘implementers and users’ H2FC buses were seen as an option which was well regarded if they worked reliably. The technology was still not well understood by the users or necessarily regarded favourably by transport decision makers. Particularly for the latter, management of expectations of technology performance and overall system design is essential in order to secure acceptance. This suggests that there is still significant work to do on engaging with all parties involved with the technology. In a social sustainability sense, this is an important and timely reminder.
3.4.2. Acceptance among Sceptics
The two tranches of interviews with sceptics outside the hydrogen industry uncovered few outright critics of hydrogen use in transport [42,43]. In addition, the general tenor in the re-interview round was more positive than in the first round. The interviewees showed increased awareness of fuel cells and hydrogen and were more positive about the long-term viability of the technology. However, there were three views expressed frequently among this influential group that have significant ramifications for sustainable implementation [43]:
- The major driver for hydrogen use in the transport system is de-carbonization. If hydrogen powered transport cannot completely or very significantly achieve this, then the case for pursuing this technology is not at all strong.
- Government policy has been and will continue to be the most significant influence in future success or otherwise of hydrogen fuel cell vehicles.
- The costs of hydrogen production and acquiring the vehicles must be significantly reduced. This will be particularly important if hydrogen fuel cell vehicles are to be competitive with other non-fossil fuel powered vehicles.
In relation to the last point, this study has opened up the possibility of calculating these costs in a much broader but no less rigorous context by including indirect costs. Achieving these reductions may therefore not be as difficult as some consider.
Placed in the context of the research that has gone before and since, the studies reported here can be seen as a further indicator that social acceptance of the bus technology and its implementation appears not to be a “show stopper.” Nonetheless, it also shows there is still more to do in terms of adequately engaging in an appropriate way with the various sectors of the community if the technology is to be fully embraced.
4. Discussion of Findings and Conclusions
Based on the results for operability and performance, the operational pathway to broad-scale deployment of H2FC buses is apparent and being actively pursued as the Joint Initiative for Hydrogen Vehicles across Europe (JIVE & JIVE 2) projects seek to deploy 296 H2FC buses across Europe in order to build experience with higher number bus fleets.).
From an environmental point of view, it is clear that a scenario using hydrogen produced via electrolysis using renewable power is highly advantageous compared with a diesel bus system, resulting in around 85% savings in GWP emissions calculated on a cradle to grave basis.
The economic sustainability of H2FC buses must address the question of affordability. The crucial point for the TCO is the purchase price of the bus, which, will remain higher according to current projections up to 2030 [21]. Beyond that, if the indirect costs from the impact of emissions on human health and climate change are taken into account, the H2FC buses approach parity with diesel buses.
The advantages of the locally emission free use phase could be enhanced in future by evaluation with regionalisation methods which are under development in the LCA community.
With respect to the interaction of the technology with the community, broad scale acceptance and/or positive attitudes towards a new technology are clearly important elements in the technology being sustainable in a social sense. This article and the underlying studies broaden our understanding of the ‘context’ of this acceptance and provide further support for broad community acceptance.
Significantly it appears that, to those in these studies at least, the contribution of H2FC buses to a cleaner environment is more a bonus than a primary reason for their acceptance. Economics and service quality remain overriding issues among those who have direct and decision-making experience with the technology. As an alternative among a menu of alternative fuels, it is clear however that only ‘green’ hydrogen is acceptable to broader policy makers.
In general, terms this article, supported by previous studies, point to H2FC buses being on track to provide a comparable operational service to their diesel counterparts with highly significant environmental and human health benefits and to continue to be able to do so into the future. From the community’s point of view, these factors ensure the buses a high level of acceptability for the long term.
However, there are some interactions that work in different directions when considering the various aspects of the sustainability of H2FC buses. Using ‘green’ hydrogen is positive for the environment and general acceptance. However, this increases fuel costs which impacts sustainability from an economics and an acceptability point of view, at least in the short to medium term. This interaction makes the transition towards low cost renewable power crucial for H2FC buses although another possibility would be to lower consumption which might be made to occur by using lightweight constructions.
There are certainly challenges to the sustainability of the buses. When economic sustainability is considered in terms of conventional TCO, it is clear that the long-term benefits of H2FC buses will come at significant investment cost. This article has presented a first attempt to factor into the economic argument the benefit from reduced emissions on human health and climate change. These calculations suggest that the ‘true’ TCO should bring the buses to parity with their diesel counterparts around 2030, although the “public good” acquired through the cleaner technology will mean significant on-going subsidization of the “private cost” of the buses. Both from a human health and from a climate change perspective this does not seem unreasonable.
In conclusion, the H2FC buses have shown to be more environmentally sustainable than the equivalent diesel bus when green hydrogen is used. This is based on an evaluation across the full life cycle of the buses. More importantly, however, from the perspective of the article’s working definition of sustainability, no factors were identified, at this stage, that would categorically prevent future generations from using H2FC buses in public transport, on a broad scale, due to damage to the environment or to other factors that impinge on quality of life.
This article has also highlighted four key factors which need to be considered in future assessments of sustainability. They also have important ramifications for policy development.
- LCA can be a powerful tool for evaluating environmental sustainability of clean mobility options.
- Total Cost of Ownership calculations need to be expanded from the conventional inclusions to take into account the benefits to human health and to the environment from reduced emissions.
- Assessments of the costs and benefits of moving to clean mobility options need to take account of the current imbalance between the ‘private’ costs of the technology and the ‘public’ benefits to health and the environment.
- Social sustainability research needs to broaden beyond the issues of social acceptance. For instance, what will be effect of this new technology on skills requirements and employment? There are already anecdotal concerns abroad about the ramifications for the workforce of the manufacture of the simpler electric engines.
Finally, while this article presents a first attempt towards inclusion of indirect costs from local emissions in the calculation of TCO, not only for climate change but also for human health, more work needs to be done to more accurately calculate these costs and the contribution of zero local emission buses to lowering them. This is not only because of the need for a ‘true cost’ perspective but also because clearly these factors have significant ramifications for social sustainability.
Author Contributions
A.L. led the Sustainability and Performance Assessment, performed the indirect costs calculations as well as the operational performance and Life Cycle Assessment. He also wrote the majority of this article. N.W. was involved in the social assessment and largely wrote the social assessment sections of this article. N.K. was involved in the Life Cycle Assessment and Data collection. S.W. contributed significantly to the Social Assessment work on which the article is based.
Acknowledgments
The research leading to these results received funding from the European Union’s Seventh Framework Program (FP7/2007-2013) for the Fuel Cells and Hydrogen Joint Technology Initiative, under grant agreement number 256848. Furthermore, the authors would like to thank all partners involved in the CHIC project.
Conflicts of Interest
The authors declare no conflicts of interest.
References
- European Commission. Communication from the Commission to the European Parliament and the Council: European Energy Security Strategy: COM(2014) 330 Final; European Commission: Brussels, Belgium, 2014. [Google Scholar]
- Luè, A.; Bresciani, C.; Colorni, A.; Lia, F.; Maras, V.; Radmilović, Z.; Whitmarsh, L.; Xenias, D.; Anoyrkati, E. Future priorities for a climate-friendly transport: A European strategic research agenda toward 2030. Int. J. Sustain. Transp. 2016, 10, 236–246. [Google Scholar] [CrossRef]
- Intergovernmental Panel on Climate Change. Climate Change 2014: Synthesis Report: A Report of the Intergovernmental Panel on Climate Change; Cambridge University Press: Geneva, Switzerland, 2015. [Google Scholar]
- European Commission. Communication from the Commission to the European Parliament, the Council, The European Economic and Social Committee and the Committee of the Regions: A European Strategy for Low-Emission Mobility: COM(2016) 501 Final; European Commission: Brussels, Belgium, 2016. [Google Scholar]
- Binder, M.; Faltenbacher, M.; Kentzler, M.; Schuckert, M. CUTE: Clean Urban Transport for Europe—Final Report: EU Funded Project 2001–2006; EU Commission: Brussels, Belgium, 2006. [Google Scholar]
- HyFLEET:CUTE. Hydrogen Transport: Bus Technology & Fuel for Today and for a Sustainable Future: EU Funded Project 2006–2009. Available online: https://cordis.europa.eu/project/rcn/85636_en.html (accessed on 7 May 2018).
- Müller, K.; Schnitzeler, F.; Lozanovski, A.; Skiker, S.; Ojakovoh, M. CHIC Final Report; Fuel Cell and Hydrogen Joint Undertaking: Brussels, Belgium, 2017. [Google Scholar]
- HyCologne, E.V. Joint Initiative for Hydrogen Vehicles across Europe: Wasserstoff Region Rheinland [Hydrogen Region Rhineland]. Available online: http://www.hycologne.de/de_DE/projekt-jive/ (accessed on 21 July 2017).
- Faltenbacher, M. Modell zur Ökologisch-Technischen Lebenszyklusanalyse von Nahverkehrsbussystemen. Ph.D. Dissertation, Universität Stuttgart, Stuttgart, Germany, 2006. [Google Scholar]
- Faltenbacher, M.; Wiedemann, M. Making Public Transportation More Sustainable—A Sophisticated LCA & LCC Model for Assessing Bus Based Public Transport; The Swedish Life Cycle Center: Gothenburg, Sweden, 2013. [Google Scholar]
- Hua, T.; Ahluwalia, R.; Eudy, L.; Singer, G.; Jermer, B.; Asselin-Miller, N.; Wessel, S.; Patterson, T.; Marcinkoski, J. Status of hydrogen fuel cell electric buses worldwide. J. Power Sources 2014, 269, 975–993. [Google Scholar] [CrossRef]
- HighVLOCity. Cities Speeding Up the Integration of Hydrogen Buses: FCH JU Funded Project 2012–2018. Available online: http://highvlocity.eu/ (accessed on 24 April 2018).
- HyTransit. European Hydrogen Transit Buses in Scotland: FCH JU Funded Project 2013–2018. Available online: http://cordis.europa.eu/project/rcn/106694_en.html (accessed on 24 April 2018).
- International Fuelcellbus Collaborative. All Active Demonstrations. Available online: http://gofuelcellbus.com/index.php/the-collaborative/all-active-demonstrations (accessed on 24 April 2018).
- Eudy, L.; Post, M. BC Transit Fuel Cell Bus Project: Evaluation Results Report; National Renewable Energy Laboratory (NREL): Golden, CO, USA, 2014.
- Nanaki, E.A.; Koroneos, C.J. Exergetic Aspects of Hydrogen Energy Systems—The Case Study of a Fuel Cell Bus. Sustainability 2017, 9, 276. [Google Scholar] [CrossRef]
- Delogu, M.; Del Pero, F.; Pierini, M. Lightweight Design Solutions in the Automotive Field: Environmental Modelling Based on Fuel Reduction Value Applied to Diesel Turbocharged Vehicles. Sustainability 2016, 8, 1167. [Google Scholar] [CrossRef]
- Koffler, C.; Rohde-Brandenburger, K. On the calculation of fuel savings through lightweight design in automotive life cycle assessments. Int. J. Life Cycle Assess. 2009, 15, 128. [Google Scholar] [CrossRef]
- Delogu, M.; Maltese, S.; Del Pero, F.; Zanchi, L.; Pierini, M.; Bonoli, A. Challenges for modelling and integrating environmental performances in concept design: The case of an automotive component lightweighting. Int. J. Sustain. Eng. 2018, 1–14. [Google Scholar] [CrossRef]
- Regulation (EU) No 333/2014 of the European Parliementand of the Council of 11 March 2014 Amending Regulation (EC) No 443/2009 to Define the Modalities for Reaching the 2020 Target to Reduce CO2 Emissions from New Passenger Cars. Available online: http://eur-lex.europa.eu/legal-content/EN/TXT/?uri=uriserv:OJ.L_.2014.103.01.0015.01.ENG (accessed on 7 May 2018.).
- Roland Berger GmbH. Fuel Cell Electric Buses—Potential for Sustainable Public Transport in Europe; Roland Berger GmbH: Munich, Germany, 2015. [Google Scholar]
- Fuel Cells and Hydrogen Joint Undertaking. Urban Buses, Alternative Powertrains for Europe; FCH JU: Brussels, Belgium, 2012. [Google Scholar]
- O’Garra, T.; Mourato, S.; Pearson, P. Analysing awareness and acceptability of hydrogen vehicles: A London case study. Int. J. Hydrog. Energy 2005, 30, 649–659. [Google Scholar] [CrossRef]
- Kang, M.J.; Park, H. Factors Affecting Customer Acceptance of Hydrogen Fuel Cell Vehicles in Korea; IACSIT Press: Singapore, 2012. [Google Scholar]
- Dütschke, E.; Upham, P.; Schneider, U. Report on Results of the Stakeholder Survey; Fuel Cell and Hydrogen Joint Undertaking: Brussels, Belgium, 2016. [Google Scholar]
- Hyacinth Project. Hydrogen Acceptance in the Transition Phase (HYACINTH). Available online: http://hyacinthproject.eu/ (accessed on 25 April 2018).
- RWTH Aachen University Roads2HyCom: Acceptance Analysis for Hydrogen Technologies. Available online: https://www.ika.rwth-aachen.de/r2h/index.php/Acceptance_Analysis_for_Hydrogen_Technologies.html (accessed on 25 April 2018).
- Altmann, M.; Schmidt, P. Accept H2: Public Perception of Hydrogen Buses in Five Countries; International German Hydrogen Energy Congress: Essen, Germany, 2004. [Google Scholar]
- Bigerna, S.; Polinori, P. Willingness to Pay and Public Acceptance for Hydrogen Buses: A Case Study of Perugia. Sustainability 2015, 7, 13270–13289. [Google Scholar] [CrossRef]
- O’Garra, T.; Mourato, S.; Garrity, L.; Schmidt, P.; Beerenwinkel, A.; Altmann, M.; Hart, D.; Graesel, C.; Whitehouse, S. Is the public willing to pay for hydrogen buses? A comparative study of preferences in four cities. Energy Policy 2007, 35, 3630–3642. [Google Scholar] [CrossRef]
- Müller, K.; Skiker, S.; Stolzenburg, K. CHIC—Clean Hydrogen in European Cities: Fuel Cell Electro Buses: A Proven Zero-Emission Solution: Key Facts, Results, Recommendations; FCH JU: Brussels, Belgium, 2016. [Google Scholar]
- UN World Commission. Report of the World Commission on Environment and Development: Our Common Future; United Nations: New York, NY, USA, 1987. [Google Scholar]
- Jabareen, Y. A New Conceptual Framework for Sustainable Development. Environ. Dev. Sustain. 2008, 10, 179–192. [Google Scholar] [CrossRef]
- Hillery, P. United Nations General Assembly: World Summit Outcome; United Nations: New York, NY, USA, 2005. [Google Scholar]
- Kates, R.W.; Parris, T.M.; Leiserowitz, A.A. What Is Sustainable Development? Goals, Indicators, Values, and Practice. Environ. Sci. Policy Sustain. Dev. 2005, 47, 8–21. [Google Scholar]
- Lozanovski, A.; Ko, N.; Faltenbacher, M.; Bos, U. Environmental Assessment over the Life Cycle of the Transport Systems; Fuel Cell and Hydrogen Joint Undertaking: Brussels, Belgium, 2014. [Google Scholar]
- Lozanovski, A.; Horn, R.; Ko, N. Sustainability Assessment of FC Buses and Related Infrastructure; Fuel Cell and Hydrogen Joint Undertaking: Brussels, Belgium, 2016. [Google Scholar]
- Thinkstep AG. GaBi 7 Software- and Database System; Thinkstep AG: Leinfelden-Echterdingen, Germany, 1992–2016. [Google Scholar]
- Lozanovski, A.; Ko, N. Analysis of Investments in Workshops for Fuel Cell Buses and Hydrogen Refuelling Stations; Fuel Cell and Hydrogen Joint Undertaking: Brussels, Belgium, 2015. [Google Scholar]
- Stolzenburg, K. Interim Report on Hydrogen Infrastructure Operation and Performance; Fuel Cell and Hydrogen Joint Undertaking: Brussels, Belgium, 2015. [Google Scholar]
- Hoelzinger, N.; Luedi-Geoffroy, N. Influencing Factors to the Acceptance Process of FCH Technologies in Public Transport; Fuel Cell and Hydrogen Joint Undertaking: Brussels, Belgium, 2013. [Google Scholar]
- Whitehouse, S.; Whitehouse, N. Issues of Concern to External Stakeholders and Critics and Pathways to Their Resolution; Fuel Cell and Hydrogen Joint Undertaking: Brussels, Belgium, 2013. [Google Scholar]
- Whitehouse, S.; Whitehouse, N. Issues of Concern to External Stakeholders and Critics and Pathways to Their Resolution: Reflections on Change after 2 Years; Fuel Cell and Hydrogen Joint Undertaking: Brussels, Belgium, 2015. [Google Scholar]
- Reuter, B.; Faltenbacher, M.; Schuller, O.; et al. New Bus Refuelling for European Hydrogen Bus Depots: High-Level Techno-Economic Project Summary Report; Fuel Cell and Hydrogen Joint Undertaking: Brussels, Belgium, 2017. [Google Scholar]
- Sørensen, B. Total Life-Cycle Assessment of PEM Fuel Cell Car; World Hydrogen Energy Association: Rosklilde, Denmark, 2004. [Google Scholar]
- Granovskii, M.; Dincer, I.; Rosen, M.A. Life cycle assessment of hydrogen fuel cell and gasoline vehicles. Int. J. Hydrog. Energy 2006, 31, 337–352. [Google Scholar] [CrossRef]
- Hwang, J.-J.; Kuo, J.-K.; Wu, W.; Chang, W.R.; Lin, C.H.; Wang, S.E. Lifecycle performance assessment of fuel cell/battery electric vehicles. Int. J. Hydrog. Energy 2013, 38, 3433–3446. [Google Scholar] [CrossRef]
- Bauer, C.; Hofer, J.; Althaus, H.-J.; Del Duce, A.; Simons, A. The environmental performance of current and future passenger vehicles: Life cycle assessment based on a novel scenario analysis framework. Appl. Energy 2015, 157, 871–883. [Google Scholar] [CrossRef]
- Lozanovski, A.; Baumann, M.; Vega, L.F.; Blejman, G.; Ruiz, P. Final Environmental Assessment Report; Fuel Cell and Hydrogen Joint Undertaking: Brussels, Belgium, 2015. [Google Scholar]
- Notter, D.A.; Kouravelou, K.; Karachalios, T.; Daletou, M.K.; Haberland, N.T. Life cycle assessment of PEM FC applications: Electric mobility and μ-CHP. Energy Environ. Sci. 2015, 8, 1969–1985. [Google Scholar] [CrossRef]
- Simons, A.; Bauer, C. A life-cycle perspective on automotive fuel cells. Appl. Energy 2015. [Google Scholar] [CrossRef]
- Miotti, M.; Hofer, J.; Bauer, C. Integrated environmental and economic assessment of current and future fuel cell vehicles. Int. J. Life Cycle Assess. 2017, 22, 94–110. [Google Scholar] [CrossRef]
- Kontou, E.; Yin, Y.; Lin, Z.; He, F. Socially optimal replacement of conventional with electric vehicles for the US household fleet. Int. J. Sustain. Transp. 2017, 11, 749–763. [Google Scholar] [CrossRef]
- Liu, J.; Santos, G. Decarbonizing the Road Transport Sector: Break-even Point and Consequent Potential Consumers’ Behaviour for the U.S. Case. Int. J. Sustain. Transp. 2015, 9, 159–175. [Google Scholar] [CrossRef]
- Walton, H.; Dajnak, D.; Beevers, S.; Williams, M.; Watkiss, P.; Hunt, A. Understanding the Health Impacts of Air Pollution in London; Kings College London; Transport for London and the Greater London Authority: London, UK, 2015.
- European Central Bank. Euro Foreign Exchange Rates. Available online: http://www.ecb.europa.eu (accessed on 30 August 2016).
- Umweltbundesamt. Methodenkonvention 2.0 zur Schätzung von Umweltkosten. [Methodological Convention 2.0 to assess the Environmental Costs]; Ökonomische Bewertung: Dessau-Roßlau, Germany, 2012. [Google Scholar]
- Millbrook Proving Ground Ltd. Millbrook Secures Contract to Provide TfL with Crucial Bus Emissions Analysis. Available online: http://www.millbrook.co.uk/press-office/news/millbrook-secures-contract-to-provide-tfl-with-crucial-bus-emissions-analysis/ (accessed on 21 July 2017).
- Edwards, J. Millbrook Test Report No. 10/0891: Emission and Fuel Consumption Evaluation of a Fuel Cell Bus; Millbrook Proving Ground Ltd.: Millbrook, UK, 2010. [Google Scholar]
- Grunwald, A.; van den Hoven, J. Technology Assessment for Responsible Innovation: Innovative Solutions for Global Issues; Springer: Doldrecht, The Netherlands, 2014. [Google Scholar]
Figure 1.
System boundary.

Figure 2.
Global warming potential GWP of average 12 m H2FC bus and diesel bus.

Figure 3.
Total cost of ownership (TCO) split by components including indirect costs by emission impact on health adapted from Reference [21].
Figure 3.
Total cost of ownership (TCO) split by components including indirect costs by emission impact on health adapted from Reference [21].


Table 1.
Overview of the characteristics of the fuel cell (FC) buses.
| Bus Manufacturer | APTS | EvoBus Mercedes-Benz | New Flyer | Van Hool | Wrightbus |
|---|---|---|---|---|---|
| Number of buses | Cologne: 2 | Aargau: 5 Bolzano: 5 Hamburg: 4 Milan: 3 | Whistler: 20 | Cologne: 2 Oslo: 5 | London: 8 |
| Overall length [m] | 18.5 | 12 | 12.5 | 13.2 | 11.9 |
| Net weight [t] | 20.6 | 13.2 | 15.4 | 15.7/16.1 | 10.3–11.3 |
| Passenger capacity [no.] | 96 | 76 | 60 | 101/76 | 49 |
| Number of axles | 3 | 2 | 2 | 3 | 2 |
| Drive power [kW] | 240 | 2 × 120 max | 2 × 85 max | 2 × 85 max | 2 × 67 max |
| Fuel cell manufacturer | Ballard | AFCC | Ballard | Ballard | Ballard |
| Fuel cell system power [kW] | 150 | 120 | 150 | 150 | 75 |
| Electricity Storage Type | NiMH battery + Supercaps | Li-Ion battery | Li-Ion battery | Li-Ion battery | Supercaps |
| Electricity storage Power [kW] | Max. 200 | 250 | N/A | 120/100 | 105 |
| Electricity storage capacity [kWh] | Supercaps 2 Battery 26 | 26.9 | 47 | 24/17.4 | 20 |
| Hydrogen cylinders (@350 bar) [no.] | 8 | 7 | 8 | 8/7 | 4 |
| Hydrogen storage capacity [kg] | 40 | 35 | 56 | 40/35 | 31 |
Table 2.
Average fuel consumption of the FC buses differentiated by length of the buses.
| Average Fuel Consumption | |||||
|---|---|---|---|---|---|
| Site | Bus Length | Number of Vehicles | At Each Site | All 54 FC Buses | Only 12 m Solo Buses (25 out of 54) |
| [m] | [No.] | [kg H2/100 km] | |||
| Cologne | 18.5 | 2 | 16.5 | 12.0 | |
| Whistler | 12.7 | 20 | 14.9 | ||
| Cologne | 13.2 | 2 | 14.4 | ||
| Oslo | 13.2 | 5 | 13.2 | ||
| Hamburg | 12.0 | 4 | 8.7 | 9.0 | |
| Aargau | 12.0 | 5 | 8.0 | ||
| Bolzano | 12.0 | 5 | 8.6 | ||
| London | 11.9 | 8 | 9.6 | ||
| Milan | 12.0 | 3 | 9.9 | ||
Table 3.
Characteristics of the average buses used as the basis for evaluation.
| Average 12 m H2FC Bus | Average 12 m Diesel Bus | |
|---|---|---|
| Consumption [kg H2/100 km] | 9.0 | - |
| Consumption [l Diesel equivalent/100 km] | 30.1 | 40.9 |
| Assumed Bus lifetime [km] | 720,000 | 720,000 |
| Assumed FC stack lifetime [km] | 240,000 | - |
Table 4.
Indirect costs of transport emissions.
| Emission | Inner London (Core) [55] | Inner London (Extended) [55] | EU 27 Urban [57] |
|---|---|---|---|
| Climate cost [€/t] | - | 80 | |
| NOx [€/t] | 1130 | 64,930 | 10,300 |
| PM2.5 [€/t] | 195,750 | 189,650 | 392,600 |
| NMVOC [€/t] | - | - | 1500 |
Table 5.
Tailpipe emissions of a 12 m solo bus (Diesel Euro V) under London specific circumstances.
| Emission | Solo Bus (Diesel Euro V SCR) | Source | H2FC Bus |
|---|---|---|---|
| CO2 [g/km] | 986 | [37] | 0 (no local emission) |
| NOx [g/km] | 11.29 | [59] | 0 (no local emission) |
| PM [g/km] | 0.019 | [59] | 0 (no local emission) |
| THC [g/km] | 0.004 | [59] | 0 (no local emission) |
Table 6.
Indirect costs of use phase emission of a Euro V diesel bus and a H2FC bus in inner London.
Table 6.
Indirect costs of use phase emission of a Euro V diesel bus and a H2FC bus in inner London.
| Emission | Diesel Bus Inner London (Core) | Diesel Bus Inner London (Extended) | Diesel Bus EU27 Urban | H2FC Bus |
|---|---|---|---|---|
| Climate Cost [€/km] | - | - | 0.0789 | 0 (no local emission) |
| NOx [€/km] | 0.0127 | 0.7331 | 0.1163 | 0 (no local emission) |
| PM [€/km] | 0.0037 | 0.0036 | 0.0075 | 0 (no local emission) |
| NMVOC [€/km] | - | - | 0.0000 | 0 (no local emission) |
| Sum | 0.0164 | 0.7367 | 0.2027 | 0 (no local emission) |
Table 7.
Total cost of ownership of H2FC and diesel buses including indirect costs by emission impact on human health in €/km ([21,22]).
| 2012 | 2015 | 2020 | 2025 | 2030 | Source | |
|---|---|---|---|---|---|---|
| Diesel bus | - | 2.3 | 2.5 | 2.8 | 3 | [21] |
| Diesel bus | 2.1 | - | 2.3 | - | 2.6 | [22] |
| Diesel bus including indirect costs by emission impact on human health and climate change (+0.3 €/km) | 2.4 | 2.6 | 2.6–2.8 | 3.1 | 2.9–3.3 | Own calculation |
| H2FC bus | 4.6 | - | 2.9–3.3 | - | 3.0–3.2 | [22] |
| H2FC bus niche scenario (the niche scenario assumed 1200–1800 H2FC buses total cumulative until 2025 [21]) | - | 4.3 | 3.9 | 3.7 | 3.7 | [21] |
| H2FC bus production at scale scenario (the production at scale scenario assumes 8000–10000 H2FC buses total cumulative until 2025 [21]) | - | 3.9 | 3.4 | 3.2 | 3.3 | [21] |
© 2018 by the authors. Licensee MDPI, Basel, Switzerland. This article is an open access article distributed under the terms and conditions of the Creative Commons Attribution (CC BY) license (http://creativecommons.org/licenses/by/4.0/).
Share and Cite
MDPI and ACS Style
Lozanovski, A.; Whitehouse, N.; Ko, N.; Whitehouse, S. Sustainability Assessment of Fuel Cell Buses in Public Transport. Sustainability 2018, 10, 1480. https://doi.org/10.3390/su10051480
AMA Style
Lozanovski A, Whitehouse N, Ko N, Whitehouse S. Sustainability Assessment of Fuel Cell Buses in Public Transport. Sustainability. 2018; 10(5):1480. https://doi.org/10.3390/su10051480
Chicago/Turabian StyleLozanovski, Aleksandar, Nicole Whitehouse, Nathanael Ko, and Simon Whitehouse. 2018. "Sustainability Assessment of Fuel Cell Buses in Public Transport" Sustainability 10, no. 5: 1480. https://doi.org/10.3390/su10051480
Note that from the first issue of 2016, this journal uses article numbers instead of page numbers. See further details here.