Performance Evaluation of Public-Private Partnership Projects from the Perspective of Efficiency, Economic, Effectiveness, and Equity: A Study of Residential Renovation Projects in China

Abstract
:1. Introduction
2. Literature Review
2.1. The Performance Evaluation of PPP Projects
2.2. 4E Theory
3. Performance Evaluation Index System from the Perspective of 4E
- (1)
- Efficiency indicators (F1): Efficiency indicators are mainly applied for reflecting the 4P2R performance in the transformation process regarding quality, schedule, cost, and safety management. In general, the objectives of project management include quality, progress, cost, and safety. This article selects indicators to measure the completion efficiency of the four major goals, such as the qualified rate of project quality (V11), the level of project safety management (V12), project schedule payment rate (V13), and progress completion rate (V14). The indicator (V11) is used to measure the qualified rate of 4P2R. The indicator (V12) is used to assess the safety management of 4P2R during the construction phase. The indicator (V13) is used to evaluate the timely payment of the 4P2R in the construction stage. The indicator (V14) is used to measure the completion degree of the project schedule.
- (2)
- Equity indicators (F2): From the perspective of stakeholders, this type of indicators mainly analyzes project risk sharing, concession period, charge mechanism, as well as the satisfaction of stakeholders from the project. This paper selects six indicators: the rationality of risk sharing, concession period, and charge mechanism, in addition to the satisfaction of the public, government, and social capital. ① The rationality of risk sharing (V21) measures the rationality of risk sharing between the government and social capital in 4P2R; ② The rationality of concession period (V22) measures the rationality of the 4P2R concession period; ③ The rationality of charge mechanism (V23) measures the rationality of charging mechanism during the concession period after completing the renovation of the old residential areas; ④ Public, government and social capital satisfaction are used to assess the satisfaction of relevant stakeholders from 4P2R. Among them, the satisfaction level of the public (V24) and government (V25) focus on measuring the overall satisfaction of government departments and community owners on the effect of old residential areas renovation. Social capital satisfaction (V26) focuses on measuring the implementation of preferential government policies, and the cooperation of public with the project.
- (3)
- Economic indicators (F3): Economic indicators mainly reflect the cost and profit status of 4P2R and its contribution to the regional economic development. In this work, we chose seven indicators such as tax contribution rate, asset–liability ratio, investment profit rate, employment contribution rate, operating cost change rate, actual investment change rate, and degree of regional development. ① Tax contribution rate (V31) is used to measure the contribution of 4P2R to the tax revenue in the region; ② Asset–liability ratio (V32) is used to measure the debt level of 4P2R; ③ Investment profit rate (V33) is used to measure the profitability of 4P2R; ④ Employment contribution rate (V34) mainly measures the contribution rate of 4P2R to the public employment; ⑤ Operating cost change rate (V35) is mainly used to measure the cost change of 4P2R during the operation period, and operating cost change rate = (actual annual operating cost—planned annual operating cost)/planned annual operating cost; ⑥ Actual investment change rate (V36) is used to measure the deviation between the completed settlement price and the planned investment amount; ⑦ Degree of regional development (V37) is used to measure the degree of regional development contribution of 4P2R.
- (4)
- Effectiveness index (F4): F4 indicators focus on assessing the renovation and remediation of 4P2R. During index selection, the research team conducts on-site investigations, consults literature, as well as academics, government staff, and project management personnel in related fields. The renovation and rectification of old buildings can be summarized as housing repair, living environment, infrastructure and operating maintenance. ① To achieve the integrity of the house and the improvement of its functionality, the main outline of house repair is to demolish, renovate and maintain the house. We based our evaluation on the following indicators: energy-saving transformation (V41), internal repair (V42), external repair (V43), and waterproofing and maintenance of roofs (V44); ② The main purpose of environmental renovation is to provide a livable environment for the old community residents. The main content is to clean up illegal buildings and structures, upgrade the district greening and improve sanitation facilities. Community greening (V45), illegal buildings (V46) and sanitation facilities (V47) have been included in this category; ③ Infrastructure is an engineering facility that provides services for residents. The transformation of infrastructure in old communities involves water, electricity, heating, gas, roads, parking lots and firefighting facilities. In this paper, six indexes were selected: the maintenance and renovation of water, electricity, heating and gas (V48), the renovation of parking lot (V49), the reform of fire protection facilities (V410), the upgrading of residential roads (V411) and the reconstruction of rain and sewage discharge facilities (V412); ④ The operation and maintenance management is critical for ensuring the normal operations of old communities, involving the maintenance of public facilities and equipment, roads and ancillary facilities, environmental health, greening, and security. Here, we focused on public facilities and equipment (V413), the maintenance of roads and ancillary facilities (V414), the quality of greening management service (V415), the quality of environmental health services (V416), and the quality of security services (V417). The indicators and their function are shown in Table 2.
4. Research Methods
4.1. Analysis of Research Methods’ Applicability
4.1.1. OWA Operator Weighting Method
4.1.2. Performance Evaluation Method Based on Cloud Model
4.2. OWA Operator Weighting Method
- (1)
- First, we sorted the decision data of the indicators from the largest to the smallest, then numbered the data beginning from 0, and obtained the result that turned out to be .
- (2)
- The data was weighted by the number of combinations, and the equation was obtained based on the number of combinations. The weight vector was determined by:
- (3)
- We weighted the decision data according to the weight vector , and the absolute weights of the indicators were determined by:
- (4)
- The relative weights of the calculated indicators were determined by:
4.3. Cloud Model
- (1)
- The positive cloud generator [55]
| Algorithm 1 |
| Input: The positive cloud generator’s digital eigenvalues are used as inputs. N is set as the number of cloud drops. Output: N and its corresponding membership degree. Step 1: The normal random number () is generated by taking as expected value and as mean square error, where ; Step 2: The normal random number () is produced by taking as the expected value and as mean square error, where ; Step 3: Calculate ; Let (x,y) be a cloud drop, where x represents a specific quantitative value of the qualitative concept and represents the membership degree of the qualitative concept; Step 4: Repeat Step 1 to Step 3, the operation stops after generating the set of n cloud droplets. |
- (2)
- The reverse cloud generator
| Algorithm 2 |
| Input: Enter n cloud drops, e.g., sample data Output: The cloud model’s digital eigenvalues Step 1: Take as the estimate of ; Step 2: After removing the point of >0.999, the number of remaining cloud droplets is . Step 3: is calculated by ; Step 4: Obtain from , where is an estimate of ; Step 5: Obtain from , where is an estimate of ; |
- (3)
- The single condition and single rule generator
| Algorithm 3 |
| Input: The quantitative data , the digital eigenvalues of X-conditioned cloud generator , the digital eigenvalues of Y-conditioned cloud generator . Output: Under the condition that the degree of certainty is , the qualitative concept value of Y-conditioned cloud generator is . Step 1: The normal random number is generated by taking as expected value and as mean square error; Step 2: The degree of certainty is calculated by ; Step 3: The normal random number is generated by taking as expected value and as mean square error; Step 4: If the X-conditioned cloud generator is activated and then it rises in the direction of , Y-conditioned cloud generator is activated, and the certainty value is . Similarly, if the X-conditioned cloud generator is activated and then it drops in the direction of , Y-conditioned cloud generator is activated and the certainty value is . |
5. Performance Evaluation Based on OWA Operator and Cloud Model
5.1. Research Process
5.2. Determination of the Performance Evaluation Index System of 4P2R
5.3. Using OWA Operator Weighting Method to Produce the Index Weights
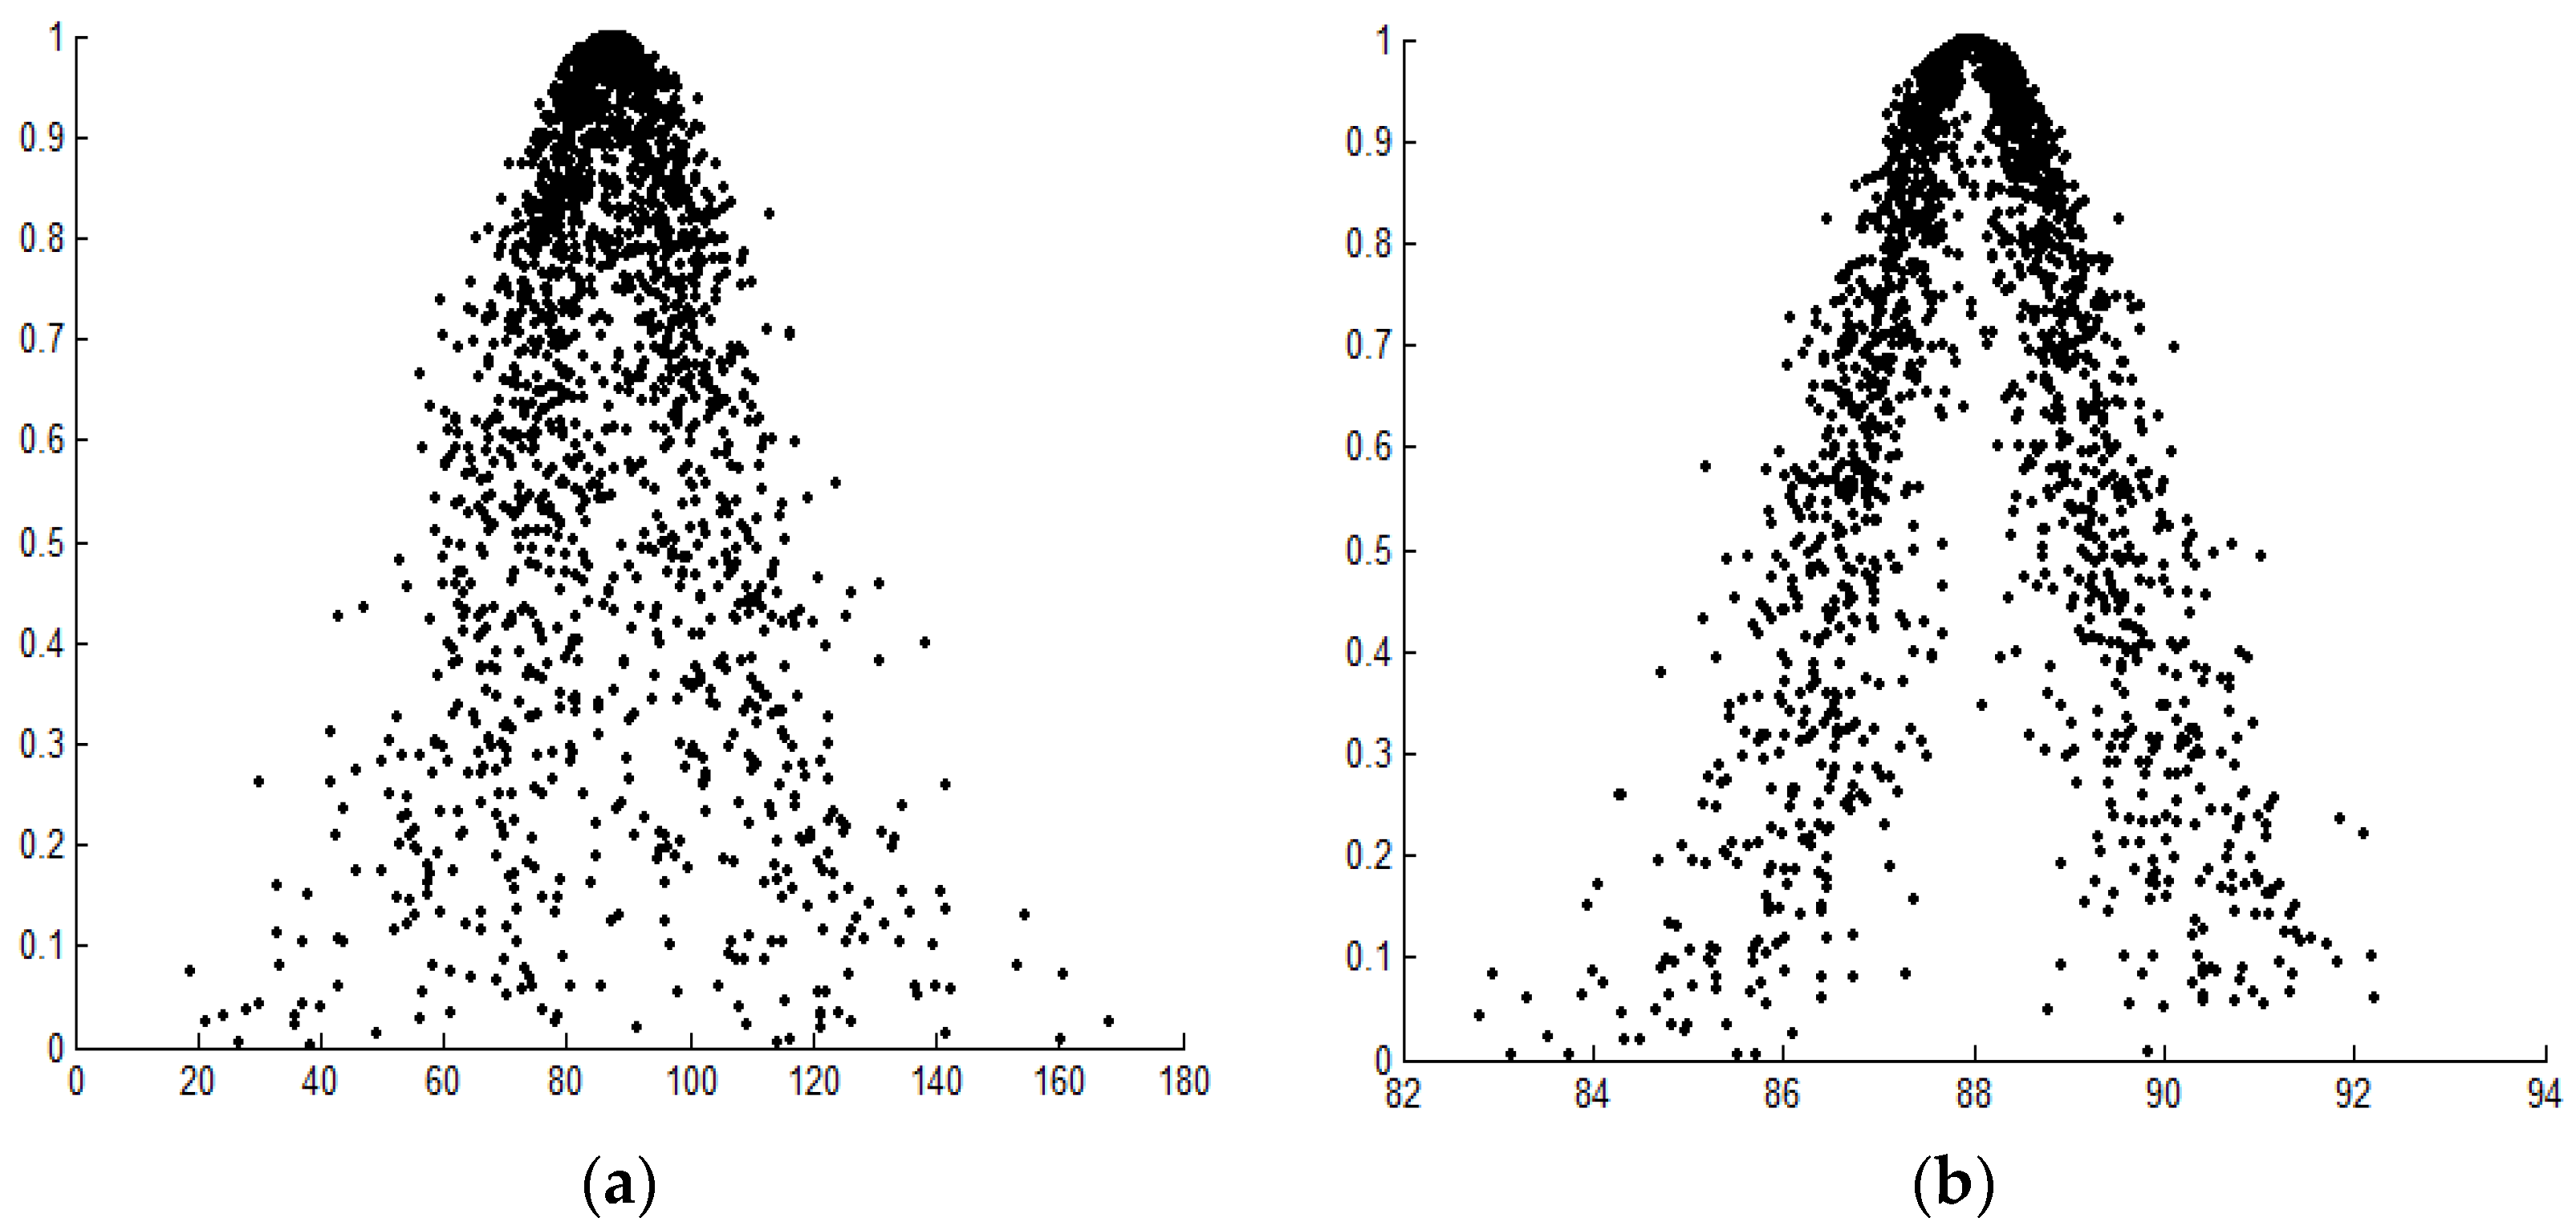
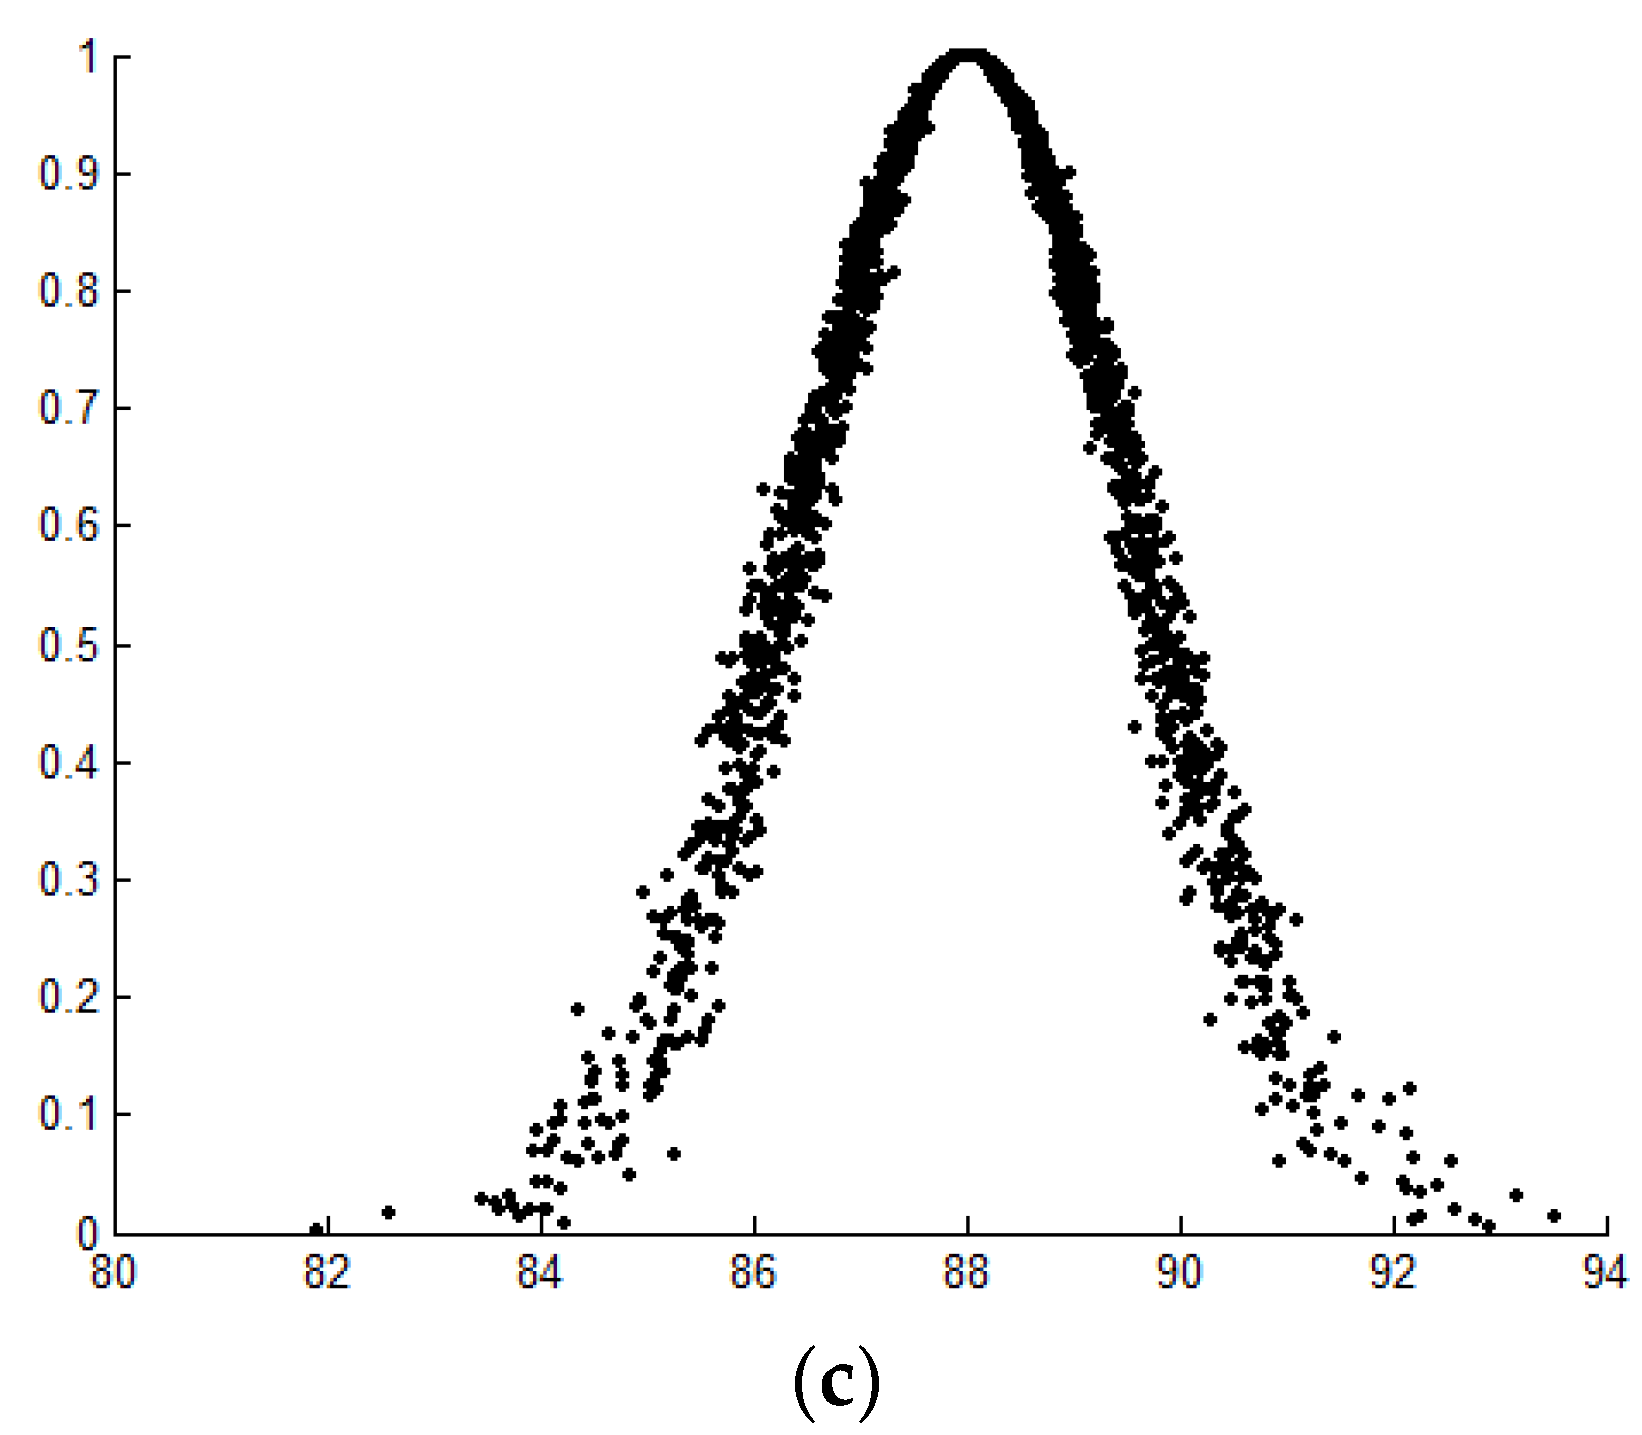
5.4. Index Value Measurement Based on Cloud Uncertainty Reasoning and Positive Reverse Cloud
5.4.1. Quantitative Index Measurement Based on Cloud Uncertainty Reasoning
- (1)
- Determining the comment set of the indicator and digital eigenvalues
- (2)
- Determining the comment set of the score and digital eigenvalues
- (3)
- Measuring the value of the evaluation index
5.4.2. Qualitative Index Measure Based on Positive Reverse Cloud
- (1)
- Qualitative numerical conversion to qualitative concept based on reverse cloud
- (2)
- Transforming from qualitative concept to quantitative representation based on positive cloud
- (3)
- Determining the qualitative index value based on the Delphi method
5.5. Project Performance Evaluation Based on Normal Cloud Model
- (1)
- Building the domain of project performance indexes and the domain of comments
- (2)
- Determining standard normal cloud for project performance evaluation indicators
- (3)
- Performance evaluation of a single index
- (4)
- Comprehensive performance evaluation of the project
6. Case Study
6.1. Using OWA Operator Weighting Method to Determine the Index Weights
- (1)
- Determining the evaluation criteria
- (2)
- Scoring the importance of indicators
- (3)
- Calculating the weight vector
- (4)
- Calculating the absolute weights and relative weights
6.2. Project Performance Evaluation Based on Cloud Model
6.2.1. Quantitative Index Measure Based on Cloud Uncertainty Reasoning
- (1)
- Determining the comment set of the indicator and digital eigenvalues
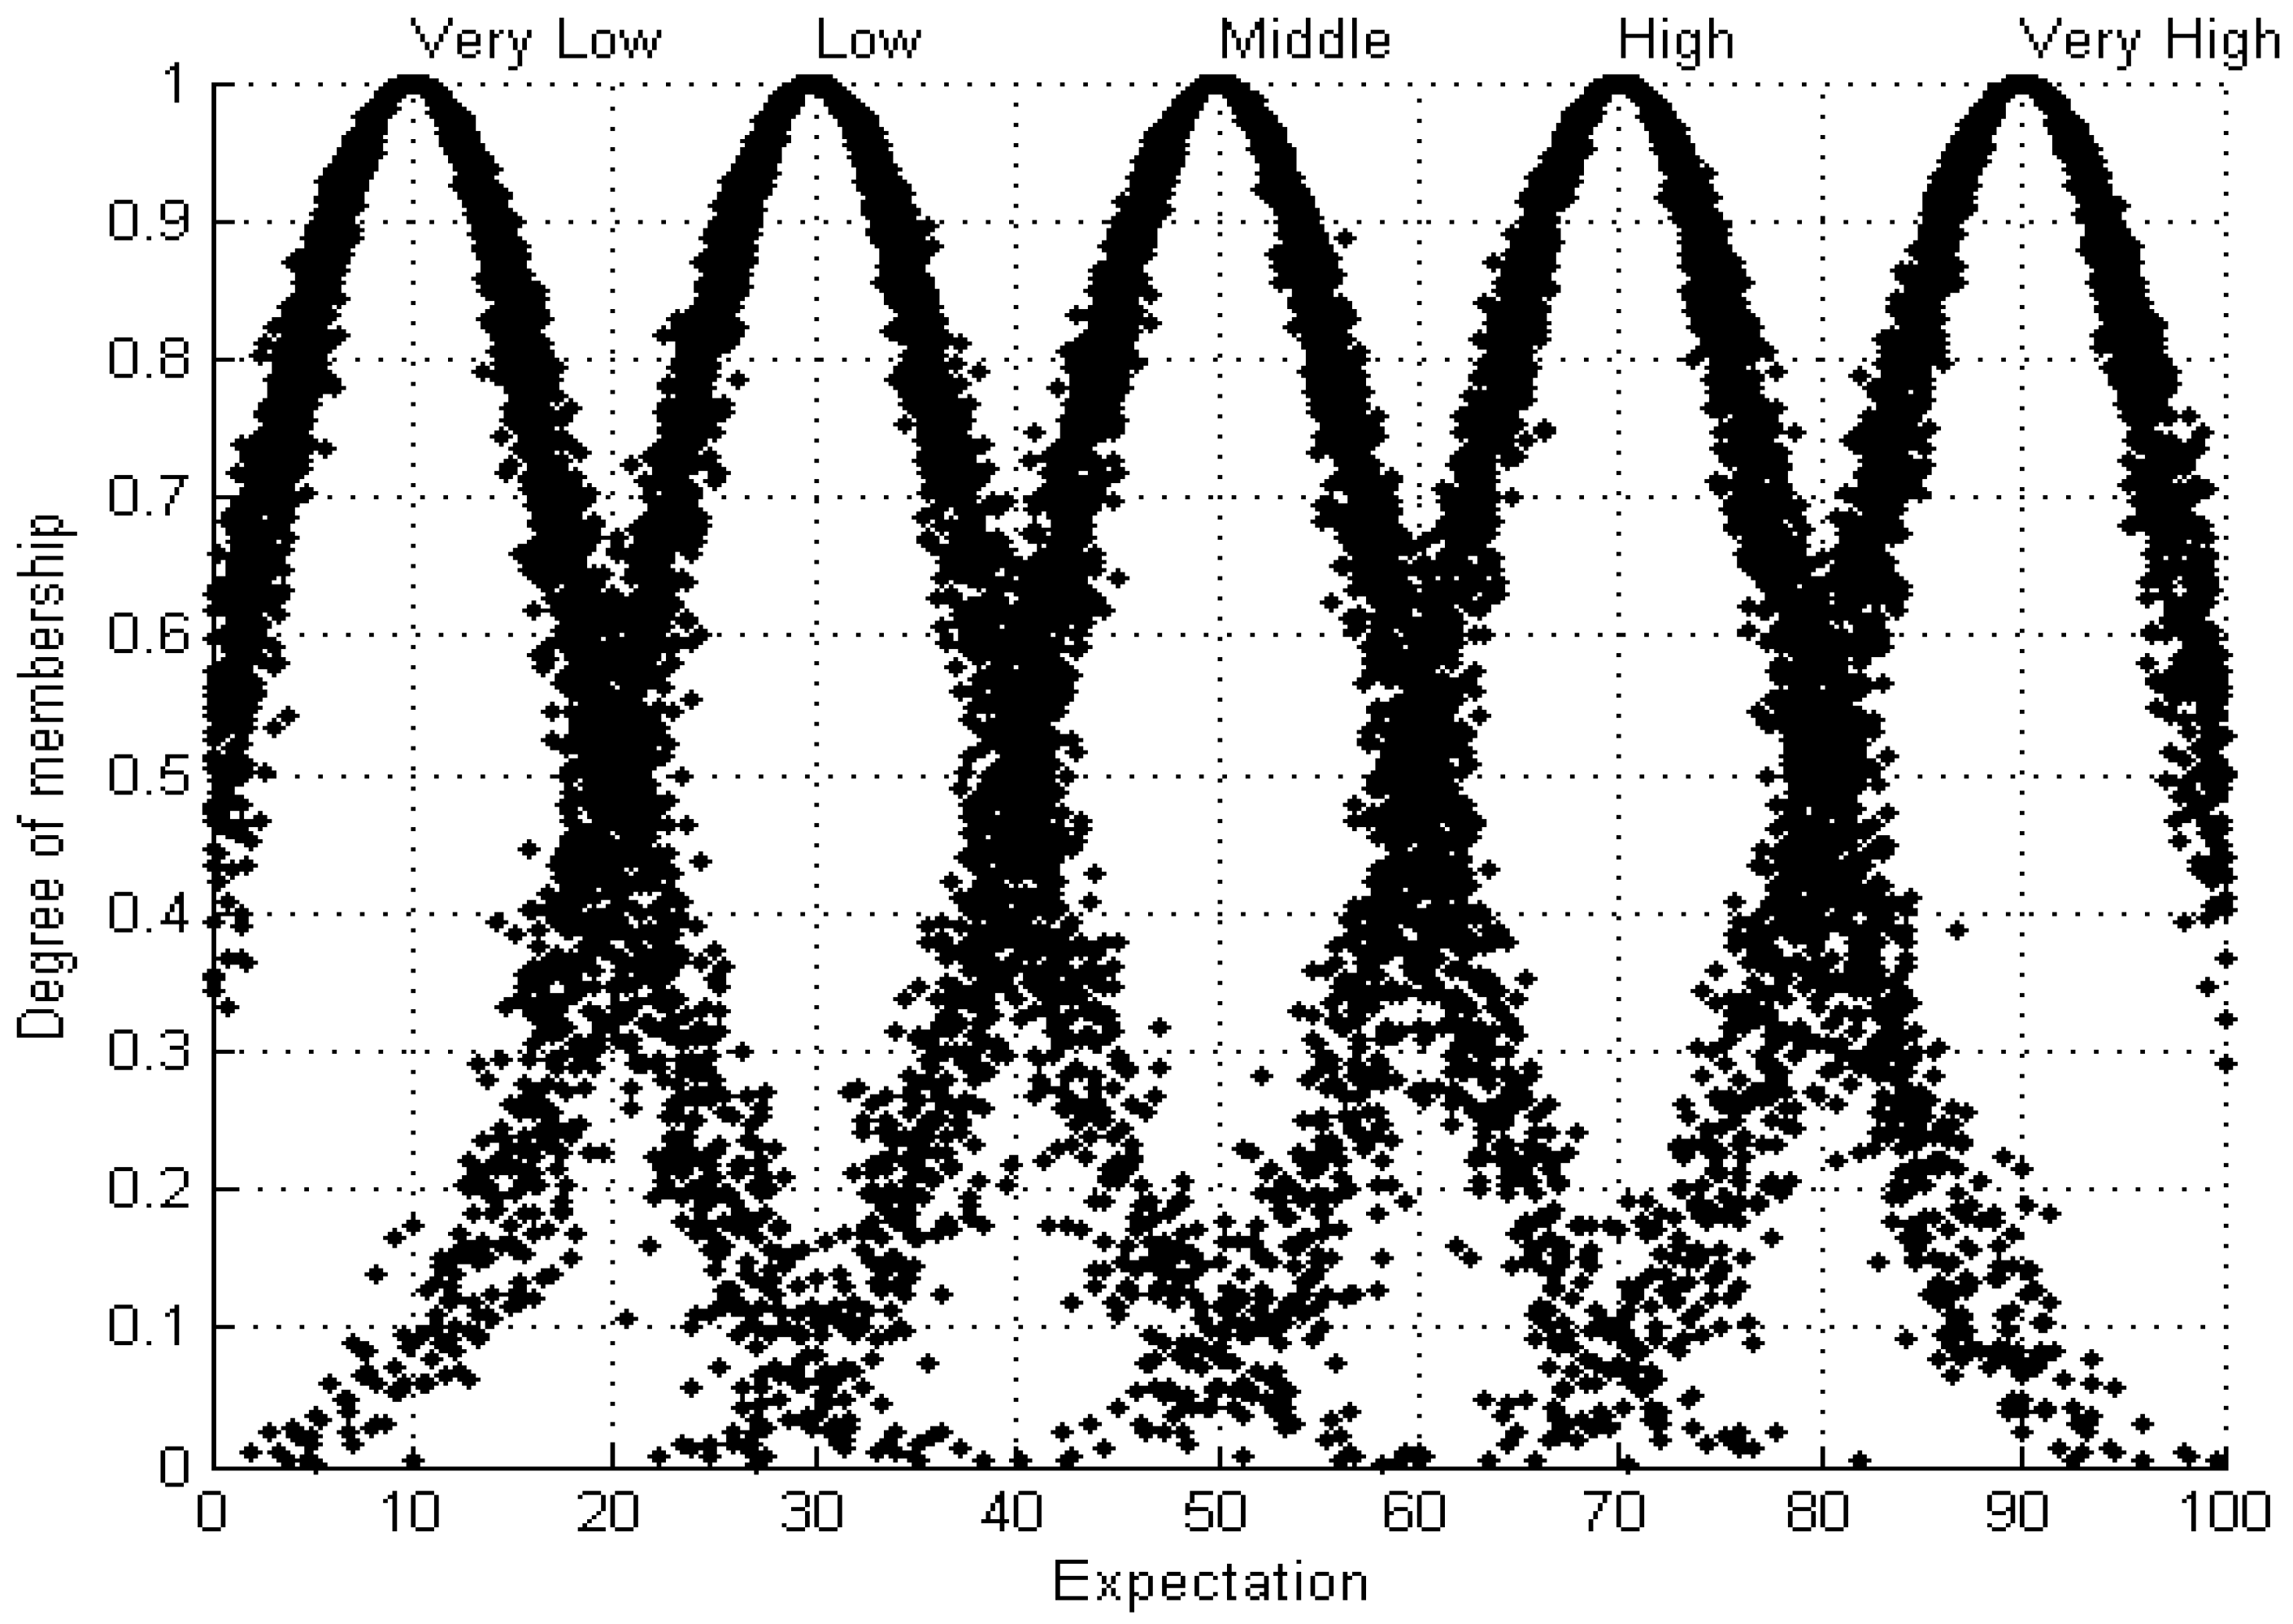
- (2)
- Determining the comment set of score and digital eigenvalues
- If QRPQ is “Very High”, the score is “Very High”;
- If QRPQ is “High”, the score is “High”;
- If QRPQ is “Middle”, the score is “Center”;
- If QRPQ is “Low”, the score is “Low”;
- If QRPQ is “Very Low”, the score is “Very Low.”
6.2.2. Qualitative Index Measure Based on Positive Reverse Cloud
- (1)
- Construction of the comment sets of qualitative indicators
- (2)
- Determining the value of qualitative indicator value
6.3. Project Performance Evaluation Based on Normal Cloud
- (1)
- Building the comment domain and digital eigenvalues
- (2)
- Performance evaluation of the project
- (3)
- Analysis of the evaluation results
7. Conclusions
- (1)
- We built a performance evaluation index system for 4P2R based on the 4E (Efficiency, Economic, Effectiveness, Equity) theory.
- (2)
- The performance evaluation model was established based on OWA and the cloud models. We used OWA to analyze the evaluation index’s weight. To reasonably determine the index value, we used a positive reverse cloud to determine the qualitative index value and cloud uncertainty reasoning to obtain the quantitative index value. We also used the normal cloud to evaluate the project performance.
- (3)
- The case study showed that the overall performance level of the project was determined as “High”, whereas the performance level of “operating cost change rate”, “waterproof maintenance of roofs”, and “the renovation of parking lots” were “Low”. Our work shows that the index system is suitable for the performance evaluation of 4P2R. The performance evaluation model can reasonably determine the indicator weights and index values and comprehensively measure the project performance. It can identify the deficiencies of past projects, propose improvement measures, and guide similar projects in the future.
- (4)
- The performance evaluation index system and performance evaluation model can improve the performance evaluation of 4P2R and potentially be applied to a great extent. It can provide reference for the government to formulate performance evaluation indicators for different types of PPP projects, so as to identify the problems of PPP projects and improve the comprehensive benefits of PPP projects. Because the performance evaluation model integrates an OWA operator and cloud model, the calculation process may be complicated. However, it can be programmed with MATLAB software (MATLAB 7.0 (7.0.0.19920 (R14), Math Works, Natick, MA, USA)) that has strong operability. Concurrently, introducing sustainability as an essential game-changer in the performance evaluation of 4P2R proves itself to be a significant research direction, which is worth studying further.
Author Contributions
Funding
Acknowledgments
Conflicts of Interest
References
- Ghanaee, M.; Pourezzat, A.A. Identifying the critical success factors for urban renovation projects; lessons learned from Tehran residential renovation projects. Int. J. Urban Sci. 2013, 17, 414–423. [Google Scholar] [CrossRef]
- Thomsen, K.E.; Rose, J.; Morck, O.; Jensen, S.Ø.; Østergaard, I. Energy consumption in an old residential building before and after deep energy renovation. Energy Procedia 2015, 78, 2358–2365. [Google Scholar] [CrossRef]
- Ouyang, J.; Wang, C.; Li, H.; Hokao, K. A methodology for energy-efficient renovation of existing residential buildings in China and case study. Energy Build. 2011, 43, 2203–2210. [Google Scholar] [CrossRef]
- Ma, G.; Du, Q.; Wang, K. A Concession Period and Price Determination Model for PPP Projects: Based on Real Options and Risk Allocation. Sustainability 2018, 10, 706. [Google Scholar] [CrossRef]
- Marques, R.C.; Berg, S. Risks, contracts and private-sector participation in infrastructure. J. Constr. Eng. Manag. 2011, 137, 925–932. [Google Scholar] [CrossRef]
- Zhen, H. Study of mode selection of public-private partnerships (PPP) projects—A case study of Japan. J. Public Manag. 2010, 7, 113–121. (In Chinese) [Google Scholar]
- Alzahrani, J.I.; Emsley, M.W. The impact of contractors’ attributes on construction project success: A post construction evaluation. Int. J. Proj. Manag. 2013, 31, 313–322. [Google Scholar] [CrossRef]
- Ismail, K.; Takim, R.; Nawawi, A.H. The evaluation criteria of Value for Money (VFM) of Public Private Partnership (PPP) bids. Int. Conf. Intell. Build. Manag. 2011, 5, 349–355. [Google Scholar]
- Cheung, E.; Chan, A.P.C.; Kajewski, S. Enhancing value for money in public private partnership projects: Findings from a survey conducted in Hong Kong and Australia compared to findings from previous research in the UK. J. Financ. Manag. Prop. Constr. 2009, 14, 7–20. [Google Scholar] [CrossRef] [Green Version]
- Ismail, S. Drivers of value for money public private partnership projects in Malaysia. Asian Rev. Account. 2013, 21, 241–256. [Google Scholar] [CrossRef]
- El-Gohary, N.M.; Osman, H.; El-Diraby, T.E. Stakeholder management for public private partnerships. Int. J. Proj. Manag. 2006, 24, 595–604. [Google Scholar] [CrossRef]
- Sanghi, A.; Sundakov, A.; Hankinson, D. Designing and Using Public-Private Partnership Units in Infrastructure: Lessons from Case Studies around the World; PPIAF—GRIDLINES; World Bank: Washington, DC, USA, 2007; pp. 1–5. [Google Scholar] [CrossRef]
- Shen, L.; Tam, V.W.Y.; Gan, L.; Ye, K.; Zhao, Z. Improving sustainability performance for public-private-partnership (PPP) projects. Sustainability 2016, 8, 15. [Google Scholar] [CrossRef]
- Augustinova, E.; Daubner, M. Achieverment of value for money in PPP project by selection of key performance indicators. Proceedings of the 14th International Multidisciplinary Scientific GeoConference (SGEM 2014), Albena, Bulgaria, 17–26 June 2014.
- Liu, J.; Love, P.E.D.; Davis, P.R.; Smith, J.; Regan, M. Conceptual framework for the performance measurement of public-private partnerships. J. Infrastruct. Syst. 2015, 21. [Google Scholar] [CrossRef]
- Devkar, G.A.; Kalidindi, S.N. Modeling and assessment of competencies in urban local bodies for implementing PPP projects. Built Environ. Proj. Asset Manag. 2013, 3, 42–57. [Google Scholar] [CrossRef]
- Fathali, E.; Ibrahim, H. Private Partner Selection and Bankability Assessment of PPP in Infrastructure Projects. Doctoral Dissertation, Concordia University, Montréal, QC, Canada, 2015. [Google Scholar]
- Pinto, F.S.; Costa, A.S.; Figueira, J.R.; Marques, R.C. The quality of service: An overall performance assessment for water utilities. Omega 2017, 69, 115–125. [Google Scholar] [CrossRef]
- Li, X.; Liao, X.; Zhang, X.; Chen, X.; Wang, H.; Tan, X. Application of GM Model and GRA on the Evaluation for Financial Burden of Patients at Hospitals in China by PPP Model. J. Grey Syst. 2013, 25, 112–128. [Google Scholar]
- Checkland, P. Soft systems methodology: A 30-year retrospective. Syst. Res. Behav. Sci. 1999, 58, 11–58. [Google Scholar] [CrossRef]
- Checkland, P.; Tsouvalis, C. Reflecting on SSM: The Link between Root Definitions and Conceptual Models. Syst. Res. Behav. Sci. 1997, 14, 153–168. [Google Scholar] [CrossRef]
- Checkland, P. The emergent properties of SSM in use: A symposium by reflective practitioners. Syst. Pract. Action Res. 2000, 13, 799–823. [Google Scholar] [CrossRef]
- Checkland, P.; Winter, M. Process and content: Two ways of using SSM. J. Oper. Res. Soc. 2006, 57, 1435–1441. [Google Scholar] [CrossRef]
- INTOSAI Auditing Standards Committee. Implementation Guidelines for Performance Auditing; International Congress of Supreme Audit Institutions (INTOSAI): Vienna, Austria, 2004. [Google Scholar]
- Azuma, N. The framework of INTOSAI Government Auditing Standards: In the stream of international convergence. Gov. Audit. Rev. 2008, 15, 77–97. [Google Scholar]
- Ionescu, L. Internal Control for Economic Crunch. Econ. Manag. Financ. Mark. 2011, 6, 791–799. [Google Scholar]
- Otbo, H. SAI Independence: A founding principle of INTOSAI. Int. J. Gov. Audit. 2009, 36, 1–3. [Google Scholar]
- Johnsen, Å. What does 25 years of experience tell us about the state of performance measurement in public policy and management? Public Money Manag. 2005, 25, 9–17. [Google Scholar] [CrossRef]
- Wang, Z. Constructing evaluation criteria for China’s integrated public finance performance auditing. J. Bus. Emerg. Mark. 2012, 4, 352–361. [Google Scholar] [CrossRef]
- Yarong, Z.; Xin, Y. Research on the sustainable development and the objective of Chinese government performance audit. Energy Procedia 2011, 5, 1230–1236. [Google Scholar] [CrossRef]
- Liu, H.-T.; Tsai, Y. A fuzzy risk assessment approach for occupational hazards in the construction industry. Saf. Sci. 2012, 50, 1067–1078. [Google Scholar] [CrossRef]
- Sun, L.Y.; Miao, C.L.; Yang, L. Ecological-economic efficiency evaluation of green technology innovation in strategic emerging industries based on entropy weighted TOPSIS method. Ecol. Indic. 2017, 73, 554–558. [Google Scholar] [CrossRef]
- El-Santawy, M.F.; Ahmed, A.N. An information entropy weighting method combined to TOPSIS approach for ranking consulting firms. Life Sci. J. 2013, 10, 1060–1063. [Google Scholar] [CrossRef]
- Shankar, K.M.; Kumar, P.U.; Kannan, D. Analyzing the drivers of advanced sustainable manufacturing system using AHP approach. Sustainability 2016, 8, 824. [Google Scholar] [CrossRef] [Green Version]
- Mokarram, M.; Hojati, M. Using ordered weight averaging (OWA) aggregation for multi-criteria soil fertility evaluation by GIS (case study: Southeast Iran). Comput. Electron. Agric. 2017, 132, 1–13. [Google Scholar] [CrossRef]
- Sohail, S.S.; Siddiqui, J.; Ali, R. An OWA-Based Ranking Approach for University Books Recommendation. Int. J. Intell. Syst. 2018, 33, 396–416. [Google Scholar] [CrossRef]
- Gül, S.; Kabak, Ö.; Topcu, Y.İ. An OWA Operator-Based Cumulative Belief Degrees Approach for Credit Rating. Int. J. Intell. Syst. 2018, 33, 998–1026. [Google Scholar] [CrossRef]
- Zhou, L.G.; Chen, H.Y. Continuous generalized OWA operator and its application to decision making. Fuzzy Sets Syst. 2011, 168, 18–34. [Google Scholar] [CrossRef]
- Wei, C.; Pei, Z.; Li, H. An induced OWA operator in coal mine safety evaluation. J. Comput. Syst. Sci. 2012, 78, 997–1005. [Google Scholar] [CrossRef]
- Kacprzyk, J.; Zadrozny, S. Linguistic summarization of the contents of Web server logs via the Ordered Weighted Averaging (OWA) operators. Fuzzy Sets Syst. 2016, 285, 182–198. [Google Scholar] [CrossRef]
- Kwong, C.K.; Ip, W.H.; Chan, J.W.K. Combining scoring method and fuzzy expert systems approach to supplier assessment: A case study. Integr. Manuf. Syst. 2002, 13, 512–519. [Google Scholar] [CrossRef]
- Silvia, P.J.; Nusbaum, E.C.; Beaty, R.E. Old or new? evaluating the old/new scoring method for divergent thinking tasks. J. Creat. Behav. 2017, 51, 64–81. [Google Scholar] [CrossRef]
- Wang, G.; Xu, C.; Li, D. Generic normal cloud model. Inf. Sci. 2014, 280, 1–15. [Google Scholar] [CrossRef]
- Hu, S.; Li, D.; Liu, Y.; Li, D. Mining weights of land evaluation factors based on cloud model and correlation analysis. Geo-Spat. Inf. Sci. 2007, 10, 218–222. [Google Scholar] [CrossRef] [Green Version]
- Li, M.W.; Hong, W.C.; Kang, H.G. Urban traffic flow forecasting using Gauss-SVR with cat mapping, cloud model and PSO hybrid algorithm. Neurocomputing 2013, 99, 230–240. [Google Scholar] [CrossRef]
- Li, L.; Liu, L.; Yang, C.; Li, Z. The Comprehensive Evaluation of Smart Distribution Grid Based on Cloud Model. Energy Procedia 2012, 17, 96–102. [Google Scholar] [CrossRef]
- Jin, L.S.; Qian, G. OWA generation function and some adjustment methods for OWA operators with application. IEEE Trans. Fuzzy Syst. 2016, 24, 168–178. [Google Scholar] [CrossRef]
- Torra, V. The weighted OWA operator. Int. J. Intell. Syst. 1997, 12, 153–166. [Google Scholar] [CrossRef]
- Wang, Y.; Xu, Z.-S. A new method of giving OWA weights. Math. Pract. Theory 2008, 3, 51–61. (In Chinese) [Google Scholar]
- Li, D.Y.; Meng, H.J.; Shi, X.M. Membership clouds and membership cloud generators. J. Comp. Res. Dev. 1995, 32, 15–20. (In Chinese) [Google Scholar]
- Li, L.; Fan, F.; Ma, L.; Tang, Z. Energy utilization evaluation of carbon performance in public projects by FAHP and cloud model. Sustainability 2016, 8. [Google Scholar] [CrossRef]
- Xu, C.; Wang, G.; Zhang, Q. A New Multi-Step Backward Cloud Transformation Algorithm Based on Normal Cloud Model. Fundam. Inform. 2014, 133, 55–85. [Google Scholar] [CrossRef]
- Zhang, J.; Zhang, J.A.; Sun, P. Trust evaluation model based on cloud model for C2C electronic commerce. Comput. Syst. Appl. 2010, 19, 83–87. (In Chinese) [Google Scholar]
- Qin, K.; Xu, K.; Liu, F.; Li, D. Image segmentation based on histogram analysis utilizing the cloud model. Comput. Math. Appl. 2011, 62, 2824–2833. [Google Scholar] [CrossRef]
- Jia, S.; Mao, B. Research on CFCM: Car Following Model Using Cloud Model Theory. J. Transp. Syst. Eng. Inf. Technol. 2007, 7, 67–73. [Google Scholar] [CrossRef]
- Liu, Y.C.; Ma, Y.T.; Zhang, H.S.; Li, D.Y.; Chen, G.S. A method for trust management in cloud computing: Data coloring by cloud watermarking. Int. J. Autom. Comput. 2011, 8, 280–285. [Google Scholar] [CrossRef]
- Li, D.; Cheung, D.; Shi, X.; Ng, V. Uncertainty reasoning based on cloud models in controllers. Comput. Math. Appl. 1998, 35, 99–123. [Google Scholar] [CrossRef]
- Gao, X.; Chen, L.; Sun, B.; Liu, Y. Employing SWOT analysis and normal cloud model for water resource sustainable utilization assessment and strategy development. Sustainability 2017, 9, 1439. [Google Scholar] [CrossRef]


| First-Level Indicators | Two-Level Indicators | |
|---|---|---|
| Efficiency indicators (F1) | Qualified rate of project quality (V11) | |
| The level of project safety management (V12) | ||
| Project schedule payment rate (V13) | ||
| Progress completion rate (V14) | ||
| Equity indicators (F2) | The rationality of risk sharing (V21) | |
| The rationality of concession period (V22) | ||
| The rationality of charge mechanism (V23) | ||
| The satisfaction level of public (V24) | ||
| The satisfaction level of government (V25) | ||
| The satisfaction level of social capital (V26) | ||
| Economic indicators (F3) | Tax contribution rate (V31) | |
| Asset-liability ratio (V32) | ||
| Investment profit rate (V33) | ||
| Employment contribution rate (V34) | ||
| Operating cost change rate (V35) | ||
| Actual investment change rate (V36) | ||
| Degree of regional development (V37) | ||
| Effectiveness index (F4) | Housing repair | Energy-saving transformation (V41) |
| Internal repair (V42) | ||
| External repair (V43) | ||
| Waterproofing and maintenance of roofs (V44) | ||
| Living environment | Community greening (V45) | |
| Illegal buildings (V46) | ||
| Sanitation facilities (V47) | ||
| Infrastructure | The maintenance and renovation of water, electricity, heating, and gas (V48) | |
| The renovation of parking lots (V49) | ||
| The reform of fire protection facilities (V410) | ||
| The upgrading of residential roads (V411) | ||
| The reconstruction of rain and sewage discharge facilities (V412) | ||
| Operating maintenance | The maintenance of public facilities and equipment (V413) | |
| The maintenance of roads and ancillary facilities (V414) | ||
| The quality of greening management service (V415) | ||
| The quality of environmental health services (V416) | ||
| The quality of security services (V417) | ||
| Indicator | Function |
|---|---|
| V41 | To measure the energy-saving transformation of 4P2R |
| V42 | To assess the internal repair of 4P2R |
| V43 | To evaluate the external repair of 4P2R |
| V44 | To measure the repair of roofing and waterproof |
| V45 | To evaluate the community greening of 4P2R |
| V46 | To measure the dismantling of illegal buildings in 4P2R |
| V47 | To assess the arrangement of sanitation facilities |
| V48 | To assess the maintenance and renovation of water, electricity, heating and gas |
| V49 | To evaluate the renovation of parking lot |
| V410 | To measure the reform of fire protection facilities |
| V411 | To assess the upgrading of residential roads |
| V412 | To evaluate the reconstruction of rain and sewage discharge facilities |
| V413 | To assess the maintenance of public facilities and equipment |
| V414 | To evaluate the maintenance of roads and ancillary facilities |
| V415 | To measure the quality of greening management service |
| V416 | To assess the quality of environmental health services |
| V417 | To evaluate the quality of security services |
| Indicator | Expert (1) | Expert (2) | Expert (3) | Expert (4) | Expert (5) | Expert (6) |
|---|---|---|---|---|---|---|
| F1 | 5.5 | 6 | 5 | 6 | 5 | 6.5 |
| F2 | 8 | 7.5 | 8 | 8 | 7 | 7 |
| F3 | 6 | 5 | 5.5 | 5 | 5 | 4.5 |
| F4 | 8.5 | 9.5 | 9 | 9.5 | 9 | 9.5 |
| Indicator | V11 | V12 | V13 | V14 | V21 | V22 |
|---|---|---|---|---|---|---|
| Indicator Value | 85.98 | 88.03 | 67.85 | 74.34 | 78.5 | 69.35 |
| Weight | 0.0511 | 0.0490 | 0.0484 | 0.0486 | 0.0468 | 0.0495 |
| Indicator | V23 | V24 | V25 | V26 | V31 | V32 |
| Indicator Value | 72.57 | 76.35 | 82.56 | 72.99 | 62.05 | 72.4 |
| Weight | 0.0478 | 0.053 | 0.0417 | 0.0428 | 0.0162 | 0.0316 |
| Indicator | V33 | V34 | V35 | V36 | V37 | V41 |
| Indicator Value | 61.17 | 83.27 | 42.48 | 62.36 | 71.1 | 71.25 |
| Weight | 0.0173 | 0.0302 | 0.0265 | 0.0291 | 0.0307 | 0.0193 |
| Indicator | V42 | V43 | V44 | V45 | V46 | V47 |
| Indicator Value | 64.12 | 78.05 | 46.58 | 77.12 | 70.66 | 73.13 |
| Weight | 0.0182 | 0.0181 | 0.0197 | 0.0203 | 0.0191 | 0.0198 |
| Indicator | V48 | V49 | V410 | V411 | V412 | V413 |
| Indicator Value | 61.29 | 48.24 | 81.85 | 75.1 | 71.35 | 63.57 |
| Weight | 0.0204 | 0.0194 | 0.0201 | 0.0192 | 0.0211 | 0.0189 |
| Indicator | V414 | V415 | V416 | V417 | ||
| Indicator Value | 70.93 | 74.14 | 80.24 | 70.25 | ||
| Weight | 0.0235 | 0.0192 | 0.0190 | 0.0244 |
| Indicator | Very Low | Low | Middle | High | Very High | Performance Level | Changing Trends |
|---|---|---|---|---|---|---|---|
| F | 2.02 × 10⁵ | 0.0139 | 0.1185 | 0.6734 | 0.2630 | High | Very High |
| F1 | 2.07 × 10¹⁹ | 1.85 × 10¹¹ | 6.43 × 10⁶ | 0.0087 | 0.0457 | Very High | High |
| F2 | 1.34 × 10¹² | 1.37 × 10⁶ | 0.0068 | 0.2176 | 0.0758 | High | Very High |
| F3 | 1.76 × 10⁵ | 0.0090 | 0.0436 | 0.1098 | 0.0286 | High | Middle |
| F4 | 2.60 × 10⁶ | 0.0049 | 0.0620 | 0.2426 | 0.0548 | High | Middle |
© 2018 by the authors. Licensee MDPI, Basel, Switzerland. This article is an open access article distributed under the terms and conditions of the Creative Commons Attribution (CC BY) license (http://creativecommons.org/licenses/by/4.0/).
Share and Cite
Cong, X.; Ma, L. Performance Evaluation of Public-Private Partnership Projects from the Perspective of Efficiency, Economic, Effectiveness, and Equity: A Study of Residential Renovation Projects in China. Sustainability 2018, 10, 1951. https://doi.org/10.3390/su10061951
Cong X, Ma L. Performance Evaluation of Public-Private Partnership Projects from the Perspective of Efficiency, Economic, Effectiveness, and Equity: A Study of Residential Renovation Projects in China. Sustainability. 2018; 10(6):1951. https://doi.org/10.3390/su10061951
Chicago/Turabian StyleCong, Xuhui, and Li Ma. 2018. "Performance Evaluation of Public-Private Partnership Projects from the Perspective of Efficiency, Economic, Effectiveness, and Equity: A Study of Residential Renovation Projects in China" Sustainability 10, no. 6: 1951. https://doi.org/10.3390/su10061951