Trade-Off between the Social and Environmental Performance of Green Concrete: The Case of 6 Countries


Division of Building Technology, Chalmers University of Technology, 41296 Gothenburg, Sweden
*
Author to whom correspondence should be addressed.
Sustainability 2018, 10(7), 2309; https://doi.org/10.3390/su10072309
Submission received: 14 May 2018
/
Revised: 26 June 2018
/
Accepted: 27 June 2018
/
Published: 4 July 2018
Abstract
:Improving the sustainability performance of construction industry is driven by two forces: regulatory push (policy initiatives), and market pull where improving a corporate sustainability performance can be financially beneficial for enterprises. Through the investigation of the sustainability hotspots and impacts, concerning social and environmental, of the steel slag mixed concrete (green concrete) the study assessed the factors relevant for its performance and examined how to improve them. Hotspot analysis and impact assessments were conducted by social and environmental life cycle assessment (LCA). The assessed green concrete represented not just the variety of geographic representation but also the product designs (three different slag contents) and the potential difference occurring from the corporate efforts, where four classes were introduced. The investigation of the social and environmental hotspots of the green concrete revealed a difference in the relation between the sustainability performance and steel slags. While the increased slag content resulted in worse social performance, the increase improved the environmental performance in all six investigated case countries. This trade-off between the social and environmental performance implied the limits of the sustainable product design and suggested the effectiveness of the supply chain management for improving the two sustainability performances for the green concrete.
1. Introduction
Improving Sustainability Performance of Products for Better Financial Performance
The construction industry is a significant sector affecting our society: economically, socially [1] and environmentally [2,3,4,5]. The fact created a societal pressure on the industry to become more sustainable. One of such can be seen as a regulatory push, including CEN/TC350 [6] that describes how sustainable building should be assessed and achieved, and Construction Product Regulation (CPR) [7] states the sustainable use of natural resources as one of the basic requirements. Furthermore, Energy Performance Directive [8] requires the energy consumption of new buildings in Europe to be nearly-zero from 2020.
Meanwhile, various studies have investigated the potential benefits that companies could gain from improving the sustainability performance. For instance, the study from [9] showed the positive link between both the increase in the corporate social responsibility (CSR) strength and the reduction in the CSR concern, defined in Kinder Lydenburg Domini (KLD) Social Ratings Data, and the corporate financial performance. Former studies such as [10,11] support these findings that the companies with better CSR performance were associated with the higher return on equity (ROE), return on asset (ROA) and return on sales. The study from [12] highlighted the improvement of brand value with the CSR strength while the brand reputation was affected negatively by the CSR concerns. Furthermore, a white paper from RobecoSAM [13] which looked into the corporate sustainability performance from their database, which is used for Dow Jones Sustainability Index, and the financial performance measured by stock return confirmed the positive relationship. These findings imply the value of the sustainability performance improvement of companies in the construction sector not just to meet the requirement from the regulatory bodies but also for their potential financial benefits.
Concrete is one of the common building materials used around the globe [14,15]. Meanwhile, it has its consequence on the sustainability issues of the society. For instance, the cement used in concrete is approximately responsible for 5% [16] of the global greenhouse gas emission, around 10% when being CO2 specific [17,18]. In order to decrease the impact on the environmental sustainability, various attempts had been made. One of such is the use of steel slag as an alternative binder to cement, which is one of the green concretes [15]. Our study expanded the scope of sustainability by investigating not just the environmental but also social hotspots and impacts of the steel slag mixed concrete (hereafter green concrete) which uses steel slag as a cement alternative.
Life cycle assessment (LCA) is an established decision-making supporting tool that accounts for the environmental impact of a product or a service, and social life cycle assessment (SLCA) looks into the social dimension of those. The study took the two approaches to assess the sustainability hotspots and the impacts of the green concrete to understand how the sustainability performance could be improved. To understand the factors affecting the sustainability performance, the differences in product design, regional representation, and the corporate efforts in sustainability performance were considered.
2. Methodology
2.1. Goal and Scope of the Study
This study conducted SLCA and environmental LCA of different design options of steel slag mixed concrete. Both assessments were conducted by taking the cradle-to-factory-gate system boundary (module A1–A3 according to the EN 15804 [19]). The assessment was conducted to understand the social and environmental hotspots of 1 kg of steel slag mixed concrete. The social and environmental impacts were also assessed, where the values were scaled to 100% by the largest value. This scaling was made with the intention to understand the relationship between the social and environmental performance of the different design options of steel slag mixed concrete.
2.2. Social Life Cycle Assessment
Social LCA is relatively a newer tool related to life cycle thinking (LCT) [20], where various efforts are being made such as the development of social impact assessment methods [21,22]. Product Social Impact Life Cycle Assessment database [23] (hereafter PSILCA) is one of the few databases available that compiles the life cycle inventory (LCI) for social issues which is defined in the guideline from UNEP-SETAC life cycle initiative [24]. The PSILCA database is created based on a multi-regional input-output database and the inventory in PSILCA is expressed as money flows. The PSILCA database uses worker hours as the activity variables [25], which is a necessary term that “reflect the share of a given activity associated with each unit process” [24]. The use of this activity variable can thus allow associating social issues of concern to the hours invested in producing the amount defined as a functional unit of the assessed product.
For each of the 42 indicators in PSILCA, a risk assessment is conducted to identify the social hotspots. The risk assessment is made by classifying each social indicator into six levels, which the criteria for the risk levels are assigned individually. The details of the risk criteria for the assessed indicators are given in Table S1 in the Supplementary materials. For each risk level, weighting factors are given by PSILCA as shown in Table 1. The assessed risk levels for each indicator are multiplied by worker hours to calculate the risk hours which is used to identify the hotspots as well as for assessing the potential impact. This risk-assessed indicator can be considered as type I approach defined in SLCA guidelines [24]. The type I approach is “often summed up as performance reference point scale analysis” [26] where former social LCA studies such as [27,28,29] took this approach. Although the type I methods are not quantifying the impacts based on causal links, the method allows assessing the impact that can potentially take place along the product life cycle based on the required worker hours, the activity variables, to produce the assessed product. As part of the assessment, the allocation can be made. In this study, however, no allocation was made. For the details of worker hours, and the allocation, please refer to [23].
In addition, the database contains information about the data quality of each input data. The data quality assessment was made through a pedigree matrix, based on [30] for LCA, and adapted to the social version. The data quality is assessed based on five aspects, which are the reliability of the source, completeness conformance, temporal conformance, geographical conformance, and further technical conformance. Each aspect has its own criteria for the quality level, which is scored in 1 (the best) to 5 (the worst), for the quality assessment. In the study, social indicators with low quality, containing any aspect with the worst quality level, were excluded from the assessment. Any indicators that may overlap with environmental indicators were also excluded to avoid the redundancy. In Table S2 in the Supplementary materials, the results of the data quality assessment are presented.
In the study, six datasets were created to represent the green concrete using steel slag for the respective countries. Those six countries were Switzerland (CH), Germany (DE), Japan (JP), Sweden (SE), Thailand (TH) and the United States of America (US). These countries were chosen to examine the regional influence as well as the availability of environmental LCI datasets. Since the inventory was created based on the monetary unit, the cost data from a case study of a Swedish residential house constructed in 2013 [31] was used to create the green concrete LCI dataset. The cost of the steel slag was estimated as same as the fly ash, which was used in Andersson’s [31] study. This assumption was made due to the availability of the market data, where Andersson’s [31] study represented the market price in 2013. The study adopted this market data over hypothetical prices. In Table 2, the inventory used in PSILCA to create the green concrete dataset is shown. Three product designs regarding the slag contents were also introduced to investigate its effect on the social performance of green concrete: 33%, 70%, and 85%. The study assumed that the price of slag and other materials used in the green concrete are identical regardless of the region. In Table 3, the defined social inventory of the green concrete is shown. The price ratio between the steel slag and cement and aggregates are shown in a reference unit of 1 U.S. dollar (USD) of the green concrete. As the price of slag and other materials are assumed to be identical for all the investigated regions, the hotspots and the influence of regions, product designs and corporate efforts on the impact of 1kg of green concrete can be represented by assessing 1 USD of green concrete. The cut-off criteria were applied when creating the product system of all datasets, which was set at 1E-5.
2.3. Life Cycle Assessment
For the environmental LCA, ecoinvent v3.3 [32] was used as the source of LCI datasets. In the database, the technical representation of the datasets was better compared to that of the PSILCA, which has better geographical representation. Since the majority of the environmental impact of a concrete is due to the use of cement [15], the investigation on the environmental hotspots was made through the different mixes between the cement and the steel slag. The investigated slag mixes were in the following three segments: 25–70%; 66–80%; and 70–100%. The available geographic representation of the LCI of the cement mixed with steel slag was Switzerland (CH), Europe without Switzerland (EU), the United States of America (US), and rest of the world (RoW). The study took the recycled content approach as the allocation method.
The life cycle impact assessment (LCIA) was made using CML-IA baseline [33] as the impact assessment methods in SimaPro v8.3 [34]. The assessed impact categories from CML-IA baseline were the following: Abiotic resource depletion for non-fossil fuels; Abiotic resource depletion (ADP) for fossil fuels; global warming potential (GWP); ozone depletion potential (ODP); human toxicity; freshwater toxicity; marine water toxicity; terrestrial toxicity; photochemical ozone formation (PO); acidification and eutrophication.
2.4. Analysis of Hotspots
To analyze the hotspots to support the decision making of the manufacturers, three groups were introduced: clinker related inventories; slag related inventories; and energy-related inventories. These groups were applied to assess both the social and environmental hotspots.
2.5. Company Classes
In order to investigate the potential relevance of the variation among the manufacturers regarding the efforts made for the sustainability performance, four classes (Class A to D) were introduced. Based on the sustainability performance of the product that the companies are producing, the companies were classified into the four given classes. As the basis for the classification, the results from Monte-Carlo analysis of each steel slag mixed concrete dataset was used to represent the class. As the top-tier performing companies as Class A, the results representing the 2.5 percentile of the Monte-Carlo analysis was used. The Class B companies, which represents the majority of the companies, the median from the analysis was used to represent the class. For Class C, the mean value was used as the average companies. To represent the Class D, the laggards, the result of 97.5 percentile was used.
2.6. Comparison of the Different Aspects
For the quantitative assessment of the social and environmental impacts of the investigated products, all the indicators were normalized with the worst performing dataset within the respective indicators. The normalization was made to observe the influence of the employed aspects of the social and environmental performance.
3. Result
3.1. Selection of Social Indicators
Among the 42 assessed indicators, the result from the data quality assessment showed the reliable social indicators of the six investigated datasets as the followings: Public spending on education (Education), Fair salary, Goods produced by the forced labor, Health expenditure, Trafficking in persons (Trafficking), Weekly hours of work per employee (Worker hours), Respect of indigenous rights (Indigenous rights), and Public sector corruption (Corruption). In Table 4, the relevant stakeholder according to the categorization made in PSILCA, inspired by SLCA Guidelines [24], for each indicator is given. This study covered four out of five stakeholders listed in the SLCA Guidelines.
3.2. Social Hotspots
In Table 5, the summary of the identified social hotspots of the datasets is shown. In the table, the process with the highest risk is shown as the hotspots for each indicator. The hotspots identified abroad are shown in the italic font in the table.
When assessing the related inventory groups, as described in Section 2.3, all of the hotspots of the assessed countries were classified as slag related inventories, except for the “Goods produced by forced labour” in Thai dataset. Thus, the identified hotspots will remain related to steel slag even when increasing the share of the slags in the binder from 33% beyond. Another common aspect among the identified hotspots was seen in the indicator “Goods produced by forced labour” where products from China were the hotspot for all the countries. The fact indicates the origin of the steel slag has an important role to play regarding the indicator.
The hotspots for other indicators observed some variety depending on the regions. For instance, the hotspots for the case in Thailand and in the U.S. were mostly identified in the domestic steel industry, while the hotspots of the other four countries were observed abroad, mostly in China or India. The fact suggests that the universal approach to treating the social hotspots does not exist. Thus, there is a need to conduct a region-specific investigation to elaborate the most appropriate measure to address the social hotspots.
3.3. Characteristics of the Social Impacts
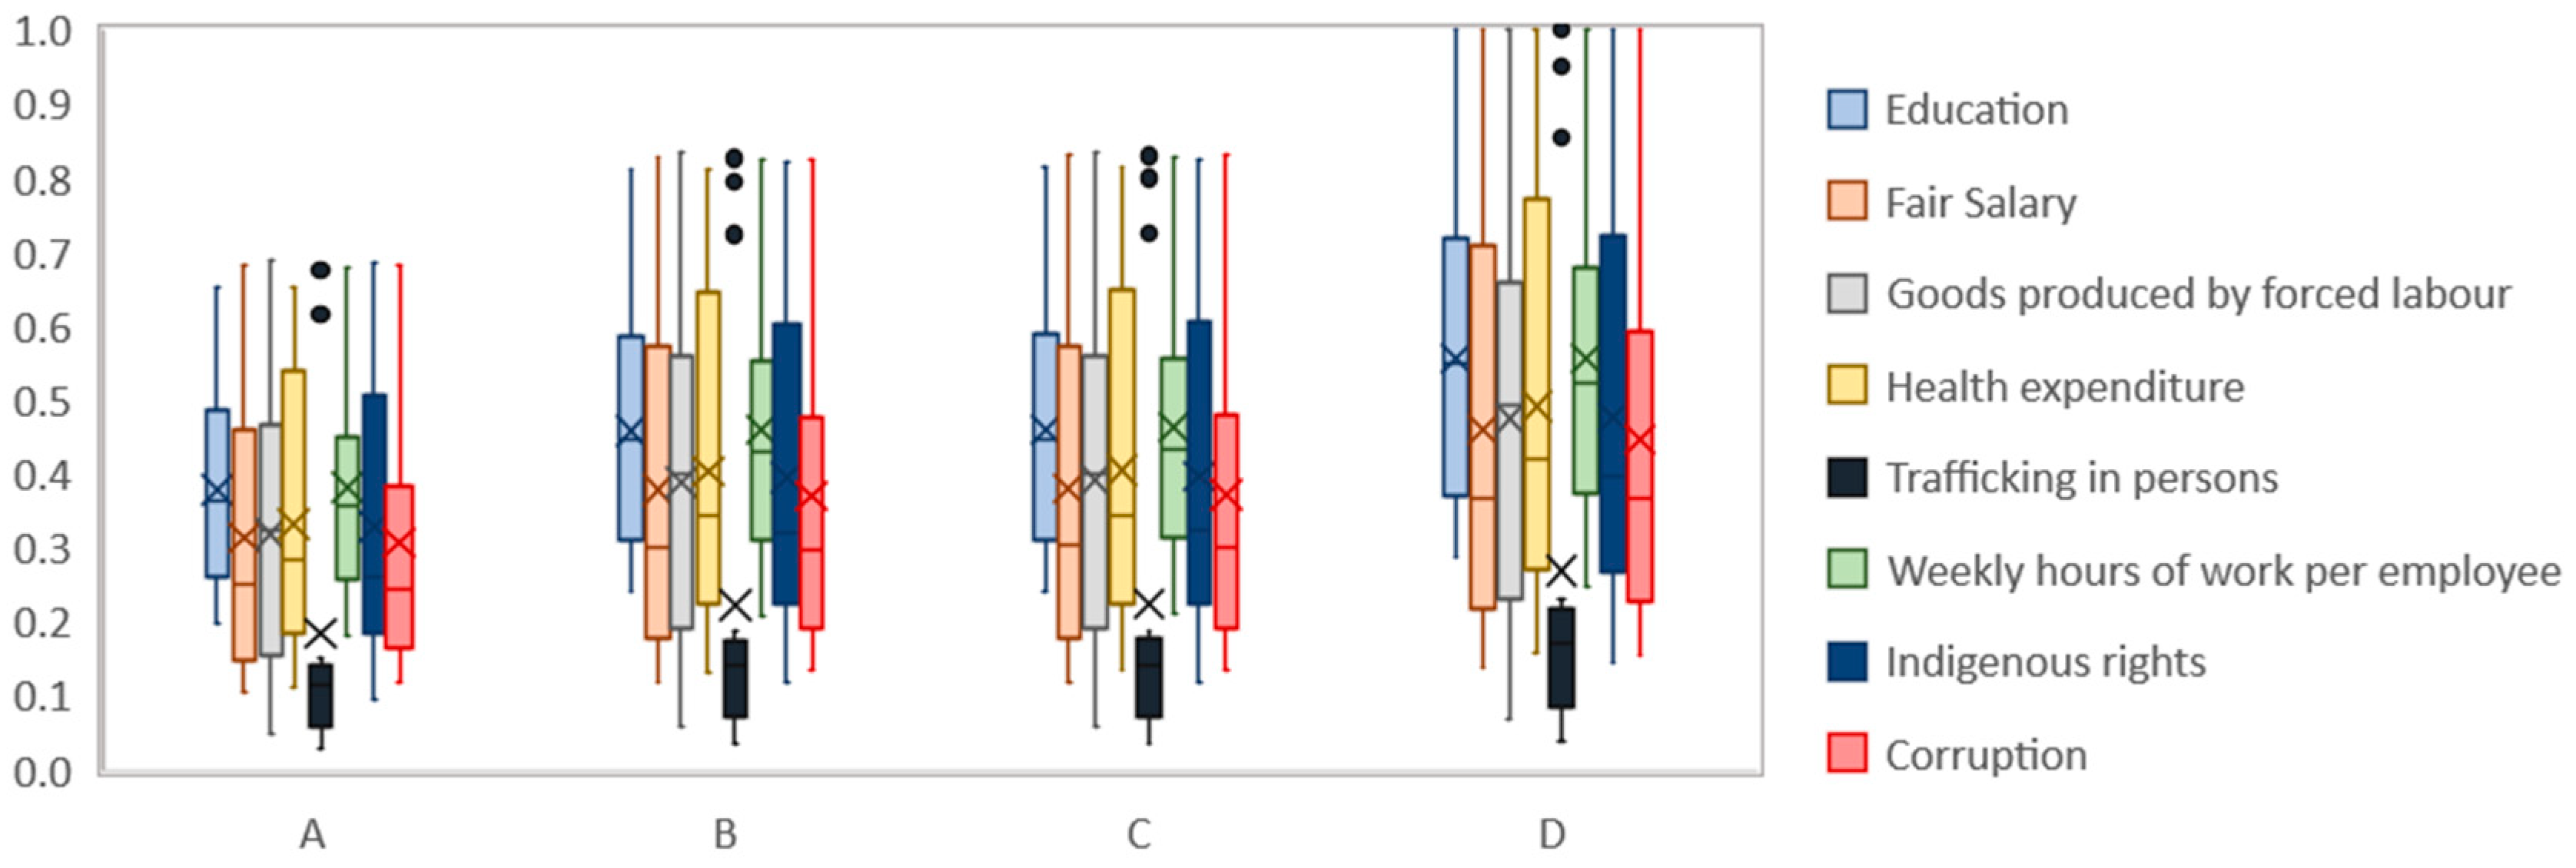
In Figure 1, the distribution of the results of the normalized social impact in risk hours by company classes is shown. The normalization was made by taking the maximum value of the respective categories as the reference.
The result showed that the company classes have an influence on the social performance of the investigated product datasets when focusing on the length of whiskers in the figure: the length of whiskers are longer for class D companies than the A. However, although the whiskers were becoming longer for the worse class, the significance of the company classes on the social impact of the green concrete may be limited since most part of each box plots overlaps with each other for all the classes. What this feature implies is that for the steel slag mixed concrete the difference in social performance of the eight investigated social issues between the company class is less dominant than the other factors, such as regions or product designs, which are represented in the whiskers of the box plot. Thus, the influence of other aspects may be more significant over the company class regarding the social performance of the green concrete.
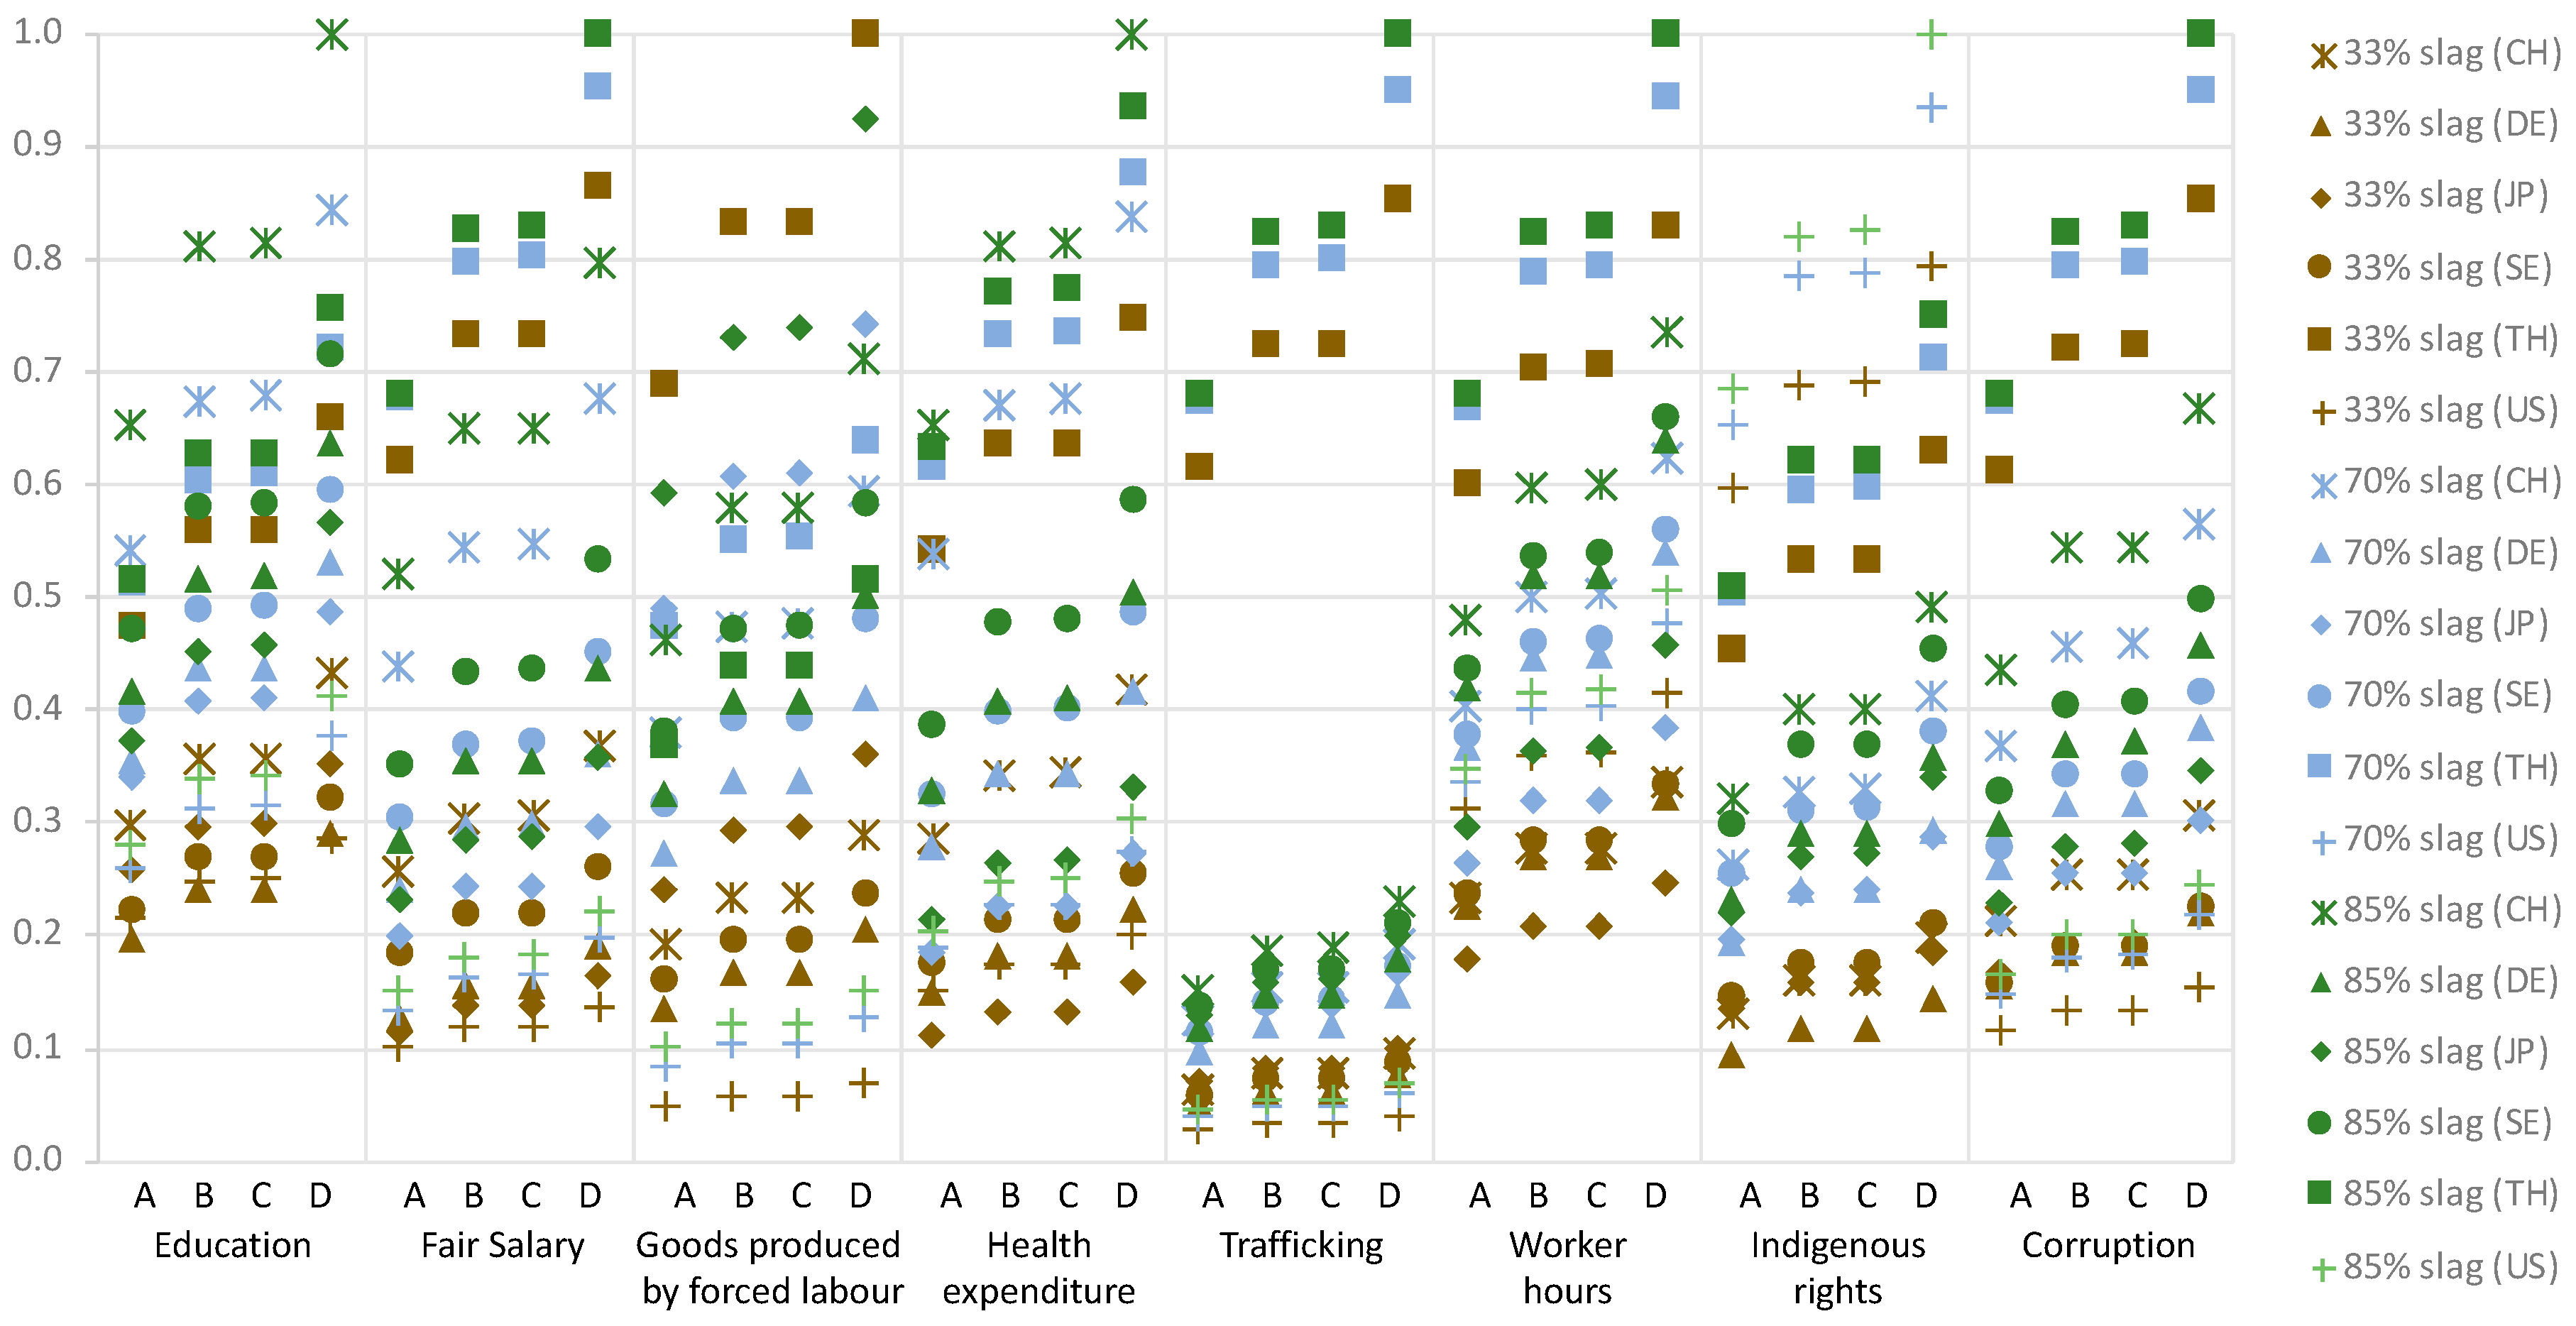
In order to investigate the influence of other aspects on the social sustainability performance of the green concrete, the results of the normalized social impact assessments for each investigated dataset is shown in Figure 2.
As an overall characteristic regarding the geographic representation, Thai and Swiss products performed worse for most of the considered indicators. Furthermore, the influence of region was clearly seen on fair salary, trafficking, worker hours, indigenous rights and corruption, where the Thai datasets were the worst performing. Regarding the best performer, the products from the US was the best in fair salary, goods produced by forced labour, and trafficking. Concerning the influence of product design, the social performance was worse with the higher steel slag content regardless of the regions, all but the goods produced by the forced labour of the Thai dataset.
3.4. Environmental Hotspots
The identified hotspots from the conducted LCIA, given in Table 6, shows that the hotspots of GWP, ODP, and acidification have the same cause indicator groups for each of the slag content independent from the geographical representation. For ODP, the hotspots are related to the energy source of heat and/or electricity being used, which could be regional relevant conditions. For GWP and acidification, either clinker or steel slag was the hotspot depending on the ratio of the mixed slag.
When analyzing the hotspots in the three groups of inventories as described in Section 2.3, the relevant groups differed depending on the ratio of the slag and the geographic representation. For the Swiss green concrete, clinker related inventories were the hotspots regardless of the slag mixture ratio for freshwater toxicity, marine water toxicity, and eutrophication. Thus, complete replacement of the clinker could be an ideal strategy to reduce the water-related impact categories in case of Switzerland. For GWP, abiotic depletion of fossil fuels, human toxicity, and acidification, grounded slag was the hotspots when the mixture ratio of the slag was over 80%.
The result of the hotspot analysis of the EU dataset showed that energy-related inventories were the hotspots of ODP, human toxicity, freshwater toxicity, marine water toxicity and eutrophication, regardless of the slag mixture. Meanwhile, clinker related inventories were the hotspots of all slag mixture datasets for abiotic depletion of fossil fuels and terrestrial toxicity, showing the difference from the Swiss case.
When looking at the RoW dataset, clinker were the hotspots for abiotic depletion of fossil fuels and terrestrial toxicity for all slag mixture, while energy related inventory was the hotspot for ODP. Steel slag related inventories showed up as hotspots for human toxicity and PO when the slag mixture was beyond 65% and became also the hotspots for GWP, PO, and acidification when the mixture was over 80%.
In the case of the US, two datasets were investigated due to the difference in the slag mixture classification available in the database. The hotspots of GWP, PO, and acidification differed between the two slag mixture ratio, where clinker were the hotspots for the lower content while the slag was for the higher one. Energy related inventories were the hotspots of ODP, human toxicity, freshwater toxicity, marine water toxicity and eutrophication regardless of the mixture.
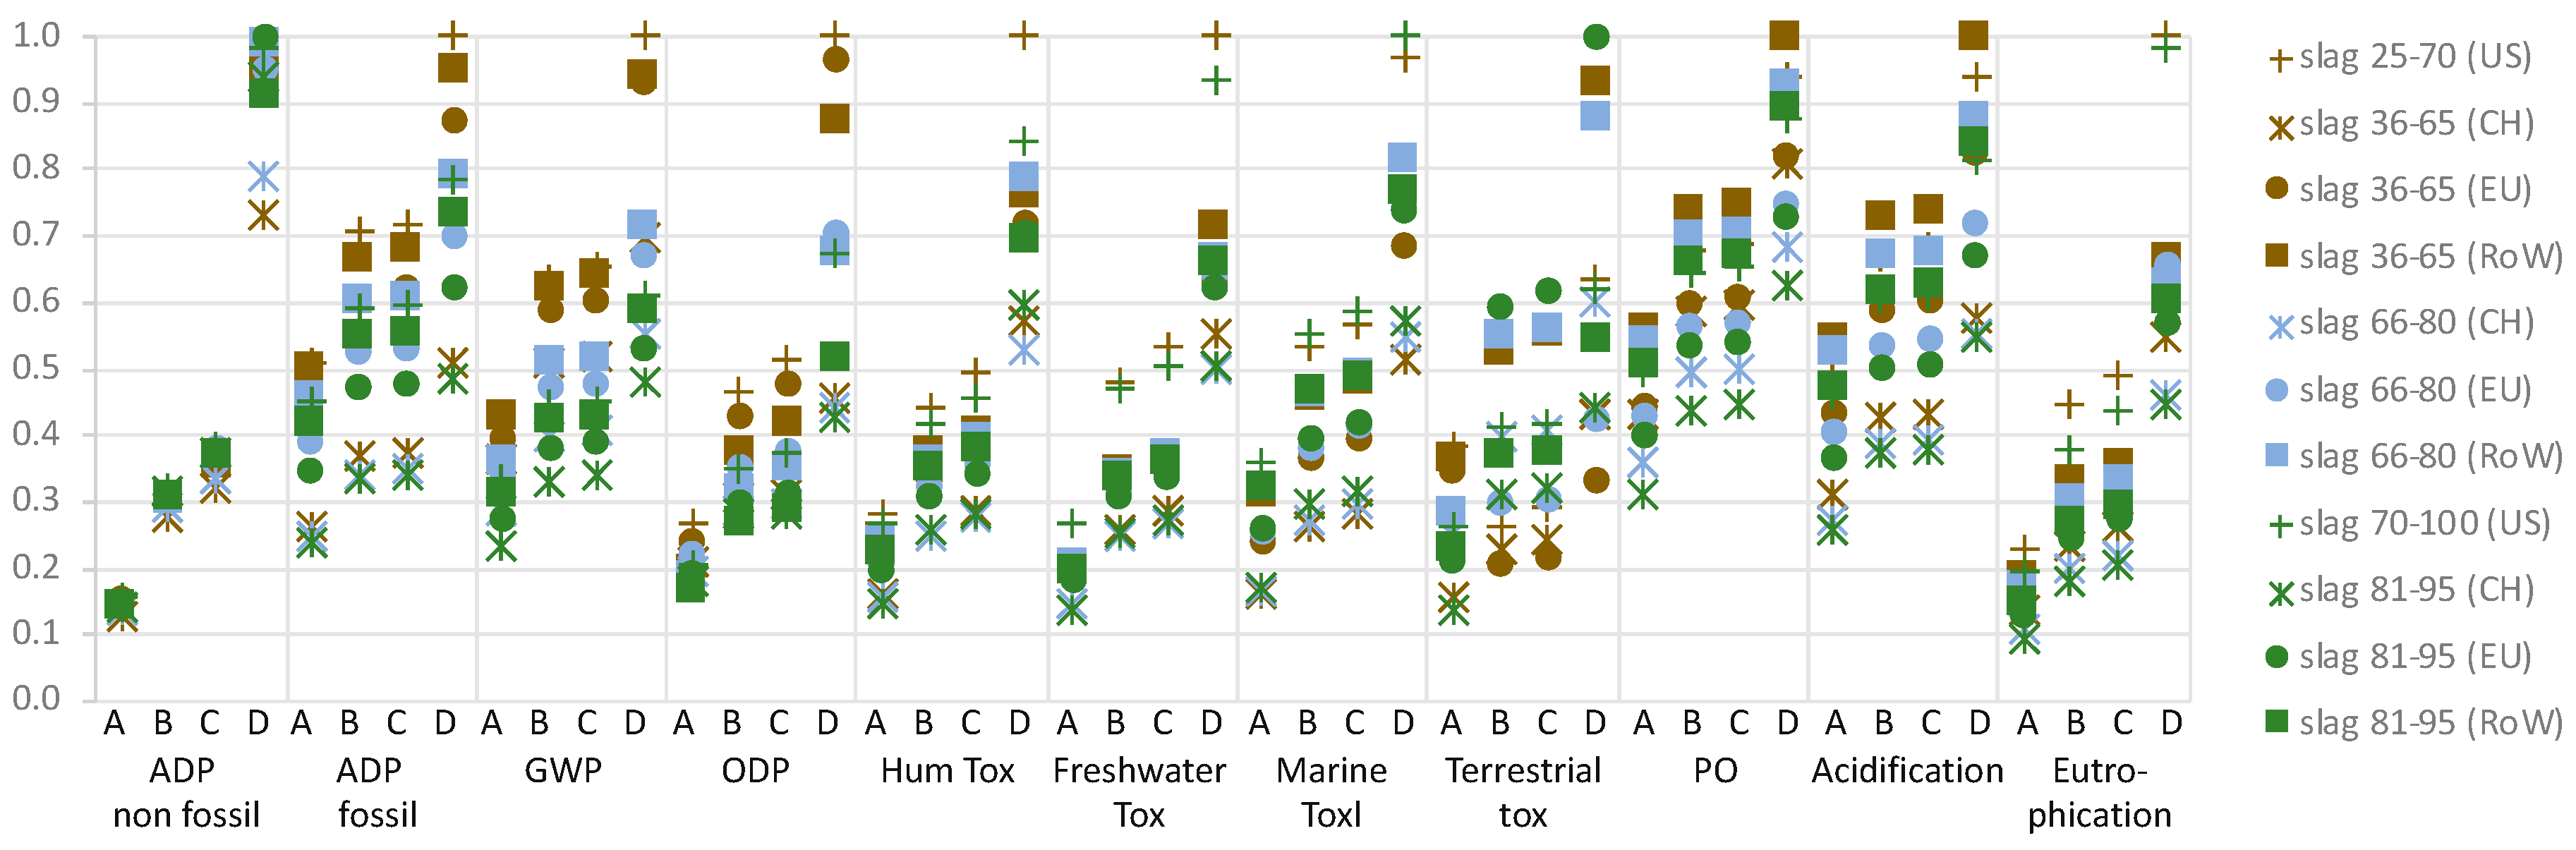
3.5. Characteristics of the Environmental Impacts
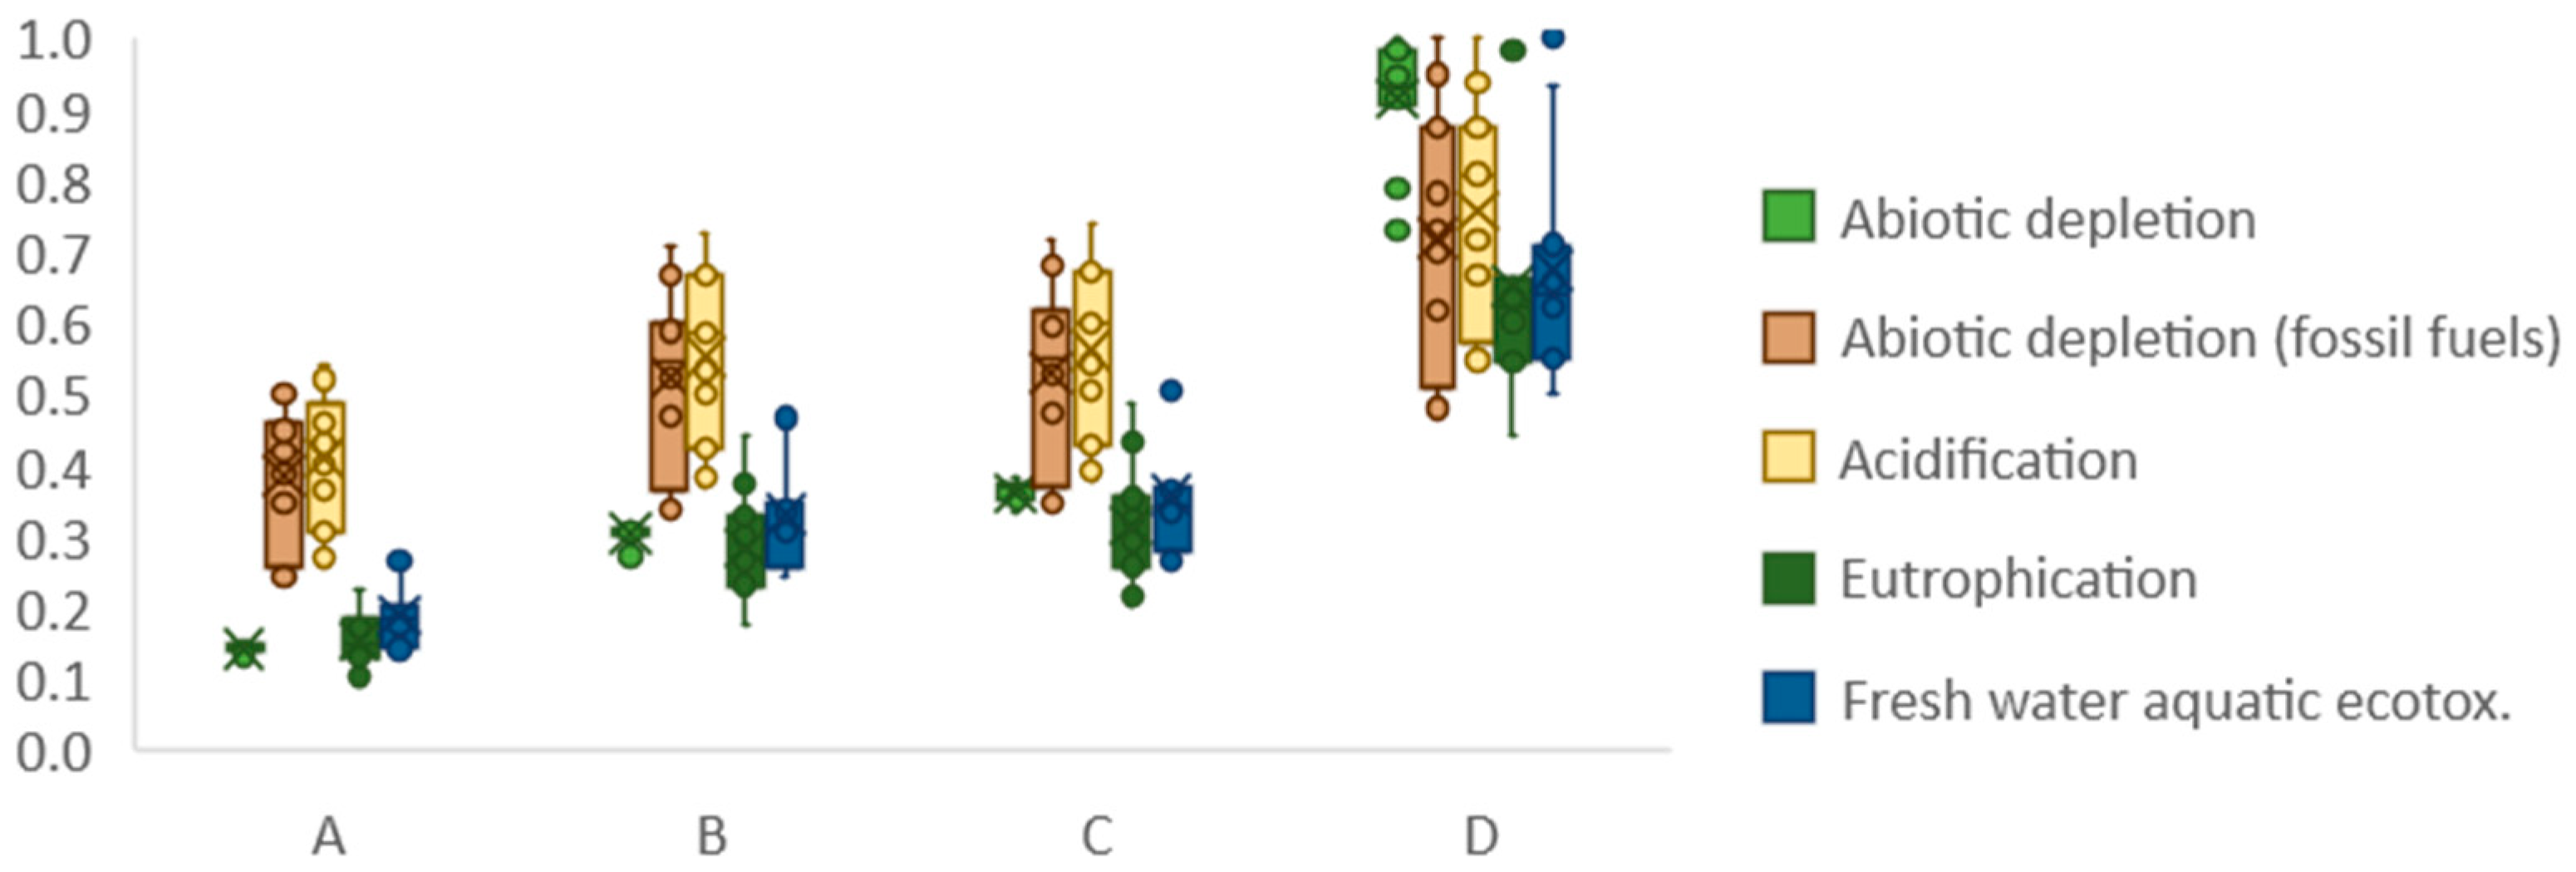
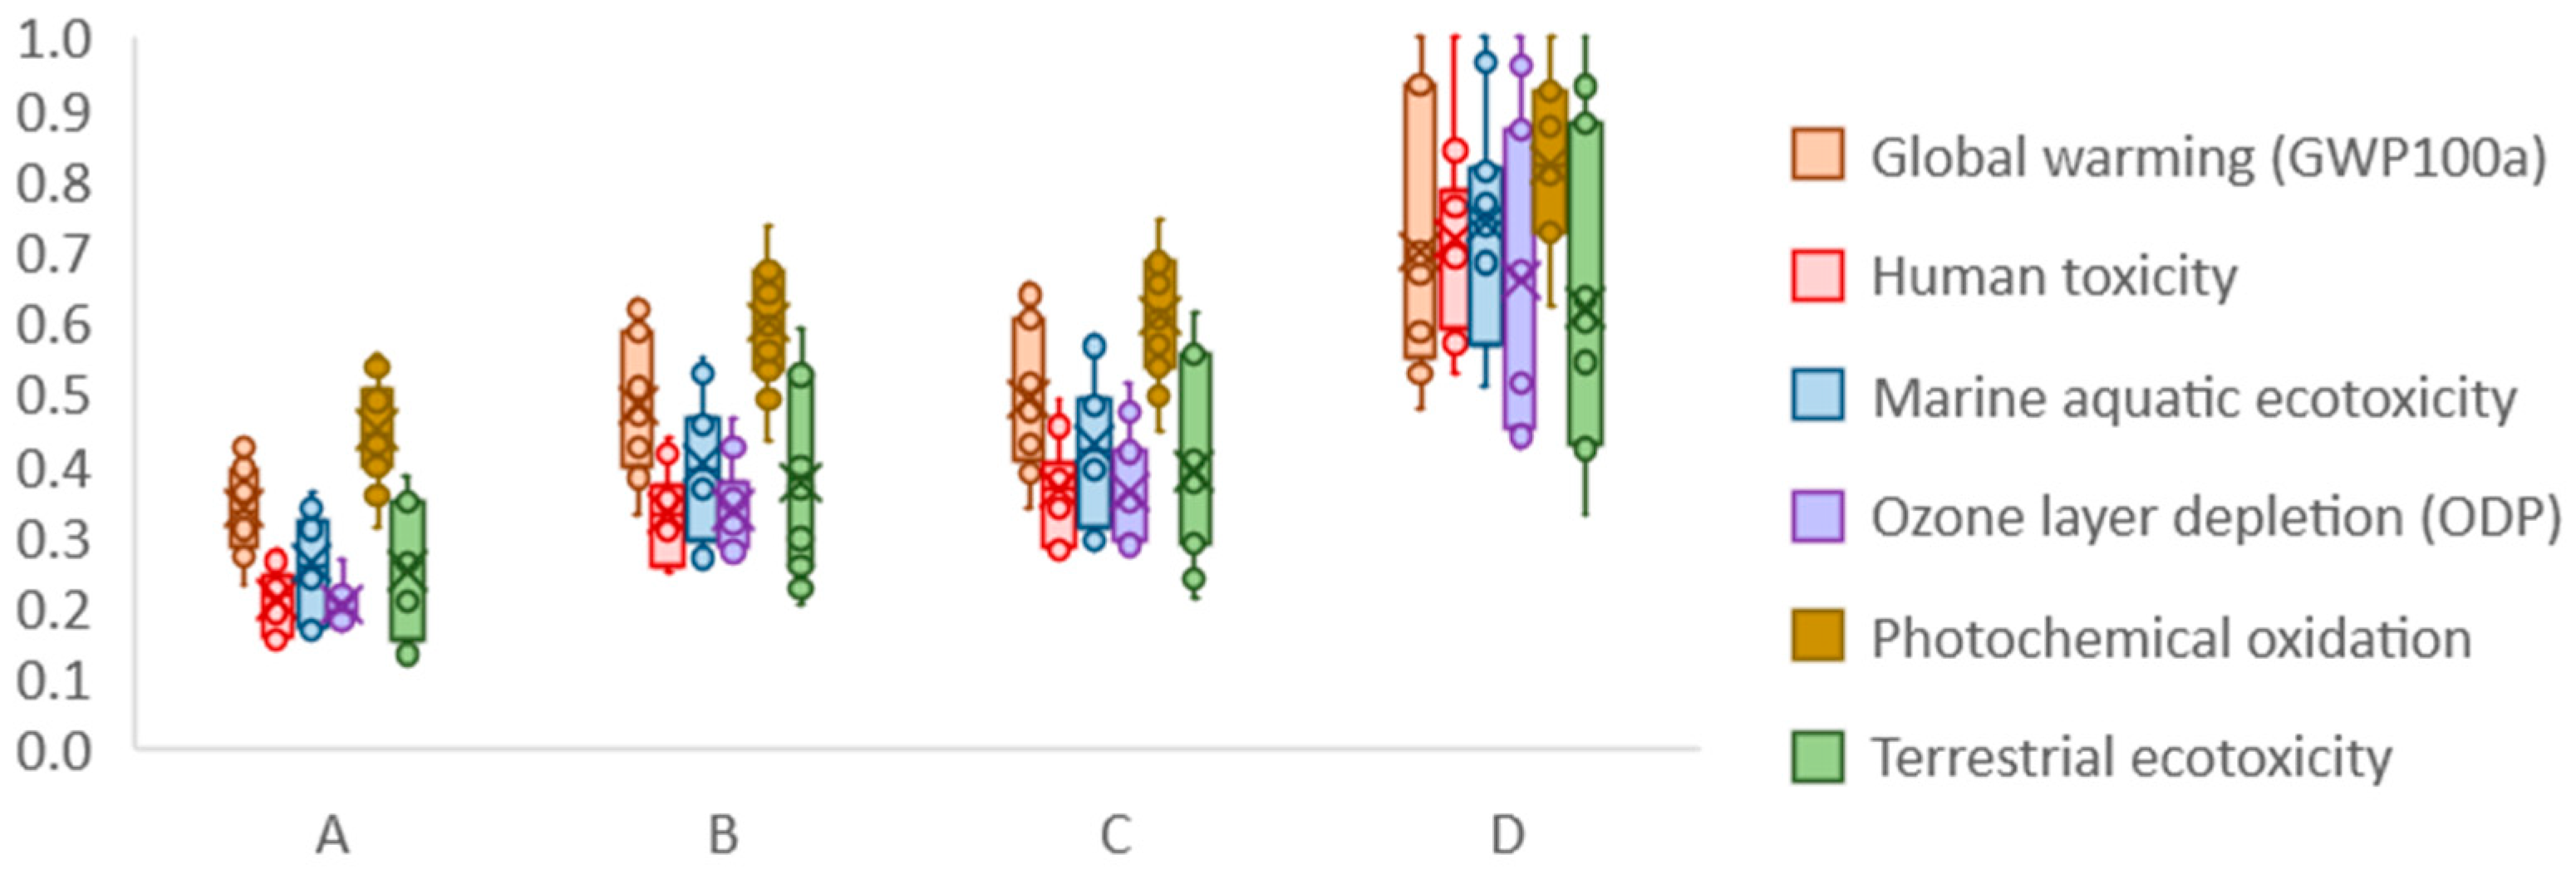
For examining the influence of the company classes on the environmental performance of the green concrete, Figure 3 and Figure 4 shows the distribution of the result of the normalized impact by the classes.
When looking at the difference occurring between the company classes, the impact of abiotic depletion caused by class D companies was substantially worse than the rest of the classes. In addition, the distribution within each class was narrow compared to other impact categories. The fact implies the importance of the company class over product details and regions regarding the impacts of abiotic depletion for non-fossil resources for green concrete.
For other impact categories, the difference between the company classes was not as significant compared to that of abiotic depletion. Moreover, the range of the box plots was rather wide which implied the importance of the product design and the regions concerning the performance of the respective indicators.
In Figure 5, the results of the LCIA of each dataset that investigated the relevance of the product design and the region are shown.
When looking into details of each company class, the difference of products from companies in class A was rather small while the ones from class D had a large variation for most of the indicators. The fact also suggests the importance of other factors, the product design, and the geographical representation, for the environmental performance of green concrete in class D.
Regarding the influence of the geographic representation, general characteristics were observed, such as Swiss data being the best performing in most of the indicators, where US or Thai data were the worst.
The influence of the product design was seen which the concrete with higher slag content was better performing for the majority of the indicators and regions. The exceptions were RoW datasets for ADP non-fossil, Human toxicity, freshwater toxicity, and marine water toxicity.
4. Discussion
4.1. Treatment of the Social Hotspots
When investigating the social indicators by its related stakeholders, the society related indicators would be difficult to improve through the effort of the manufacturers. For instance, public expenditure on education would be a topic that manufacturers may not have a huge influence on. Given the limitation to treat the hotspots related to society as manufacturers, adapting the supply chain is one approach to take which can be addressed by the manufacturers for improving the social issues of concern. While improving the social performance of the public policy related issues may be beyond the manufacturers’ capability, constructing supply chain by taking these social performances into account can be a measure to take. The effectiveness of managing the supply chain based on the social performance can be seen from the results given in Figure 2 and Table 5, where the regions played an important role for determining most of the social performance of concern. Thus, consideration of the social issues for supply chain management can allow improving such social indicators while the effectiveness from other measures can be limited for improving them. The supply chain management could be an effective measure for improving not just the public policy related social performance but also for the worker related indicators, based on the results in Figure 2 and Table 5, especially concerning the results on the forced labor related indicators: goods produced by forced labour; and trafficking in persons.
On the other hand, working hours and salary level could mostly be handled by the manufacturer’s effort, since most of the hotspots were identified within the domestic industry, based on the results shown in Table 5. The hotspots in these indicators could be one of the low-hanging-fruits to improve the social sustainability performance.
4.2. Treatment of the Environmental Hotspots
For environmental issues, the influence of the region on the identified hotspots was seen through the consumed energy. For instance, the hotspots of ODP in all slag mixture ratio was identified as energy related inventories with diversity in its source. The number of hotspots related to energy increased with the higher slag mixture, although showing certain variety regarding the concerned indicators depending on the region. Since the investigated countries are located on various continents around the globe, the energy system could be considered as a universal key performance indicator (KPI) for improving the environmental performance of the steel slag mixed cement, especially the higher the slag content is. The energy mix of the system is typically different depending on the region, regarding its energy sources and the mix. As was indicated in [35], this regional condition could be a useful proxy information to be considered during the early product development phase when considering the location for manufacturing or the origin of the material.
Thus, theoretically speaking, procuring the steel slag mixed cement from regions with energy system with better sustainability performance could improve the environmental performance of the green concrete. In fact, the import of the steel slag is already taking place in the UK, implying the cost-effectiveness of transporting long distance [36]. This implies the potential of sourcing the steel slag mixed cement from a location with clean energy system and improving the worker related social indicators may allow improving not only one but the three pillars of sustainability performance: economic; social; and environmental.
4.3. Comparison of the Treatment of the Social and Environmental Hotspots
When analyzing the characteristics of the social and environmental hotspots, several issues from both pillars could be solved by careful determination of the supply chain of the consumed material, regardless of the geographical representation of the green concrete. The fact suggests the supply chain management could be an effective measure to improve the sustainability performance of green concrete with steel slag in all regions.
The influence of the regional representativeness was seen on the identified hotspots from both pillars. For instance, the social hotspots of trafficking varied from the identified industries to the regions. The cause of environmental hotspots of the human toxicity also changed depending on the geographic representation when the mixture of the steel slag was 66% to 80%. Thus, taking the regional aspects into consideration revealed important in order not to mistreat some of the sustainability hotspots.
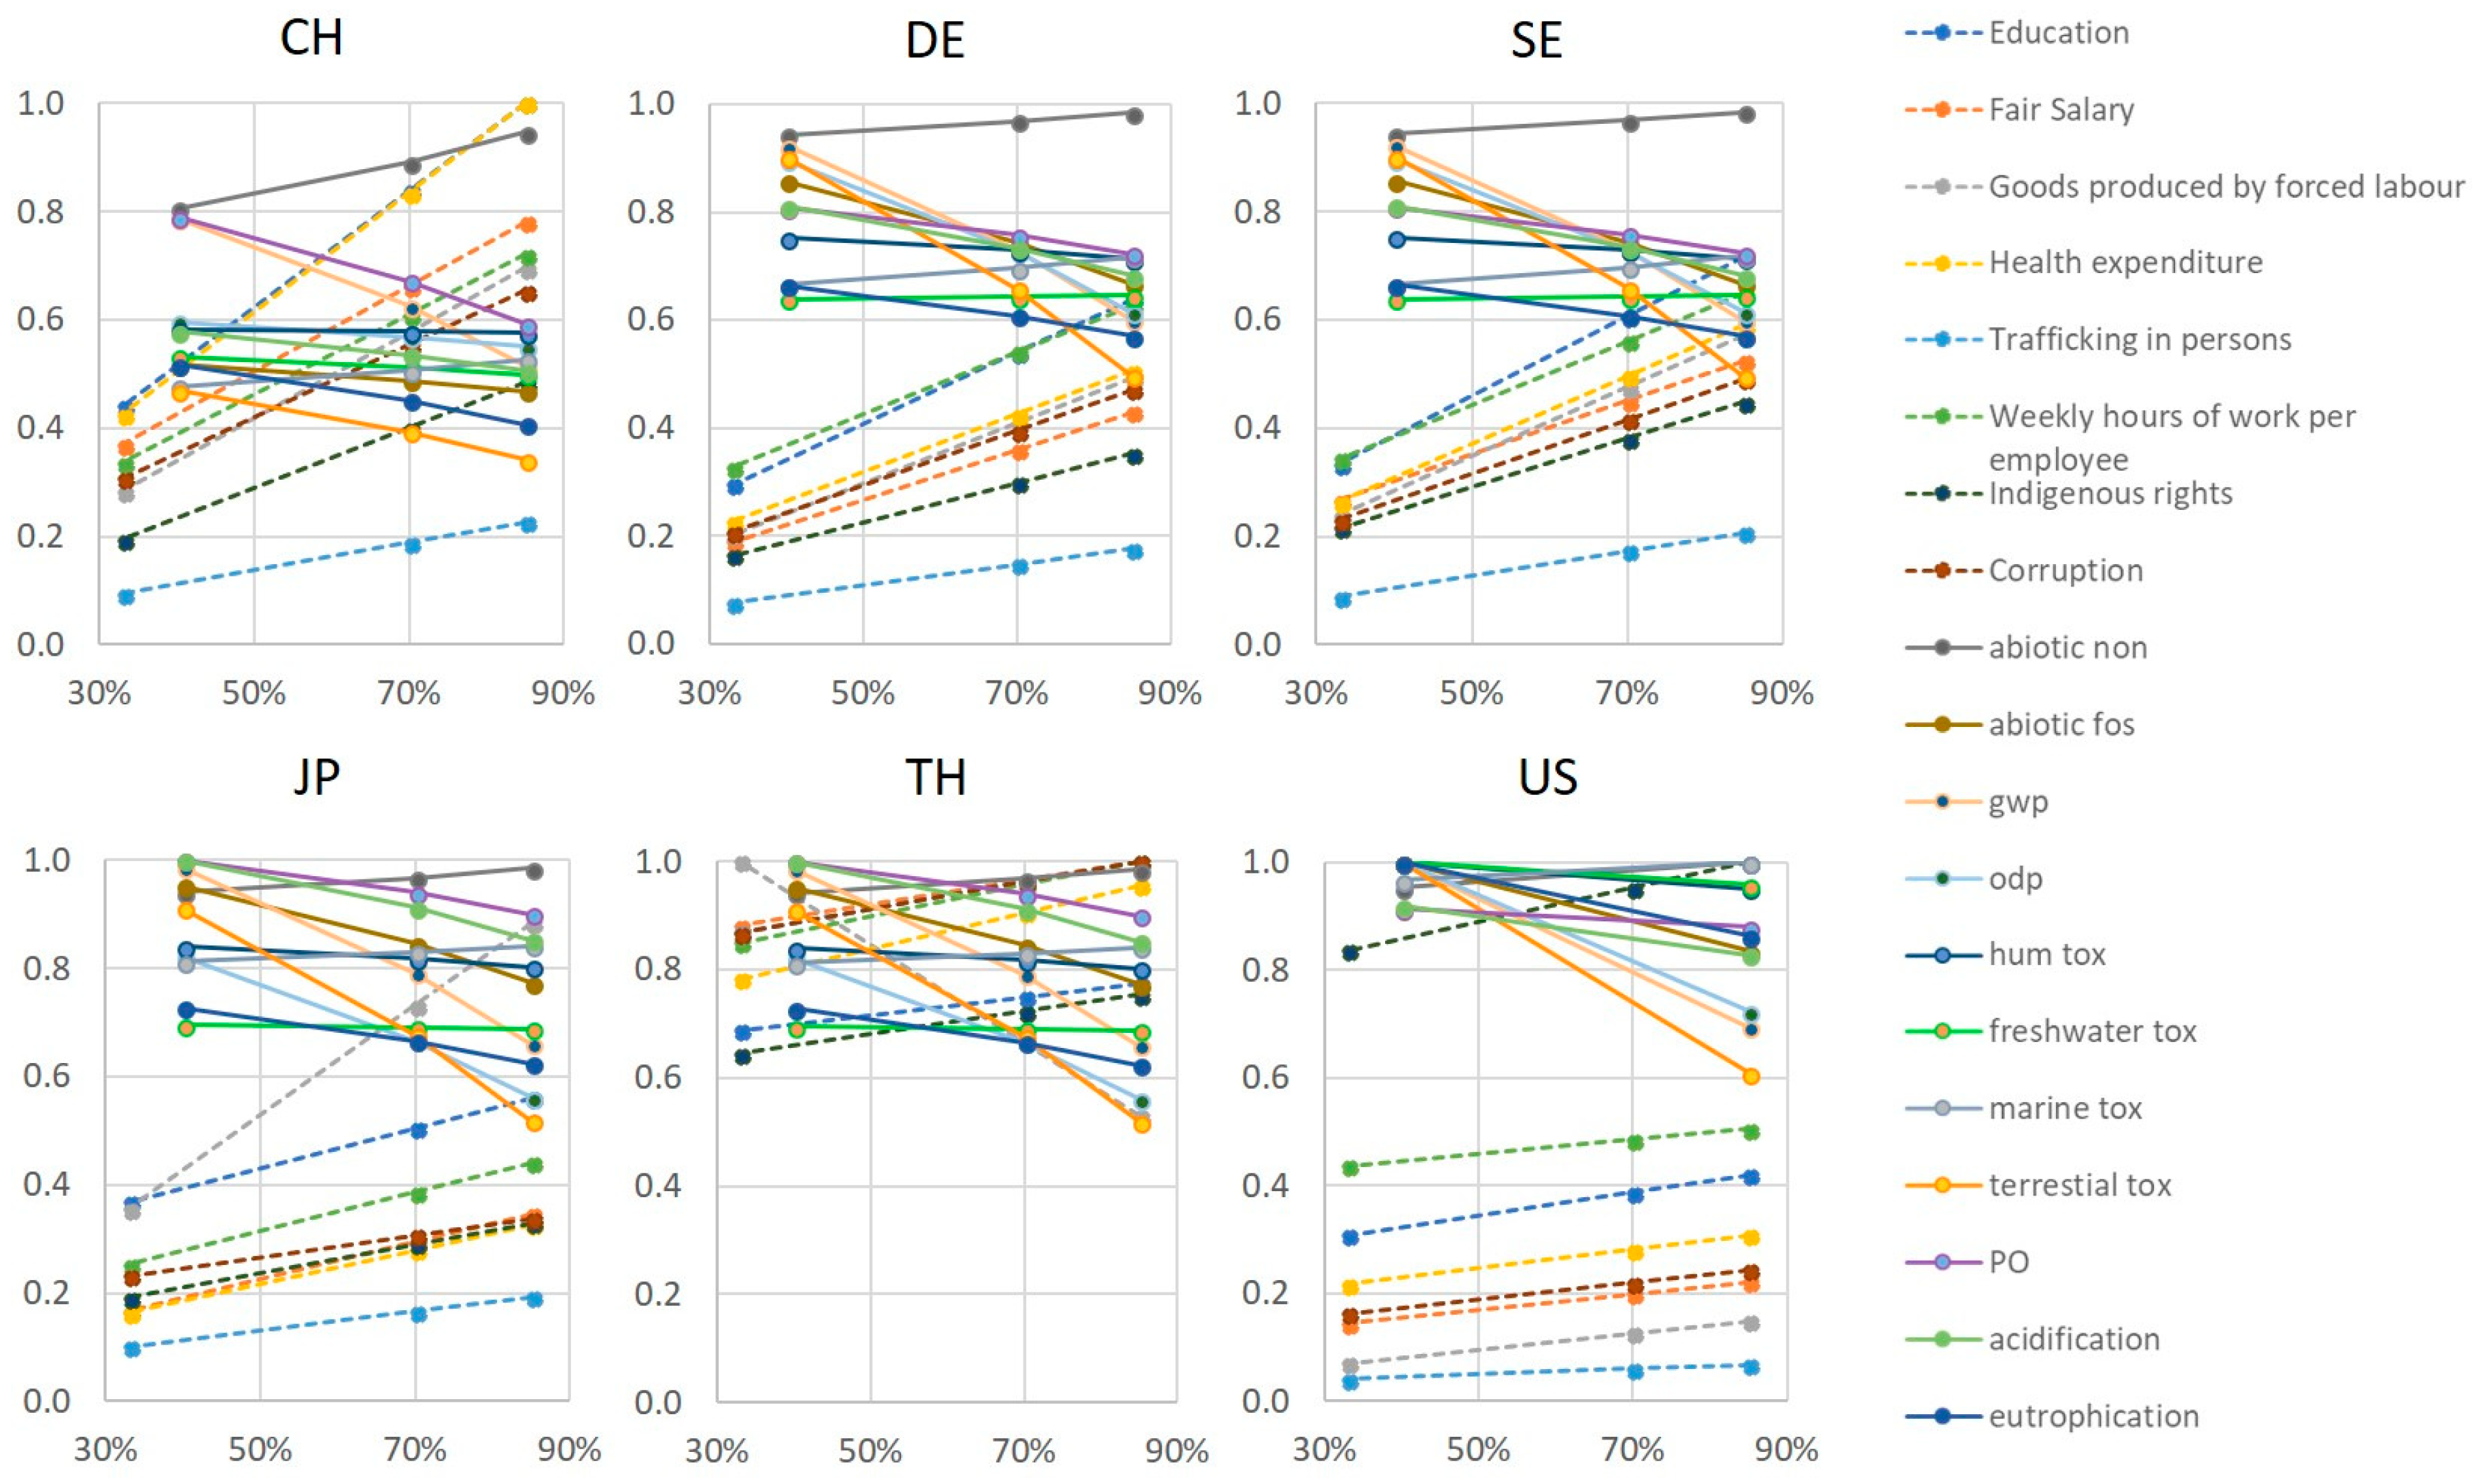
4.4. The Trade-Off between Social and Environmental Performance
From the impact assessments, the tendency of the trade-off between the social and environmental performance from the change of the product design was observed. In Figure 6, the illustration of the social and environmental performance of the green concrete with different steel slag content in the six investigated countries are shown. In the figure, solid lines represent the environmental impacts and the dotted lines represent the social impacts of the steel slag mixed concrete.
As can be seen from the figure, the social impact increases with the increased slag content while the environmental impact decreases for the majority of indicators. This trade-off between social and environmental performance with the increased slag content shows the limited effectiveness of pursuing the sustainable design of products, one of the solutions for improving the environmental performance, to improve the social sustainability performance of green concretes. The findings from the hotspot analysis support the trade-off since most the social hotspots were steel slag related. As was also seen from the hotspot analysis, however, most of the investigated social indicators were capable to improve via supply chain management. Thus, it is vital to take social aspects into consideration when constructing the supply chain for improving the sustainability performance of green concrete, not just by its product designs.
4.5. Limitations
The difference in the level of details between the social and environmental LCI datasets is a limitation to be considered in this study. The representativeness of the data is a challenging issue for the social LCI in PSILCA due to the availability of the data. For instance, most of the construction-related product inventories are represented as “Construction” as a whole. This means the social hotspots of the concrete products and the thermal insulation materials would appear to be the same, due to the source of inventory data being the input-output database. Therefore, the identified hotspots would require a further scrutiny for the better representativeness if the availability of the data allows.
While the social LCI datasets have a higher level of details regarding the geographic representation thanks to its basis being the input-output database, the environmental LCI datasets in ecoinvent have better representation on the technical specifics. However, since the influence of the energy system were identified as hotspots for a few indicators, higher resolution of the geographical representation of the steel slag mixed cement may allow improved accuracy of the environmental impact assessment and hotspot analysis.
Limitations concerning the methodological aspects of the employed social impact assessment based on the risk hours could be present. Since the characterization step of type I SLCA does not reflect the causal link between the product related impact and well-being of human [26], the results entail uncertainty regarding the representativeness of the impact assessed. Nonetheless, what the risk hours imply is the potential risk along the life cycle of the investigated product where social impacts most likely take place. Thus, regardless of the precision of the magnitude of social impacts, the observed relationship between the environmental and social impact of the slag mixed concrete for each country would not change, unless the assigned risk criteria for the assessed indicators change completely to contrary: less public spending per GDP of a country as lower risk, or less living wage per month as lower risk, for instance. Thus, the finding of the paper regarding the product design’s limits for improving the sustainability performance of the steel slag mixed concrete should be valid regardless of the precision of the quantified social impact.
5. Conclusions
This study investigated the social and environmental hotspots and impacts of green concrete in six countries.
- Regarding the of social hotspots, the assessment showed that the treatment of the employment related indicators may be one of the low-hanging-fruits for improving the social sustainability performance of the material.
- The effectiveness of the supply chain management was seen for improving both the social and environmental via hotspot analysis.
- The limits of product design in improving the sustainability performance of green concrete were highlighted through the observed trade-off between the social and environmental performance.
- Although the one-size-fits-for-all solution may not apply for all the investigated sustainability indicators, the procurement of the steel slag and/or the slag mixed cement produced in countries with good employment condition and clean energy mix may improve ranges of the social and environmental performance of green concrete.
Supplementary Materials
The following are available online at https://www.mdpi.com/2071-1050/10/7/2309/s1, Table S1: Criteria for risk levels of each assessed social indicators defined in PSILCA, Table S2: Results of data uncertainty analysis for selecting social indicators for further assessments.
Author Contributions
The study was designed and the article was written by J.K. Y.O. contributed by supporting the construction of storyline and improvement on the consistency of the research. H.W. contributed by supervising the implemented method of the research.
Funding
This research was funded by EIT Climate KIC, Chalmers Area of Advance Building Futures and Chalmers Area of Advance Energy.
Conflicts of Interest
The authors declare no conflict of interest.
References
- European Commission. Strategy for the Sustainable Competitiveness of the Construction Sector and Its Enterprises; SWD(2012) 236 Final; European Commission: Brussels, Belgium, 2012. [Google Scholar]
- European Commission. Communication from the Commission to the European Parliament, the Council, the European Economic and Social Committee and the Committee of the Regions; Roadmap to a Resource Efficient Europe COM(2011)571; European Commission: Brussels, Belgium, 2011. [Google Scholar]
- Herczeg, M.; McKinnon, D.; Milios, L.; Bakas, I.; Klaassens, E.; Svatikova, K.; Widerberg, O. Resource Efficiency in the Building Sector; Ecofys, Copenhagen Resource Institute: Rotterdam, The Netherlands, 2014. [Google Scholar]
- IPCC. Climate Change 2014: Impacts, Adaptation, and Vulnerability. Part A: Global and Sectoral Aspects. Contribution of Working Group II to the Fifth Assessment Report of the Intergovernmental Panel on Climate Change; Field, C.B., Barros, V.R., Dokken, D.J., Mach, K.J., Mastrandrea, M.D., Bilir, T.E., Chatterjee, M., Ebi, K.L., Estrada, Y.O., Genova, R.C., et al., Eds.; Cambridge University Press: Cambridge, UK; New York, NY, USA, 2014. [Google Scholar]
- UNEP. Sustainable Building and Construction; Chadwick, M., Fussler, C., Htun, N., Khosla, A., Mansfield, W.H., III, de Lemos, H.M., Retzsch, W., de Rosen, L., Trindade, S.C., Eds.; UNEP: Paris, France, 2003. [Google Scholar]
- CEN CEN/TC 350—European Committee for Standardization—Technical Committee 350. Available online: http://portailgroupe.afnor.fr/public_espacenormalisation/CENTC350/index.html (accessed on 3 May 2018).
- European Commission. European Parliament and Council of the EU Regulation (EU) No. 305/2011 of the European Parliament and of the Council of 9 March 2011 laying down harmonised conditions for the marketing of construction products and repealing Council Directive 89/106/EEC Text with EEA relevance. Off. J. Eur. Union 2011, 305, 5–43. [Google Scholar]
- European Commission. European Parliament and Council of the EU Directive 2010/31/EU of the European Parliament and of the Council of 19 May 2010 on the energy performance of buildings (recast). Off. J. Eur. Union 2010, 31, 13–35. [Google Scholar] [CrossRef]
- Alikaj, A.; Nguyen, C.N.; Medina, E. Differentiating the impact of CSR strengths and concerns on firm performance: An investigation of MNEs and US domestic firms. J. Manag. Dev. 2017, 36, 401–409. [Google Scholar] [CrossRef]
- Waddock, S.A.; Graves, S.B. The Corporate Social Performance-Financial Performance Link. Strateg. Manag. J. 1997, 18, 303–319. [Google Scholar] [CrossRef]
- Orlitzky, M.; Schmidt, F.L.; Rynes, S.L. Corporate social and financial performance: A meta-analysis. Organ. Stud. 2003, 24, 403–441. [Google Scholar] [CrossRef]
- Harjoto, M.A.; Salas, J. Strategic and institutional sustainability: Corporate social responsibility, brand value, and Interbrand listing. J. Prod. Brand Manag. 2017, 26, 545–558. [Google Scholar] [CrossRef]
- RobecoSAM SI Research & Development. Alpha from Sustainability; RobecoSAM SI Research & Development: Zurich, Switzerland, 2014. [Google Scholar]
- Petek Gursel, A.; Masanet, E.; Horvath, A.; Stadel, A. Life-cycle inventory analysis of concrete production: A critical review. Cem. Concr. Compos. 2014, 51, 38–48. [Google Scholar] [CrossRef]
- Turk, J.; Cotič, Z.; Mladenovič, A.; Šajna, A. Environmental evaluation of green concretes versus conventional concrete by means of LCA. Waste Manag. 2015, 45, 194–205. [Google Scholar] [CrossRef] [PubMed]
- IEA; WBCSD. Cement Technology Roadmap 2009: Carbon Emissions Reductions up to 2050; World Business Council for Sustainable Development; International Energy Agency: Paris, France, 2009. [Google Scholar]
- Boden, T.; Andres, B.; Marland, G. Global CO2 Emissions from Fossil-Fuel Burning, Cement Manufacture, and Gas Flaring; Carbon Dioxide Information Analysis Center, Oak Ridge National Laboratory, U.S. Department of Energy: Oak Ridge, TN, USA, 2016; pp. 1751–2013.
- Scrivener, K.L.; John, V.M.; Gartner, E.M. Eco-Efficient Cements: Potential, Economically Viable Solutions for a Low CO2, Cement Based Materials Industry; United Nations Environment Program: Nairobi, Kenya, 2016. [Google Scholar]
- European Committee for Standardization. Sustainability of Construction Works-Environmental Product Declarations-Core Rules for the Product Category of Construction Products; EN 15804; European Committee for Standardization: Brussels, Belgium, 2013. [Google Scholar]
- Petti, L.; Serreli, M.; Di Cesare, S. Systematic literature review in social life cycle assessment. Int. J. Life Cycle Assess. 2016, 23, 422–431. [Google Scholar] [CrossRef]
- Neugebauer, S.; Forin, S.; Finkbeiner, M. From life cycle costing to economic life cycle assessment—Introducing an economic impact pathway. Sustainability 2016, 8, 428. [Google Scholar] [CrossRef]
- Neugebauer, S.; Traverso, M.; Scheumann, R.; Chang, Y.J.; Wolf, K.; Finkbeiner, M. Impact pathways to address social well-being and social justice in SLCA-Fair wage and level of education. Sustainability 2014, 6, 4839–4857. [Google Scholar] [CrossRef]
- GreenDelta GmbH PSILCA—Product Social Impact Life Cycle Assessment Database, Version 1.0. Available online: http://www.psilca.net/ (accessed on 7 May 2017).
- UNEP Setac Life Cycle Initiative. Guidelines for Social Life Cycle Assessment of Products; UNEP: Nairobi, Kenya, 2009; Volume 15, ISBN 9789280730210. [Google Scholar]
- Norris, G.A. Social impacts in product life cycles: Towards life cycle attribute assessment. Int. J. Life Cycle Assess. 2006, 11, 97–104. [Google Scholar] [CrossRef]
- Russo Garrido, S.; Parent, J.; Beaulieu, L.; Revéret, J.P. A literature review of type I SLCA—Making the logic underlying methodological choices explicit. Int. J. Life Cycle Assess. 2018, 23, 432–444. [Google Scholar] [CrossRef]
- Fontes, J.; Bolhuis, A.; Bogaers, K.; Saling, P.; van Gelder, R.; Traverso, M.; Tarne, P.; Das Gupta, J.; Morris, D.; Woodyard, D.; et al. Handbook for Product Social Impact Assessment Version 3.0; PRé Sustainability: Amersfoort, The Netherlands, 2016. [Google Scholar]
- Foolmaun, R.K.; Ramjeeawon, T. Comparative life cycle assessment and social life cycle assessment of used polyethylene terephthalate (PET) bottles in Mauritius. Int. J. Life Cycle Assess. 2013, 18, 155–171. [Google Scholar] [CrossRef]
- Norris, C.B.; Norris, G.A.; Aulisio, D. Efficient assessment of social hotspots in the supply chains of 100 product categories using the social hotspots database. Sustainability. 2014, 6, 6973–6984. [Google Scholar] [CrossRef]
- Weidema, B.P.; Wesnaes, M.S. Data quality management for life cycle inventories-an example of using data quality indicators. J. Clean. Prod. 1996, 4, 167–174. [Google Scholar] [CrossRef]
- Andersson, M.; Barkander, J.; Kono, J.; Ostermeyer, Y. Abatement cost of embodied emissions of a residential building in Sweden. Energy Build. 2018, 158, 595–604. [Google Scholar] [CrossRef]
- Wernet, G.; Bauer, C.; Steubing, B.; Reinhard, J.; Moreno-Ruiz, E.; Weidema, B. The ecoinvent database version 3 (part I): Overview and methodology. Int. J. Life Cycle Assess. 2016, 21, 1218–1230. [Google Scholar] [CrossRef]
- Universiteit Leiden CML-IA Characterisation Factors. Available online: http://cml.leiden.edu/software/data-cmlia.html (accessed on 3 May 2018).
- PRé Consultants B.V. SimaPro Version 8.3; PRé Consultants B.V.: Amersfoort, The Netherlands, 2017. [Google Scholar]
- Kono, J.; Ostermeyer, Y.; Wallbaum, H. Investigation of Regional Conditions and Sustainability Indicators for Sustainable Product Development of Building Materials. J. Clean. Prod. 2018, 196, 1356–1364. [Google Scholar] [CrossRef]
- Alberici, S.; de Beer, J.; van der Hoorn, I.; Staats, M. Fly Ash and Blast Furnace Slag for Cement Manufacturing; Department for Business, Energy & Industrial Strategy: London, UK, 2017. [Google Scholar]
Figure 1.
Distribution of the normalized social LCA (SLCA) results.

Figure 2.
Normalized life cycle social impact in risk hours of green concretes. The shape represents the geographic representation and the color represents the slag content of the green concrete.
Figure 2.
Normalized life cycle social impact in risk hours of green concretes. The shape represents the geographic representation and the color represents the slag content of the green concrete.

Figure 3.
Distribution of the normalized life cycle impact assessment (LCIA) results by company classes (Abiotic depletion non-fossil and fossil, Acidification, Eutrophication and Freshwater tox).
Figure 3.
Distribution of the normalized life cycle impact assessment (LCIA) results by company classes (Abiotic depletion non-fossil and fossil, Acidification, Eutrophication and Freshwater tox).

Figure 4.
Distribution of the normalized LCIA results by company classes (GWP, Human tox, Marine tox, ODP, PO, Terrestrial tox).
Figure 4.
Distribution of the normalized LCIA results by company classes (GWP, Human tox, Marine tox, ODP, PO, Terrestrial tox).

Figure 5.
Normalized life cycle environmental impact of green concretes. The shape represents the geographic representation and the color represents the slag content of the green concrete.
Figure 5.
Normalized life cycle environmental impact of green concretes. The shape represents the geographic representation and the color represents the slag content of the green concrete.

Figure 6.
Normalized social and environmental performance of green concretes with different slag content in six countries. For the environmental performance of DE and SE, the LCIA results of EU is shown. For the environmental performance of JP and TH, the LCIA results of RoW is shown.
Figure 6.
Normalized social and environmental performance of green concretes with different slag content in six countries. For the environmental performance of DE and SE, the LCIA results of EU is shown. For the environmental performance of JP and TH, the LCIA results of RoW is shown.


Table 1.
Weighting factors for each risk level used for identifying social hotspots and quantifying life cycle social impact.
Table 1.
Weighting factors for each risk level used for identifying social hotspots and quantifying life cycle social impact.
| Risk Level | No Data | Very Low | Low | Medium | High | Very High |
|---|---|---|---|---|---|---|
| Weighting factors for risk hours | 0.5 | 0.25 | 0.5 | 1 | 2.0 | 5.0 |
Table 2.
Life cycle inventory (LCI) dataset used in the green concrete for social life cycle assessment (SLCA).
Table 2.
Life cycle inventory (LCI) dataset used in the green concrete for social life cycle assessment (SLCA).
| CH | DE | JP | SE | TH | US | |
|---|---|---|---|---|---|---|
| slag | Manufacture of basic metals (CH) | Basic ferrous metals (DE) | Steel scrap (JP) | Manufacture of basic metals (SE) | Iron and Steel (TH) | Iron and steel mills and ferroalloy manufacturing (US) |
| cement and aggregates | Construction (CH) | Basic construction (DE) | Ready mixed concrete (JP) | Construction (SE) | Cement and concrete products (TH) | Ready-mix concrete manufacturing (US) |
Table 3.
Social inventory of the investigated green concrete for 1 USD.
| Slag Content | 33% | 70% | 85% |
|---|---|---|---|
| Steel slag | 0.35 USD | 0.69 USD | 0.90 USD |
| Cement and aggregates | 0.65 USD | 0.31 USD | 0.10 USD |
Table 4.
Relevant stakeholder for each social indicator.
| Stakeholder | Subcategory | Indicators | Assessed Impact Category |
|---|---|---|---|
| Society | Contribution to economic development | Public spending on education | Education |
| Health and safety | Health expenditure | Health | |
| Worker | Fair salary | Living wage per month | Fair salary |
| Minimum wage per month | |||
| Sector average wage per months | |||
| Forced labor | Goods produced by the forced labor | Goods produced by the forced labor | |
| Trafficking in persons | Trafficking | ||
| Working time | Weekly hours of work per employee | Worker hours | |
| Local community | Respect of indigenous rights | Presence of Indigenous population | Indigenous rights |
| Human rights issues faced by indigenous people | |||
| Value chain actors | Corruption | Public sector corruption | Corruption |
Table 5.
The identified social hotspots of the selected social indicators for the investigated inventories.
Table 5.
The identified social hotspots of the selected social indicators for the investigated inventories.
| Steel Slag Concrete 33% (CH) | Steel Slag Concrete 33% (DE) | Steel Slag Concrete 33% (JP) | Steel Slag Concrete 33% (SE) | Steel Slag Concrete 33% (TH) | Steel Slag Concrete 33% (US) | |
|---|---|---|---|---|---|---|
| Education | Manufacturing (IN) | Basic ferrous metals (DE) | Construction (CN) | Construction (CN) | Iron and Steel (TH) | Iron and steel mills and ferroalloy manufacturing (US) |
| Fair Salary | Manufacture of basic metals (CH) | Construction (CN) | Construction (CN) | Manufacture of basic metals (SE) | Iron and Steel (TH) | Iron and steel mills and ferroalloy manufacturing (US) |
| Goods produced by forced labour | Metal Products (CN) | Metal Products (CN) | Metal Products (CN) | Metal Products (CN) | Crop cultivation (CN) | Metal Products (CN) |
| Health expenditure | Manufacturing (IN) | Construction (IN) | Construction (IN) | Construction (IN) | Iron and Steel (TH) | Iron and steel mills and ferroalloy manufacturing (US) |
| Trafficking | Manufacturing (IN) | Construction (CN) | Engines and Turbines (TH) | Machinery and equipment n.e.c. {RU} | Iron and Steel (TH) | Iron and steel mills and ferroalloy manufacturing (US) |
| Worker hours | Manufacture of basic metals (CH) | Basic ferrous metals (DE) | Construction (CN) | Manufacture of basic metals (SE) | Iron and Steel (TH) | Iron and steel mills and ferroalloy manufacturing (US) |
| indigenous rights | Manufacturing (IN) | Construction (CN) | Construction (CN) | Manufacture of basic metals (SE) | Iron and Steel (TH) | Iron and steel mills and ferroalloy manufacturing (US) |
| corruption | Manufacturing (IN) | Manufacturing (IN) | Construction (CN) | Construction (CN) | Iron and Steel (TH) | Iron and steel mills and ferroalloy manufacturing (US) |
Table 6.
Related inventories of the hotspots for respective impact categories and inventories.
| Slag Content | Region | Clinker Related | Slag Related | Energy Related |
|---|---|---|---|---|
| 36–65% | CH | Abiotic fos, GWP, Hum tox, Freshwater tox, Marine tox, Terrestrial tox, PO, Acidification, Eutrophication | 0 | ODP |
| EU | Abiotic fos, GWP, Terrestrial tox, PO, Acidification | 0 | ODP, Hum tox, Freshwater tox, Marine tox, Eutrophication | |
| RoW | Abiotic fos, GWP, Hum tox, Freshwater tox, Marine tox, Terrestrial tox, PO, Acidification, Eutrophication | 0 | ODP | |
| 20–70% | US | Abiotic fos, GWP, Terrestrial tox, PO, Acidification | 0 | ODP, Hum tox, Freshwater tox, Marine tox, Eutrophication |
| 66–80% | CH | Abiotic fos, GWP, Hum tox, Freshwater tox, Marine tox, Terrestrial tox, PO, Acidification, Eutrophication | 0 | ODP |
| EU | Abiotic fos, GWP, Terrestrial tox, Acidification | PO | ODP, Hum tox, Freshwater tox, Marine tox, Eutrophication | |
| RoW | Abiotic fos, GWP, Freshwater tox, Marine tox, Terrestrial tox, Acidification | Hum tox, PO | ODP, Eutrophication | |
| 81–95% | CH | Freshwater tox, Marine tox, Eutrophication | Abiotic fos, GWP, Hum tox, PO, Acidification | ODP, Terrestrial tox |
| EU | Abiotic fos, Terrestrial tox | GWP, PO, Acidification | ODP, Hum tox, Freshwater tox, Marine tox, Eutrophication | |
| RoW | Abiotic fos, Terrestrial tox | GWP, Hum tox, PO, Acidification | ODP, Freshwater tox, Marine tox, Eutrophication | |
| 70–100% | US | Abiotic fos, Terrestrial tox | GWP, PO, Acidification | ODP, Hum tox, Freshwater tox, Marine tox, Eutrophication |
GWP: global warming potential; PO: photochemical ozone formation; ODP: ozone depletion potential.
© 2018 by the authors. Licensee MDPI, Basel, Switzerland. This article is an open access article distributed under the terms and conditions of the Creative Commons Attribution (CC BY) license (http://creativecommons.org/licenses/by/4.0/).
Share and Cite
MDPI and ACS Style
Kono, J.; Ostermeyer, Y.; Wallbaum, H. Trade-Off between the Social and Environmental Performance of Green Concrete: The Case of 6 Countries. Sustainability 2018, 10, 2309. https://doi.org/10.3390/su10072309
AMA Style
Kono J, Ostermeyer Y, Wallbaum H. Trade-Off between the Social and Environmental Performance of Green Concrete: The Case of 6 Countries. Sustainability. 2018; 10(7):2309. https://doi.org/10.3390/su10072309
Chicago/Turabian StyleKono, Jun, York Ostermeyer, and Holger Wallbaum. 2018. "Trade-Off between the Social and Environmental Performance of Green Concrete: The Case of 6 Countries" Sustainability 10, no. 7: 2309. https://doi.org/10.3390/su10072309
Note that from the first issue of 2016, this journal uses article numbers instead of page numbers. See further details here.