Unintended Effects of Autonomous Driving: A Study on Mobility Preferences in the Future

1
Department of Management Sciences, Bonn-Rhein-Sieg University of Applied Sciences, 53757 Sankt Augustin, Germany
2
Digital Consumer Studies, University of Siegen, 57068 Siegen, Germany
3
Fraunhofer Institute for Applied Information Technology (FIT), 53754 Sankt Augustin, Germany
*
Author to whom correspondence should be addressed.
Sustainability 2018, 10(7), 2404; https://doi.org/10.3390/su10072404
Submission received: 31 May 2018
/
Revised: 29 June 2018
/
Accepted: 6 July 2018
/
Published: 10 July 2018
(This article belongs to the Special Issue Information and Communications Technologies (ICT) for Sustainability)
Abstract
:Innovations in the mobility industry such as automated and connected cars could significantly reduce congestion and emissions by allowing the traffic to flow more freely and reducing the number of vehicles according to some researchers. However, the effectiveness of these sustainable product and service innovations is often limited by unexpected changes in consumption: some researchers thus hypothesize that the higher comfort and improved quality of time in driverless cars could lead to an increase in demand for driving with autonomous vehicles. So far, there is a lack of empirical evidence supporting either one or other of these hypotheses. To analyze the influence of autonomous driving on mobility behavior and to uncover user preferences, which serve as indicators for future travel mode choices, we conducted an online survey with a paired comparison of current and future travel modes with 302 participants in Germany. The results do not confirm the hypothesis that ownership will become an outdated model in the future. Instead they suggest that private cars, whether conventional or fully automated, will remain the preferred travel mode. At the same time, carsharing will benefit from full automation more than private cars. However, the findings indicate that the growth of carsharing will mainly be at the expense of public transport, showing that more emphasis should be placed in making public transport more attractive if sustainable mobility is to be developed.
1. Introduction
Mobility is an important prerequisite for social, cultural, and economic development and for social participation. It is also becoming affordable for an ever-increasing number of people worldwide. Motorized private transport has become the most important and most frequently used mode of transport, and forecasts indicate that this will continue to be the case in the future (i.e., [1,2]). However, the high growth in population and the urbanization trend have led to an increasing volume of traffic worldwide, causing problems in both urban and rural areas. These developments, limited resources, and environmental and climate protection issues challenge transport systems internationally in many areas, calling for the development of sustainable mobility [3,4] to create smart and sustainable cities [5].
The growing interconnectedness of mobility is expected to make an important contribution here: Smart vehicles and an intelligent infrastructure can continue to make transport not only more efficient, safer, but also more environmentally friendly. To create a future competitive advantage, the sustainable integration of ICT into the value chain is one of the central challenges for the automotive industry. A radical development away from traditional towards connected and autonomous driving (AD) can already be observed. Various authors assume that the technological innovations in this area will make an important contribution to sustainable mobility: Intelligent traffic management systems and vehicle platooning (traveling close together at high speed), so the expectation, will lead to energy saving, congestion avoidance, as well as traffic flow becoming more efficient and driving behavior more ecological [6,7]. Another expectation is that AD can make the breakthrough for post-ownership mobility [7], with on-demand services such as shared autonomous vehicles (SAV) becoming the dominant travel mode [8,9].
However, the history of innovation has shown that it is insufficient to consider the effects of technological efficiency improvements in isolation. Repeatedly, technological progress has fallen short of expectation as user behavior is not considered in relevant research, and direct and indirect rebound effects, such as consumption shifting towards less emission-friendly travel modes, are being neglected [10,11,12]. In this regard, we see the danger that the current discourse on AD primarily underlines the potential benefits of an isolated technological perspective and neglects possible negative aspects due to acceptance problems and rebound effects. However, dealing with possible ecological downsides requires a better understanding of the effects of new forms of mobility on mobility behavior and of where supplementary measures may be needed to avoid these negative effects.
This paper contributes to the current discourse on AD from a more critical stance, taking user behavior as the focus. We conducted an empirical study to include the user in research on choice of travel mode that takes future forms of travel into consideration, as researchers have requested [13]. Using a paired comparison, we analyze user preferences in order to anticipate changes in mobility behavior, not by using monomodal analysis, as has so far been the case [14], but by using multimodal analysis that puts different travel modes into relation.
The rest of the paper is structured as follows: First we outline the prospective positive and negative effects of SAV before we derive the changes that will take place through automation based on the Travel Mode Choice theory. Then we briefly present our methodology and the results of our study. The latter starts with a general analysis of the travel mode choice of the participants before going into further detail by providing insights into the preference changes of the participants and group-specific results. These results are then critically discussed in Section 6. Finally, we present limiting factors and derive implications for future research and conclusions.
2. Environmental Impacts of Autonomous Driving
In the last few years, enormous effort has been put into enabling AD. SAE International defines six levels of automation for road traffic: no automation (0), driver assistance (1), partial automation (2), conditional automation (3), high automation (4) and the last stage of full automation (5) [15]. In our study, we always refer to Level 5: full automation. Completely autonomous driving robots that have no manual driving mode are expected to be available from 2030 onwards. Optimistic forecasts assume that highly and fully automated vehicles will reach a market share of 11 to 42 percent in 2035 [16].
This rapid progress in the digitalization of the car raises the question of how to assess this development from a sustainability perspective. However, it is important to note that the technology itself is neither eco-friendly nor the opposite. This always depends on its impact on transportation e.g., on traffic system performance or on travel behavior. We therefore outline the expected impacts as discussed in the literature.
2.1. Positive Environmental Effects
2.1.1. Positive Impacts on Traffic System Performance
AV could operate more efficiently than traditional vehicles [7,17,18], and thus could reduce resource consumption and the environmental impact [19]. AD would allow vehicle emissions to be reduced by up to 94% [20]. Connected driving can reduce or avoid stop-and-go traffic and congestion [7,17]. So-called platooning can be used to improve traffic safety, optimize traffic flow, and reduce CO2 emissions since vehicles can exchange data and coordinate driving speed, braking characteristics, and distances between vehicles [18,21]. Thus, energy consumption could be reduced [18]. As accidents can be avoided by using autonomous and connected cars, vehicles require lower safety mechanisms such as airbags and steel constructions than today and would therefore weigh less [22,23]. This means that the engine performance can be reduced, which would in turn lead to lower energy consumption and lower emissions and consequently to environmental pollution being considerably reduced.
2.1.2. Positive Impacts on Travel Mode Choice
Many researchers expect a great shift away from private cars towards on-demand mobility services [24,25] and expect positive effects, some of which are already being achieved with today’s carsharing [26]. Full automation could considerably increase the market share of individual public transport such as taxis and carsharing since the advantages of these business models can be realized to a new extent through autonomous vehicles (AV). Fully autonomous carsharing fleets would enable a high degree of spontaneity and flexibility because there would no longer be any set arrival and departure times, thus allowing direct competition with private cars [7]. Some studies simulate different scenarios with SAV fleets, calculating the number of vehicles needed to ensure efficient mobility with short waiting times and high quality at low costs. They show that SAV could potentially reduce the number of vehicles by between 31% to 95% [7,8,17,25,27,28].
2.2. Rebound Effects as Negative Environmental Effects
While the literature mainly discusses ecological, economic, and social advantages of AV, some studies also attempt to assess negative consequences. A main concern are the various types of rebound effects that can occur as a result of resource saving [29,30,31]. In the mobility sector, for example, increases in car efficiency can lead to increased vehicle mileage, a more energy-intensive driving style or even to the purchase of a larger or an additional car [32]. Direct rebound models assume that the savings in resources (in terms of costs or time) which result from the increase in efficiency can lead to an increase in demand for the same product [33]. As a result, the maximum possible resource saving through increased efficiency is not achieved; the direct rebound effect reduces, negates, or even exceeds the benefits of improved technological efficiency [34]. Related empirical studies have analyzed direct rebound effects in energy consumption in the company context [35,36] or in various consumer fields such as electricity [34], residential heating [37,38,39], residential cooling [40], or residential lighting [41,42]. For instance, studies investigating the rebound effect of fuel prices on vehicle miles traveled found that direct rebound effects regularly occur, varying between 10–30% [43,44].
For those studies on direct rebound effects, goods are considered in isolation. However, several studies show that technological innovations could also lead to indirect rebound effects [11]. They arise when the time and money saved by the innovation lead to an increased consumption of other goods and services (income and substitution effects). For example, the cost saving from more energy-efficient lighting may be put towards an overseas holiday [45]. It is different in the case of consumption shifting: when the innovation makes it attractive to satisfy a need through a substitutable product or service. For example, HD television, although initially expensive, may lead to cost savings since cinema visits could be replaced by private video nights.
If indirect rebound effects are included in the analysis, an even larger part of the efficiency saving may be negated [46]. Hence, more advanced models try to consider both the choice of consumer goods and the changes in consumer behavior. Choice of consumer goods is dependent not only on the efficiency but also on the consumer’s preferences and life situation. When choosing their mode of travel, users can choose between different modes to meet their mobility needs. Studies therefore need to take into account indirect rebound effects that are caused by the changes in travel mode choice due to the innovation of automating vehicles.
So far, no econometric analyses have been carried out to measure rebound effects in the form of behavioral changes in the context of travel mode choice and AD. However, researchers are attempting to determine how mobility demand will change with the introduction of AV. Studies such as [8,16] conclude that the widespread use of AV will increase the number of trips resulting in 3% to 27% additional journeys [13]. There are various reasons for a possibly increased trip demand [47], the most important of which are outlined below.
2.2.1. Negative Impacts of Increased Travel Demand
As SAV trip costs might be substantially lower than today’s taxi costs [25,27], user demand could rise when trips that, at the moment, have marginal net benefits will become more attractive. As a result, direct rebound effects can occur if the financial saving makes it possible or even attractive for users to take more trips in the AV. In addition, when the time spent in an AV can be better or more efficiently used, people may be willing to undertake more and longer trips [18]. Such time rebound effects can be caused not only by better use of time but also by the more efficient flow of traffic. Studies have shown that the users’ mobility time budgets, i.e., the amount of time they are willing to spend on travel, has been stable over time. Hence, if a faster mobility option becomes available, users will accept longer journeys as the overall journey time will not place extra demands on their mobility time budget [48].
2.2.2. Negative Impacts of Empty Runs
A whole new class of travel will occur with AV maneuvering of unoccupied vehicles [16,49] as an unintended effect of changes in the user’s behavior. AV can pick up their users, park, and carry out courier journeys autonomously. These empty runs are not a direct result of users’ demand and are therefore attributable to indirect effects. The additional journeys will occur regardless of whether the AV are private or shared. With an increase in demand for SAV, there will be 8% to 17% more vehicle miles traveled for relocation of vehicles or arrival and departure reasons [8,25,47]. Even more pessimistic scenarios discuss the possibility that cars will no longer be parked in large cities due to a lack of or only expensive parking spaces but instead will drive around the block until they are next requested or park in distant car parks outside the expensive city locations [50].
2.2.3. Negative Impacts of Unintended Shifts in Mode Choice
Most of the simulation models mentioned above are based on the untested assumption that SAV are especially attractive for car owners, neglecting the fact that they could also unintendedly impact the mobility behavior of other, currently non-car, users. Some studies discuss possible mobility shifts away from eco-friendly mass transportation towards more comfortable SAV [16]. Krueger et al. [9], for example, pinpoint that people might prefer inexpensive and convenient mobility on-demand services over previous alternatives such as walking, cycling, or public transport (PT). They fear that PT could become neglected. So far—to our knowledge—these hypotheses have only been argumentatively derived and not empirically tested. We therefore used the travel mode choice theory to systematically check whether these fears are justified and examine these hypotheses empirically, concentrating on possible mode shifts as a special form of indirect rebound effects.
3. Theory and Research in Travel Mode Choice
3.1. Theory of Travel Mode Choice and Random Utility
Travel mode choice theories aim to predict which transportation mode will be used by understanding why people prefer one mode over another [51]. In general, people have various alternatives for managing mobility, and they choose one of the modes that meets their mobility needs, maximizing personal benefits. However, users are not able to keep track of all information important for a rational choice [52,53]. The user’s subjective perception therefore does not necessarily have to correspond with objective reality. A mode’s benefits only influence mode choice if they are perceived and valued by the users. If, for example, people believe that it would be more expensive to go by bus than by car, then, even if this belief is not based on facts, they will avoid the bus.
In decision making, the absolute level of utility of a product or a service is less relevant than the differences in utility [54]: A travel mode is used not because of its utility in absolute terms but because its utility is relatively seen better when compared to other alternatives. In the case of adopting new alternative travel modes, these modes must therefore offer a relative advantage over the travel modes previously used. Thus, travel mode choice theories are influenced by the random utility theory. This theory assumes that the use of alternatives is a latent construct that exists (if at all) in the minds of individuals. According to this theory, people do not compare various goods in general; they compare the (partworth) utility that they provide [55]. In this context, transportation research has identified several travel mode characteristics that affect individual travel mode choice [51]. The following factors are usually mentioned as the most relevant [6,9,56]:
- Travel time is the total time required to cover a distance from A to B. Depending on the travel mode, travel time includes not only the actual time spent travelling but also various activities such as finding a parking space, walking times from an origin to the access point, transfer times, or waiting times at stops.
- Travel costs include all costs for the use of a travel mode. For users, it is often only variable costs or perceived costs that are relevant [57].
- Comfort includes all the features that make a ride pleasant for the user. Thus, comfort consists of several sub-attributes such as the quality of seats, probability of sitting, possibility to transport goods, the passenger’s privacy, level of crowdedness, and quality of time due to efficient time utilization.
- Flexibility refers to the possibility to use the travel mode at your own discretion and adapt it to your own needs.
- Availability of the travel modes is given if it is accessible to a user and ready for operation when the user wants or needs it.
- Reliability refers to the extent to which a travel mode carries out a trip as intended or scheduled.
- Safety describes the condition that gives the passenger the feeling of confidence that a travel mode will take him or her safely to a destination.
In the discourse of AD, the criteria of driving ability, control, and driving fun are repeatedly discussed [50,58,59]. AD opens the possibility of being mobile even when people are temporarily or permanently unable to drive. Many users and researchers see this aspect as an advantage of AD [14]. In contrast, acceptance studies show that users fear loss of control and driving fun when thinking of AD [58]. With a view to encouraging sustainable mobility, studies found environment-related attitudes hardly affect mobility behavior and mode choice in everyday life [6,60].
Taking these factors into account, we evaluate autonomous travel modes and derive first hypotheses on travel mode choice. As the direct inclusion of users has been overlooked in research on partworth utilities of autonomous travel modes, we base our estimates regarding these on general insights from literature.
3.2. Changes in Private Car Characteristics
Some studies try to anticipate what consequences the automation of vehicles will have and how users will experience these consequences. Experts predict some attributes such as travel time, comfort, and time utilization will be improved by automating cars. Travel time is expected to decrease as connected cars can anticipate and avoid congestion and drive in platoons [6,13]. Driving comfort and convenience are going to increase as travel time can be better used, e.g., for working, relaxing, or socializing, and the car is going to chauffeur its owner and park itself [16,21,27]. Other characteristics such as transportation of goods, personal independence, availability, and flexibility will not change significantly [61] as AV can be used to the same extent to transport goods and because users still have access to their property at all times.
In a recently published study, we present first insights into how users assess the characteristics of AV compared to conventional cars and PT [62]. This study reveals that autonomous cars provide greater driving comfort and greater time saving than traditional cars. Autonomous travel modes offer not only the personal space and comfort of a private car but also the advantages of PT, namely, not having to drive oneself. The use of time while driving a traditional car is currently limited to passive activities such as listening to the radio or making telephone calls. As the driving task is eliminated, self-driving technology makes it possible to make better use of the time spent in the car [63]. This possibility counteracts one of the advantages of PT because the driver becomes a passenger [59]. In terms of driving pleasure and control, users see an advantage in the traditional car compared to the autonomous car [64,65].
Surprisingly, users expect the reliability, availability, and flexibility of an autonomous car to be less than that of a traditional car, presumably due to the novelty of the technology, the inexperience of the users with the technology, and lack of confidence in this new technology. Users have repeatedly expressed concerns that the technology could fail [66,67], which may be one reason for the conviction that AV would have less reliability and availability.
In terms of costs, users also see disadvantages in private autonomous cars as they expect higher purchase costs due to the self-driving technology as well as higher operating costs due to the additional technology, which may cause new faults and require more maintenance [58,64].
Our previous study [62] confirms the assumptions that users today perceive autonomous cars as having more disadvantages than advantages. For this reason, we conclude that
H1:
Users will prefer the traditional car over the fully autonomous car.
3.3. Changes in Carsharing Characteristics
Carsharing will benefit from automation in various respects. Travel time will shorten compared to today’s carsharing since the user will not have to walk or use PT to get to the pick-up point. The pure riding time will therefore be similar to that of a (fully automated) private car, apart from the ordering and waiting time. Additionally, automatic relocation of SAV and automatic pick-up will improve availability and therefore also flexibility, leveraging personal independence [8,25]. Model simulations assume that data-driven control, automatic relocation, and automatic retrieval will greatly increase the availability, especially compared to today’s carsharing, so that the user will on average have to wait less than one minute [25]. Still, if the vehicle has to reach the passenger’s location, from the moment a user is ready to drive and places an order for autonomous carsharing, a waiting time can occur until the journey actual starts. In addition, users do not yet fully anticipate this progress in SAV transport planning so that perceived availability is still less than for a privately owned car since it cannot be guaranteed that an SAV is always ready to depart [61].
Hauling goods will generally become easier as passengers will be picked up at their origin and do not need to carry goods to the pick-up point. As in autonomous private cars, time usage, comfort, and overall convenience will increase, too. Simulations show that SAV travel costs could be greatly reduced compared to today’s costs of carsharing or taxis [24,25]. However, since most users are not familiar with these simulations and many users are uncertain about the costs of carsharing anyway, this predicted cost reduction is probably of no relevance to them.
Attitudes towards safety, reliability, loss of control, and driving pleasure that apply to the private AV also apply to SAV [62]. However, we think that the loss of control and driving fun plays a lesser role than with a private car, as carsharing users might be less emotionally connected to the car. As there seem to be more advantages than disadvantages to carsharing due to automation, we conclude that
H2:
Users will prefer autonomous carsharing (SAV) over traditional carsharing.
In line with our state-of-the-art review, we conclude that new modes based on AD (such as private AV or SAV) could in the future increase the alternatives in travel modes. The question therefore arises as to which travel mode users prefer and how this choice will change mobility behavior overall. Although there are many acceptance studies on AD, these studies generally consider the autonomous car in isolation. To our knowledge, travel mode choice analyses have not so far included the new modes, nor have these modes been evaluated in comparison with existing modes of transport.
4. Methodology
To investigate the impact of full automation on travel mode choice, an online survey was conducted in Germany. We used total paired comparison to uncover user preferences as an indicator of future travel mode choice [68,69]. Paired comparison is commonly used when subjective criteria need to be recorded [70]. As outlined earlier, this is the case when choosing travel modes, as user’s preference for a travel mode is shaped by subjectively perceived partworth utilities.
The survey consisted of three parts. First, we asked for general participant demographic information and participants’ current mobility behavior. Second, the participants were shown a video (https://www.youtube.com/watch?v=6WTNBZZGOIs) to familiarize them with AD in general and with fully automated carsharing. The third part consisted of the complete paired comparison of the travel modes: private car, automated private car, carsharing, automated carsharing, and PT. In this paired comparison, respondents were confronted with pairs selected from an item set and asked to select the more preferred item from each pair. With n = 5 items there were n = (n − (n − 1))/2 = 10 pairs. A complete paired comparison of n objects shows how often each object was preferred over the alternative objects. If these frequencies are ranked according to their size, the objects examined can be ranked. The value 1 in a cell (i, j with i ≠ j) indicates that the parameter setting in row j was preferred over the parameter setting in column i. Accordingly, a value of 0 means that the object in row j is not preferred over the object in column i. Since a pair combination A–B is not queried again as B–A, the corresponding cells B–A are occupied with the logical negations for A–B. Since the parameter settings are not compared with themselves, the diagonal remains undetermined.
A clear ranking of the objects can only be determined if the participants consistently assess the objects. If a participant rates A ≤ B and B ≤ C, then A ≤ C must also apply for a consistent rating. An inconsistent respondent assessment indicates that the respondent barely noticed any differences and chose randomly or based on varying parameters. To check whether the participants did assess the objects consistently, we calculated the presence of circular triads. Circular triads arise if a participant’s assessments are inconsistent and no clear ranking of the objects can be determined. We additionally scaled sum values by applying the Bradley-Terry-Luce (BTL) model as one of the most commonly applied models for analyzing paired comparison data [41,42]. The resulting utility scale values (USV) provide a ranking of the different modes that reveals relative distances between the individual ranks [71].
We checked the questionnaire in pretests for comprehensibility and revised it accordingly. Subsequently, the survey was advertised in various social networks and online platforms between 16 December 2016–16 January 2017 and 6 June 2017–7 June 2017. Two survey periods were chosen to exclude seasonal and weather-dependent causes that influence travel mode choice. In total, the survey was completed by 302 participants. The participants were 49% male and 51% female. The average age of the respondents was 36.1 years; 57.9% of them lived in the city and 42.1% in rural areas. Of the 302 respondents, 97% held a driving license, 80.1% owned a car, and 34.4% held a long-term ticket for PT. A link to the dataset can be found in the Supplementary Materials section.
5. Results
5.1. Preferences of the Various Travel Modes
We start by exemplarily presenting the results from two participants. Table 1 shows examples of the judgement matrices of participants 40 and 205. P40 prefers the automated car to the car: (1) Car < Automated Car. Further, for P40 applies: (2) Car > Carsharing; (3) Car < Automated Carsharing; (4) Car > PT; (5) Automated Car > Carsharing; (6) Automated Car > Automated Carsharing; (7) Automated Car > PT; (8) Carsharing < Automated Carsharing; (9) Carsharing > PT; (10) Automated Carsharing > PT. Thus, P40 judges consistently, no circular triads occur (circular triads = 0). This makes it possible to derive a clear preference ranking: Automated Car > Automated Carsharing > Car > Carsharing > PT. The consistency coefficient of P40 is 1, and the ranking is reflected in the column totals. P205 is inconsistent in assessing travel modes. Since his ratings are Carsharing > Automated Car; Automated Car > Automated Carsharing and Automated Carsharing > PT, his Carsharing/PT rating should be Carsharing > PT. However, this is not the case; he rates PT > Carsharing. Here, the circular triads are 2; the consistency coefficient is 0.6. P205 still has the peculiarity that, despite partially inconsistent evaluation, there is a clear overall favorite: The car is preferred over any other travel mode. Here, the inconsistencies do not affect the first-choice, but they do affect the subsequent travel modes.
To provide an aggregate choice matrix for our sample, the individual response matrices have been totalized. Table 2 shows the frequency matrix of paired comparison representing the judgements of all participants. The values specify the frequency with which each item was chosen across all paired comparisons. For example, the value 180 or 59.6% in cell C/AC means that the traditional private car is preferred over the automated private car by 180 respondents, 59.6% of the sample, respectively (cell AC/C shows the equivalent of 122 and 40.4%). The values are printed in bold if the user preference is greater than 50%. An asterisk indicates values that deviate significantly from 50%; the significance of a value (p-value < 0.05) was calculated using a binomial proportion test [72]. To determine the rank, the sum of the columns was formed [70].
Participants’ overall ratings are largely consistent, i.e., free of contradictions [70]. The mean consistency coefficient of the paired comparative judgements is 0.947; most respondents therefore have a conscious or unconscious individual preference order of the presented travel modes. Overall, results show that the private car has the highest preference in the sample, the fully automated version ranks second, followed by PT, while carsharing-based modes finish last with autonomous carsharing still ranking higher than traditional carsharing. Using the BTL model to analyze the paired comparative data, we obtained information about the USV, showing the relative distances between the individual ranks [43]. Table 2 and Figure 1 show USV and the corresponding 95% confidence intervals for each travel mode. The USV shows that the values for the perceived utility of both the car and the automated car are dominant. It also shows that the perceived utilities of the public and shared modes are close together. They form a group whose value is below that of the private modes. Still, the scale values must be considered with caution. The low goodness of fit (χ2 = 19.47) indicates the BTL model is a simplification concerning the utility structure of the average user, one that abstracts from the difference between preferences of individual users and user segments.
In addition to the one-dimensional utility scale, interesting results can also be seen in the comparison of individual transport modes. For private cars, the direct comparison of fully automated vs. the traditional variant shows a significant preference for the traditional car (59.6%; p < 0.05). Thus, there is evidence that Hypothesis 1 is true. For carsharing, exactly the opposite is the case. Participants prefer fully automated carsharing to traditional carsharing (58.9%; p < 0.05), supporting Hypothesis 2.
To see how the offer of autonomous modes affects eco-friendly means of transport such as PT, we examine changes in the preferences of PT compared firstly with traditional modes and secondly with autonomous modes. The paired comparison of PT and private cars shows that the preference for PT is 26.2% compared to the preference for the traditional car, and 36.1% compared to that of the autonomous car. Thus, automating the car does not lead to an increase in preference for the private car, which might have been expected due to the advantages that come with automation.
For carsharing, it is again the other way around. While 59.6% of users prefer PT to traditional carsharing, only 47% prefer PT to autonomous carsharing. The preference for PT decreases when carsharing is automated. In contrast to private cars, carsharing seems to benefit from full automation.
5.2. Changes in the First-Choice Preference
With the first-choice rule, the user always chose the product with the highest overall utility of the alternatives offered [42]. This rule means that the alternative with the highest utility receives a choice probability of 1, and all other alternatives receive a probability of 0. In the context of travel mode choice, first-choice analysis is insofar useful as users usually preferred one travel mode that is used regularly as long as the circumstances remain relatively stable [43].
To analyze the overall effect of the autonomous modes of transport on the travel mode choice in more detail, we compared the results of the paired comparisons without new modes of transport (private car, carsharing, and PT) with the results of the paired comparisons with new modes of transport (private car, automated private car, carsharing, automated carsharing and PT, Figure 2). The results can be interpreted as current travel mode choices and possible future travel mode choices, respectively. The analysis shows that 93% of respondents expressed a favored travel mode, which is preferred to any alternative in a complete paired comparison. When only taking into account currently available means of transport, the participants preferred cars (69.9%) over PT (21.0%) and carsharing (9.1%). If the paired comparisons are expanded by autonomous cars and autonomous carsharing as future travel modes, the respondents’ preference structure changes. The proportion of decisions in favor of privately owned cars (traditionally and autonomously) remain stable at 69.9%. There are greater differences in the shares for carsharing and PT. While the share of carsharing (traditionally and autonomously) increases from 9.1% to 14.6%, the share of PT decreases from 21.0% to 15.2%. In addition, we perform an analysis at the level of the individual participants to understand how their decisions change when autonomous modes become available. P40, for example, prefers the car among the currently available travel modes. If all five travel modes are considered, he chose the automated car in accordance with the first-choice rule. This analysis is only possible for consistent valuations, since inconsistent valuations may not indicate a clear preference. Thus, n = 276 were included in this analysis.
On the basis of this analysis, concrete migratory movements between travel modes can also be depicted in addition to the relative changes in the proportions. The figures for the first-choices for currently available travel modes, the possible future first-choices, and migration are shown in Figure 2. A total of 185 participants remain loyal to the car; of the 193 people who opt for the car from the currently existing travel modes, 128 still chose the conventional car and 57 the automated car. Eight people who prefer the car from the current travel modes chose automated carsharing from all five travel modes. In addition, seven participants changed from PT to automated car and one participant from carsharing to automated car. Twenty-four participants remain loyal to carsharing. 13 of them continue to prefer conventional carsharing while 11 prefer automated carsharing. Another nine people switched from PT to automated carsharing. Consequently, of the 58 people who prefer PT among the currently available travel modes, 42 remain loyal to PT.
Our results suggest that the position of carsharing can be strengthened by introducing fully automated systems and that market shares can be gained. According to our participants’ choices, however, the desired effect of reducing car ownership in favor of sharing offers is not achieved. Instead, the more intensive use of carsharing is to the detriment of PT.
5.3. Group-Dependent Results
When analyzed in depth, the results of the first choice show significant differences depending on the categories. For the analysis, the results of all participants were examined according to gender, age, place of residence, car ownership, education, and income. We examined the preferences of respondents in two ways: first, considering only the current travel modes car, carsharing, and PT and second, by additionally taking the future travel modes automated car and automated carsharing into account. This extraction is possible because the complete paired comparison method allows participants to compare all individual objects in pairs. If it can be assumed that preferences are indicators of actual travel mode choices, implications for travel today as well as in the future can be derived, allowing possible mode choice changes in the future to be anticipated.
The results of the in-depth category analysis are shown in Table 3 and Figure 3. In the following sections, we discuss the most important results sorted by category. We start with the categories that appear most interesting due to the high significant differences.
5.2.1. Place of Residence
The difference in preferred travel modes is greatest and significant for the place of residence (urban vs. rural), both for today’s (p = 0.00) and for future travel mode choices (p = 0.00).
Today, the most sizeable differences are to be found in the preferences for the car and for PT. With 82.3%, the car is much more preferred by residents of rural areas than by city residents (60.7%). In contrast, PT is much more important for people living in urban areas: 30.7% prefer it, while it is the first choice for only 9.7% of rural areas’ residents. The preference for carsharing is relatively low at 8.1% (urban) and 8.6% (rural).
With regard to the possible future travel mode choice, there are similar differences between participants from urban and rural areas. The private car will continue to play a more important role for rural residents than for city residents while the opposite will continue to be true for PT. (Automated) carsharing will be more important for city residents (19.7%) than for rural residents (10.5%).
For the changes in travel mode choice brought about by the inclusion of automated travel modes, the results show that the preference for (automated) carsharing and PT changes, especially among participants from urban areas. It is noticeable that the preference for PT among urban participants will decrease from 30.7% now to 20.3% in the future while carsharing, irrespective of whether it is automated or not, will be preferred by 19.7% in the future instead of 8.6% now. Compared to today, the figures for the private car (total C/AC) in the future will remain stable at 81.5% in rural areas and 60.1% in urban areas. However, the conventional car will lose out with the automated car being preferred by 23.4% (rural area) and 24.7% (urban area). For rural participants, the figures for (automated) carsharing and PT remain comparatively stable at 10.5% (total CS/ACS) and at 8.1%, respectively.
5.2.2. Car Ownership
The largest significant differences in preference can be seen between car owners and non-car owners. As is to be expected the car today is the preferred travel mode for car owners (80.6%), while it is only the first choice for 25.5% of non-car owners. Most of the latter prefer PT (56.4%). The distribution of preferences for carsharing shows it is more attractive for non-car owners (18.2%) than for car owners (6.4%).
For future travel modes, 51.1% of car owners would prefer the conventional car, another 26.6% the automated car, so that a total of 77.7% of car owners would prefer the private car over usage-based travel modes. It is remarkable that the preferences of non-car owners for the future are almost evenly distributed among the three travel mode types; private cars (total C/AC; 34.0%) are just behind PT (35.9%), while carsharing (total CS/ACS) is narrowly less with 30.2%.
Consequently, the preferences of both car owners and non-car owners are affected by the advent of automated travel modes. For car owners, the greatest change can be found in their preference for carsharing: Overall, carsharing will gain slightly; its share will grow from presently only 6.4% to 12.2% (total CS/ACS), with 8.7% being accounted for by automated carsharing. This difference means that there are participants who will change preferences from private cars to carsharing in the future due to automation. Non-car owners’ preference for the private car as a whole will increase from 25.5% to 34.0% (total C/AC). It is, therefore, likely that non-car owners will shift their preference in favor of the private car as a result of automation. For these non-car owners, automated carsharing will also gain significantly from 18.2% now to 30.2% in the future. Their previous majority preference for PT will be substantially reduced from 56.4% to 35.9% by introducing automated travel modes.
5.2.3. Age
Only in the future travel mode preferences can significant differences between age groups be found, especially in carsharing and PT. While the young and the middle age group currently only prefer carsharing with a percentage of 7.7 and 6.1, respectively, the percentage is higher (14.9%) among older participants. For PT, the opposite is true: 22.0% of the young and 24.2% of the middle-aged participants prefer PT while only 13.4% of the older ones do so.
There are similar differences in preferences between participants of different age group for the future travel modes. Here too, the middle-aged group stands out from younger and older users; private cars are even more important to them. Carsharing is least important among all age groups. The older generation is in particular striking in its future disinclination towards PT: at only 9%, they will be significantly less attracted to PT than the middle-aged (17.3%) and younger generations (15.6%).
As a result, the private car will gain in importance among middle-aged participants when choosing between travel modes (from 69.7% (total C) to 72.4% (total C/AC)) while the preference for the private car will decrease among young and older participants. Carsharing will gain through automation, especially among young people, and will increase in preference from 7.7% (total CS) to 18.8% (total CS/ACS). PT loses out in all age groups due to automation.
5.2.4. Education
There is a notable difference in the preferred travel modes when the participants are categorized according to their educational backgrounds. The preference for private cars is substantially higher among people without a high school degree than among people with a high school degree for both current and future travel modes. The contrary is true for PT.
In the current travel modes, these differences of travel mode choice correlate only slightly with the respondents’ educational background (p = 0.14). Participants without a high school diploma (15.3% of our sample) have a stronger preference for cars (82.5%) than participants with a high school diploma (66.8%). The more highly-educated participants prefer PT and carsharing. Similar preferences apply to future travel modes. Here the two groups differ significantly from each other (p = 0.01).
Automation hardly changes the preferences for private (automated and non-automated) cars in the future. It is again carsharing that wins in the future travel mode choice, while PT loses attractivity in both groups. These differences between the two groups are significant (p = 0.01)
5.2.5. Gender
Slightly more male and fewer female participants currently prefer the car and vice versa applies for PT, for both present and future travel modes. The car is the most important travel mode for men (71.9%) and women (68.6%). After that choice, both groups prefer PT over carsharing.
With future travel modes, the differences between genders are greater for carsharing and PT. While 18.1% (total CS/ACS) of the males would prefer carsharing in the future and only 10.1% PT, among females there are 13.2% who prefer carsharing and 19.4% PT.
While the distribution of private cars among men and women remains almost the same when regarding changes in first-choice preferences, there are differences between carsharing and PT. Men shift their preferences much more from PT to carsharing when automation becomes available than do women. However, the gender differences are not significant here.
5.2.6. Income
With regard to income, there is a slight trend that participants today with rising income (65.0%; 73.1%; 74.8% for the three income brackets) increasingly prefer the private car among current travel modes, while participants with lower incomes increasingly prefer PT (25.8%, 20.9%, 15.5%). Similar distributions can be seen in future travel mode choices, indicating that carsharing is preferred as a result of automation at the expense of the private car but even more so at the expense of PT. However, the differences between the income groups are also not significant and may therefore only be a random result.
6. Discussion
The (fully automated) private car still seems to be of great importance in the future for the respondents even with alternatives increasing such as carsharing-based services. However, the preference could change significantly with the introduction of automated driving. To investigate changes in the preference structure, we now discuss the results of the paired comparisons in more detail as presented in Table 2, where possible changes in partworth utilities as well as preference migrations (Figure 2) and group-dependent results (Figure 3 and Table 3) are taken into account.
6.1. The Private Car is Still Preferred over Automated Alternative Modes
The participants expressed that the traditional private car for them still has a slightly higher total utility than the autonomous private car, and 59.6% of the participants still prefer the traditional version. As the privately owned car is the most popular travel mode today—both among our participants as well as in Germany in general [48]—its role in the future could be over-estimated. As travel mode choice is strongly influenced by socialization and habits, users familiar with using a private car are likely also to choose the private car to be the most preferred travel mode in the future [73]. From today’s viewpoint, the subjectively perceived advantages of the conventional car over the autonomous car are predominant. While characteristics such as availability, driving time, flexibility, or transportation of objects are not expected to change substantially, the differences in characteristics might be perceived as greater between traditional and autonomous cars. According to some studies, users will see the autonomous car as being better in terms of driving comfort and improved time use, as well as being less restrictive (e.g., after drinking alcohol) [14]. In terms of driving enjoyment and control of the vehicle, however, the traditional model that needs to be actively controlled can score better. Studies such as [14] have shown that some respondents fear that automating the car will reduce the fun of driving. There are also reservations about the safety of the as yet unknown AV [58] and some users are concerned about privacy issues. They are particularly worried that their location and destination data will be disclosed [66]. These concerns could in sum lead traditional passenger cars to have a higher value among users.
Our analysis of preference migration with regard to the participants’ first choice provides us with a more detailed insight into how users change their preferences when the travel mode choice is increased by automated travel modes. Most respondents expressed that they will adhere to their behavior patterns: participants who prefer the private car among today’s travel modes will continue to prefer owning a car—either a conventional, or a self-driving one. In this respect, the aspect of ownership also plays a decisive role: either because users do not want to give up their car because of circumstances such as inadequate local mobility supply or because they do not want to give up advantages such as the high flexibility and guaranteed vehicle availability [62] as well as the psychological and emotional comfort of not having to share a vehicle with other people. Interestingly, a change in preference towards mobility as a service such as automated carsharing, as predicted by carsharing supporters or optimists [7,8,9], can only be observed in a very small proportion of today’s car enthusiasts in our sample.
In addition, and especially interesting regarding indirect rebound effects, automation will make the private car attractive for some users who currently prefer PT, possibly resulting in mode shifts. This preference migration can be explained by these users who appreciate that they do not have to drive themselves but at the same time also appreciate the advantages of a private car, namely the availability at all times, high flexibility, as well as comfort [62].
6.2. Carsharing Strongly Benefits from Automation
58.9% of the participants indicated that they are interested in using automated carsharing services rather than conventional carsharing (when directly compared, see Table 2) because they see it as a possible remedy for current shortcomings in carsharing such as the lack of availability and flexibility, having to use more than one mode of transport, and because high costs are completely or partially eliminated [9,16,21]. Fully automated carsharing will offer numerous advantages: comfort and a better use of time will increase as the driving task no longer exists. In addition, the planning and coordination effort will be reduced because the user does not have to search for and locate a suitable vehicle and a station; the vehicle will come to the user on request [61].
The responses regarding fully autonomous modes for the private car and for carsharing show that 58.9% of the respondents prefer the fully automated version for carsharing, compared to only 40.4% for private cars. This significant difference in user preferences (binomial proportion test; p < 0.05) indicates that the acceptance of full automation depends on the increase in the total utility of the respective travel mode. From the user’s point of view, full automation in the private car segment therefore results in comparatively minor improvements while at the same time it greatly increases the benefits and thus the attractiveness of carsharing. It is, therefore, interesting to see how the preferences for full automation shift between private cars and carsharing. In the traditional scenario, there is a significant preference of 82.5% for private cars. In the fully automated scenario, there is also a significant preference for the private car, but it decreases significantly to 74.2% (p < 0.05). In other words, the relative total utilities of private cars and carsharing will converge to some extent in the future. It can therefore be assumed that the full automation of carsharing can help to increase its market potential and expand its share in the modal split.
Furthermore, the analysis of preference migration indicates that some participants who currently prefer PT will shift their preference to automated carsharing services. This change can be attributed to these participants who are accustomed to using mobility as a service rather than having their own vehicle for permanent availability. These participants may also be convinced by their personal attitude that car ownership is generally not necessary, but at the same time they can imagine taking advantage of the greater comfort of a vehicle in the future. Automated carsharing thus offers this user group the optimal combination of flexible mobility, in which ownership does not commit them to regular costs and maintenance of a vehicle, while at the same time providing a high level of comfort in terms of privacy, ease of use, driving time, and short waiting times.
6.3. Public Transport as Loser of Vehicle Automation
If users shift their preferences as described above due to the automation of vehicles in favor of automated private cars and automated carsharing, fewer users will prefer PT. If the travel modes private car and carsharing can strengthen their attractiveness and competitiveness through automation, PT could lose their competitive advantage to the automated travel modes.
The paired comparisons of PT with both carsharing variants show that the preference for PT will decrease significantly from 59.6% to 47.0% (p < 0.05). This decrease can be attributed to a relative improvement in carsharing compared to PT, caused by the automation of carsharing. In this way, the availability and ease of use of carsharing are improved. In addition, driving skills no longer play a role in the use of autonomous carsharing. Using a travel mode without necessarily having to be fit for driving is so far one of the unique selling points of PT.
Generally, this improvement also applies to private cars. Surprisingly, the responses related to the fully automated private car, show an increase in preference for PT from 26.2% to 36.1%. Due to the fully automated system, the private car will lose attractiveness compared to PT. One explanation for this loss could be that due to a lack of confidence in technology, today’s drivers would prefer to use PT instead of a fully automated car.
In the context of automated driving, initial steps have been taken in research and development to bring PT and carsharing together to a certain extent [74]. In the future, for example, automated minibuses that operate more flexibly but still transport more than one person are to be tested. Such new PT concepts are promising if the results of this study are considered.
6.4. The Impact of Individual Characteristics on Travel Mode Choice
In urban areas, a significant increase in sharing models can be expected. While this development certainly has advantages compared to private car use, our study suggests it will take place at the expense of PT, which is popular in urban areas today. For city residents, automated carsharing is an attractive alternative to PT, as it offers a similar travel time with greater flexibility and comfort and without the problem of having to park the vehicle oneself.
Among car owners, we found only a slight decline in private cars as the most popular mode of transport. Carsharing, on the other hand, is becoming more attractive for this group, especially automated carsharing. This change shows that some car owners expect that automated carsharing will continue to converge with private cars and that there will no longer be any major differences between these modes. However, the differences among non-car owners are much more pronounced. Automation makes the private car more attractive for non-car owners as they do not have to drive the vehicles themselves. A similar effect can be observed in carsharing. Accordingly, PT will become less attractive since its great advantage of free use of time while being driven is no longer a unique selling point. Consequently, the positive mode shift effects as far as car owners are concerned are overcompensated by the negative mode shift effects as regards non-car owners.
Our study shows no clear trends in preferences among users when categorized by age. AD and SAV seem to offer different benefits to different age groups. While the younger generation may be more familiar with the technology and therefore more open-minded, older users appreciate that they can continue to be comfortably mobile even with cognitive or physical impairments. Surprisingly, sharing-based models seem to become more attractive with age, both today and in the future. Possibly the emotive bond to the car decreases with age, and carsharing offers older users added value compared to PT, because it can accommodate the changing requirements and limitations of users later in life.
Regarding education, users with a high school degree are much more likely to prefer automated travel modes. This trend can be traced back to the fact that people with a higher education are generally more open-minded about (technical) innovations [75].
The higher a person’s income is, the stronger the trend towards car ownership is, while the preference for PT declines. These changes can certainly be explained by the cost of both travel modes. Regarding the share of autonomous travel modes, there is no clear trend when comparing groups with different incomes. The reason may be that respondents are not yet aware of the price of self-driving technology and automated travel modes.
7. Imitations and Implications for Future Research
Looking at the results as a whole, it is important to note that the study is not representative and that our results can therefore not be directly transferred to the population in general. In addition, it should be noted that the survey was carried out in Germany and that the German transport system and consumer habits certainly differ from those in other countries. These differences may also affect the participants’ assessment of future mobility concepts.
While the figures on user preferences in this study do not exactly reflect the current modal split, the ranking is the same, only the percentages differ. In particular, carsharing has a much smaller market share. Routines and habits also discourage users from choosing an alternative means of transport [73]. Furthermore, we did not consider automated forms of PT in our paired comparison since a recent study showed that, because there is generally no interaction between driver and passenger in PT, users do not perceive a significant difference between automated and non-automated PT [59]. However, it certainly makes sense to analyze how new automated forms of PT, such as automated minibuses for the last mile, will affect users’ future preferences. Against the background that carsharing concepts and new PT concepts may converge in the context of automation, it is of particular interest whether this future development will make PT as attractive as carsharing appears to be in our study. Further research should be carried out on this in the future.
8. Conclusions
The literature on AD often assumes a positive effect on the environment since AV can operate more efficiently and could reduce traffic density, congestion frequency, and the overall number of vehicles [20,25]. Even though researchers agree that sustainability politics will only be successful if the various forms of rebound effects are taken into account [31], unintended rebound effects such as shifts in travel patterns have rarely been considered in this context. Furthermore, most studies argue from a theoretical perspective as empirical evidence is still lacking due to the fact that only few automated forms of travel exist at present. Our study attempts to address this gap by focusing on user preferences. This focus allows us to better understand factors considered when users opt for or against the use of self-driving vehicles in the future, and thus to forecast how users will adapt their mobility behavior with novel offers such as automated carsharing (SAV).
Our empirical analysis supports the hypotheses that, first, users will still prefer traditional cars over fully autonomous ones, and second, they will prefer autonomous carsharing over traditional carsharing. As automation becomes a strong benefit to carsharing, this will increase carsharing’s utility in various ways. Our in-depth analysis of the preference changes further shows that users anticipate these benefits in a way that makes desired effects, such as a shift away from the private car towards mobility as a service, likely. However, it is only a small minority of users who are shifting their preference away from private cars and towards automated carsharing. At the same time, undesired preference changes become apparent, as twice as many users are moving away from PT, towards the automated private car and automated carsharing, so that the effects of this undesirable preference migration may considerably outweigh the positive. Thus, it is quite possible that carsharing will not become more popular at the expense of private cars, as hoped for, but at the expense of PT. In summary, indirect rebound effects in the form of mode shifts from more sustainable modes such as PT to SAV are to be expected.
To address the outlined rebound effects, action must be taken at all levels: users, policymakers and mobility service providers. As people are not always intrinsically motivated to behave in a sustainable manner [76]—as our study also shows—they need additional motivation. Gamification could be used to trigger behavioral changes towards sustainable mobility options. By offering people incentives regarding their health and well-being they could possibly be motivated to walk or cycle more often instead of using an inexpensive and comfortable AV [77,78]. Since there is evidence that not-environmental-related criteria such as comfort and reliability are decisive for travel mode choice [79,80], it is important to strengthen those aspects in sustainable mobility services. The government and public research and development must put more effort into their transportation policy by making sustainable PT more attractive for people and providing incentives for private companies to offer sustainable mobility. Our study provides insights into how automation can play a role here, and that PT also has to change to compete against the possible further development of carsharing and its effects on user behavior. In addition, research results such as those from our previous study on the partial added values of the various travel modes [62] reveal which exact adjustments PT needs to make in order to improve its competitive position or make its service more attractive than automated carsharing. In particular, this would require improvements in travel time, waiting time, and flexibility as well as in comfort and ease of transportation of goods. These requirements can be met if PT relies on smaller units working on demand, so that it converges to a certain extent with automated carsharing. This indicates a need for more research on hybrid models between autonomous carsharing and PT—aspects which we intend to study in future work.
Supplementary Materials
The dataset of our study is available online at https://www.researchgate.net/publication/325450198_Data_ICT4S_Shared_Autonomous_Vehicles_Potentials_for_a_Sustainable_Mobility_and_Risks_of_Unintended_Effects.
Author Contributions
Conceptualization, C.P. and G.S.; Data curation, C.P. and G.S.; Formal analysis, C.P.; Methodology, C.P. and G.S.; Project administration, C.P. and G.S.; Supervision, G.S. and A.B.; Visualization, C.P. and G.S.; Writing—original draft, C.P. and G.S.; Writing—review & editing, C.P., G.S., A.B. and P.B.
Funding
This research was funded by Federal Ministry of Education and Research; grant number 16SV7916.
Conflicts of Interest
The authors declare no conflict of interest.
References
- Gao, P.; Kaas, H.-W.; Mohr, D.; Wee, D. Automotive Revolution: Perspective towards 2030: How the Convergence of Disruptive Technology-Driven Trends Could Transform the Auto Industry; Advanced Industries; McKinsey & Company: New York, NY, USA, 2016. [Google Scholar]
- International Energy Agency. Transport Energy and CO2: Moving towards Sustainability; OECD Publishing: Paris, France, 2009. [Google Scholar]
- Kramers, A.; Höjer, M.; Lövehagen, N.; Wangel, J. ICT for Sustainable Cities: How ICT can support an environmentally sustainable development in cities. In Proceedings of the First International Conference on Information and Communication Technologies for Sustainability ETH, Zürich, Switzerland, 14–16 February 2013; pp. 183–188. [Google Scholar]
- Gössling, S.; Schröder, M.; Späth, P.; Freytag, T. Urban Space Distribution and Sustainable Transport. Transp. Rev. 2016, 36, 659–679. [Google Scholar] [CrossRef]
- Höjer, M.; Wangel, J. Smart sustainable cities: Definition and challenges. In ICT Innovations for Sustainability; Springer: New York, NY, USA, 2015; pp. 333–349. [Google Scholar]
- Owczarzak, L.; Żak, J. Design of passenger public transportation solutions based on autonomous vehicles and their multiple criteria comparison with traditional forms of passenger transportation. Transp. Res. Procedia 2015, 10, 472–482. [Google Scholar] [CrossRef]
- Spieser, K.; Treleaven, K.; Zhang, R.; Frazzoli, E.; Morton, D.; Pavone, M. Toward a systematic approach to the design and evaluation of automated mobility-on-demand systems: A case study in Singapore. In Road Vehicle Automation; Springer: New York, NY, USA, 2014; pp. 229–245. [Google Scholar]
- Bischoff, J.; Maciejewski, M. Simulation of city-wide replacement of private cars with autonomous taxis in Berlin. Procedia Comput. Sci. 2016, 83, 237–244. [Google Scholar] [CrossRef]
- Krueger, R.; Rashidi, T.H.; Rose, J.M. Preferences for shared autonomous vehicles. Transp. Res. Part C Emerg. Technol. 2016, 69, 343–355. [Google Scholar] [CrossRef]
- Binswanger, M. Technological progress and sustainable development: What about the rebound effect? Ecolog. Econ. 2001, 36, 119–132. [Google Scholar] [CrossRef]
- Walnum, H.J.; Aall, C.; Løkke, S. Can Rebound Effects Explain Why Sustainable Mobility Has Not Been Achieved? Sustainability 2014, 6, 9510–9537. [Google Scholar] [CrossRef] [Green Version]
- Pargman, D.; Eriksson, E.; Friday, A. Limits to the Sharing Economy. In Proceedings of the Second Workshop on Computing Within Limits, Irvine, CA, USA, 8–10 June 2016; ACM: New York, NY, USA, 2016. [Google Scholar]
- Milakis, D.; Van Arem, B.; Van Wee, B. Policy and society related implications of automated driving: A review of literature and directions for future research. J. Intell. Transp. Syst. 2017, 21, 324–348. [Google Scholar] [CrossRef]
- Payre, W.; Cestac, J.; Delhomme, P. Intention to use a fully automated car: Attitudes and a priori acceptability. Transp. Res. Part F Traffic Psychol. Behav. 2014, 27, 252–263. [Google Scholar] [CrossRef] [Green Version]
- SAE International. Taxonomy and Definitions for Terms Related to Driving Automation Systems for On-Road Motor Vehicles 6; SAE International: Warrendale, PA, USA, 2016. [Google Scholar]
- Trommer, S.; Kolarova, V.; Fraedrich, E.; Kröger, L.; Kickhöfer, B.; Kuhnimhof, T.; Lenz, B.; Phleps, P. Autonomous Driving—The Impact of Vehicle Automation on Mobility Behaviour; ifmo: Munich, Germany, 2016. [Google Scholar]
- Fagnant, D.J.; Kockelman, K. Preparing a nation for autonomous vehicles: Opportunities, barriers and policy recommendations. Transp. Res. Part A Policy Pract. 2015, 77, 167–181. [Google Scholar] [CrossRef]
- Brown, A.; Gonder, J.; Repac, B. An analysis of possible energy impacts of automated vehicle. In Road Vehicle Automation; Springer: New York, NY, USA, 2014; pp. 137–153. [Google Scholar]
- Ringenson, T.; Höjer, M.; Kramers, A.; Viggedal, A. Digitalization and Environmental Aims in Municipalities. Sustainability 2018, 10, 1278. [Google Scholar] [CrossRef]
- Greenblatt, J.B.; Saxena, S. Autonomous taxis could greatly reduce greenhouse-gas emissions of US light-duty vehicles. Nat. Clim. Chang. 2015, 5, 860–863. [Google Scholar] [CrossRef]
- Walker, W.E.; Marchau, V.A. Dynamic adaptive policymaking for the sustainable city: The case of automated taxis. Int. J. Transp. Sci. Technol. 2017, 6, 1–12. [Google Scholar] [CrossRef]
- Begg, D. A 2050 Vision for London: What Are the Implications of Driverless Transport? Transport Times: London, UK, 2014. [Google Scholar]
- Anderson, J.M.; Nidhi, K.; Stanley, K.D.; Sorensen, P.; Samaras, C.; Oluwatola, O.A. Autonomous Vehicle Technology: A Guide for Policymakers; Rand Corporation: Santa Monica, CA, USA, 2014. [Google Scholar]
- Greenblatt, J.B.; Shaheen, S. Automated vehicles, on-demand mobility, and environmental impacts. Curr. Sustain. Renew. Energy Rep. 2015, 2, 74–81. [Google Scholar] [CrossRef]
- Fagnant, D.J.; Kockelman, K.M.; Bansal, P. Operations of Shared Autonomous Vehicle Fleet for the Austin, Texas Market. Transp. Res. Rec. J. Transp. Res. Board 2015, 2536, 98–106. [Google Scholar] [CrossRef]
- Stocker, A.; Lazarus, J.; Becker, S.; Shaheen, S. North American College/University Market Carsharing Impacts: Results from Zipcar’s College Travel Study 2015; Transportation Research Sustainability Center: Berkeley, CA, USA, 2016. [Google Scholar]
- Burns, L.D. Sustainable mobility: A vision of our transport future. Nature 2013, 497, 181–182. [Google Scholar] [CrossRef] [PubMed]
- Burghout, W.; Rigole, P.J.; Andreasson, I. Impacts of shared autonomous taxis in a metropolitan area. In Proceedings of the 94th Annual Meeting of the Transportation Research Board, Washington, DC, USA, 11–15 January 2015. [Google Scholar]
- Sorrell, S. Energy, Economic Growth and Environmental Sustainability: Five Propositions. Sustainability 2010, 2, 1784–1809. [Google Scholar] [CrossRef]
- Walnum, H.J.; Aall, C. Transportation: Challenges to Curbing Greenhouse Gas Emissions from Road Freight Traffic. In Rethinking Climate and Energy Policies; Springer: Cham, Switzerland, 2016; pp. 243–266. [Google Scholar]
- Santarius, T.; Walnum, H.J.; Aall, C. Conclusions: Respecting Rebounds for Sustainability Reasons. In Rethinking Climate and Energy Policies; Springer: Cham, Switzerland, 2016; pp. 287–294. [Google Scholar]
- Becker, S. Rebound-Effekte bei privater Pkw-Nutzung: Versuch einer empirischen Annäherung. GAIA-Ecolog. Perspect. Sci. Soc. 2015, 24, 132–133. [Google Scholar] [CrossRef]
- Buhl, J.; von Geibler, J.; Echternacht, L.; Linder, M. Rebound effects in Living Labs: Opportunities for monitoring and mitigating re-spending and time use effects in user integrated innovation design. J. Clean. Prod. 2017, 151, 592–602. [Google Scholar] [CrossRef]
- Berkhout, P.H.; Muskens, J.C.; Velthuijsen, J.W. Defining the rebound effect. Energy Policy 2000, 28, 425–432. [Google Scholar] [CrossRef]
- Wang, Q.; Gao, Z.; Tang, H.; Yuan, X.; Zuo, J. Exploring the Direct Rebound Effect of Energy Consumption: A Case Study. Sustainability 2018, 10, 259. [Google Scholar] [CrossRef]
- Du, Q.; Li, Y.; Bai, L. The Energy Rebound Effect for the Construction Industry: Empirical Evidence from China. Sustainability 2017, 9, 803. [Google Scholar] [CrossRef]
- Cuijpers, C. An Empirical Investigation into the Economics of House Heating; Katholieke Universiteit Leuven, Centrum voor Economische Studiën: Leuven, Belgium, 1996. [Google Scholar]
- Klein, Y.L. An econometric model of the joint production and consumption of residential space heat. South. Econ. J. 1988, 55, 351–359. [Google Scholar] [CrossRef]
- Palmer, G. Does Energy Efficiency Reduce Emissions and Peak Demand? A Case Study of 50 Years of Space Heating in Melbourne. Sustainability 2012, 4, 1525–1560. [Google Scholar] [CrossRef]
- Dubin, J.A.; Miedema, A.K.; Chandran, R.V. Price effects of energy-efficient technologies: A study of residential demand for heating and cooling. RAND J. Econ. 1986, 17, 310–325. [Google Scholar] [CrossRef]
- Roy, J. The rebound effect: Some empirical evidence from India. Energy Policy 2000, 28, 433–438. [Google Scholar] [CrossRef]
- Schleich, J.; Mills, B.; Dütschke, E. A brighter future? Quantifying the rebound effect in energy efficient lighting. Energy Policy 2014, 72, 35–42. [Google Scholar] [CrossRef] [Green Version]
- Greening, L.A.; Greene, D.L.; Difiglio, C. Energy efficiency and consumption—The rebound effect—A survey. Energy Policy 2000, 28, 389–401. [Google Scholar] [CrossRef]
- Byun, J.; Park, S.; Jang, K. Rebound Effect or Induced Demand? Analyzing the Compound Dual Effects on VMT in the U.S. Sustainability 2017, 9, 219. [Google Scholar] [CrossRef]
- Chitnis, M.; Sorrell, S.; Druckman, A.; Firth, S.K.; Jackson, T. Turning lights into flights: Estimating direct and indirect rebound effects for UK households. Energy Policy 2013, 55, 234–250. [Google Scholar] [CrossRef] [Green Version]
- Schettkat, R. Analyzing Rebound Effects. In International Economics of Resource Efficiency; Bleischwitz, R., Welfens, P.J.J., Zhang, Z., Eds.; Physica-Verlag HD: Heidelberg, Germany, 2011; pp. 253–278. ISBN 978-3-7908-2600-5. [Google Scholar] [Green Version]
- Davidson, P.; Spinoulas, A. Driving alone versus riding together-How shared autonomous vehicles can change the way we drive. Road Transp. Res. J. Aust. N. Z. Res. Pract. 2016, 25, 51–66. [Google Scholar]
- KIT (Institut für Verkehrswesen, Karlsruher Institut für Technologie). German Mobility Panel; KIT: Karlsruge, Germany, 2017. [Google Scholar]
- Litman, T. Autonomous Vehicle Implementation Predictions; Victoria Transport Policy Institute: Victoria, BC, Canada, 2017. [Google Scholar]
- Pakusch, C.; Bossauer, P.; Shakoor, M.; Stevens, G. Using, Sharing, and Owning Smart Cars. In Proceedings of the 13th International Joint Conference on e-Business and Telecommunications (ICETE 2016), Lisbon, Portugal, 26–28 July 2016; Volume 2, pp. 19–30. [Google Scholar]
- Ravi Sekhar, C. Mode Choice Analysis: The Data, the Models and Future Ahead. Int. J. Traffic Transp. Eng. 2014. [Google Scholar] [CrossRef]
- Jou, R.-C.; Hensher, D.A.; Liu, Y.-H.; Chiu, C.-S. Urban commuters’ mode-switching behaviour in Taipai, with an application of the bounded rationality principle. Urban Stud. 2010, 47, 650–665. [Google Scholar] [CrossRef]
- Simon, H.A. A behavioral model of rational choice. Q. J. Econ. 1955, 69, 99–118. [Google Scholar] [CrossRef]
- Train, K.E. Discrete Choice Methods with Simulation; Cambridge University Press: Cambridge, UK, 2009; ISBN 1-139-48037-5. [Google Scholar]
- Lancaster, K.J. A new approach to consumer theory. J. Political Econ. 1966, 74, 132–157. [Google Scholar] [CrossRef]
- Steg, L. Can public transport compete with the private car? IATSS Res. 2003, 27, 27–35. [Google Scholar] [CrossRef]
- Gardner, B.; Abraham, C. What drives car use? A grounded theory analysis of commuters’ reasons for driving. Transp. Res. Part F Traffic Psychol. Behav. 2007, 10, 187–200. [Google Scholar] [CrossRef]
- Howard, D.; Dai, D. Public perceptions of self-driving cars: The case of Berkeley, California. In Proceedings of the Transportation Research Board 93rd Annual Meeting, Washington, DC, USA, 12–16 January 2014; Volume 14. [Google Scholar]
- Pakusch, C.; Bossauer, P. User Acceptance of Fully Autonomous Public Transport. In Proceedings of the 14th International Joint Conference on e-Business and Telecommunications (ICETE 2017), Madrid, Spain, 26–28 July 2017; Volume 2, pp. 52–60. [Google Scholar]
- Franzen, A. Umweltbewusstsein und Verkehrsverhalten-Empirische Analysen zur Verkehrsmittelwahl und der Akzeptanz Umweltpolitischer Massnahmen; Rueegger Verlag: Zurich, Switzerland, 1997. [Google Scholar]
- Wödl, S.; Pakusch, C.; Bossauer, P.; Stevens, G. Auswirkungen vollautomatisierter PKWs auf die Verkehrsmittelwahl. Int. Verkehrswesen 2017, 69, 68–72. [Google Scholar]
- Pakusch, C.; Weber, T.; Stevens, G.; Bossauer, P. Akzeptanz autonomer Verkehrsmittel: Eine Analyse relativer Mehrwerte selbstfahrender Autos im Vergleich zu heutigen Verkehrsmitteln. In Proceedings of the Tagungsband Wirtschaftsinformatik 2018, Data Driven X—Turning Data into Value, Lünerburg, Germany, 6–9 March 2018; pp. 938–949. [Google Scholar]
- Cyganski, R.; Fraedrich, E.; Lenz, B. Travel-time valuation for automated driving: A use-case-driven study. In Proceedings of the 94th Annual Meeting of the TRB, Washington, DC, USA, 11–15 January 2015. [Google Scholar]
- Eimler, S.C.; Geisler, S. Zur Akzeptanz Autonomen Fahrens-Eine A-Priori Studie. In Mensch & Computer Workshopband; Walter de Gruyter GmbH: Berlin, Germany, 2015; pp. 533–540. [Google Scholar]
- Nordhoff, S. Mobility 4.0: Are Consumers Ready to Adopt Google’s Self-Driving Car? University of Twente: Enschede, The Netherlands, 2014. [Google Scholar]
- Schoettle, B.; Sivak, M. A survey of public opinion about connected vehicles in the US, the UK, and Australia. In Proceedings of the 2014 International Conference on Connected Vehicles and Expo (ICCVE), Vienna, Austria, 3–7 November 2014; pp. 687–692. [Google Scholar]
- Kyriakidis, M.; Happee, R.; de Winter, J.C. Public opinion on automated driving: Results of an international questionnaire among 5000 respondents. Transp. Res. Part F Traffic Psychol. Behav. 2015, 32, 127–140. [Google Scholar] [CrossRef]
- David, H.A. The Method of Paired Comparisons; Griffin: London, UK, 1963; Volume 12. [Google Scholar]
- Rahman, F.; Yoshida, S.; Kojima, A.; Kubota, H. Paired Comparison Method to Prioritize Traffic Calming Projects. J. East. Asia Soc. Transp. Stud. 2015, 11, 2472–2487. [Google Scholar]
- Bortz, J.; Döring, N. Forschungsmethoden und Evaluation; Springer: Berlin, Germany, 2013. [Google Scholar]
- Agresti, A. An Introduction to Categorical Data Analysis; Wiley: New York, NY, USA, 1996; Volume 135. [Google Scholar]
- NIST. Binomial Proportion Test; National Institute of Standards and Technology: Gaithersburg, MD, USA, 2015. [Google Scholar]
- Bamberg, S.; Ajzen, I.; Schmidt, P. Choice of travel mode in the theory of planned behavior: The roles of past behavior, habit, and reasoned action. Basic Appl. Soc. Psychol. 2003, 25, 175–187. [Google Scholar] [CrossRef]
- Nordhoff, S.; van Arem, B.; Merat, N.; Madigan, R.; Ruhrort, L.; Knie, A.; Happee, R. User Acceptance of Driverless Shuttles Running in an Open and Mixed Traffic Environment. In Proceedings of the 12th ITS European Congress, Strasbourg, France, 19–22 June 2017. [Google Scholar]
- Agarwal, R.; Prasad, J. Are individual differences germane to the acceptance of new information technologies? Decis. Sci. 1999, 30, 361–391. [Google Scholar] [CrossRef]
- Kim, K.; Ahn, S.J.G. The Role of Gamification in Enhancing Intrinsic Motivation to Use a Loyalty Program. J. Interact. Mark. 2017, 40, 41–51. [Google Scholar] [CrossRef]
- Vlahogianni, E.I.; Barmpounakis, E.N. Gamification and sustainable mobility: Challenges and opportunities in a changing transportation landscape. Low Carbon Mobil. Futur. Cities Princ. Appl. 2017, 6. [Google Scholar] [CrossRef]
- Kazhamiakin, R.; Marconi, A.; Perillo, M.; Pistore, M.; Valetto, G.; Piras, L.; Avesani, F.; Perri, N. Using gamification to incentivize sustainable urban mobility. In Proceedings of the 2015 IEEE First International Smart Cities Conference (ISC2), Guadalajara, Mexico, 25–28 October 2015; pp. 1–6. [Google Scholar]
- Meurer, J.; Stein, M.; Randall, D.; Rohde, M.; Wulf, V. Social dependency and mobile autonomy: Supporting older adults’ mobility with ridesharing ICT. In Proceedings of the SIGCHI Conference on Human Factors in Computing Systems, Toronto, ON, Canada, 26 April–1 May 2014; ACM: New York, NY, USA, 2014; pp. 1923–1932. [Google Scholar]
- Stein, M.; Meurer, J.; Boden, A.; Wulf, V. Mobility in Later Life: Appropriation of an Integrated Transportation Platform. In Proceedings of the 2017 CHI Conference on Human Factors in Computing Systems, Denver, CO, USA, 6–11 May 2017; ACM: New York, NY, USA, 2017; pp. 5716–5729. [Google Scholar]
Figure 1.
Utility scale values (BTL Model).

Figure 2.
User’s preference migration.

Figure 3.
Group-dependent analysis of first-choice preferences.


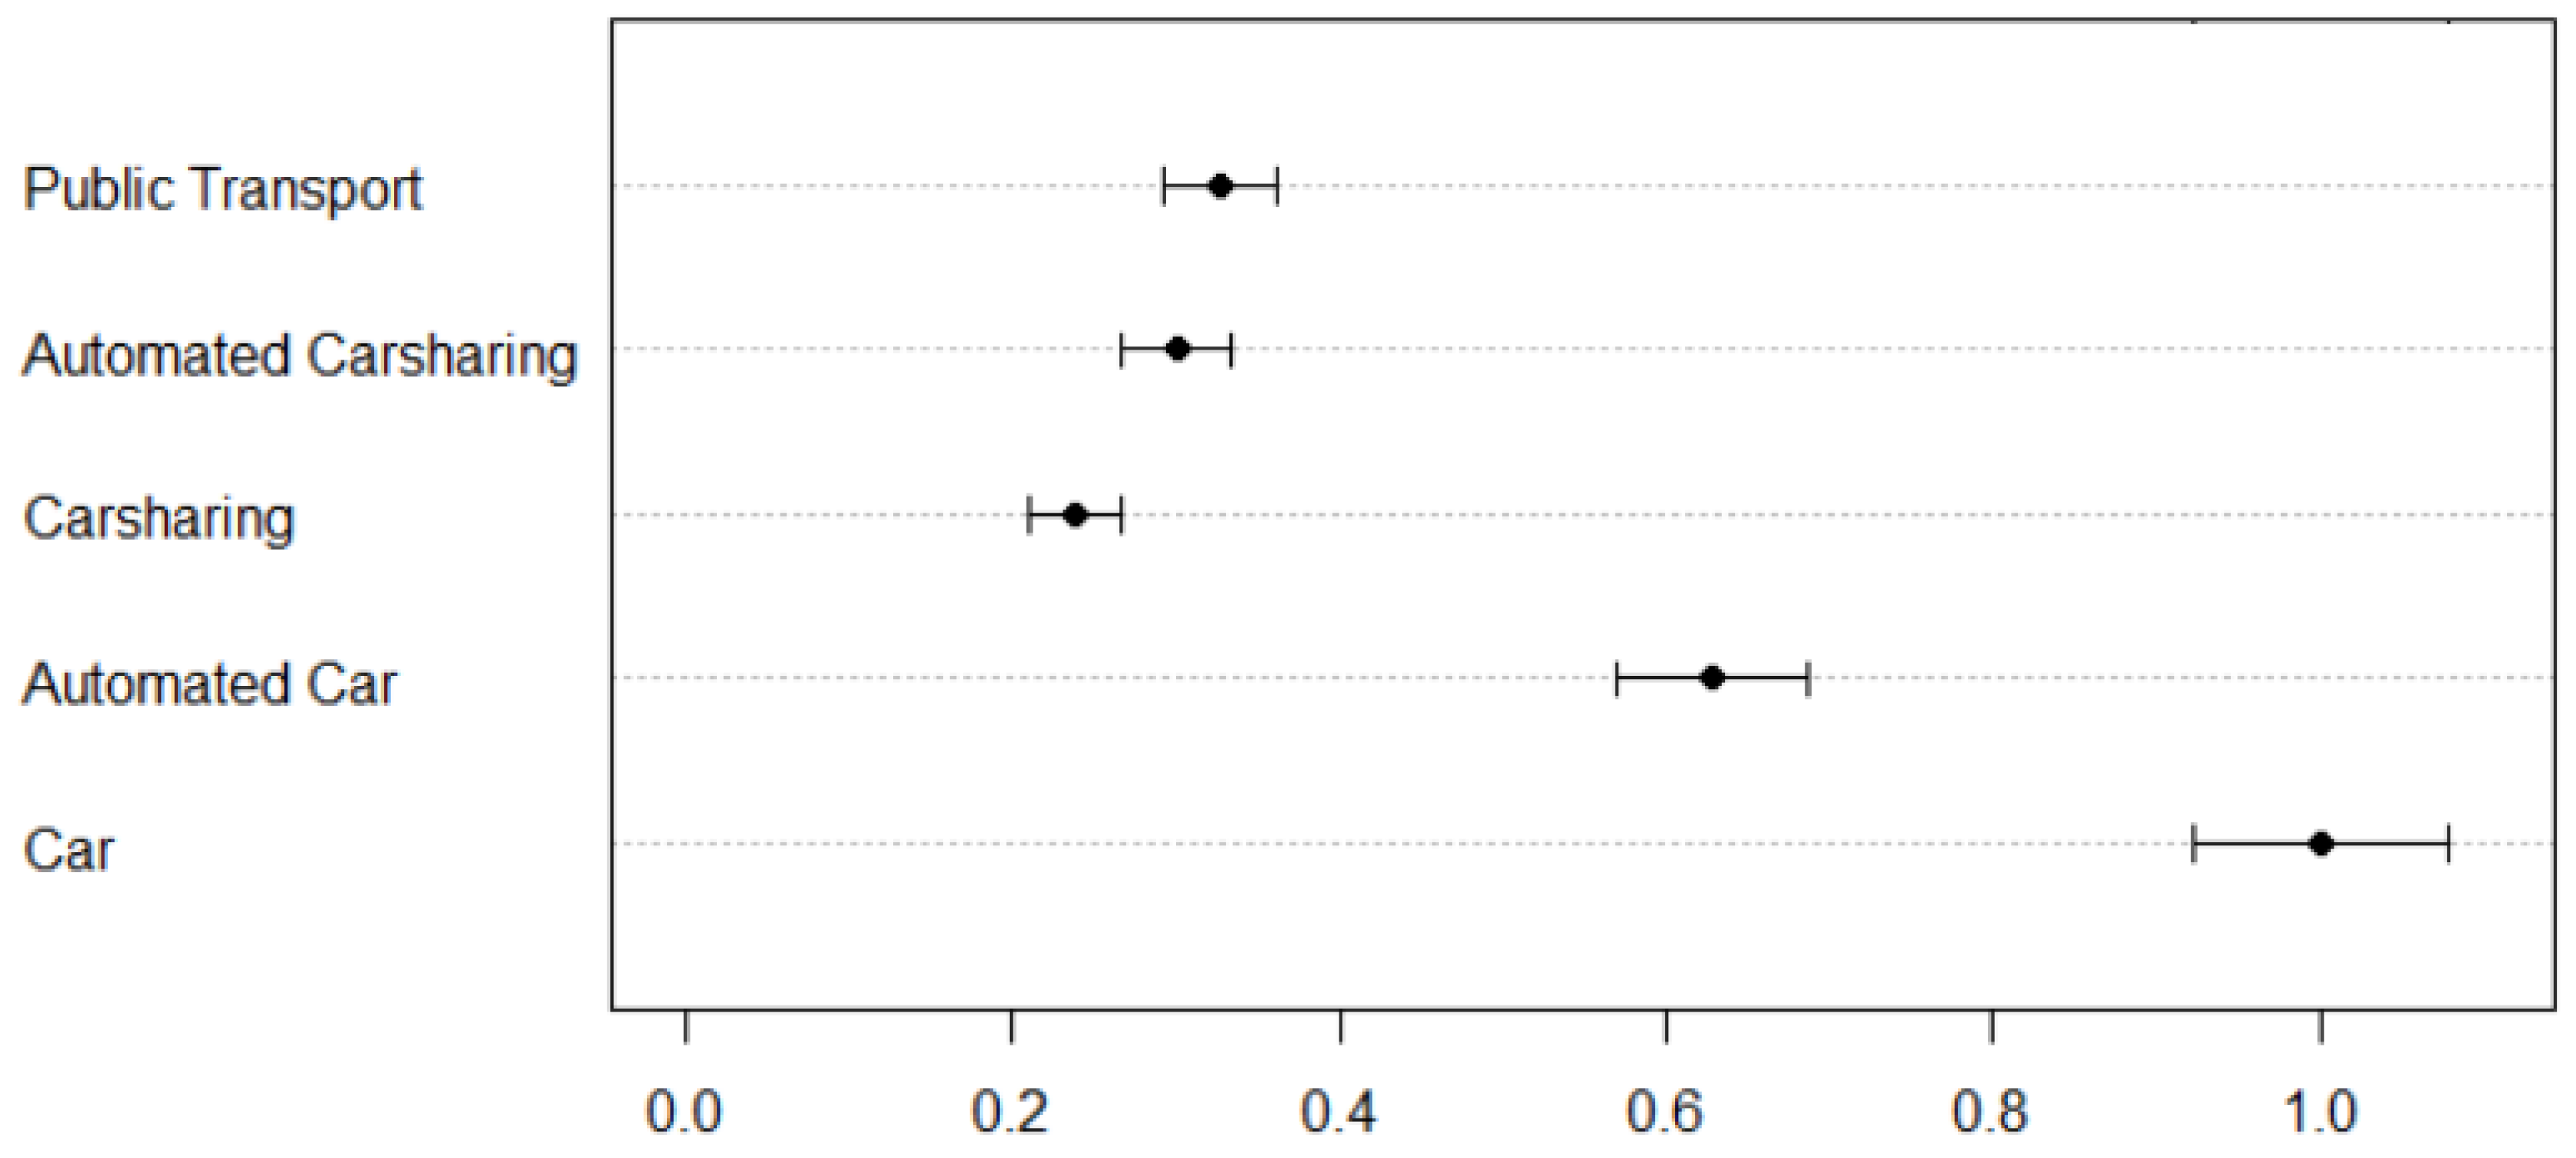
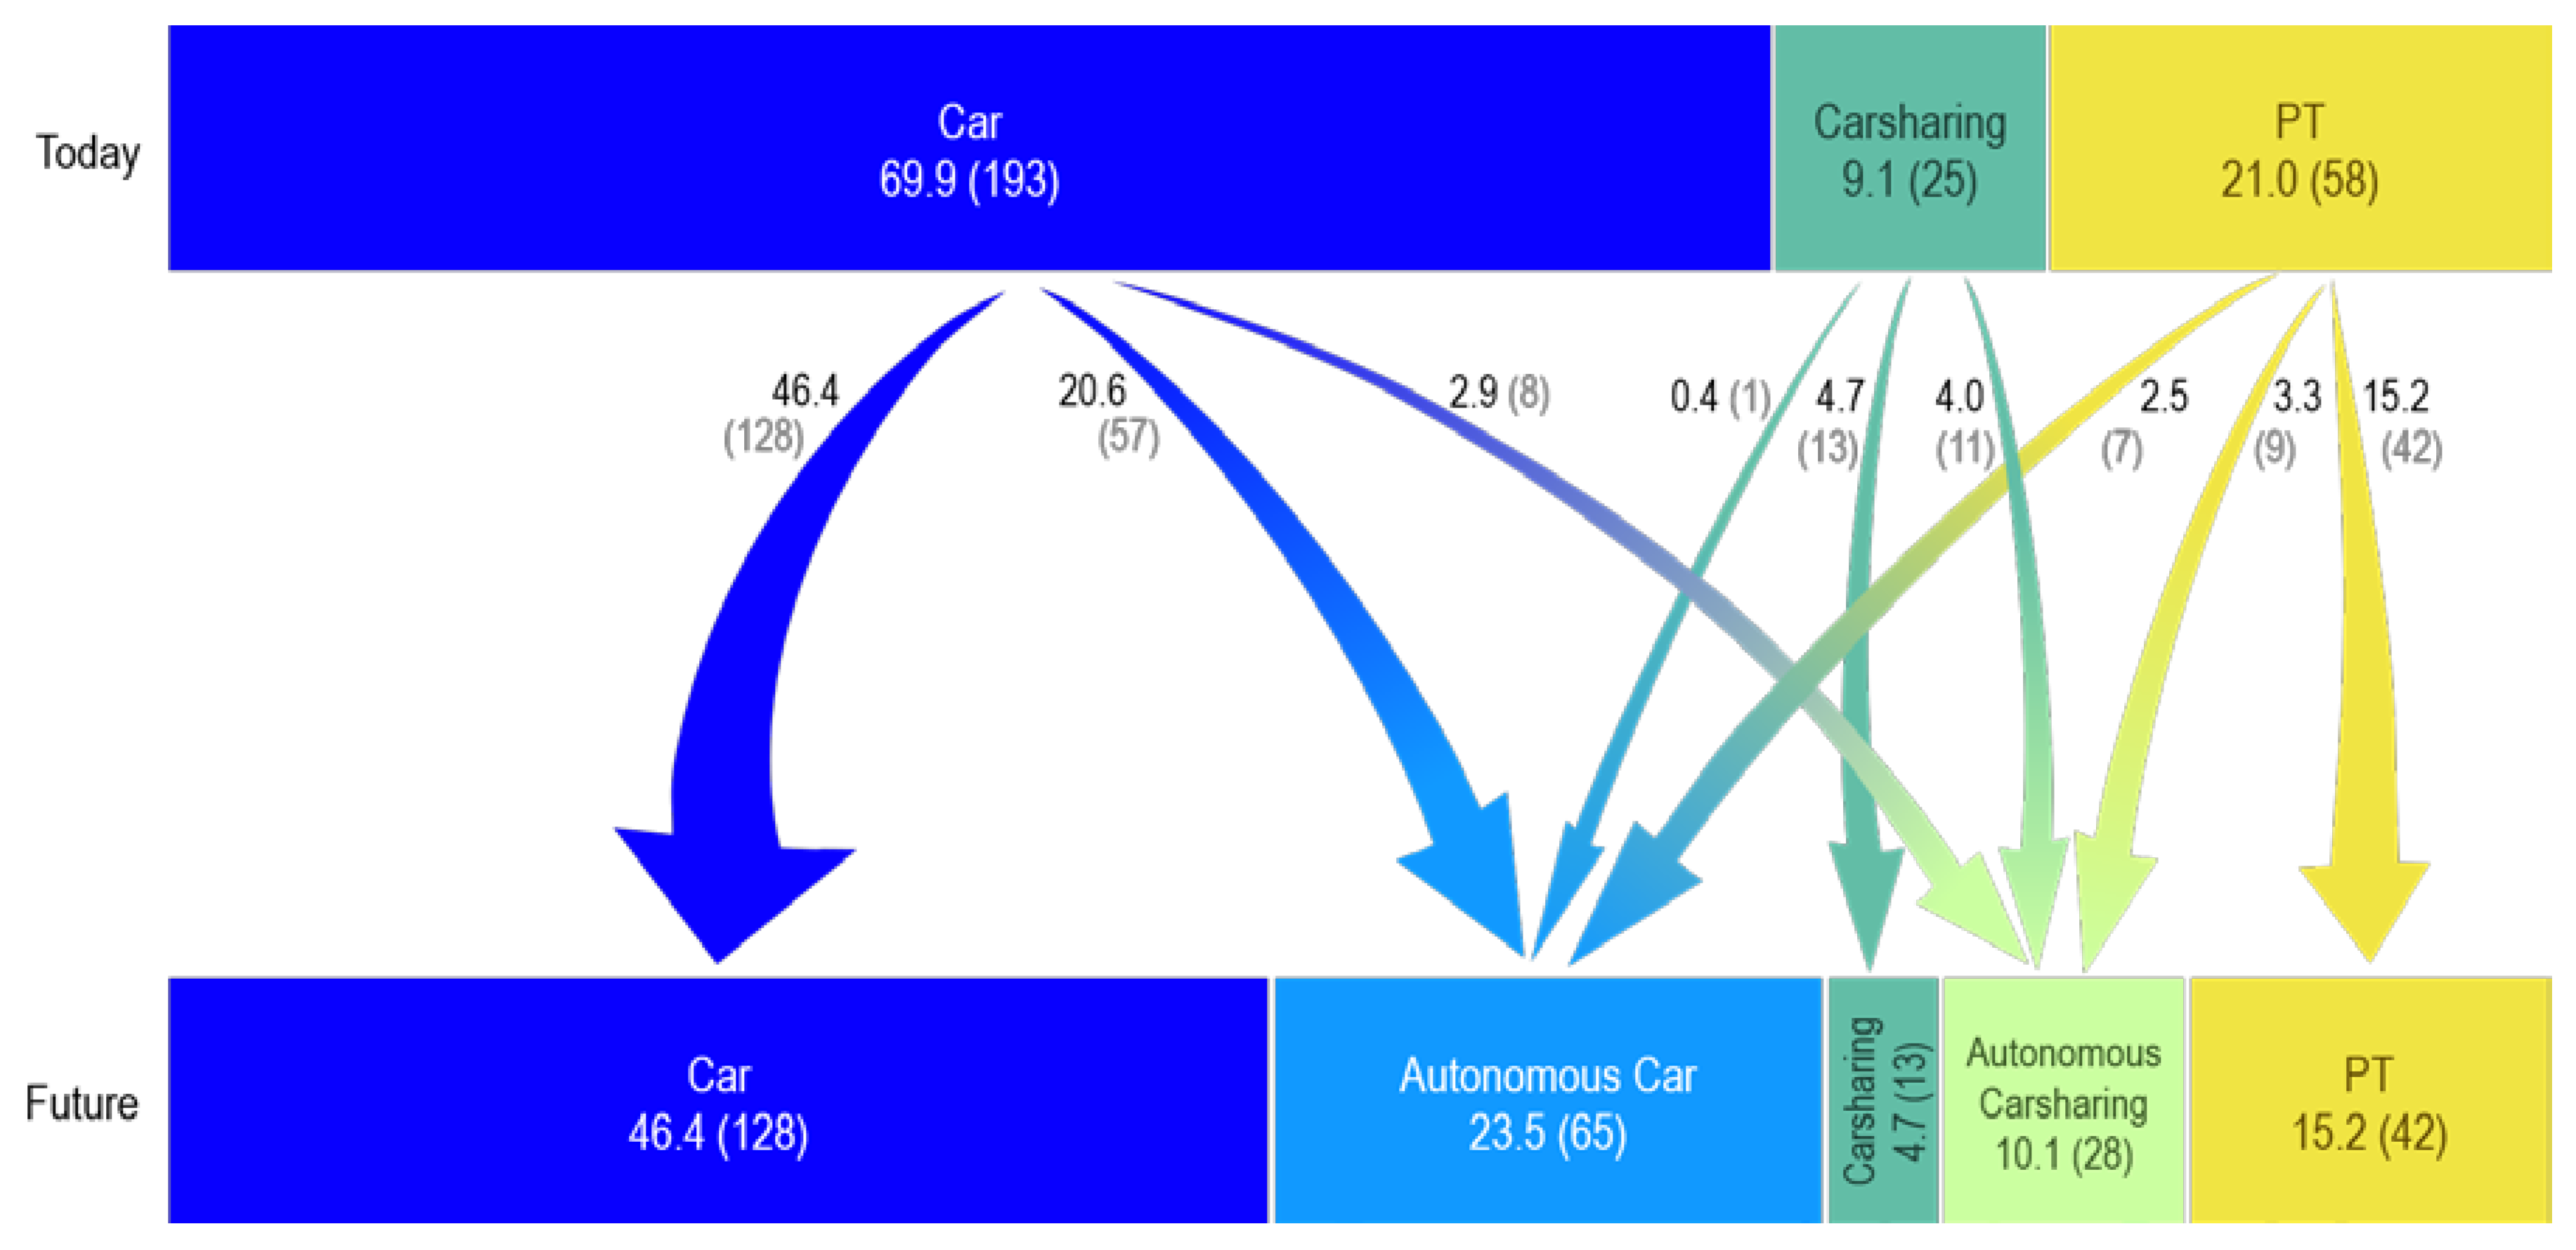
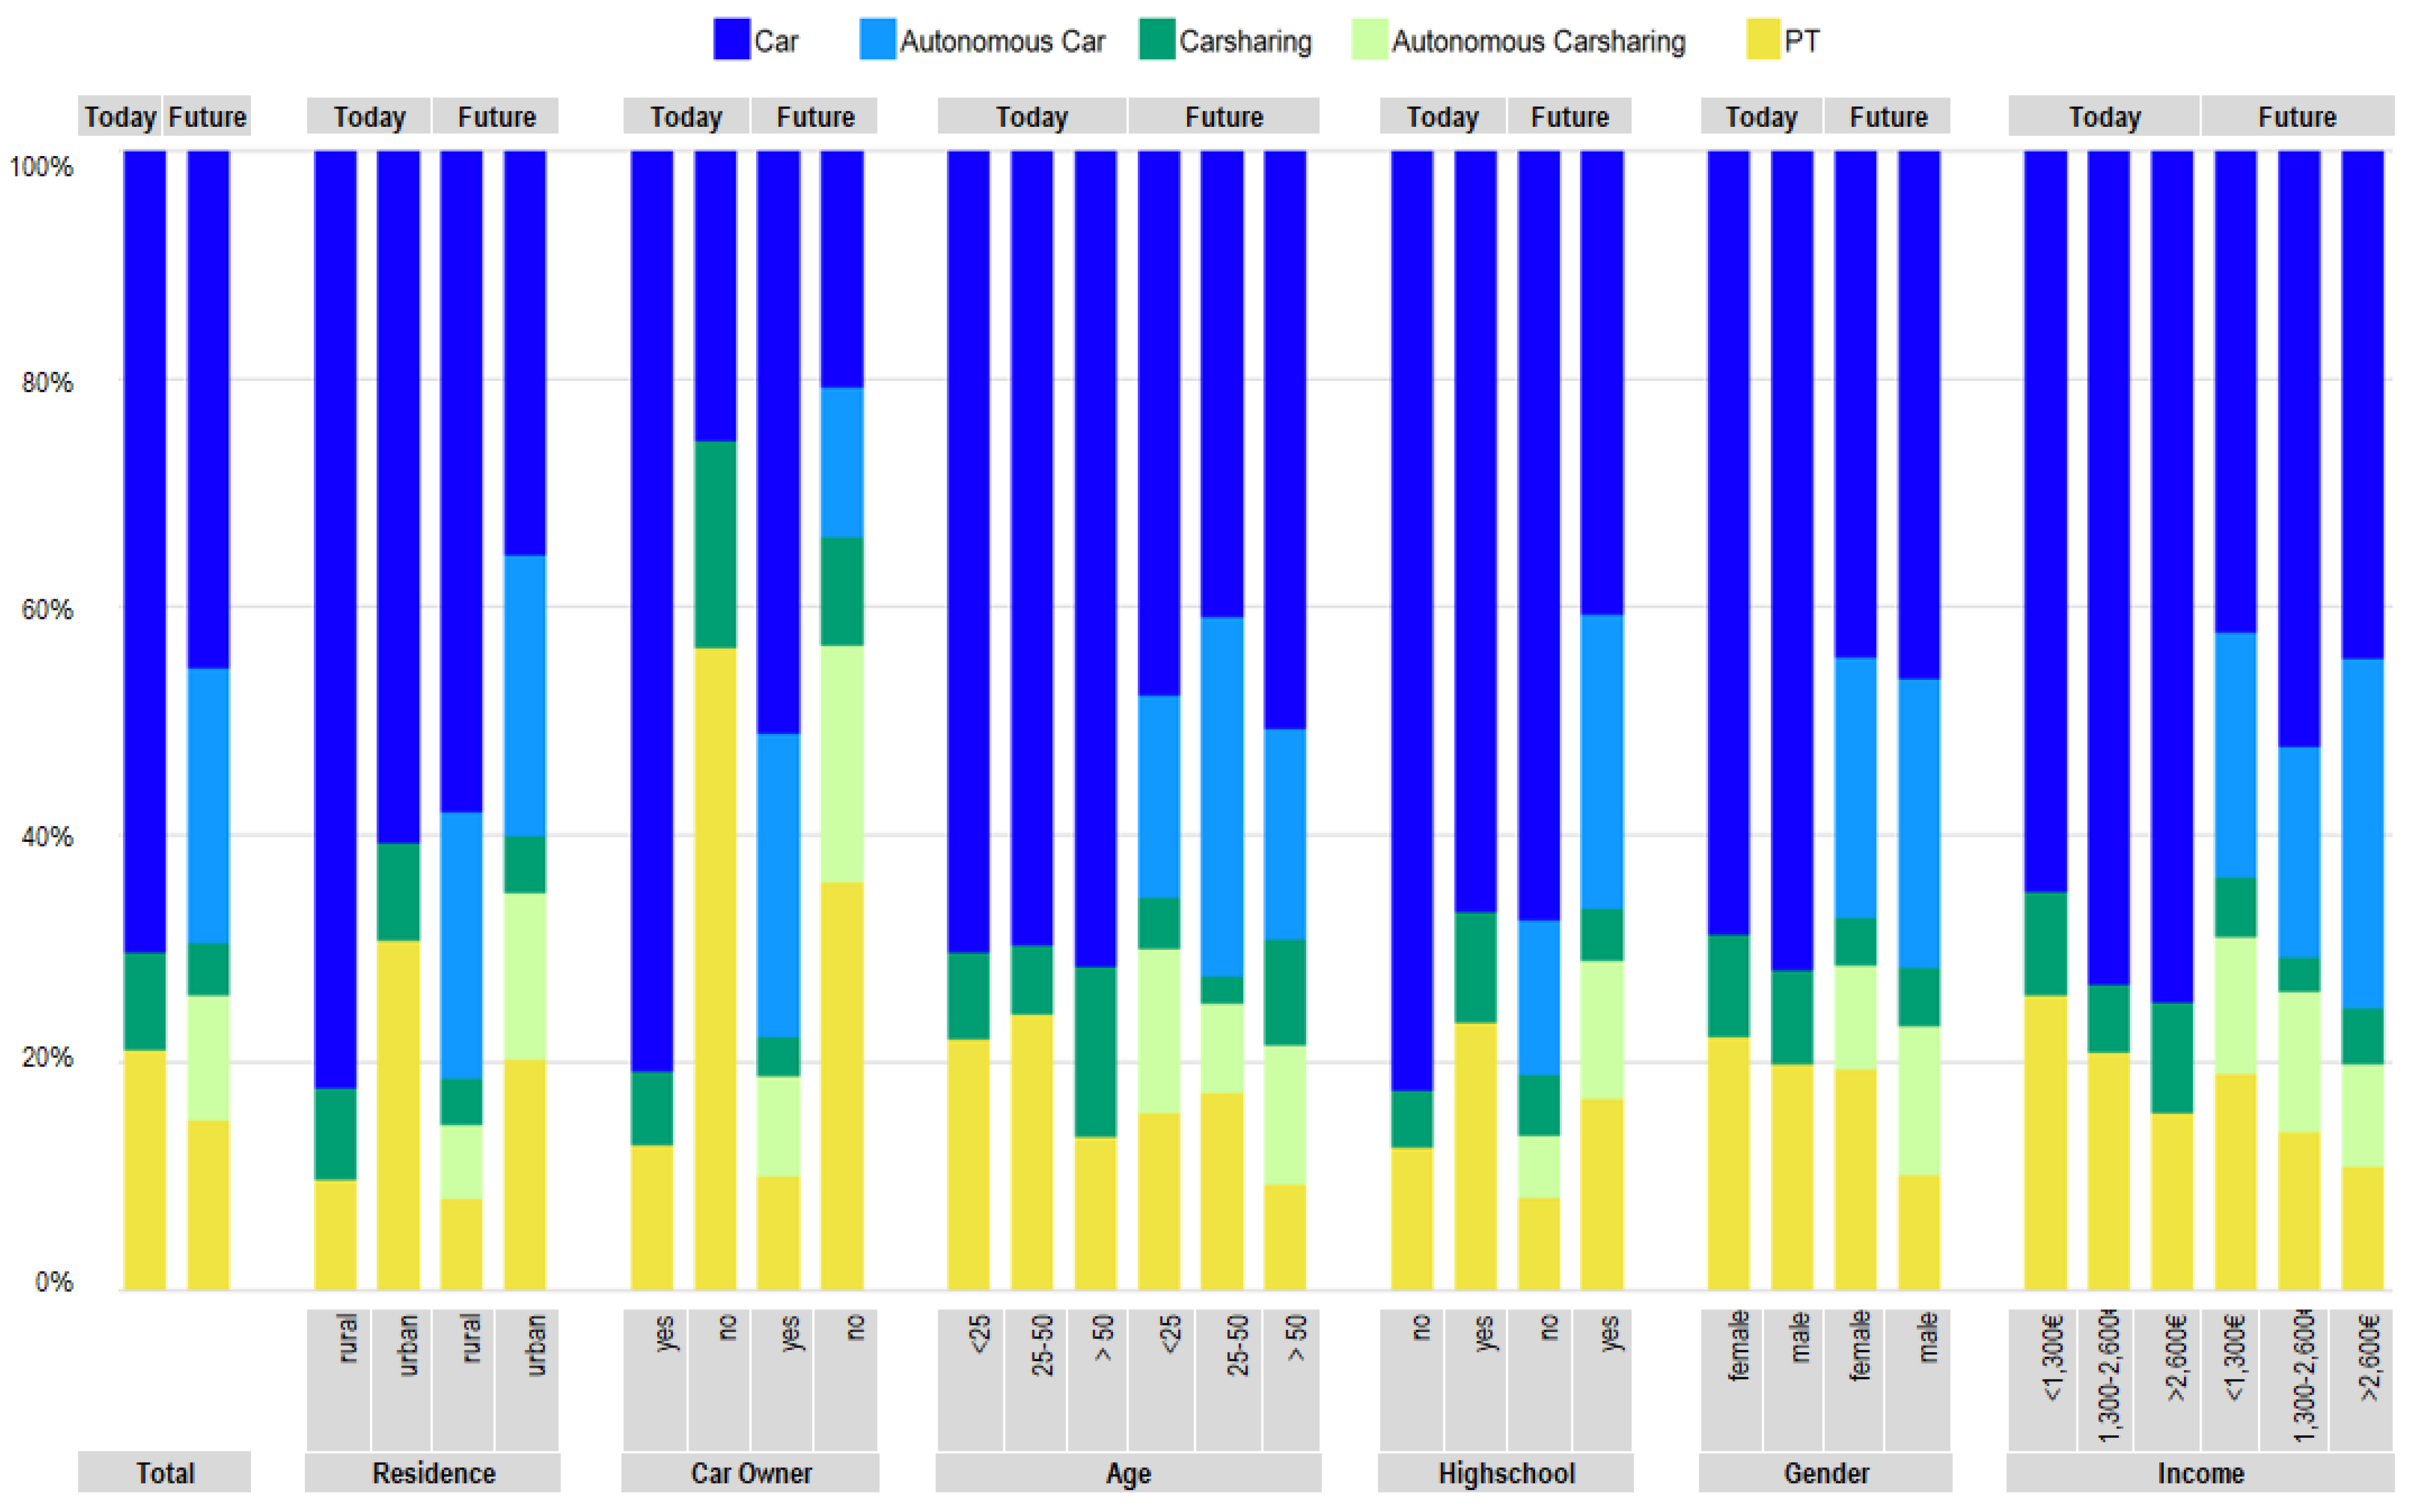
Table 1.
Sample decision matrices of participants 40 and 205.
| P40 | P205 | ||||||||||||
|---|---|---|---|---|---|---|---|---|---|---|---|---|---|
| P40 | C 1 | AC | CS | ACS | PT | Total | P205 | C 1 | AC | CS | ACS | PT | Total |
| C | 0 | 1 | 0 | 1 | 2 | C | 1 | 1 | 1 | 1 | 4 | ||
| AC | 1 | 1 | 1 | 1 | 4 | AC | 0 | 0 | 1 | 1 | 2 | ||
| CS | 0 | 0 | 0 | 1 | 1 | CS | 0 | 1 | 1 | 0 | 2 | ||
| ACS | 1 | 0 | 1 | 1 | 3 | ACS | 0 | 0 | 0 | 1 | 1 | ||
| PT | 0 | 0 | 0 | 0 | 0 | PT | 0 | 0 | 1 | 0 | 1 | ||
| Consistency coefficient: 1.0 | Consistency coefficient: 1.0 | ||||||||||||
1 C = Car; AC = Automated Car; CS = Carsharing; ACS = Automated Carsharing; PT = Public Transport.
Table 2.
Aggregated paired comparison matrix.
| C 1 | AC | CS | ACS | PT | Total | Utility Scale Value | (±CI) | Rank | |||||||||||
|---|---|---|---|---|---|---|---|---|---|---|---|---|---|---|---|---|---|---|---|
| num | % | num | % | num | % | num | % | num | % | ||||||||||
| C | 180 | 59.6 | * 2 | 249 | 82.5 | * | 237 | 78.5 | * | 223 | 73.8 | * | 889 | 1.00 | (±0.08) | 1 | |||
| AC | 122 | 40.4 | * | 199 | 65.9 | * | 224 | 74.2 | * | 193 | 63.9 | * | 738 | 0.63 | (±0.06) | 2 | |||
| CS | 53 | 17.5 | * | 103 | 34.1 | * | 124 | 41.1 | * | 122 | 40.4 | * | 402 | 0.24 | (±0.03) | 5 | |||
| ACS | 65 | 21.5 | * | 78 | 25.8 | * | 178 | 58.9 | * | 160 | 53.0 | 481 | 0.30 | (±0.03) | 4 | ||||
| PT | 79 | 26.2 | * | 109 | 36.1 | * | 180 | 59.6 | * | 142 | 47.0 | 510 | 0.33 | (±0.04) | 3 | ||||
1 C = Car; AC = Automated Car; CS = Carsharing; ACS = Automated Carsharing; PT = Public Transport; 2 *: p ≤ 0.05.
Table 3.
Group-dependent analysis of first-choice preferences.
| Today | Future | |||||||||||||||||||||
|---|---|---|---|---|---|---|---|---|---|---|---|---|---|---|---|---|---|---|---|---|---|---|
| Type | Total | C 1 | CS | PT | Sum 2 | p3 | C | AC | CS | ACS | PT | Sum | p | |||||||||
| N | % | n | % | n | % | n | % | N | n | % | n | % | n | % | n | % | n | % | N | |||
| 302 | 100 | 204 | 70.3 | 25 | 8.6 | 61 | 21.0 | 290 | 128 | 45.4 | 68 | 24.1 | 13 | 4.6 | 31 | 11.0 | 42 | 14.9 | 282 | |||
| Residence | ||||||||||||||||||||||
| rural | 127 | 42.1 | 102 | 82.3 | 10 | 8.1 | 12 | 9.7 | 124 | 0.00 | 72 | 58.1 | 29 | 23.4 | 5 | 4 | 8 | 6.5 | 10 | 8.1 | 124 | 0.00 |
| urban | 175 | 57.9 | 85 | 60.7 | 12 | 8.6 | 43 | 30.7 | 140 | 56 | 35.4 | 39 | 24.7 | 8 | 5.1 | 23 | 14.6 | 32 | 20.3 | 158 | ||
| Car Owner | ||||||||||||||||||||||
| yes | 242 | 80.1 | 190 | 80.6 | 15 | 6.4 | 30 | 12.8 | 235 | 0.00 | 117 | 51.1 | 61 | 26.6 | 8 | 3.5 | 20 | 8.7 | 23 | 10.0 | 229 | 0.00 |
| no | 60 | 19.9 | 14 | 25.5 | 10 | 18.2 | 31 | 56.4 | 55 | 11 | 20.8 | 7 | 13.2 | 5 | 9.4 | 11 | 20.8 | 19 | 35.9 | 53 | ||
| Age | ||||||||||||||||||||||
| <25 | 95 | 31.5 | 64 | 70.3 | 7 | 7.7 | 20 | 22.0 | 91 | 0.15 | 43 | 47.8 | 16 | 17.8 | 4 | 4.4 | 13 | 14.4 | 14 | 15.6 | 90 | 0.03 |
| 25–50 | 139 | 46.0 | 92 | 69.7 | 8 | 6.1 | 32 | 24.2 | 132 | 52 | 40.9 | 40 | 31.5 | 3 | 2.4 | 10 | 7.9 | 22 | 17.3 | 127 | ||
| >50 | 68 | 22.5 | 48 | 71.6 | 10 | 14.9 | 9 | 13.4 | 67 | 33 | 50.8 | 12 | 18.5 | 6 | 9.2 | 8 | 12.3 | 6 | 9.2 | 65 | ||
| High School | ||||||||||||||||||||||
| no | 42 | 22.8 | 33 | 82.5 | 2 | 5.0 | 5 | 12.5 | 40 | 0.14 | 25 | 67.6 | 5 | 13.5 | 2 | 5.4 | 2 | 5.4 | 3 | 8.1 | 37 | 0.01 |
| yes | 233 | 77.2 | 151 | 66.8 | 22 | 9.7 | 53 | 23.5 | 226 | 90 | 40.7 | 57 | 25.8 | 10 | 4.5 | 27 | 12.2 | 37 | 16.7 | 221 | ||
| Gender | ||||||||||||||||||||||
| female | 154 | 51.0 | 99 | 68.6 | 13 | 9.0 | 32 | 22.2 | 144 | 0.84 | 64 | 44.4 | 33 | 22.9 | 33 | 22.9 | 13 | 9.0 | 28 | 19.4 | 144 | 0.24 |
| male | 148 | 49 | 105 | 71.9 | 12 | 8.2 | 29 | 19.9 | 146 | 64 | 46.4 | 35 | 23.6 | 35 | 5.1 | 18 | 13.0 | 14 | 10.1 | 138 | ||
| Income | ||||||||||||||||||||||
| <1300€ | 124 | 41.1 | 78 | 65.0 | 11 | 9.2 | 31 | 25.8 | 120 | 0.36 | 49 | 42.2 | 25 | 21.6 | 25 | 21.6 | 14 | 12.1 | 22 | 19.0 | 116 | 0.49 |
| 1300–2600€ | 72 | 23.8 | 49 | 73.1 | 4 | 6.0 | 14 | 20.9 | 67 | 34 | 52.3 | 12 | 18.5 | 12 | 18.5 | 8 | 12.3 | 9 | 13.8 | 65 | ||
| >2600€ | 106 | 35.1 | 77 | 74.8 | 10 | 9.7 | 16 | 15.5 | 103 | 45 | 44.6 | 31 | 30.7 | 31 | 30.7 | 9 | 8.9 | 11 | 10.9 | 101 | ||
1 C = Car; AC = Automated Car; CS = Carsharing; ACS = Automated Carsharing; PT = Public Transport; 2 Number of consistent preference choice assessments for that category; 3 p-value of χ2.
© 2018 by the authors. Licensee MDPI, Basel, Switzerland. This article is an open access article distributed under the terms and conditions of the Creative Commons Attribution (CC BY) license (http://creativecommons.org/licenses/by/4.0/).
Share and Cite
MDPI and ACS Style
Pakusch, C.; Stevens, G.; Boden, A.; Bossauer, P. Unintended Effects of Autonomous Driving: A Study on Mobility Preferences in the Future. Sustainability 2018, 10, 2404. https://doi.org/10.3390/su10072404
AMA Style
Pakusch C, Stevens G, Boden A, Bossauer P. Unintended Effects of Autonomous Driving: A Study on Mobility Preferences in the Future. Sustainability. 2018; 10(7):2404. https://doi.org/10.3390/su10072404
Chicago/Turabian StylePakusch, Christina, Gunnar Stevens, Alexander Boden, and Paul Bossauer. 2018. "Unintended Effects of Autonomous Driving: A Study on Mobility Preferences in the Future" Sustainability 10, no. 7: 2404. https://doi.org/10.3390/su10072404
Note that from the first issue of 2016, this journal uses article numbers instead of page numbers. See further details here.