Impacts of Financial Inclusion on Non-Performing Loans of Commercial Banks: Evidence from China


1
School of Economics and Business Administration, Chongqing University, Chongqing 400030, China
2
School of Management and Engineering, Nanjing University, Nanjing 210093, China
*
Author to whom correspondence should be addressed.
Sustainability 2018, 10(9), 3084; https://doi.org/10.3390/su10093084
Submission received: 26 July 2018
/
Revised: 23 August 2018
/
Accepted: 29 August 2018
/
Published: 30 August 2018
Abstract
:Non-performing loans of commercial banks have long hampered the development of the banking sector, and directly reflect the credit risk and asset quality. With the continuous development of the financial industry, the introduction of financial inclusion has greatly eased the shortage of funds, and narrowed the gap between poor and rich. However, whether the promotion of financial inclusion in the financial industry could affect the non-performing loans of commercial banks has not been verified. Therefore, this paper discusses the possible associations between financial inclusion and non-performing loans of commercial banks on the regional level, constructs a panel data model by selecting the data of 31 provinces (including 4 municipalities) in China from 2005 to 2016, and uses the fixed effect model for empirical test. The empirical results (from an overall national sample) reveal a negative impact of the financial inclusion on non-performing loans. Moreover, the development of the banking sector and the regional consumption could enhance the impact of financial inclusion, while government intervention and unemployment could reduce the impact of financial inclusion. From the analysis of the regional sample, when the development of financial inclusion reaches a high level, the lagged financial inclusion promote the non-performing loans of commercial banks; however, when the financial inclusion is underdeveloped, the development of commercial banks act as a disincentive to non-performing loans. Therefore, the local governments should pay more attention to the influences of financial inclusion on the financial industry, in order to maintain the stability of banking asset quality. In addition, the negative impact of financial inclusion on non-performing loans of commercial banks is significant in China central region, while its impacts in China eastern and western regions are not significant. This indicates that the development of the financial industry and economy can hamper the effects of financial inclusion. It is necessary to adjust the financial resource allocation according to the characteristics of different regions in China, so that the financial inclusion can effectively promote the regional financial industry upgrade, improve regional capital flow efficiency, and fundamentally reduce the non-performing loans of commercial banks. According to the sample analysis by time, there is a significant negative impact relationship between inclusive finance and commercial banks’ non-performing loans after the financial crisis, while the impacts before and during the financial crisis are not significant. This demonstrates that the impact of the global financial crisis on China’s regional economy has further enhanced the inefficiency of the inclusive financial system on credit risk, which in turn, helps commercial banks better maintain asset quality stability.
1. Introduction
After the 2008 global financial crisis, many countries have begun their economic recovery, and the banking sector plays an important role in this process. Compared with other entity industries, the products of the banking sector are intangible, so that the revenues and risks are impossible to calculate accurately. With the characteristics of high risk and high profit, the banking sector could not only promote the development of the regional economy, but also restrict the development of the real economy. However, the risk and profit of the banking sector are not antagonistic, and they are closely linked. In the process of achieving higher profit, many banks have tried to get more customers and maintain the stability of earnings through expanding the scale of loans. The banking loans can enhance the interaction between banks and customers. However, the overexpansion in scale is likely to trigger a series of potential risks. Among these risks, the credit risk as one of the three major risks in the banking sector will affect the asset quality of banks and result in non-performing loans. From the perspective of long-term development, non-performing loans have become a major factor restricting the sustainable development of the banking sector, yet, it has not been solved effectively. By analyzing the impact of the last global financial crisis, it can be found that the credit risk will not only affect the overall economic development of many countries, but also generate a domino effect in the interactive network of these countries [1]. Compared with the developed countries, the banking systems in the developing countries is less developed so that these countries will suffer a higher risk [2]. Meanwhile, the banking sector is the core of the financial sector in many developing countries and, therefore, the development of the banking sector could affect these countries’ economic development.
China is one of the most promising developing countries in the world at present, and the development of China’s banking sector has attracted attention of many researchers. State-owned banks had naturally occupied the dominant position of the banking industry, before the implementation of China’s reform and opening-up policy. Since the reform and opening up, many commercial banks began to use their unique advantages to gain more consumer groups and played an important role in China’s financial system. As the market share of commercial banks was continuously increasing, commercial banks with various financial products were in sharp contrast to state-owned banks, but this process had also led to the emergence of the asset quality problems. According to the data from China Banking Regulatory Commission (CBRC), non-performing loans have recently been continuously increasing. The ratio of non-performing loan in China’s commercial banks has increased from 0.94% to 1.74%, from the 1st quarter of 2012 to the 4th quarter of 2016 (see Figure 1). This possibly indicates that some management measures of commercial banks do not mitigate the impact of asset quality problems effectively [3]. From the perspective of local governments, government officers have tried different policies to control the emergence of non-performing loans, but these policies do not achieve the desired results [4]. Non-performing loans are an indication of credit risk, which could restrict the development of the banking industry to a certain extent. To solve this problem, many commercial banks have to reduce the size of loans, which further worsens some customers’ financial status. From the perspective of the formation of non-performing loans, the lack of users’ solvency is an important reason for the asset quality problem. However, in China’s regional economic development process, economic activities rely on the interactive network of enterprises. When these enterprises encounter the financial problems as mentioned, it usually leads to massive non-performing loans [5]. In facing with the dilemma of China’s banking sector, it has become a common concern for financial practitioners and government officers to get a balancing relationship between financial resources and potential risks.
In order to solve the financial problems of more users, the introduction of financial inclusion plays an important role in narrowing the gap between rich and poor. The core of financial inclusion is to provide more financial services for more people in order to help them get rid of the financial difficulties, thus narrowing the gap between rich and poor. In the process of constructing the inclusive financial system, the interaction between financial institutions and users is the key factor of promoting the financial industry’s development. With more users getting the financial services they need, it can not only increase the regional capital flow, but also provide a guarantee for the capital chain of enterprises’ network. From the perspective of the availability of financial services, the pattern of financial inclusion is different from that of the commercial banks. As the banking sector has long been affected by non-performing loans, it makes the strategy of decreasing loans to be preferred by many banks. However, the basic concept of financial inclusion is to promote the diversity of financial services and the inclusiveness of financial institutions, which may mitigate the impact of the strategy of decreasing loans to a certain extent [6]. The main function of the inclusive financial system and the banking sector is to provide financial services to users by meeting their capital requirements. During the process of promoting financial development, the inclusive financial system may lead to some potential risks, which may further cause the asset quality problem.
The widely implementing of financial inclusion policy in China has played an efficient role in funding individuals and enterprises. However, whether financial inclusion would bring more credit risks during the process of enhancing the inclusiveness of the financial industry needs to be discussed and analyzed. According to the asset quality of commercial banks, the solvency of enterprises, which will directly affect non-performing loans, can be considered as an important factor. Compared with the operation mode of traditional enterprises, current enterprises are affected by upstream and downstream enterprises, which makes the capital network more inseparable [7]. This tight network structure is accompanied with the corresponding chain reaction, which is a difficult problem for banks. The introduction of financial inclusion concept has eased the financial distress of enterprises and extended their life cycles. Whether the development of financial inclusion could affect non-performing loans of commercial banks with regard to the features of China’s regional economic development has not been thoroughly discussed. Furthermore, based on the development strategy of China’s economy, non-performing loans of commercial banks at the regional level can attract more concern from financial regulators and local governments, which also reflects the importance of commercial banks’ non-performing loans to regional economies. Therefore, based on the regional level, this paper explores the impact of financial inclusion on non-performing loans of commercial banks, in order to provide corresponding solutions for alleviating the problem of banks’ asset quality, and proposes policy recommendations to help financial regulators and local governments better promote the development of financial industry.
Among the existing research on factors of non-performing loans, there are mainly two key perspectives: the bank-specific factors and the macroeconomic factors. In the earliest studies of non-performing loans, the researchers pointed out that all kinds of risks faced by banks would induce asset quality problems, which could bring potential credit risks [8]. In order to better explore the characteristics of determinants of non-performing loans, the researchers analyzed the relationships between bank-specific factors and non-performing loans in different countries. Quagliariello (2007) analyzed the relationship between the loan loss provision and the non-performing loans from the perspective of business cycle, and found that the business cycle has a significant impact on the earnings and risks of banks [9]. Podpiera and Weill (2008) found that poor management of banks would directly reduce cost efficiency and generate more potential risks, which could lead to the increase of the loan ratio [10]. Shehzad et al. (2010) used the internal characteristics of banks to analyze the determinants of non-performing loans, and found that both the regulatory approach and ownership have significant effects on the increase amount of non-performing loans [11]. Espinoza and Prasad (2010) found that increasing the size of loans has a lagging effect on non-performing loans, which also makes it difficult for bank managers to deal with the consequences of credit risk in time [12]. Louzis et al. (2012) delivered a view of bank-specific determinants. He found the quality of bank management significantly promotes non-performing loans [13]. Ghosh (2015) pointed out that there is a strong relationship among the liquidity risk, asset size, and cost efficiency of the banking sector and non-performing loans, which would be affected by social factors [14]. Guan et al. (2017) analyzed the relationship between the carbon intensity of loans and non-performing loans according to China’s environmental protection strategy, and found that the green credit would enhance the credit risk of banks and promote the non-performing loans [15]. Through the analysis of bank-specific view, it can be seen that the emergence of the non-performing loans problem could be largely affected by the bank management and the size of loans. The factors in a bank-specific view mainly come from the internal structure of banks, from which it is difficult to predict the corresponding results.
In order to define more determinants of non-performing loans, researchers began to focus on the factors from a macroeconomic perspective, which refers to the regional economic development and the economic theories. Salas and Saurina (2002) found significant correlation among the growth of GDP, the size of banks, and the growth of loans and non-performing loans in commercial banks [16]. Festic et al. (2011) analyzed the relationship between the macroeconomic factors and the systemic risk of the banking sector, and found that the economic activity acted as a signal of overheating, which would promote the non-performing loans ratio [17]. Mileris (2012) examined the impact of macroeconomic factors on bank asset quality from the perspective of credit risk, and found that both unemployment rate and interest rate could significantly promote the emergence of non-performing loans [18]. Messai and Jouini (2013) found that in a preferable economic situation, real interest rates and unemployment rates could exactly increase the non-performing loans ratio, which also reflects the impact of the balance of supply and demand on the asset quality of banks [19]. Beck et al. (2015) used a number of national samples to analyze the influence of macroeconomic factors on non-performing loans, and found that real GDP growth, stock prices, exchange rates, and interest rates greatly decrease the scale of non-performing loans, while the negative effect of the stock is stronger in developed countries [20]. Konstantakis et al. (2016) used the characteristics of the economic crisis to analyze the determinants of non-performing loans, and pointed out that macroeconomic factors and financial factors could significantly change the scale of banks’ non-performing loans [21]. According to the macroeconomic analysis, some indicators of the regional economy and the financial market provide a certain relationship with the non-performing loans. Thus, the banking industry would be easily influenced by external factors in the regional economic activities.
As we have already known, both the bank-specific and macroeconomic perspectives agree that non-performing loans of commercial banks will be influenced by many factors, which consist of the internal management process and the external economic environment. Besides the factors we have mentioned before, the non-performing loans of China’s banking sector would be specially affected by government factors, which means that it could be more difficult to keep the asset quality. Cull and Xu (2000) explored the influencing factors of bank loans from the perspective of government subsidies, and pointed out that the government intervention would reduce the restrictions of lenders’ repayment ability, leading to a higher credit risk [22]. Yu and Zhao (2009) pointed out that local governments use the strategy of tax-raising to transfer non-performing loans of commercial banks to social groups, which is difficult to control the generation of non-performing loans [23]. Tan et al. (2012) analyzed the impact of government intervention on non-performing loans of commercial banks, and drew the conclusion that the government fiscal system could promote state-owned enterprises to generate more potential problem loans, while the regional legal environment would limit the growth of non-performing loans [24]. Therefore, government factors play an important role in the non-performing loans of China’s banking sector, and exert a lasting influence on the development of financial industry.
In terms of financial inclusion, this concept was proposed in 2005, and the existing studies in this field are still in the exploration stage. The focus of research of financial inclusion is divided into three parts: the definition of financial inclusion, the measurement of financial inclusion, and the role of financial inclusion. Raddatz (2006) pointed out that financial inclusion will better solve the problem of the gap between rich and poor, thus maintaining social stability [25]. Beck et al. (2007) analyzed the impact of financial inclusion on micro-individuals, pointing out that improving the construction of financial industry could bring more financial services to users, which helps alleviate their capital problems [26]. In the study of measurement, researchers have considered many financial factors, and are constantly trying to integrate these factors into the financial inclusion index for enhancing the universality and accuracy of measurement methods. Sarma (2011) constructed a measure of financial inclusion index, and pointed out that the accurate measurement needs to consider the availability and usability of financial services [27]. Gupte et al. (2012) used the dimensions of expansion, use, convenience, and cost of financial transactions to enhance the richness of financial inclusion measures [28]. In order to better understand the definition of financial inclusion, researchers tend to pay more attention to the inclusiveness of financial institutions and the basic features of this concept. Chakravarty and Pal (2013) defined financial inclusion from a systemic perspective, pointing out that this kind of financial system could systematically enhance the inclusiveness of financial institutions and enable more users to enjoy financial services [29]. Wang and Guan (2017) summarized the measurement methods of financial inclusion, and pointed out that there may be correlation between different dimensions of financial inclusion, so it would obtain a more accurate measurement method with using the method of weight differentiation [30]. Compared with the research on the definition and measurement methods of financial inclusion, the research on the role of financial inclusion can better present its core value. Turvey and Xiong (2017) analyzed the impact of financial inclusion on rural e-commerce in China, and found that it could improve rural business and enable more users to enjoy the benefits of Internet technology [31]. Corrado and Corrado (2017) examined the relationship between financial inclusion and the inclusiveness of financial institutions, pointing out that financial inclusion can extend consumption and investment plans, thus providing a guarantee for sustainable regional economic development [6]. Zhou et al. (2018) explored the relationship between financial inclusion and regional economic growth, and found that inclusive finance can promote the output of regional economic activities in the aspect of financial resource allocation [32]. Among the research results of financial inclusion, this concept could strengthen the depth of the financial industry and maintain the social stability.
According to the existing research of non-performing loans and financial inclusion, it can be found that few studies are focused on the relationship between financial inclusion and non-performing loans of commercial banks. However, in the process of regional economic development, exploring the impact of non-performing loans of commercial banks from the regional perspective can better help financial regulators in developing countries to control the asset quality of banking sector. In addition, the construction of the inclusive financial system can enhance the interaction between users and financial institutions, and expand the scope of financial services. Whether financial inclusion exerts an influence on non-performing loans of commercial banks is not only a concern of researchers in financial field, but also affects the policy making process of financial regulators. From the perspective of the development of the financial industry, examining the relationship between financial inclusion and on non-performing loans of commercial banks will better realize optimal allocation of financial resources and avoid the waste of these resources, thus promoting the construction of financial system.
The structure of this paper is as follows: Section 2 introduces the measurement of financial inclusion and the logical relationship between financial inclusion and non-performing loans; Section 3 includes data sources, variable construction, descriptive statistics, and empirical model construction; Section 4 is the empirical analysis, including unit root test of variables, the discrimination of panel data model type, and regression analysis; Section 5 presents the conclusions and suggestions.
2. Financial Inclusion and Non-Performing Loans of Commercial Banks
2.1. Measurement of Financial Inclusion
Related research on financial inclusion has shown that the measurement method is often carried out around the inherent meaning of this concept, which is providing more financial services for more people and helping them to enjoy these services. According to the intrinsic meaning of financial inclusion, it can be found that the availability and usability of financial services are important components. In addition, the utility of financial services is also an important component to get more users’ attention, which reflects the happiness brought by the inclusive financial system [27]. From the social perspective of the financial industry, the affordability of financial services may have a corresponding impact on the construction of inclusive financial system, indirectly affecting the quality of financial services [32]. Therefore, this paper will measure financial inclusion from four dimensions, namely, the availability, usability, utility, and affordability of financial services. The specific indicators of each dimension are shown in Table 1.
In the dimension of the utility of financial services, we introduce two indicators, which are the percentage of loan balance in GDP and the percentage of deposit balance in GDP. These two indicators measure the role of financial institutions in regional economic activities and demonstrate the economic development promoted by financial industry. All indicators in this dimension are positive, and higher value indicates that financial services are more effective.
In the dimension of the affordability of financial services, it contains the index of non-financial institution financing as a percentage of GDP. In the competition of financial market, the services of non-financial institutions will affect the development of the financial industry. Financial institutions face the pressure of continuously improve their quality of financial services. The indicator in this dimension is negative, that is, the higher value indicates that financial institutions need to suffer more pressures.
In order to measure the financial inclusion in China, this paper uses the four dimensions in Table 1 to construct the financial inclusion index. However, in view of the possible correlation between different dimensions, it would reduce the accuracy of the financial inclusion index [27]. Consequently, in the process of measuring the financial inclusion index of each province in China, this paper puts forward the method based on Wang and Guan (2017), to differentiate the weight of each dimension with the coefficient of variance, so that the indicators of each dimension could represent the intrinsic meaning of financial inclusion [30]. The financial inclusion index calculated as follows.
Step 1: Calculating the standardized value of each indicator.
In order to apply better each indicator to the financial inclusion index, this paper firstly converts the actual value of each indicator to the standardized value by the min–max normalization method, drawing on the experience of Zhou et al. (2018) and Wang and Guan (2017), so that the value of each indicator could be between 0 and 1. If we do as that, we can reduce the influence of value range on each variable.
For the indicators of the first three dimensions, Formula (1) is used to transform the actual value of each indicator in the dimension of financial service availability, usability, and utility to the standardized value.
Among that, represents the standardized value of the j-th indicator, represents the actual value of the j-th indicator, represents the maximum value of the j-th indicator, and represents the minimum value of the j-th indicator.
Since the indicator of receptivity of financial services is negative, Formula (2) is used to convert the indicator of this dimension.
According to Formulas (1) and (2), the standardized value of each indicator can better represent the contribution of each dimension to the financial inclusion index.
Step 2: Calculating the variation coefficient for each indicator.
After obtaining the standardized value for each indicator, it is necessary to explore the intrinsic characteristics of each indicator. Therefore, Formula (3) is used to calculate the variation coefficient of each indicator, drawing on the experience of Zhou et al. (2018) and Wang and Guan (2017).
Among that, represents the variation coefficient of the j-th indicator, represents the standard deviation of which represents the standardized value of the j-th indicator, and represents the average of which represents the standardized value of the j-th indicator.
By calculating the variation coefficient of each indicator, it is possible to display better the value distribution of each indicator and distinguish the contribution of each indicator. Table 2 shows the distribution of the coefficient of variation values of the 10 indicators, and Figure 2 shows the time series of variation coefficient of indicators. There are four aspects, that are availability of financial services (~), usability of financial services (~), utility of financial services (~), and receptivity of financial services ().
From Table 2 and Figure 2, there are the same time series and floating to a lesser degree of variation coefficient of indicators, which shows consistency and stability of all indicators’ contribution.
Step 3: Calculating the weight of each indicator.
In order to differentiate the indicators, this paper uses the variation coefficient of each indicator to get their weights. Formula (4) is used to calculate the weight of each indicator.
Among that, represents the weight of the j-th indicator and represents the variation coefficient of the j-th indicator.
Step 4: Calculate the financial inclusion index.
This paper adapts the method of Zhou et al. (2018), and uses the characteristics of different indicators to calculate the financial inclusion index of all provinces in China [32], and the calculation method is shown in Formula (5).
Among that, represents the financial inclusion index of i province in t year, represents the weight of the j-th indicator in t year, and represents the standardized value of i province of the j-th indicator in t year.
In the calculating process of the financial inclusion index, the characteristics of China’s financial industry are fully considered, and the dimensions of financial services availability, usability, utility, and receptivity could represent the core of financial inclusion. China’s financial industry has long been constrained by different policies, which could increase the seriousness of information asymmetry in this market. In addition, the economic development of different regions in China is quite different, and the gap between rich and poor has not been alleviated. Therefore, in the measuring process of the financial inclusion index in China, it should consider the positive impact of financial institutions and the negative impact of non-financial institutions, in order to more comprehensively represent the development of financial industry of different regions.
2.2. The Logical Relationship between Financial Inclusion and Non-Performing Loans
Non-performing loans of commercial banks have been a long-term problem that besets the banking industry and cannot be completely solved. Combined with the research on the determinants of non-performing loans, bank-specific and macroeconomic factors are highly recognized [33]. In addition, many researchers have found that the government intervention and the production technologies have a significant impact on non-performing loans [18,24]. Therefore, solving the problem of non-performing loans of commercial banks needs to consider the systematic characteristics of banking sector.
Compared with the financial system of developed countries, the importance of commercial banks in China’s banking industry has gradually been improved since the implementation of reform and opening-up policies, and the financial services of commercial banks have greatly enhanced the product richness of the entire banking industry. However, with the continuous development of commercial banks, more financial services may bring more potential credit risks, which raises the problem of non-performing loans. After the global financial crisis in 2008, the problem of non-performing loans of commercial banks has been difficult to control [7]. Faced with this situation, many commercial banks began to try different control measures to alleviate the growth of non-performing loans, but these measures did not achieve good results. According to the characteristics of China’s market, it can be seen that local governments prefer to pay more attention to non-performing loans of commercial banks in regional economic perspective, rather than in bank-specific perspective, which is consistent with regional economic development strategy focusing on the overall regional economy.
Faced with the dilemma of China’s banking sector, the concept of financial inclusion plays an important role of maintaining the stability of regional capital flows. However, the core of financial inclusion is to provide more financial services for more users, and alleviate the gap between rich and poor. Considering the similarity between the operations of financial inclusion system and banking sector, it may bring some potential risks for the emergence of non-performing loans of commercial banks. From a micro perspective, the benefits of solving users’ financial problems will be directly reflected in their solvency, which can lengthen the time of cooperation between users and banks. From a macro perspective, financial inclusion will improve the government performance and the success rate of small- and medium-sized enterprises, providing the guarantee for the stability of regional capital flow. Based on the existing research, this paper discusses the theoretical relationship between financial inclusion and non-performing loans of commercial banks, and the logical relationship is shown in Figure 3.
The goal of financial inclusion is to provide more financial services and solve the users’ capital problems. On the micro-level impact of financial inclusion, increasing the richness of financial services could bring convenience to more users, so as to better solve users’ capital problems and improve consumption level throughout the region [6]. On the macro-level impact of financial inclusion, the expansion of financial services can increase the number of channels to financial services for users, and make the distribution of educational resources more balanced [29]. In addition, financial inclusion can also improve the performance of local governments, and extend the life cycle of entrepreneurial enterprises, providing corresponding guarantees for regional economic output. It is worth noting that the micro-level impact of financial inclusion can be reflected in the bank-specific level, which will promote the participation of users and improve bank performance [32]. In addition, the macro-level impact of inclusive finance can be reflected in the banking industry level, which will increase the speed of regional capital flows and strengthen the intensity of capital networks, in order to reduce the implicit guarantee provided by local government [24]. The impact of bank-specific and banking industry will have a corresponding effect on non-performing loans of commercial banks, indicating that there is a close relationship between financial inclusion and non-performing loans.
Financial inclusion can flourish the credit that small firms lack liquidity [34], thus, borrowers keep being able to pay their principal and interest. Nevertheless, relative instability and costly liabilities from wholesale funding may be the second-most important reason for the reducing risk from inclusiveness [35,36,37]. For instance, during the global economic crisis, the more banks relied on wholesale funding, the more fragile they were [37]. Nevertheless, inclusiveness cushioned financial institutions from fragility.
Poor individuals are prudent with saving [38]. Once financial inclusion helps industries survive and economically grow, householders come, as well as deposits. Since retailing deposits are sluggish and insensitive to risks [39,40], banks will have stronger liabilities, and the non-performance loans ratio will be lower.
Meanwhile, inclusiveness may also help banks to reduce the asymmetric information problem by having a more engaged relationship with customers. Financial inclusion helps to bridge the distance between banks and borrowers. The closer they are, the more information will be shared [41]. With plenty of information used to being latent, banks can lend more prudentially, and price more precisely [42].
To our knowledge, relatively little research has been done within this field of inclusiveness and non-performance loans ratio. However, several papers have demonstrated the linear relationship between financial inclusion and banks’ risk [43]. Among which, Yuan (2016) empirically indicated the significant negative linear relationship between financial inclusion and banks’ non-performance loans ratio. Thus, as non-performance loans ratio is quite an important indicator to banks’ risk management, and due to recent repeated expose of Chinese city commercial banks’ ultra-high non-performance loans ratio tightening the nerves of finance, compared with the existing research of non-performing loans, this paper chooses the non-performing loans of commercial banks in regional perspective as a new angle to study, which could lead to a better approach to the development strategy of China’s overall economy. Through the theoretical analysis, financial inclusion will affect commercial banks’ non-performing loans in regional economic activities, while this logical relationship needs to be verified by the empirical model.
3. Data and Empirical Models
3.1. Data Source
This paper selects data from 31 provinces (including 4 municipalities) in China from 2005 to 2016 as the sample for empirical analysis. The data of non-performing loans and total assets of commercial banks come from the annual reports of China Banking Regulatory Commission [44] and Wind Database. The data of financial inclusion index come from “Regional Financial Operation Report” on the website of People’s Bank of China [45], and statistical yearbooks of various provinces and cities. In addition, macroeconomic data are derived from the website of the National Bureau of Statistics of China [46], and statistical yearbooks of various provinces and cities.
3.2. Variable Construction
3.2.1. Non-Performing Loans Variable
This study uses the non-performing loans ratio to measure the non-performing loans variable. Due to the large differences in regional economic development, the commercial banks’ non-performing loans may be influenced by the regional economic output. In order to avoid the impact of the economic development, the non-performing loans ratio is chosen to measure the non-performing loans of commercial banks.
where indicates the non-performing loans ratio of i province in t year, and indicates the commercial banks’ non-performing loans of i province in t year, and indicates the regional GDP of i province in t year.
3.2.2. Financial Inclusion Variable
This study uses the financial inclusion index to measure the financial inclusion variable. The core of financial inclusion is to provide more financial services for the users with capital problems. During construction of the financial inclusion index, it is necessary to consider the characteristics of financial services, and the impact of non-financial institutions. In the calculation method of the financial inclusion index, this study discusses the geographic dimension, the population dimension, and the economic dimension of financial inclusion, and also considers the receptivity of financial services. Based on the calculation method proposed in Section 2.1, represents the financial inclusion index of i province in t year. The brief description of financial inclusion index and its 10 unstandardized components is shown in Table 3, and the time series of financial inclusion index in different provinces in China is shown in Figure 4.
Table 3 shows the descriptive statistics of financial inclusion index and the 10 unstandardized components from 2005 to 2016. According to the CV weight of the 10 unstandardized components of the financial inclusion index, it can be seen that, the fourth component “the number of employees in financial institutions per 10,000 km2” has the largest weight in the financial inclusion index calculation, which indicates the accessibility of financial service. The service staff ratio will reflect the effect of China’s inclusive financial implementation to a large extent, indicating that the availability of financial services in the Chinese context can more effectively exert the value of inclusive finance. The tenth component “Receptivity of Financial Services” has the lowest contribution to the inclusive financial index, which indicates that the role of inclusive finance in China is currently less affected by non-financial institutions, mainly because China’s current non-financial institutions’ financing channels have not yet been liberalized.
Figure 4 shows the time series of 31 provinces’ financial inclusion index. In addition to the large fluctuations of the financial inclusion index in Beijing, Shanghai, and Tianjin, the financial inclusion index of other cities are relatively stable, which may be related to the fact that these three cities are the municipalities in China. Besides, as the administrative center and financial center of China, Beijing and Shanghai can not only obtain more information about inclusive financial policies, but also put policy information into practice quickly. As a municipality adjacent to Beijing, Tianjin not only takes advantages from its own municipality status, but also benefits from the close distance to the capital. Due to resource, policy, as well as geographical location advantages, these cities are able to establish an inclusive financial system faster and better.
3.2.3. Control Variables
This paper summarizes the influencing factors of non-performing loans by using the existing research results, including banking factors, government factors, production technology factors, and macroeconomic factors. It helps to select the control variables, including the size of commercial bank assets, government budget deficit, education, the unemployment rate, growth of real GDP, inflation, and investment of fixed assets, so as to fully explore the relationship between financial inclusion and non-performing loans of commercial banks.
Size of commercial bank assets. Commercial banks have gradually become an important part of China’s banking industry, and the total assets of commercial banks have also become an important indicator of regional economic development. The total assets of regional commercial banks are the potential factors affecting the economic development of different regions by controlling the capital flow. This paper uses the ratio of the total assets of commercial banks in each province to the total GDP, to control the impact of banking factors on non-performing loans, where indicates the size of commercial bank assets of i province in t year.
Government budget deficit. Government intervention is the main determinant of non-performing loans in China’s banking industry, which is mainly reflected in the quality of bank assets. However, the government budget deficit also represents the degree of government intervention in regional economic development, creating a strong correlation between the quality of bank assets and the efficiency of government management. The proportion of the deference between government revenue and expenditure to the regional GDP to measure the government budget deficit is used to controlling the impact of government factors on non-performing loans, where indicates the government budget deficit of i province in t year.
Education. In the development of regional economy, education plays a corresponding role in promoting labor resources and technological innovations. In addition, education will also improve the social credit environment. For measuring the educational factors, the years of education commonly used as variables reflect the input of human capital. The proportion of total years of education (total years of education = 6 * the number of primary school education student + 9 * the number of junior high school education + 12 * the number of high school education + 16 * the number of college education), to the total sampling population aged over six years old, to measure the education, is used to control the impact of production technology factors on non-performing loans, where indicates the years of education of i province in t year.
Unemployment rate. The unemployment rate represents the degree of labor oversaturation in regional economic activities, which also reflects the real demand of the labor market. The high unemployment rate may lead to an impact on social stability, which could reduce the efficiency of the capital chain. However, the continued growth of unemployment rate will also have a corresponding impact on the economic activities, leading to a downturn in regional economy. The unemployment rate is used to control the impact of production technology factors on non-performing loans, where indicates the unemployment rate of i province in t year.
Growth of real GDP. The growth of real GDP is one of the most intuitive indicators in regional economic development. The real GDP eliminates the impact of price levels on GDP, and thus, better reflects the real development level of regional economy. When the regional economy is in recession, non-performing loans will trigger a series of economic problems. The growth of real GDP is used to control the impact of macroeconomic factors on non-performing loans, where indicates the growth of real GDP of i province in t year.
Inflation. Inflation has long been an important indicator of the economic stability. The degree of inflation will be directly reflected in the regional consumption, which could accordingly affect the participants of economic activities. The consumer price index can measure the degree of inflation and control the impact of macroeconomic factors on the non-performing loans, where indicates the degree of inflation of i province in t year.
Investment of fixed assets. Considering the regional economic development in China, the infrastructure construction has caused the serious concern to the local government, and fixed asset investment is the direct representation of infrastructure construction. The investment of fixed asset can not only improve the output of economic activities, but also provide corresponding guarantees for the development of different industries. The proportion of total investment of fixed assets to the regional GDP is used to control the impact of macroeconomic factors on non-performing loans, where indicates the investment of fixed assets of i province in t year.
3.3. Descriptive Statistics
During exploration of the relationship between financial inclusion and non-performing loans of commercial banks, different variables are used for empirical analysis. The explained variable is non-performing loans, and the explaining variable is financial inclusion. In addition, the control variables are selected from different aspects to fully demonstrate the relationship between inclusive finance and non-performing loans. The type, abbreviations, names, and definition of variables in this paper are shown in Table 4.
Table 4 shows the introduction of all variables in empirical analysis, and the data sources are described in detail in Section 3.1. In order to show the characteristics of different variables, the descriptive statistics of variables are shown in the following Table 5.
Compared with the numerical characteristics of all variables, it can be seen that the average, median, maximum, and minimum of government budget deficit are negative, indicating that the financial difficulties of each province in China need to be resolved. In addition, the minimum value of growth of real GDP and inflation are also negative, which indicates that some provinces in China have experienced the economic downturn. Combining the descriptive statistics of variables, it is necessary to construct the panel data model for verifying the relationship between non-performing loans and financial inclusion.
3.4. Model Construction
According to the analysis of logical relationship in Section 2.2, it can be found that financial inclusion may have an effect on non-performing loans of commercial banks on the theoretical level. However, whether the theoretical relationship can be applied to the actual situation of China’s banking industry requires the verification of empirical analysis. Therefore, this paper constructs a static panel data model, and uses this empirical model to explore the relationship between financial inclusion and non-performing loans of commercial banks.
Formula (7) is the basic panel data model in this paper, where i represents the province and t represents the year; is a random disturbance term. The lagged variable is introduced to analyze whether there is a lagged impact of financial inclusion.
4. Empirical Analysis
4.1. Unit Root Test
The static panel data model constructed in Section 3.4 contains multiple variables, and the stability of these variables may have a corresponding impact on the empirical analysis, which would reduce the accuracy of the empirical results. Therefore, before regression, it is necessary to apply a unit root test on each variable to avoid spurious regression. Considering the existing unit root test methods, there are mainly two categories, which are homogeneous unit root test and heterogeneous unit root test. These two methods have the following respective assumptions: the homogeneous unit root test has the assumption that the sections of the panel data consist of the same unit roots, whereas the assumption of the heterogeneous unit root test is that the sections of the panel data consist of different unit roots. We apply unit root test methods, including LLC test, Breitung test, IPS test, ADF-Fisher test and PP-Fisher test. The LLC test and the Breitung test are homogeneous unit root test methods, while the IPS test, ADF-Fisher test and PP-Fisher test are heterogeneous unit root test methods. The results of unit root test are shown in Table 6.
According to the unit root test results in Table 6, only SIZE, EDU, and INFL are stationary sequences, while other variables cannot pass the unit root tests. In order to further detect the stability of all variables, this paper performs the first-order difference processing on all variables and labels with Δ. After the first-order differential operation, all variables can pass the 1% significance level test by all unit root test methods, which means that all variables can be regarded as the first-order integration. Since all variables pass the unit root test under the same conditions, the empirical model of this paper avoids the spurious regression problem, thus ensuring the reliability and accuracy of the empirical results.
4.2. Panel Data Regression Analysis Results
4.2.1. The Discrimination of Panel Data Model Type
Based on the static panel data model constructed in Section 3.4, it is necessary to discriminate the type of panel data model for analyzing the relationship between financial inclusion and non-performing loans of commercial banks, ensuring that the model can be better applied to the characteristics of different regions in China. Thus, this paper introduces F test and Hausman test to discriminate the model type. F test is mainly used to judge whether the true model is a mixed regression model or a fixed effect model, and Hausman test is to determine whether the true model is a random effect model or a fixed effect model. The assumptions and test results of the two test methods are shown in Table 7.
According to the results of discriminating the panel data model type in Table 7, the p value of the F test is less than 1%, indicating that the null hypothesis “H0: The true model is a mixed regression model” should be rejected, and it is more appropriate to establish a fixed effects model. The p value of the Hausman test is less than 1%, indicating that the null hypothesis “H0: The true model is a random effect model” should be rejected, and it is more appropriate to establish a fixed effects model.
Combining the results of F test and Hausman test in Table 6, the panel data model to examine the relationship between financial inclusion and non-performing loans of commercial banks should be a fixed effects model.
4.2.2. The Regression Analysis of Overall Sample
According to the results of F test and Hausman test, the fixed effects model is more suitable to estimate Formula (7), relating to the development characteristics of different regions in China. However, with the fixed effects model, the lagged influence of control variables is an important part to consider. Therefore, based on Formula (7), lagged control variables are added. In addition, in order to better demonstrate the impact of financial inclusion on non-performing loans from a regional perspective, this paper applies a two-way fixed effects model of fixing the province effects and time effects.
Formula (8) is the two-way fixed effects model; represents the fixed effects of i province, and represents the fixed effects of t year.
In the process of empirical analysis, a hierarchical regression method is adopted to verify the impact of financial inclusion on commercial banks’ non-performing loans under different conditions. The regression analysis of the overall sample of 31 provinces and municipality in China is carried out by using the two-way fixed effects model constructed by Formula (8), and the regression results are exhibited in Table 8.
Model 1 examines the relationship between financial inclusion and non-performing loans, with control variables of the current and lagged commercial bank assets size. p value of financial inclusion and commercial bank assets size are both statistically significant at a level of 1%. The result shows that financial inclusion has a negative impact on commercial banks’ non-performing loans, and the size of banking assets has a similar impact as well. This alleviating effect comes from the more effective control of non-performance loans, generating by providing more financial services to more customers because of financial inclusion. During this process, the bigger the scale of the bank, the more customers it can contact, so as to reduce the incidence of more non-performance loans.
Model 2 examines the relationship between financial inclusion and non-performance loans, with control variables of the current and lagged government budget deficit. Financial inclusion and the government budget deficit are statistically significant at 10% confidence level, and the lagged government budget deficit is statistically significant at 1% confidence level. These results demonstrate that financial inclusion has a significant negative impact on commercial banks’ non-performance loans, while government budget deficit positively and continuously promotes the emergence of non-performance loans. The government intervention in economic activities has brought a lot of burden to commercial banks, and the government budget deficit continues stimulating the emergence of non-performing loans in the banking sector, which reduces the inhibitory effect of financial inclusion.
Model 3 adds the current and lagged control variables of education and unemployment rate. Financial inclusion and the unemployment rate are statistically significant at the confidence level of 1%, and education is significant at a confidence level of 10%. The results reveal that financial inclusion has a significant negative impact on commercial banks’ non-performance loans, but that both the education and the unemployment rate play significant promoting roles in non-performance loans, creating further problems. It is worth noting that although the coefficient of education is positive, its impact is much weaker than the impact of unemployment rate. The growth of unemployment rate would lead to a continuous expanding gap between the poor and rich, which also brings challenges to the implementation of financial inclusion, making it difficult to alleviate commercial banks’ non-performance loans, creating further problems.
Model 4 adds the current and lagged control variables of real GDP growth, inflation, and fixed assets investment. Financial inclusion and inflation are statistically significant at the confidence level of 1%, and the lagged variables of inflation and fixed assets investment are also statistically significant at the level of confidence of 1%. The results show that financial inclusion brings an obstacle to non-performance loans, and inflation could inhibit the emergence of this problem for several periods, and that lagged fixed assets investment plays a similar role as inflation. These results demonstrate the long-run effectiveness of infrastructure to economic development, which is often difficult to show in a short time; however, these regional factors can indeed improve the effects of financial inclusion.
Model 5 is constructed based on Formula (8) considering the influence of all control variables. Financial inclusion is statistically significant at a confidence level of 10%; the government budget deficit and the lagged variable of inflation are statistically significant at a confidence level of 5%; the inflation and the lagged variable of fixed asset investment are statistically significant at a confidence level of 1%. According to the results of Model 5, there is a statistically significant negative correlation between financial inclusion and non-performance loans of commercial banks. Based on the consideration of macroeconomic factors and banking factors, financial inclusion can alleviate the rise of the non-performance loans ratio, and thus reinforce the quality of commercial banks’ assets.
By analyzing the regression results of overall sample in Table 7, we drew the conclusion that financial inclusion of different regions in China could significantly hinder the emergence of non-performing loans of commercial banks, which fully reflects the core advantages of financial inclusion in alleviating the financial difficulties. Considering the development of regional economy in China, the fixed effects of province and time can better match the characteristics of different provinces and cities. However, because of the different level of financial inclusion development in different regions, which may affect the quality of regional banking assets, we have done some subsample regression analysis to avoid this latent effect.
4.2.3. The Regression Analysis of Different Subsamples
In the regression analysis of overall sample, it can be found that financial inclusion of each province in China has a statistically significant negative impact on non-performance loans of commercial banks, indicating that the construction of financial inclusion system can improve the quality of bank assets. However, the economic development of different region in China is quite different, which may lead to an affection from external factors to financial inclusion. Therefore, in order to further examine the relationship between financial inclusion and commercial banks non-performance loans in different regions of China, this paper divides the overall sample into some subsamples, to better demonstrate the different impacts of financial inclusion.
There are two methods used for dividing the subsamples in this paper. Firstly, according to the development level of financial inclusion, the overall sample is divided into three subsamples, which are (1) the regions with a good level of financial inclusion index (including 10 provinces and cities); (2) the regions with a medium level of financial inclusion index (including 11 provinces and cities); and (3) the regions with a bad level of financial inclusion index (including 10 provinces and cities). In addition, in many studies of regional economic development in China, the geographical dimension division method is frequently adopted. Therefore, this geographical dimension division method is also used in this paper to divide the overall sample into three subsamples, which are (1) the eastern regions (including 11 provinces and cities); (2) the central regions (including 8 provinces and cities); and (3) the western region (including 12 provinces and cities). The sample division methods used in this paper and the corresponding subsample regions are shown in Table 9.
During the regression analysis of each subsample, this paper still adopts the method of fixed province effects and fixed time effects, and uses the two-way fixed effects model constructed by Formula (8). The regression results for each subsample are shown in Table 10.
Among the regression results of each subsamples, Model 6, Model 7, and Model 8 analyzed the subsamples of different development levels of financial inclusion; while Model 9, Model 10, and Model 11 analyzed subsamples corresponding to different geographic locations.
Model 6 is the regression result of regions with a good level of financial inclusion index. Financial inclusion does not have a statistically significant impact on non-performance loans in these regions, but the lagged financial inclusion is statistically significant at the confidence level of 10%. This result shows that the development of financial inclusion generates new channels for customers to obtain financial services, but there are some accompanying potential risks.
Model 7 and Model 8 are the regression results of regions with a medium and bad level of financial inclusion index. The results of these subsamples show that there is no statistically significant relationship between financial inclusion and non-performance loans in these regions, but the size of bank assets is statistically significant at the confidence level of 1%. Combined with the results of Model 7 and Model 8, it can be seen that until the development of financial inclusion reaches a high level, the development of commercial banks can effectively alleviate the increase of non-performance loans.
By comparing the regression results of Model 6, Model 7 and Model 8, we find that the construction of financial inclusion system and the development of the banking sector could play different roles in controlling non-performing loans of commercial banks. Once the development of financial inclusion reached a higher level, more users could get diversified financial services, and their financial difficulties would be appropriately alleviated. If the development of financial inclusion was at a low level, the development of commercial banks could effectively prevent the rise of non-performing loans.
Model 9 is the regression result of the subsample of eastern regions. According to the results, there is no significant relationship between financial inclusion and non-performing loans. It is worth noting that the government budget deficit in the eastern regions promote non-performing loans, and produce the continuous impact on the non-performance loans increasing problem. This result is consistent with the result of Model 2. The economic development in the eastern region is at a high level, so the degree of government intervention in economic activities is higher than those in other regions.
Model 10 is the regression result of central regions. Financial inclusion is statistically significant at a confidence level of 10%, and the lagged variable of financial inclusion is statistically significant at a confidence level of 1%. The results suggest that financial inclusion has a statistically significant negative impact on non-performing loans of commercial banks in these regions, while the lagged financial inclusion plays a statistically significant positive promoting role. Combined with the economic characteristics of central China, the industrial structure of central regions is relatively simple, making the chain reaction of enterprises’ interacting networks stronger.
Model 11 is the regression result of western regions, and there is no statistically significant relationship between financial inclusion and commercial banks’ non-performing loans. However, the size of bank assets and inflation in the western region are statistically significant at the confidence level of 1%, and the lagged variable of inflation is statistically significant at the confidence level of 5%. These results indicates that the development of banking sector and the regional consumption in western region could alleviate the increase of non-performing loans by maintaining the stability of banking asset quality.
By comparing the regression results of Model 9, Model 10 and Model 11, it can be found that the relationship between financial inclusion and non-performing loans is not statistically significant in developed regions and underdeveloped regions. It is worth noting that although financial inclusion in central regions can prevent the emergence of non-performing loans, the industrial characteristics and population characteristics of central regions would bring more potential risks and reduce the quality of banking assets.
4.2.4. The Regression Analysis of Different Subperiod Samples
Even if China did not suffer a recession caused by the global financial crisis, this crisis definitely influenced the policies of China. Thus, in order to further examine the relationship between financial inclusion and non-performing loans of commercial banks in different periods of China, this paper divides the overall sample into some subperiod samples to better study the different impact of financial inclusion.
This paper divides the overall samples into 3 subperiods: pre-crisis (2005~2007), crisis (2008~2011), and after global financial crisis (2012~2016). Later on, considering fixed province effects and fixed time effects, we apply a two-way fixed effects model to estimate the relationship between financial inclusion index and non-performance loans ratio. The results are shown in Table 11.
Model 12 is the regression results of pre-crisis. The results of this subsample shows that there is no statistically significant relationship between financial inclusion and non-performance loans before crisis. Nevertheless, during this period before crisis, there is a statistically significant negative effect of bank assets size on non-performance loans ratio at the confidence level of 10%, and a positive affection of lagged unemployment on non-performance loans ratio at a 5% confidence level.
Model 13 is the regression results of crisis. There is no obvious relationship between financial inclusion and non-performance ratio. However, we find that lagged fixed assets investment reduces non-performance loans ratio at the confidence level of 5%.
Model 14 is the regression results of post-crisis. The regression result in the post-crisis period shows evidence of a statistically significant effect of financial inclusion index on non-performance loans ratio at the confidence level of 5%. Besides, the lagged bank assets size and real GDP growth are statistically significant at the confidence level of 1%, and unemployment rate and government budget deficit are statistically significant at the confidence level of 10%.
By comparing the regression results of Model 12, Model 13, and Model 14, we find a statistically significant negative relationship between financial inclusion index and non-performance loans ratio after the crisis (2012~2016), while no statistically significant relationship is found before and during crisis. That is to say, the effects of financial inclusion index to non-performance loans ratio were mild before and during crisis, but becomes remarkable after the crisis. This structural change stems from three reasons: (1) the concept of finance inclusion has not been put forward until 2005, thus, a sufficient period has to be waited out before this concept can develop; (2) every country had to spend effort to cope with the global crisis, and China was no exception. China could not pay effort to finance inclusion until the crisis was settled; (3) after the crisis, several policies have been put forward, indicating the determination of the government to speed up financial inclusion development, and thus, could further expand the scale and improve the quality of the development of financial inclusion, and benefit a wider region and help to solve deeper financial problems.
5. Conclusions and Suggestions
5.1. Conclusions
The problem of non-performing loans has greatly influenced the development of the financial industry and reduced the quality of banking assets over a long period of time. Non-performing loans of commercial banks are an uncontrollable loss that may cause a series of financial problems. Researchers have explored the determinants of non-performing loans from variety of perspectives in order to find a more efficient solution. Recent research focuses on two significant factors: bank-specific and macroeconomic determinants. From the generation of non-performing loans, the capital problems of users could weaken their solvency with influencing the asset quality of banking sector, while the core of financial inclusion would help users to solve these problems. In the development of financial inclusion, it could narrow the gap between poor and rich, so the stability of banking sector and regional economy would be guaranteed. From the influence of credit risk, more attention should be paid to investigate whether financial inclusion would bring more credit risk to commercial banks, and promote the emergence of non-performing loans. Therefore, from the perspective of financial system construction, this paper explores the relationship between financial inclusion and non-performing loans of commercial banks, and provides policy recommendations for financial regulators and local governments.
Selecting the data from 31 provinces in China from 2005 to 2016, we construct a panel data model to explore the impact of financial inclusion in different regions on non-performing loans of commercial banks. Considering the unique characteristics of China’s regional economic development, a two-way fixed effects model is applied, which would deliver a better demonstrate the relationship between financial inclusion and non-performing loans from regional perspective. From the results of overall sample, financial inclusion has a statistically significant inhibiting effect on non-performing loans of commercial banks. The financial inclusion system is demonstrated to be efficient in alleviating the emergence of a potential crisis, caused by poor banking asset quality in China.
Combined with the results considering control variables, it can be seen that the size of commercial banks and the degree of inflation help alleviate non-performing loans increasing; however, the government budget deficit and unemployment rate stimulate this increasing problem. (1) Based on the impact of financial inclusion in each province and city of China, the development of the banking sector improves the construction of financial inclusion system and provides more reliable guarantees for customers; (2) Moreover, the degree of inflation is a measurement of regional consumption, while a more stable consumption level could lead to a higher stability of financial industry; (3) The government budget deficit, reflecting the degree to which the government intervenes in the regional economy, helps maintain a balance between the supply side and the demand side; (4) Although the development of financial inclusion could bring more employment opportunities, it is difficult to achieve in the short term. From the overall sample regression results, the inhibiting effect of financial inclusion on non-performing loans of commercial banks becomes stronger with the development of the banking sector, while government intervention and unemployment undermine this alleviating effect.
In the regression analysis of different regions in China, this paper divides the overall sample into some subsamples according to the development level of financial inclusion and the geographic locations. When the development of financial inclusion reaches a high level, the inhibiting effect of financial inclusion in these regions becomes relatively weak, but the lagged variable of financial inclusion continues to promote effect on non-performing loans. When the development of financial inclusion is at a low level, the financial inclusion in these regions has a strong inhibitory effect on non-performing loans, that is to say, the local governments of these regions need to pay full attention to the construction of financial inclusion system and provide corresponding policy to support the development of financial industry.
On the other hand, considering the different subsamples based on the geographical dimension, we found different results of the eastern, central, and western. In the eastern region of China, there is no significant relationship between financial inclusion and non-performing loans of commercial banks, and this result is consistent with that in underdeveloped western China. However, the development of finance in the eastern and western China is quite different; the development of financial industry in the eastern region reaches a high level, while the western regions need to continuously upgrade the financial industry. Thus, according to our findings, the alleviation from financial inclusion to non-performance loans in both the high-level and the low-level regions will be affected by the development of financial system and economic activities. Nevertheless, financial inclusion of central region plays a significant role in inhibiting non-performing loans of commercial banks; however, it is worth noting that its lagged variable would aggravate the problem of banking asset quality. Among these three regions of China, the industrial structure in central regions is relatively singular and simple, which tightens the interaction network between enterprises. Thus, the financial inclusion system can improve the efficiency of capital flow in central regions, but this effect is constrained by the single industry and regional population, which hinder this effect on non-performing loans.
Besides, the regression results of different period samples show a negative relationship between the financial inclusion index and non-performance loans ratio after crisis (2012~2016), while no statistically significant relationship is found before and during the crisis. That is to say, the effect from financial inclusion index to non-performance loans ratio used to be mild, and becomes remarkable after the crisis. According to these results, we draw the conclusion that the development of finance inclusion is a continuous process, and that lag exists between input and blossoming. During this process, finance inclusion could not be put forward until the government support was valid. Moreover, financial inclusion can develop better and more stably with the implementation of formal national policies.
5.2. Policy Recommendations
According to the current development of China’s financial industry, local governments should focus on promoting the construction of the financial inclusion system for regional economic development. When the development of financial inclusion reaches a certain stage, the problem of non-performing loans of commercial banks can be effectively suppressed. In addition, financial regulators need to make reasonable use of the advantages of financial inclusion to reduce the credit risk faced by the banking sector. For commercial banks in China, the conservative strategy of loans can increase users’ financial problems and decrease the probability of starting new businesses, which may bring more problems of banking asset quality. Under this situation, the development of banking sector in China needs to make full use of the advantages of financial inclusion and promote the efficiency of regional capital flows, achieving the sustainable economic development of different regions. The financial resources need to be integrated with the development of real economy, so as to fully demonstrate the inclusiveness of financial inclusion and improve the efficiency of resource utilization.
Author Contributions
Writing: F.-W.C., Y.F.; Providing idea and data: W.W.; Providing revision advice: F.-W.C.
Funding
This research was supported by the National Natural Science Foundation of China (No. 71772019); the Fundamental Research Funds for the Central Universities (No. 106112017CDJXY020002; NO. 2018CDXYJG0040) and the Graduate Research and Innovation Foundation of Chongqing, China (Grant No. CYS18011).
Conflicts of Interest
The authors declare no conflict of interest.
References
- Us, V. Dynamics of Non-Performing Loans in the Turkish Banking Sector by an Ownership Breakdown: The Impact of the Global Crisis. Financ. Res. Lett. 2017, 20, 109–117. [Google Scholar] [CrossRef]
- Vithessonthi, C. Deflation, Bank Credit Growth, and Non-Performing Loans: Evidence from Japan. Int. Rev. Financ. Anal. 2016, 45, 295–305. [Google Scholar] [CrossRef]
- China Banking Regulatory Commission. Available online: http://www.cbrc.gov.cn/chinese/home/docViewPage/110009¤t=1 (accessed on 20 August 2018).
- Bashir, U.; Yu, Y.; Hussain, M.; Wang, X.; Ali, A. Do Banking System Transparency and Competition Affect Nonperforming Loans in the Chinese Banking Sector? Appl. Econ. Lett. 2017, 24, 1519–1525. [Google Scholar] [CrossRef]
- Zhang, D.; Cai, J.; Dickinson, D.G.; Kutan, A.M. Non-Performing Loans, Moral Hazard and Regulation of the Chinese Commercial Banking System. J. Bank. Financ. 2016, 63, 48–60. [Google Scholar] [CrossRef]
- Corrado, G.; Corrado, L. Inclusive Finance for Inclusive Growth and Development. Curr. Opin. Environ. Sustain. 2017, 24, 19–23. [Google Scholar] [CrossRef]
- Kauko, K. External Deficits and Non-Performing Loans in the Recent Financial Crisis. Econ. Lett. 2012, 115, 196–199. [Google Scholar] [CrossRef]
- Keeton, W.R.; Morris, C.S. Why Do Banks’ Loan Losses Differ? Econ. Rev. 2007, 72, 3–21. [Google Scholar]
- Quagliariello, M. Banks’ Riskiness over the Business Cycle: A Panel Analysis on Italian Intermediaries. Appl. Financ. Econ. 2007, 17, 119–138. [Google Scholar] [CrossRef]
- Podpiera, J.; Weill, L. Bad Luck or Bad Management? Emerging Banking Market Experience. J. Financ. Stab. 2008, 4, 135–148. [Google Scholar] [CrossRef]
- Shehzad, C.T.; Haan, J.D.; Scholtens, B. The Impact of Bank Ownership Concentration on Impaired Loans and Capital Adequacy. J. Bank. Financ. 2010, 34, 399–408. [Google Scholar] [CrossRef]
- Espinoza, R.A.; Prasad, A. Nonperforming Loans in the GCC Banking System and their Macroeconomic Effects; IMF Working Papers; International Monetary Fund: Washington, DC, USA, 2010; Working Paper No. 10/224. [Google Scholar]
- Louzis, D.P.; Vouldis, A.T.; Metaxas, V.L. Macroeconomic and Bank-Specific Determinants of Non-Performing Loans in Greece: A Comparative Study of Mortgage, Business and Consumer Loan Portfolios. J. Bank. Financ. 2012, 36, 1012–1027. [Google Scholar] [CrossRef]
- Ghosh, A. Banking-Industry Specific and Regional Economic Determinants of Non-Performing Loans: Evidence From US States. J. Financ. Stab. 2015, 20, 93–104. [Google Scholar] [CrossRef]
- Guan, R.; Zheng, H.; Hu, J.; Fang, Q.; Ren, R. The Higher Carbon Intensity of Loans, the Higher Non-Performing Loan Ratio: The Case of China. Sustainability 2017, 9, 667. [Google Scholar] [CrossRef]
- Salas, V.; Saurina, J. Credit Risk in Two Institutional Regimes: Spanish Commercial and Savings Banks. J. Financ. Serv. Res. 2002, 22, 203–224. [Google Scholar] [CrossRef]
- Festić, M.; Kavkler, A.; Repina, S. The Macroeconomic Sources of Systemic Risk in the Banking Sectors of Five New EU Member States. J. Bank. Financ. 2011, 35, 310–322. [Google Scholar] [CrossRef]
- Mileris, R. Macroeconomic Determinants of Loan Portfolio Credit Risk in Banks. Eng. Econ. 2012, 23, 496–504. [Google Scholar] [CrossRef]
- Messai, A.S.; Jouini, F. Micro and Macro Determinants of Non-Performing Loans. Int. J. Econ. Financ. Issues 2013, 3, 852–860. [Google Scholar]
- Beck, R.; Jakubik, P.; Piloiu, A. Key Determinants of Non-Performing Loans: New Evidence from a Global Sample. Open Econo. Rev. 2015, 26, 525–550. [Google Scholar] [CrossRef]
- Konstantakis, K.N.; Michaelides, P.G.; Vouldis, A.T. Non-performing Loans (NPLs) in a Crisis Economy: Long-Run Equilibrium Analysis with a Real Time VEC Model for Greece (2001–2015). Phys. A Stat. Mech. Appl. 2016, 451, 149–161. [Google Scholar] [CrossRef]
- Cull, R.; Xu, L. Bureaucrats, State Banks, and the Efficiency of Credit Allocation: The Experience of Chinese State-Owned Enterprises. J. Comp. Econ. 2000, 28, 1–31. [Google Scholar] [CrossRef] [Green Version]
- Yu, Q.; Zhao, C. Political Control, Fiscal Subsidy and Moral Hazard: A General Model of Bad Assets in State Banks. Econ. Res. J. 2009, 6, 73–82. [Google Scholar]
- Tan, J.; Jian, Y.; Chen, Y. The government Intervention and Non-performing Loans: An Analysis Based on the Data During 1988~2005 from a State-owned Bank. Manag. World 2012, 7, 29–43. [Google Scholar]
- Raddatz, C. Liquidity Needs and Vulnerability to Financial Underdevelopment. J. Financ. Econ. 2006, 80, 677–722. [Google Scholar] [CrossRef]
- Beck, T.; Demirguc-Kunt, A.; Martinez Peria, M.S. Reaching Out: Access to and Use of Banking Services across Countries. J. Financ. Econ. 2007, 85, 234–266. [Google Scholar] [CrossRef]
- Sarma, M.; Pais, J. Finacial Inclusion and Development. J. Int. Dev. 2011, 23, 613–628. [Google Scholar] [CrossRef]
- Gupte, R.; Venkataramani, B.; Gupta, D. Computation of Financial Inclusion Index for India. Procedia-Soc. Behav. Sci. 2012, 37, 133–149. [Google Scholar] [CrossRef]
- Chakravarty, S.R.; Pal, R. Financial Inclusion in India: An Axiomatic Approach. J. Policy Model. 2013, 35, 813–837. [Google Scholar] [CrossRef]
- Wang, X.; Guan, J. Financial Inclusion: Measurement, Spatial Effects and Influencing Factors. Appl. Econ. 2017, 49, 1751–1762. [Google Scholar] [CrossRef]
- Turvey, C.G.; Xiong, X. Financial Inclusion, Financial Education, and E-Commerce in Rural China. Agribusiness 2017, 33, 279–285. [Google Scholar] [CrossRef]
- Zhou, G.; Gong, K.; Luo, S.; Xu, G. Inclusive Finance, Human Capital and Regional Economic Growth in China. Sustainability 2018, 10, 1194. [Google Scholar] [CrossRef]
- Makri, V.; Tsagkanos, A.; Bellas, A. Determinants of Non-Performing Loans: The Case of Eurozone. Panoeconomicus 2014, 61, 193–206. [Google Scholar] [CrossRef]
- Rajan, R.G.; Zingales, L. Financial Dependence and Growth. Am. Econ. Rev. 1998, 88, 559–586. [Google Scholar]
- Demirgüç-Kunt, A.; Huizinga, H. Bank activity and funding strategies: The impact on risk and returns. J. Financ. Econ. 2011, 98, 626–650. [Google Scholar] [CrossRef]
- Huang, R.; Ratnovski, L. The dark side of bank wholesale funding. J. Financ. Intermed. 2011, 20, 248–263. [Google Scholar] [CrossRef] [Green Version]
- Poghosyan, T.; Čihak, M. Determinants of Bank Distress in Europe: Evidence from a New Data Set. J. Financ. Serv. Res. 2011, 40, 163–184. [Google Scholar] [CrossRef]
- Collins, D.; Morduch, J.; Rutherford, S.; Ruthven, O. Portfolios of the Poor: How the World’s Poor Live on $2 a Day; Princeton University Press: Princeton, NJ, USA, 2011; Volume 11, pp. 165–166. [Google Scholar]
- Calomiris, C.W.; Kahn, C.M. The role of demandable debt in structuring optimal banking arrangements. Am. Econ. Rev. 1991, 81, 497–513. [Google Scholar]
- Song, F.; Thakor, A.V. Relationship banking, fragility, and the asset-liability matching problem. Rev. Financ. Stud. 2007, 20, 2129–2177. [Google Scholar] [CrossRef]
- Hauswald, R.; Marquez, R. Competition and Strategic Information Acquisition in Credit Markets. Rev. Financ. Stud. 2006, 19, 967–1000. [Google Scholar] [CrossRef] [Green Version]
- Buch, C.M.; Koch, C.T.; Koetter, M. Do Banks Benefit from Internationalization? Revisiting the Market Power–Risk Nexus. Rev. Financ. 2013, 17, 1401–1435. [Google Scholar] [CrossRef]
- Neaime, S.; Gaysset, I. Financial Inclusion and Stability in MENA: Evidence from Poverty and Inequality. Financ. Res. Lett. 2017, 24, 230–237. [Google Scholar] [CrossRef]
- China Banking Regulatory Commission. Available online: http://www.cbrc.gov.cn/chinese/home/docViewPage/110007.html (accessed on 20 January 2018).
- Monetary Policy Department of People’s Bank of China. Available online: http://www.pbc.gov.cn/zhengcehuobisi/125207/125227/125960/126049/index.html (accessed on 20 January 2018).
- National Bureau of Statistics of China. Available online: http://data.stats.gov.cn/ (accessed on 20 January 2018).
Figure 1.
Account and ratio of non-performing loans in commercial banks.

Figure 2.
The graph of the time series of variation coefficient of indicators.

Figure 3.
Logical relationship diagram between financial inclusion and non-performing loans.

Figure 4.
The time series of financial inclusion index in 31 provinces in China (2005–2016).


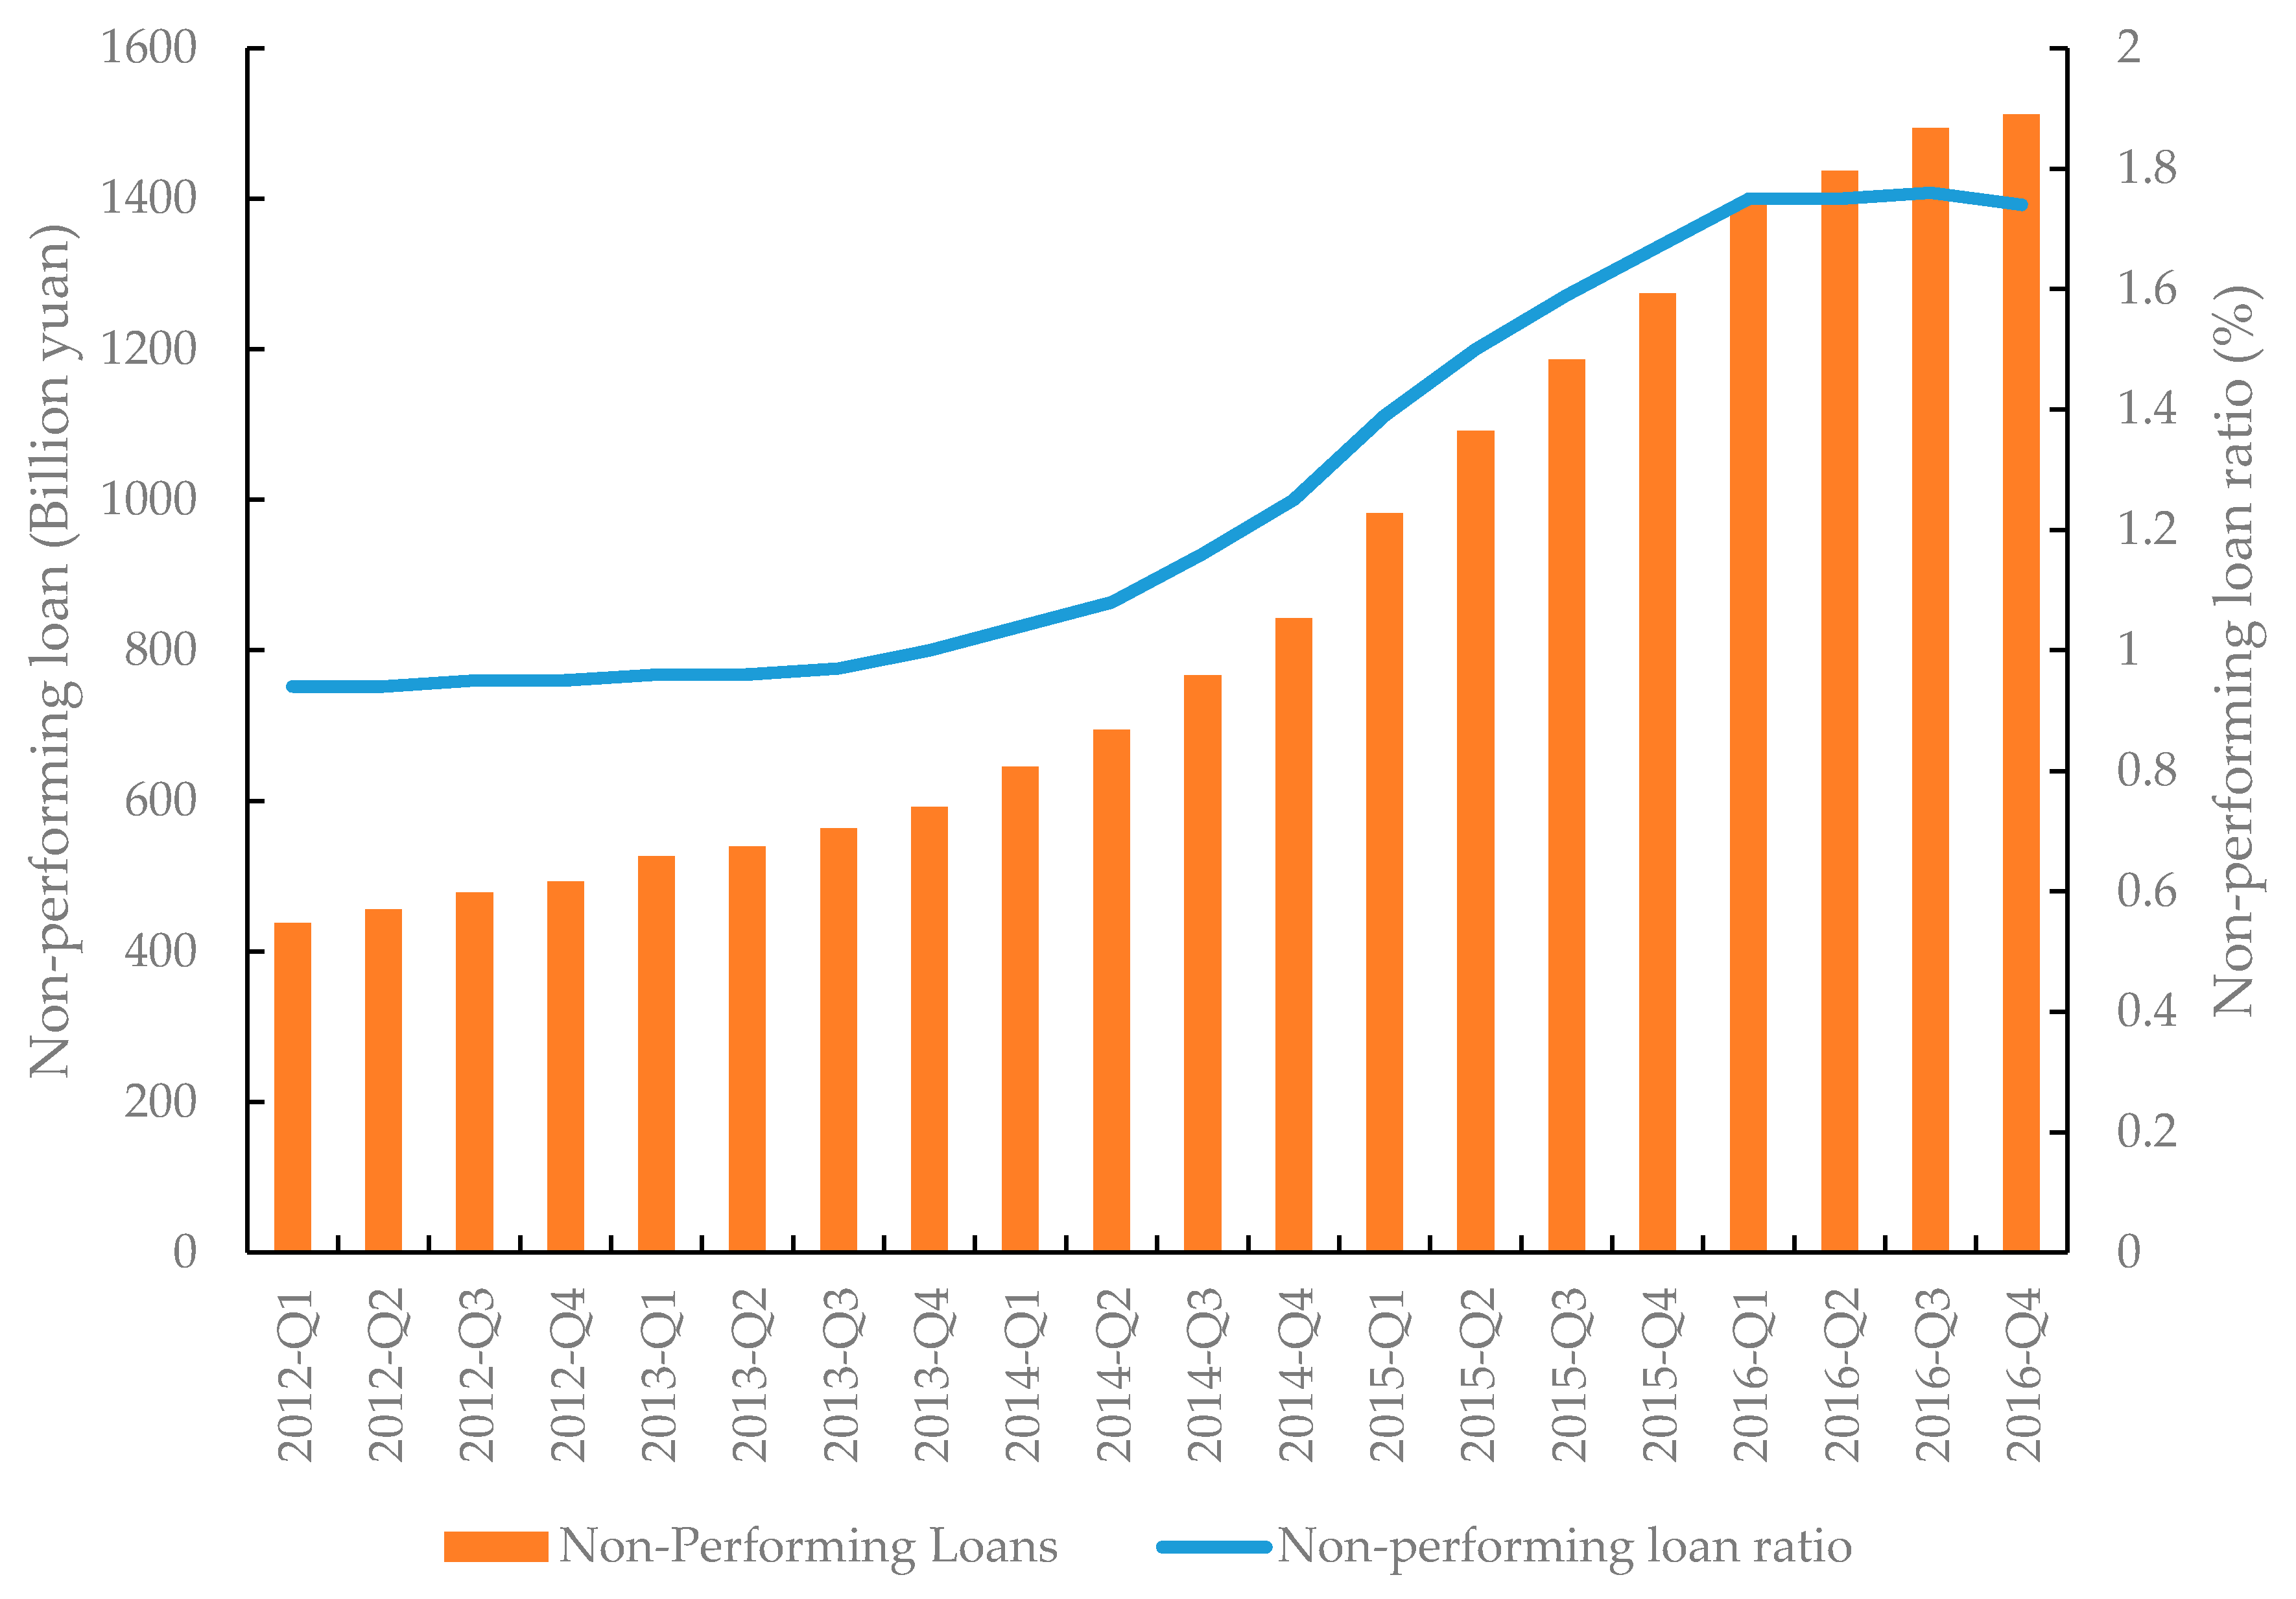
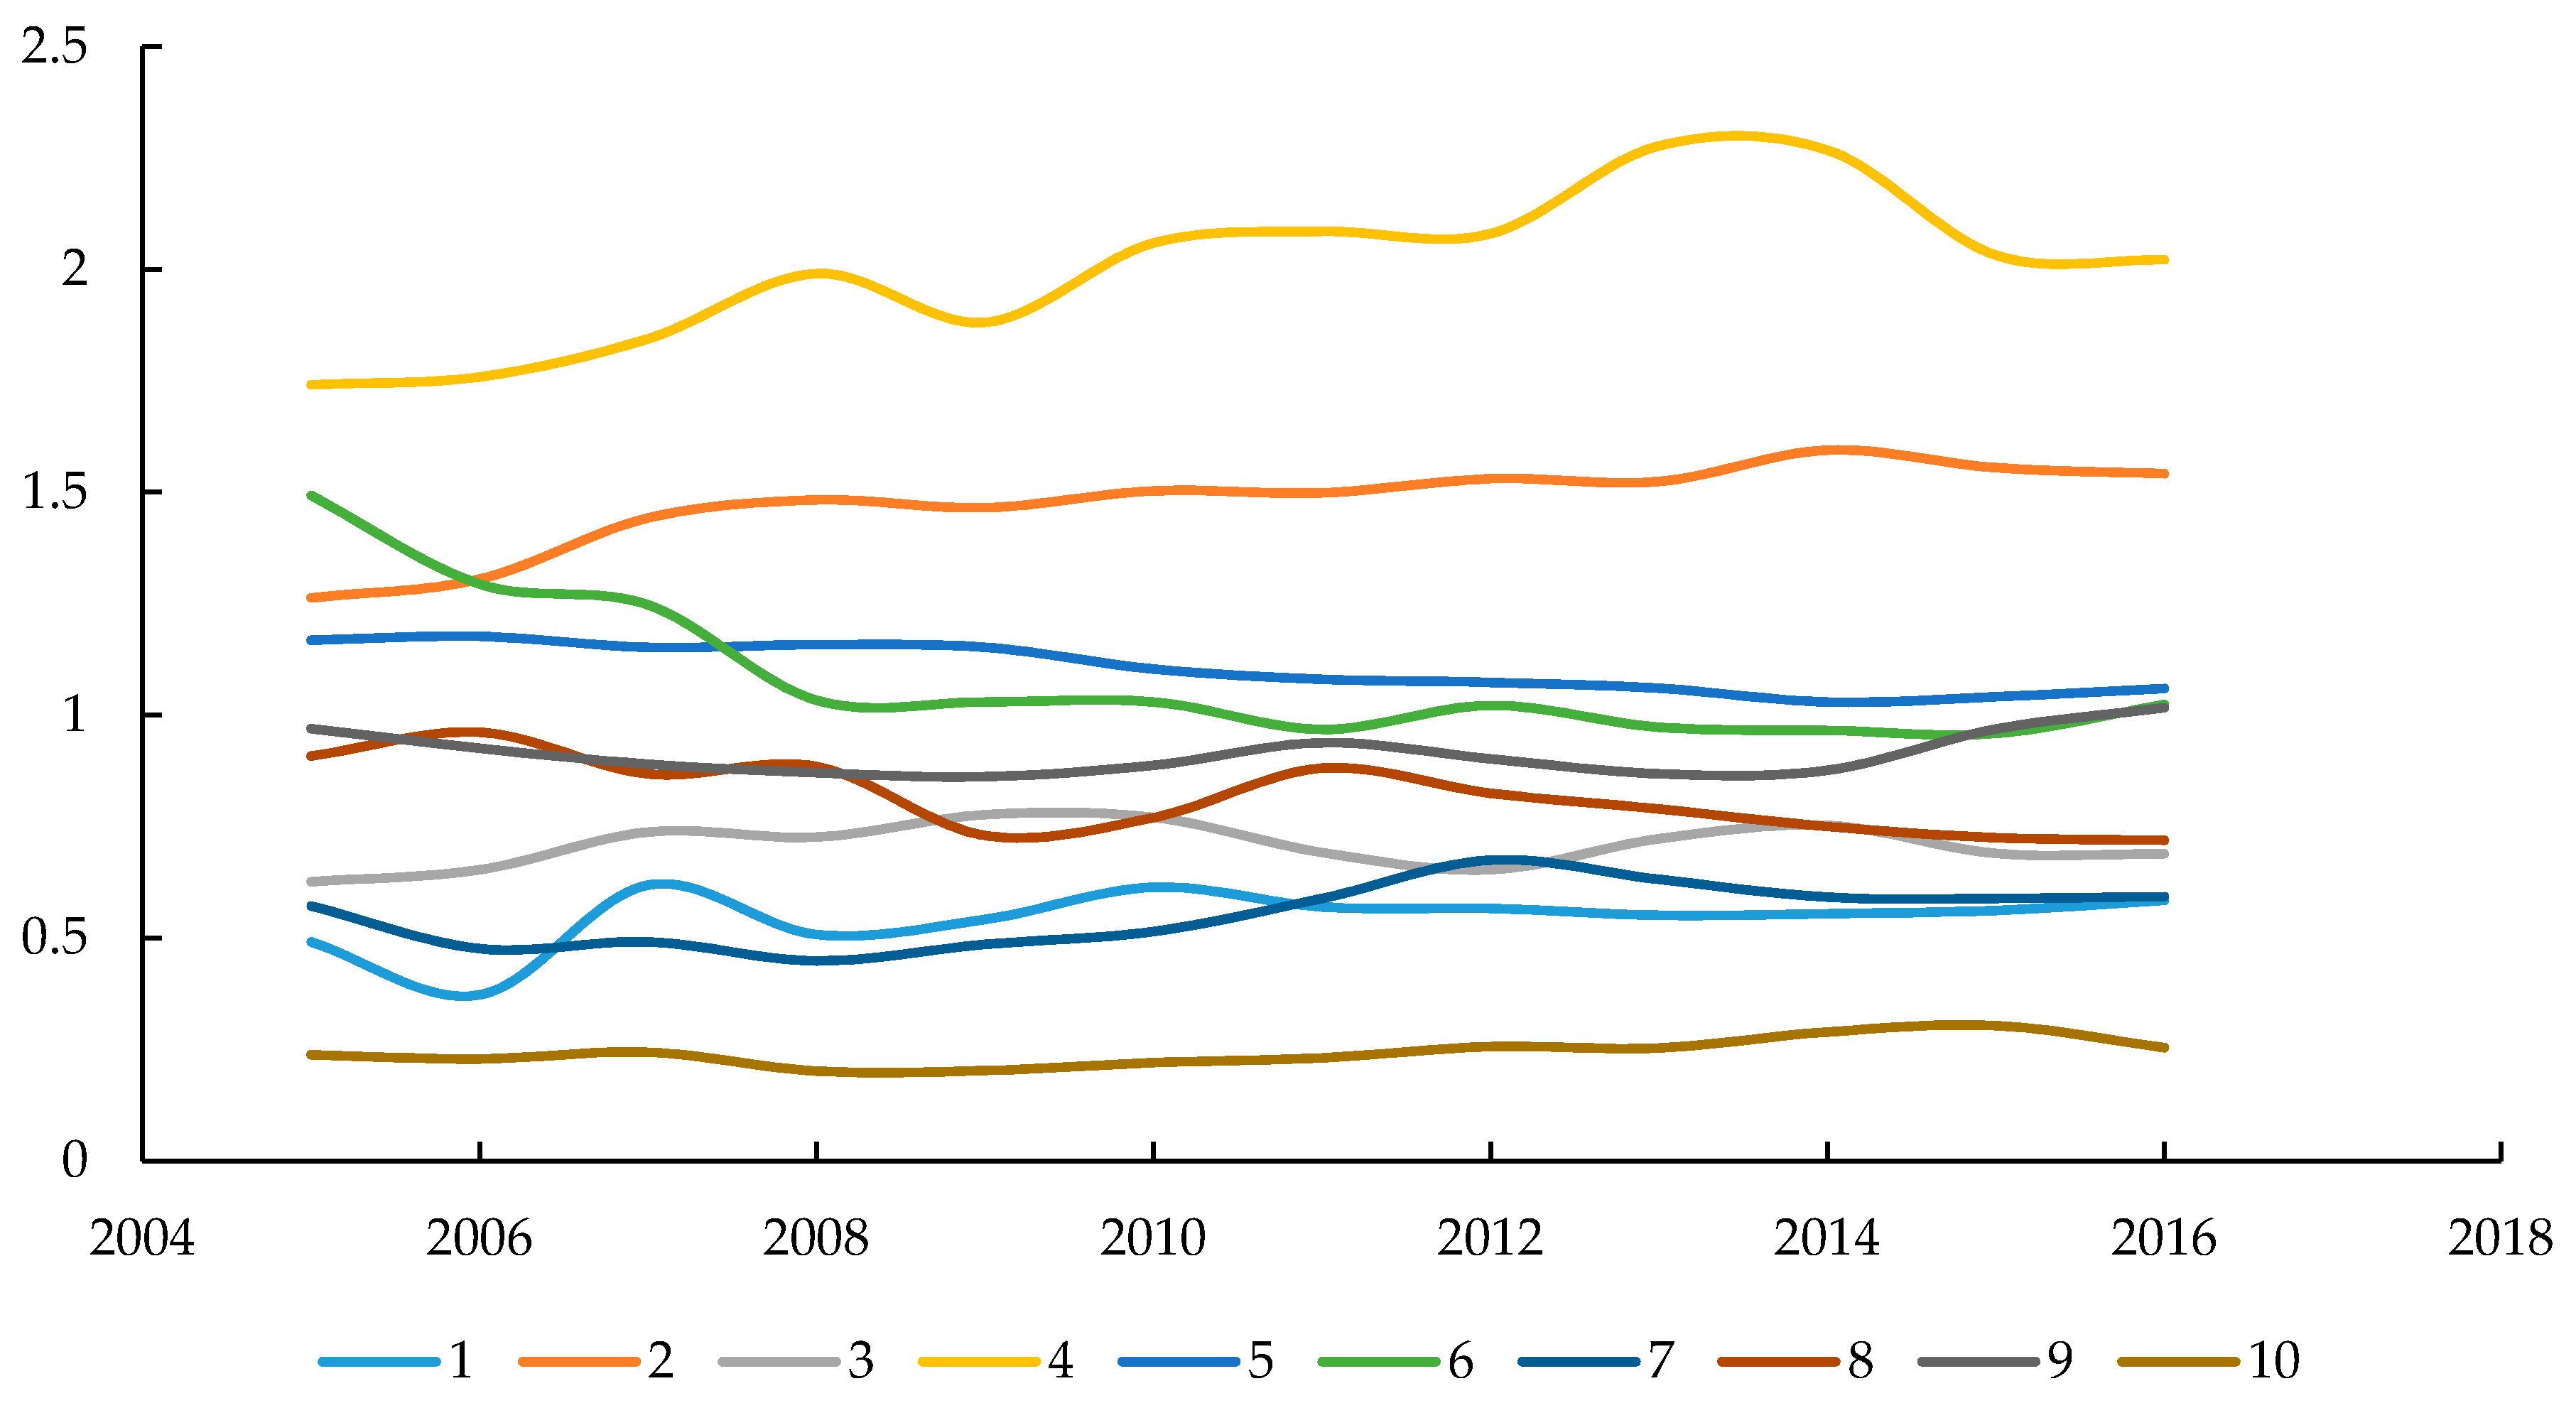
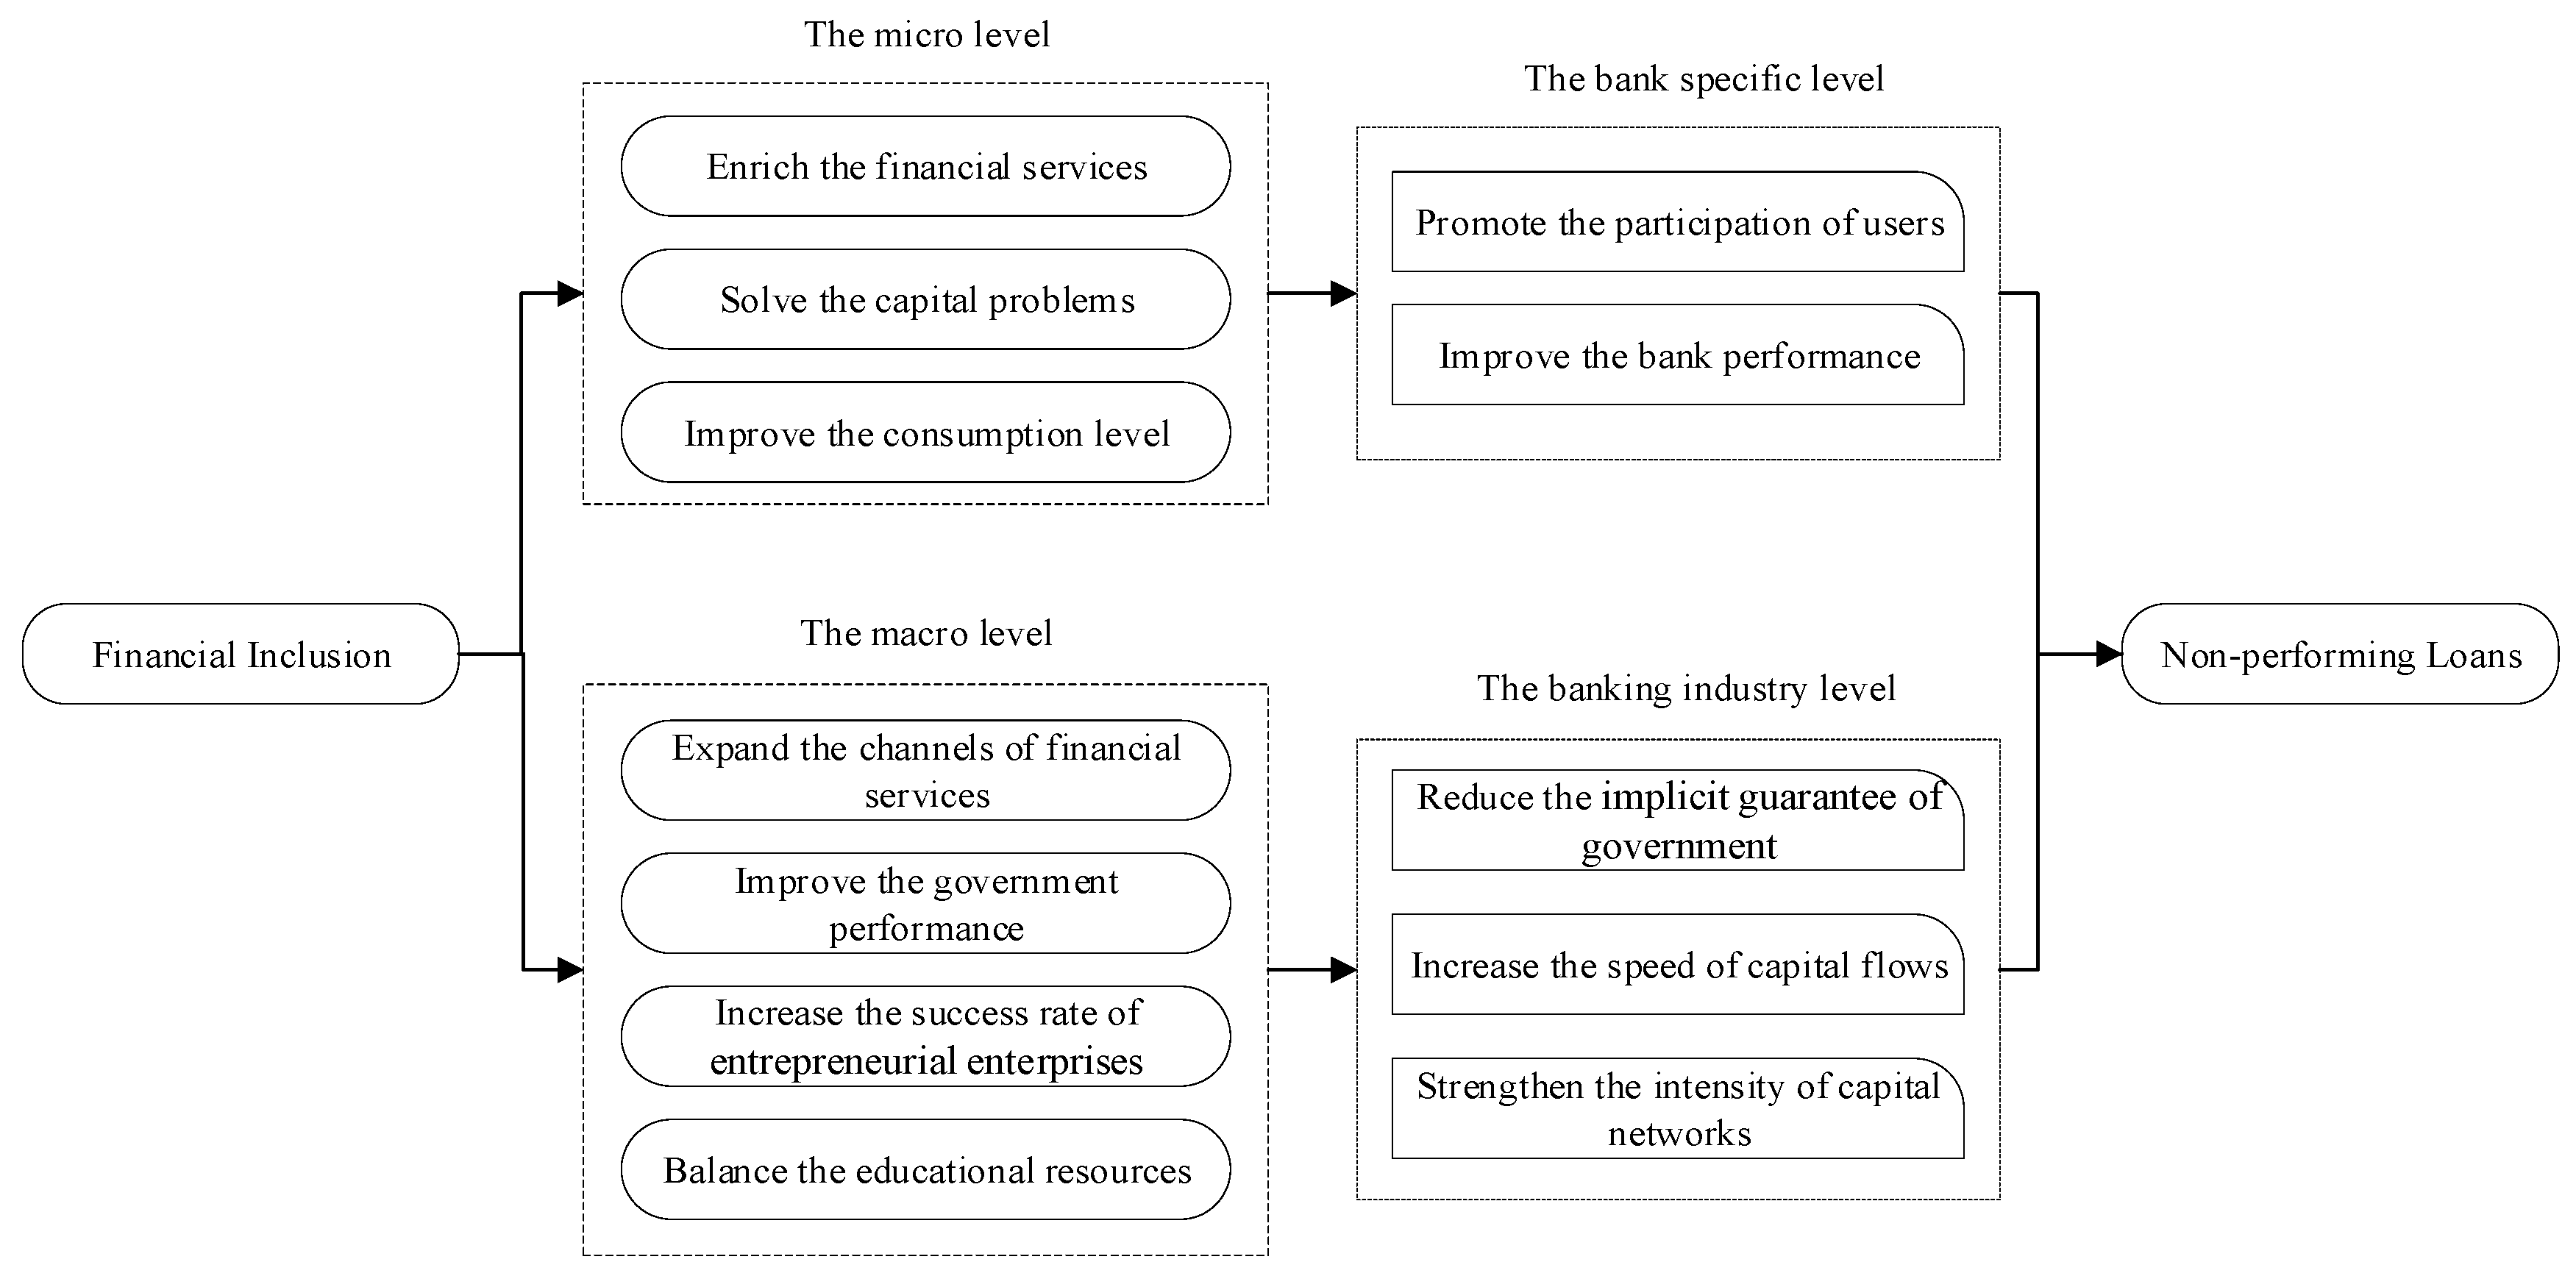
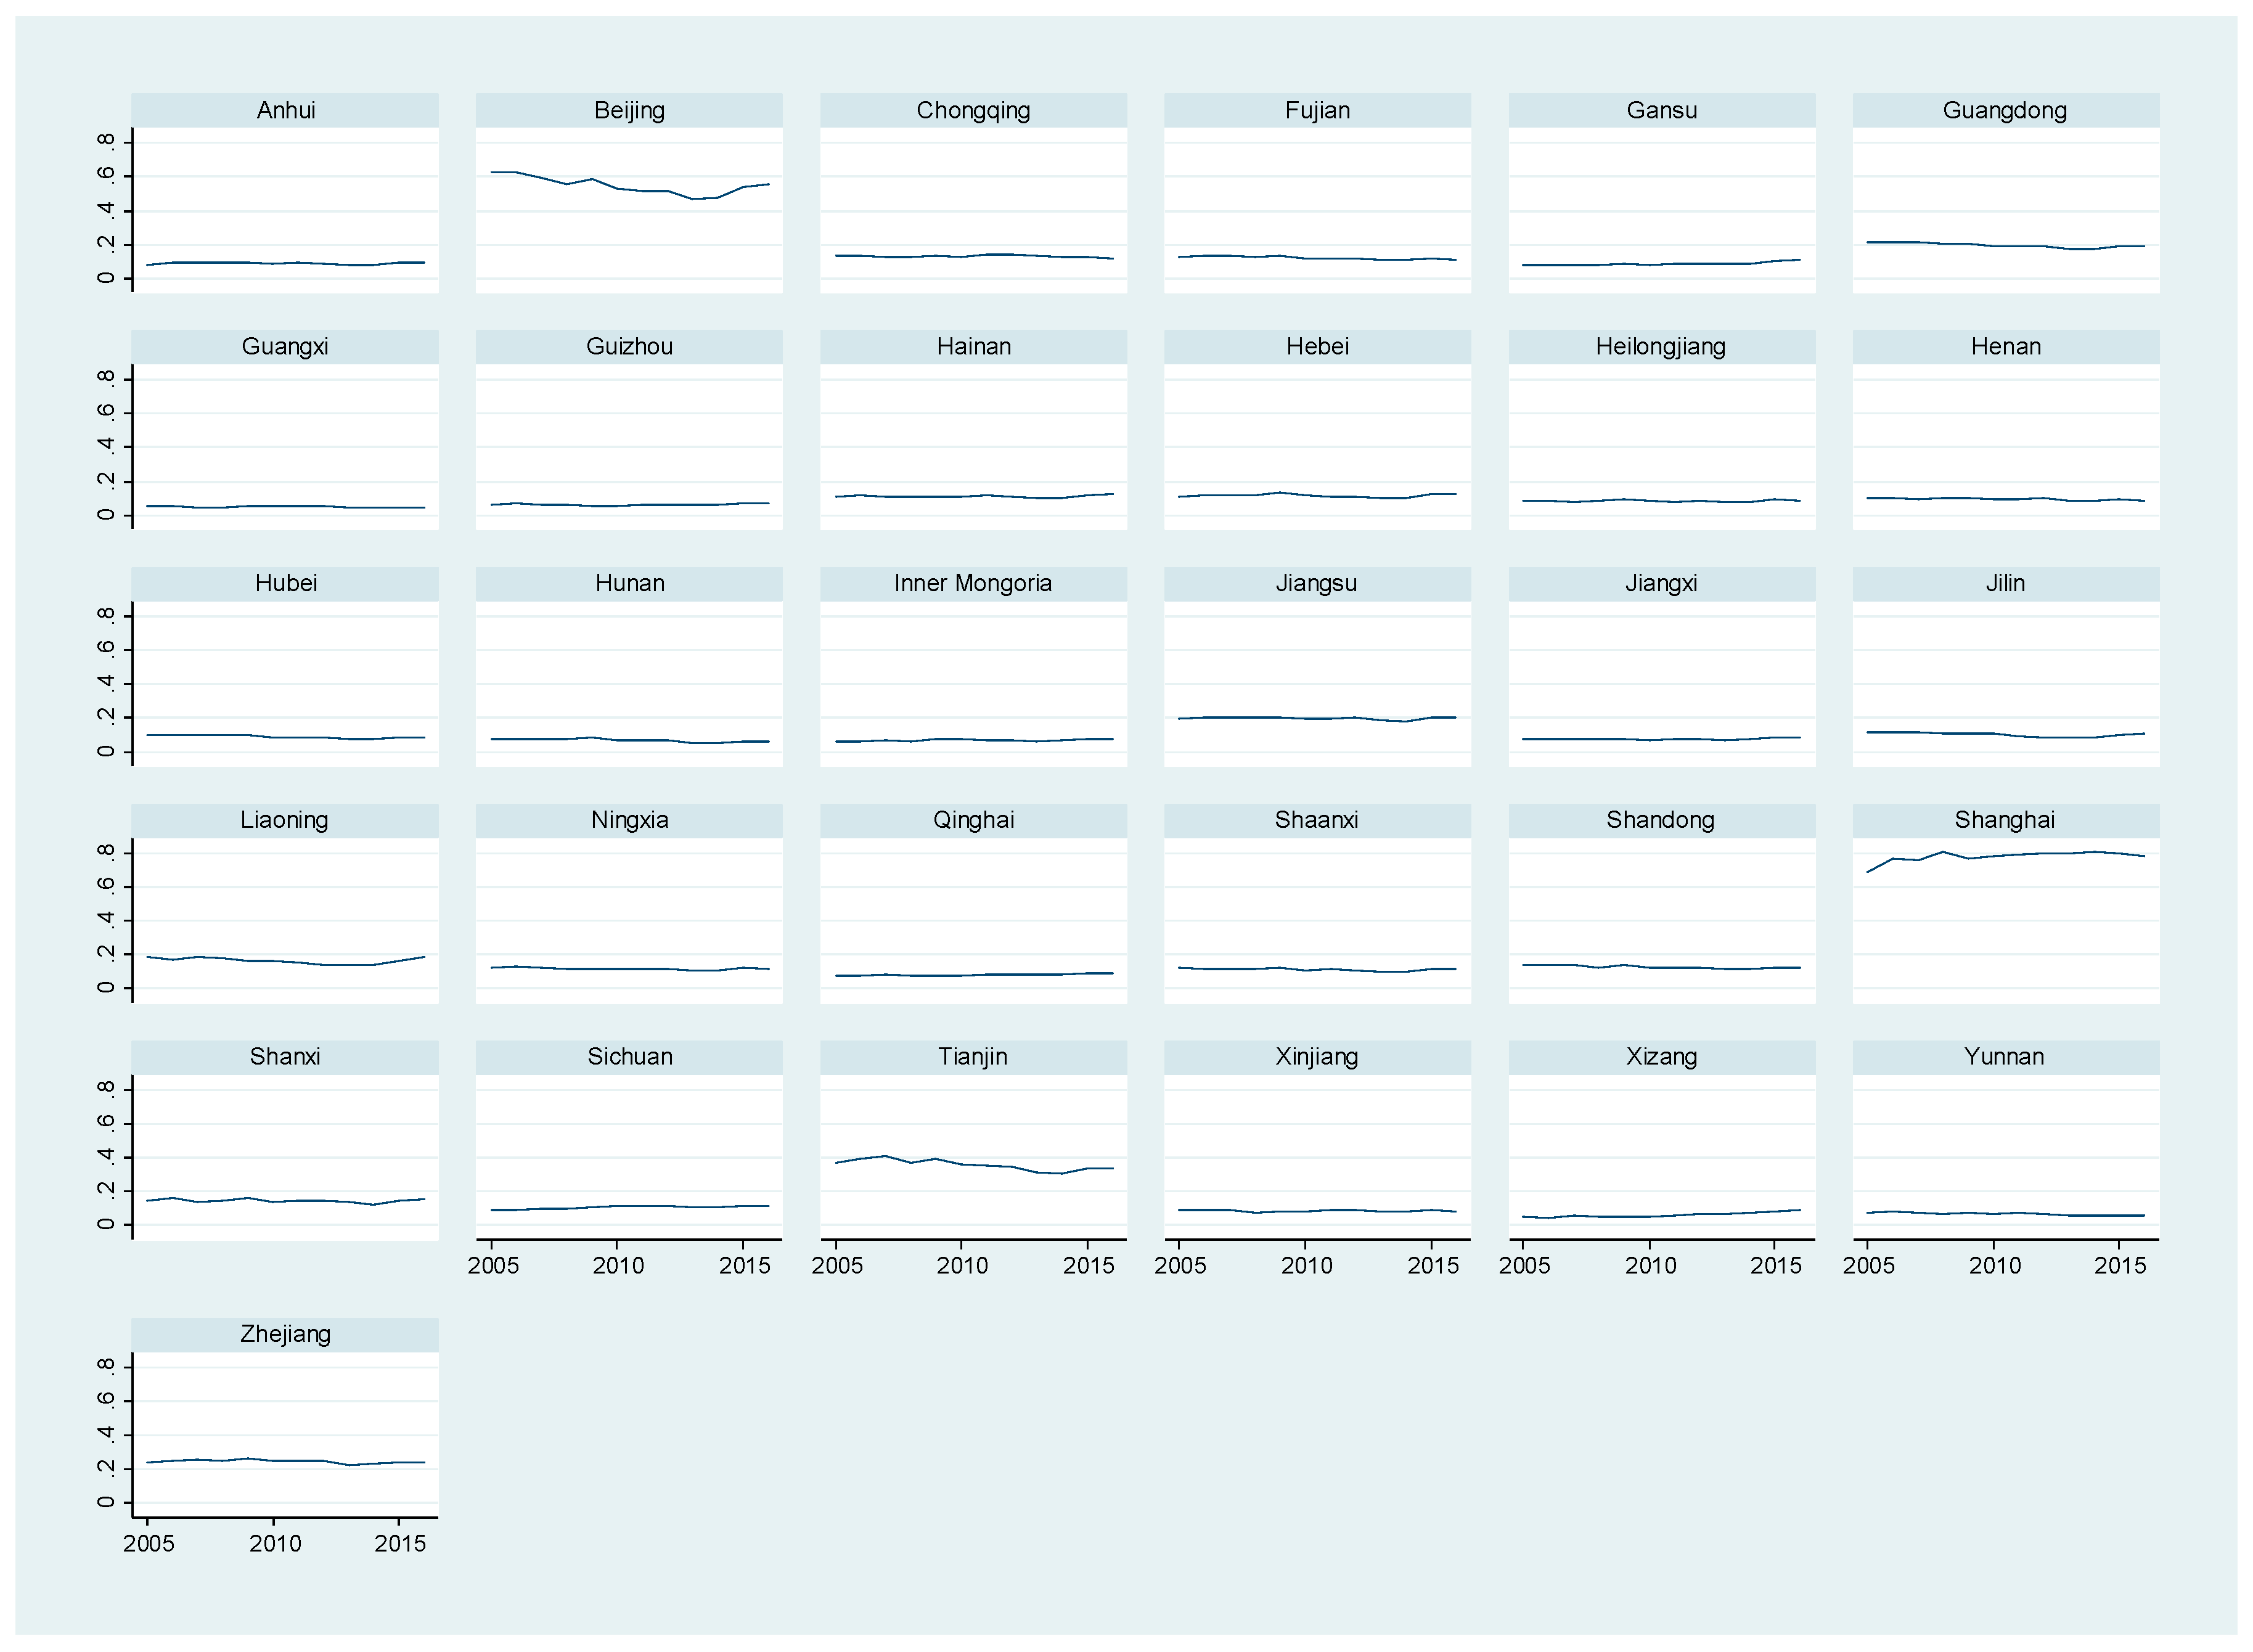
Table 1.
The specific indicators of China’s financial inclusion.
| NO. | Dimension | Specific Index |
|---|---|---|
| 1 | Availability of financial services | Number of branches of financial institutions/10,000 persons |
| 2 | Number of branches of financial institutions/10,000 square kilometers | |
| 3 | Number of financial practitioners/10,000 persons | |
| 4 | Number of financial practitioners/10,000 square kilometers | |
| 5 | Usability of financial services | Urban and rural resident’s deposits |
| 6 | Per capita insurance income | |
| 7 | Insurance income/GDP | |
| 8 | Utility of financial services | Loan balance of financial institutions/GDP |
| 9 | Deposit balance of financial institutions/GDP | |
| 10 | Receptivity of financial services | Total financing of non-financial institutions/GDP |
Table 2.
The variation coefficient of indicators.
| 2005 | 2006 | 2007 | 2008 | 2009 | 2010 | 2011 | 2012 | 2013 | 2014 | 2015 | 2016 | |
|---|---|---|---|---|---|---|---|---|---|---|---|---|
| 1 | 0.4908 | 0.3723 | 0.6187 | 0.5077 | 0.5415 | 0.6138 | 0.5696 | 0.5662 | 0.5511 | 0.5543 | 0.5617 | 0.5843 |
| 2 | 1.2631 | 1.3052 | 1.4426 | 1.4828 | 1.4656 | 1.5032 | 1.4989 | 1.5305 | 1.5243 | 1.5947 | 1.5552 | 1.5417 |
| 3 | 0.62s60 | 0.6529 | 0.7377 | 0.7262 | 0.7764 | 0.7705 | 0.6918 | 0.6530 | 0.7225 | 0.7527 | 0.6898 | 0.6889 |
| 4 | 1.7414 | 1.7591 | 1.8446 | 1.9910 | 1.8814 | 2.0594 | 2.0853 | 2.0804 | 2.2775 | 2.2681 | 2.0323 | 2.0216 |
| 5 | 1.1680 | 1.1766 | 1.1521 | 1.1581 | 1.1522 | 1.1033 | 1.0806 | 1.0736 | 1.0602 | 1.0294 | 1.0410 | 1.0600 |
| 6 | 1.4928 | 1.2942 | 1.2473 | 1.0334 | 1.0296 | 1.0295 | 0.9680 | 1.0218 | 0.9729 | 0.9659 | 0.9590 | 1.0237 |
| 7 | 0.5717 | 0.4761 | 0.4911 | 0.4486 | 0.4855 | 0.5145 | 0.5886 | 0.6747 | 0.6313 | 0.5915 | 0.5888 | 0.5929 |
| 8 | 0.9081 | 0.9615 | 0.8681 | 0.8846 | 0.7299 | 0.7700 | 0.8810 | 0.8248 | 0.7894 | 0.7500 | 0.7251 | 0.7190 |
| 9 | 0.9695 | 0.9255 | 0.8900 | 0.8709 | 0.8619 | 0.8875 | 0.9381 | 0.9020 | 0.8682 | 0.8762 | 0.9687 | 1.0164 |
| 10 | 0.2377 | 0.2285 | 0.2434 | 0.2012 | 0.2023 | 0.2199 | 0.2310 | 0.2561 | 0.2530 | 0.2891 | 0.3032 | 0.2539 |
Table 3.
Descriptive statistics of financial inclusion index and its 10 components (2005–2016).
| Variable | Average Value | Standard Deviation | Maximum Value | Minimum Value | CV Weight to Variables | Observations | Cross Sections |
|---|---|---|---|---|---|---|---|
| IFI | 0.1533 | 0.1514 | 0.0444 | 0.8105 | 372 | 31 | |
| 1 | 1.6053 | 0.3023 | 2.3929 | 0.6658 | 0.0575 | 372 | 31 |
| 2 | 684.6777 | 1020.0451 | 6445.8639 | 4.891 | 0.1561 | 372 | 31 |
| 3 | 25.4669 | 8.8522 | 57.3397 | 11.0231 | 0.0749 | 372 | 31 |
| 4 | 13,734.0494 | 28,891.3674 | 219,392.7924 | 42.8049 | 0.2118 | 372 | 31 |
| 5 | 2.6158 | 1.9691 | 12.8909 | 0.3622 | 0.1170 | 372 | 31 |
| 6 | 1.07 × 10⁻⁵ | 1.01 × 10⁻⁵ | 0.0001 | 5.71 × 10⁻⁵ | 0.1151 | 372 | 31 |
| 7 | 0.0274 | 0.0096 | 0.0716 | 0.0064 | 0.0586 | 372 | 31 |
| 8 | 1.1502 | 0.4202 | 2.6481 | 0.5372 | 0.0866 | 372 | 31 |
| 9 | 1.655 | 0.7362 | 5.5866 | 0.751 | 0.0968 | 372 | 31 |
| 10 | 0.2298 | 0.1464 | 1.3621 | 0.0251 | 0.0257 | 372 | 31 |
Table 4.
The introduction of variables.
| Type | Abbreviations | Variables | Definition |
|---|---|---|---|
| Explained Variable | NPLR | Non-performing loans | Non-performing loans is measured by the non-performing loans ratio of each province. |
| Explaining Variable | IFI | Financial inclusion | Financial inclusion is measured by the financial inclusion index in Section 2.1. |
| Control Variables | SIZE | Size of commercial bank assets | Size of commercial bank assets is measured by the proportion of the total assets of commercial banks to the regional GDP. |
| BD | Government budget deficit | Government budget deficit is measured by the proportion of the deference between government revenue and expenditure to the regional GDP. | |
| EDU | Education | Education is measured by the proportion of total years of education to the total sampling population aged over six years old. | |
| UNE | Unemployment rate | Unemployment rate is measured by the unemployment rate of each province. | |
| RGDP | Growth of real GDP | Growth of real GDP is measured by the growth of real GDP of each province. | |
| INFEL | Inflation | Inflation is measured by the consumer price index of each province. | |
| INV | Investment of fixed assets | Investment of fixed assets is measured by the proportion of total investment of fixed assets to the regional GDP. |
Table 5.
Descriptive statistics of variables.
| Variable | Average Value | Median | Maximum Value | Minimum Value | Standard Deviation | Observations | Cross Sections |
|---|---|---|---|---|---|---|---|
| NPLR | 0.025093 | 0.011043 | 0.160411 | 0.001968 | 0.031707 | 372 | 31 |
| IFI | 0.153273 | 0.105561 | 0.810508 | 0.044439 | 0.151419 | 372 | 31 |
| SIZE | 0.964267 | 0.817177 | 3.40677 | 0.429576 | 0.54061 | 372 | 31 |
| BD | −0.14299 | −0.10292 | −0.00839 | −1.24368 | 0.184161 | 372 | 31 |
| EDU | 8.551362 | 8.588939 | 12.30375 | 3.738414 | 1.207568 | 372 | 31 |
| UNE | 0.035457 | 0.036 | 0.056 | 0.012 | 0.006642 | 372 | 31 |
| RGDP | 0.112863 | 0.116 | 0.238 | −0.025 | 0.029048 | 372 | 31 |
| INFL | 0.028124 | 0.024 | 0.101 | −0.023 | 0.019537 | 372 | 31 |
| INV | 0.682962 | 0.67482 | 1.38617 | 0.239752 | 0.230919 | 372 | 31 |
Table 6.
Results of the unit root test.
| LLC | Breitung | IPS | ADF-Fisher | PP-Fisher | Stable or Not | ||||||
|---|---|---|---|---|---|---|---|---|---|---|---|
| NPLR | −7.4975 | (0.0000) | 5.1780 | (1.0000) | 3.5197 | (0.9998) | 30.4120 | (0.9998) | 60.6152 | (0.5260) | No |
| IFI | −5.7344 | (0.0000) | 1.0951 | (0.8633) | −1.0754 | (0.1411) | 78.6679 | (0.0751) | 98.0865 | (0.0024) | No |
| SIZE | −11.2655 | (0.0000) | −3.5805 | (0.0002) | −4.1716 | (0.0000) | 109.9420 | (0.0002) | 89.8662 | (0.0119) | Yes |
| BD | −5.7943 | (0.0000) | −0.3184 | (0.3751) | 0.8198 | (0.7938) | 51.1333 | (0.8361) | 52.9528 | (0.7867) | No |
| EDU | −8.5919 | (0.0000) | −4.2323 | (0.0000) | −3.0223 | (0.0013) | 93.5845 | (0.0059) | 117.7500 | (0.0000) | Yes |
| UNE | −5.4530 | (0.0000) | 0.7498 | (0.7733) | −0.9869 | (0.1618) | 72.5842 | (0.1684) | 60.8782 | (0.5165) | No |
| RGDP | −8.0785 | (0.0000) | 0.6018 | (0.7263) | −3.0066 | (0.0013) | 99.7877 | (0.0017) | 142.3770 | (0.0000) | No |
| INFL | −23.9186 | (0.0000) | −7.4887 | (0.0000) | −12.4875 | (0.0000) | 247.9580 | (0.0000) | 255.9310 | (0.0000) | Yes |
| INV | −8.3325 | (0.0000) | 0.9379 | (0.8258) | −2.2689 | (0.0116) | 95.5351 | (0.0040) | 109.7080 | (0.0002) | No |
| ΔNPLR | −15.4336 | (0.0000) | −2.7331 | (0.0031) | −4.0737 | (0.0000) | 140.0510 | (0.0000) | 217.3930 | (0.0000) | Yes |
| ΔIFI | −18.6622 | (0.0000) | −8.3400 | (0.0000) | −6.7671 | (0.0000) | 183.9220 | (0.0000) | 311.6700 | (0.0000) | Yes |
| ΔSIZE | −30.1422 | (0.0000) | −6.3672 | (0.0000) | −9.2032 | (0.0000) | 208.3010 | (0.0000) | 222.0400 | (0.0000) | Yes |
| ΔBD | −13.8270 | (0.0000) | −5.9434 | (0.0000) | −3.6899 | (0.0001) | 125.0060 | (0.0000) | 226.6790 | (0.0000) | Yes |
| ΔEDU | −18.1288 | (0.0000) | −12.2978 | (0.0000) | −8.5527 | (0.0000) | 183.0610 | (0.0000) | 315.2620 | (0.0000) | Yes |
| ΔUNE | −13.1066 | (0.0000) | −4.8231 | (0.0000) | −4.3870 | (0.0000) | 129.2200 | (0.0000) | 191.1350 | (0.0000) | Yes |
| ΔRGDP | −30.7536 | (0.0000) | −6.1491 | (0.0000) | −9.9855 | (0.0000) | 216.9660 | (0.0000) | 248.8450 | (0.0000) | Yes |
| ΔINFL | −24.8982 | (0.0000) | −20.8565 | (0.0000) | −7.3087 | (0.0000) | 236.4480 | (0.0000) | 377.1940 | (0.0000) | Yes |
| ΔINV | −13.2797 | (0.0000) | −3.7963 | (0.0001) | −2.7732 | (0.0028) | 114.3330 | (0.0001) | 135.0700 | (0.0000) | Yes |
Note: The results of the unit root test of various in the parentheses are the corresponding p values; Δ indicates the first-order difference processing on the variable.
Table 7.
Results of discriminating the panel data model type.
| Test Method | Hypothesis | Statistic | p Value |
|---|---|---|---|
| F test | H0: The true model is a mixed regression model | 5.8295 | 0.0000 |
| H1: The true model is a fixed effects model | |||
| Hausman test | H0: The true model is a random effect model | 168.0101 | 0.0000 |
| H1: The true model is a fixed effects model |
Table 8.
Regression results of overall samples.
| Variable | Model 1 | Model 2 | Model 3 | Model 4 | Model 5 |
|---|---|---|---|---|---|
| IFI | −0.2725 *** | −0.1292 * | −0.2777 *** | −0.3154 *** | −0.1420 * |
| (−3.4122) | (−1.7090) | (−3.4155) | (−3.9990) | (−1.9023) | |
| IFIt−1 | 0.0593 | 0.07458 | 0.0905 | 0.1124 | 0.0938 |
| (0.8572) | (1.17340) | (1.2868) | (1.6411) | (1.5133) | |
| SIZE | −0.0261 *** | −0.0012 | |||
| (−3.8700) | (−0.1387) | ||||
| SIZEt−1 | −0.0027 | 0.0025 | |||
| (−0.4417) | (0.4059) | ||||
| BD | 0.0753 * | 0.1062 ** | |||
| (1.7829) | (2.2227) | ||||
| BDt−1 | 0.1060 *** | 0.0514 | |||
| (2.6152) | (1.0914) | ||||
| EDU | 0.0091 * | 0.0045 | |||
| (1.9146) | (1.0557) | ||||
| EDUt−1 | 0.0033 | 0.0062 | |||
| (0.7069) | (1.4719) | ||||
| UNE | 1.3916 *** | 0.3024 | |||
| (3.2745) | (0.7705) | ||||
| UNEt−1 | −0.1012 | −0.1584 | |||
| (−0.2405) | (−0.4157) | ||||
| RGDP | −0.05869 | −0.0143 | |||
| (−0.9327) | (−0.2435) | ||||
| RGDPt−1 | 0.0256 | 0.0183 | |||
| (0.4228) | (0.3333) | ||||
| INFL | −0.3803 *** | −0.3156 *** | |||
| (−3.0390) | (−2.6967) | ||||
| INFLt−1 | −0.36969 *** | −0.2627 ** | |||
| (−3.1521) | (−2.4129) | ||||
| INV | −0.0046 | 0.013389 | |||
| (−0.2935) | (0.9346) | ||||
| INVt−1 | −0.0541 *** | −0.0582 *** | |||
| (−3.1016) | (−3.6167) | ||||
| Constant | 0.0804 *** | 0.0542 *** | −0.1035 ** | 0.1156 *** | −0.0021 |
| (8.0971) | (6.3173) | (−2.2531) | (8.8772) | (−0.0454) | |
| Province—fixed effects | Yes | Yes | Yes | Yes | Yes |
| Period—fixed effects | Yes | Yes | Yes | Yes | Yes |
| Adjusted R2 | 0.7646 | 0.7998 | 0.7567 | 0.7712 | 0.8170 |
| Observations | 341 | 341 | 341 | 341 | 341 |
| Cross sections | 31 | 31 | 31 | 31 | 31 |
| F statistic | 26.1003 *** | 31.8797 *** | 23.9941 *** | 24.8768 *** | 28.1134 *** |
Note: figures in parentheses are the t statistics of estimated coefficients; ***, **, * represent the significance at the level of 1%, 5%, 10% respectively.
Table 9.
The subsamples of different division methods.
| Samples Division | Regions |
|---|---|
| IFI = good | Shanghai, Beijing, Tianjin, Zhejiang, Jiangsu, Guangdong, Liaoning, Shanxi, Chongqing, Shandong |
| IFI = medium | Fujian, Ningxia, Hebei, Shaanxi, Hainan, Sichuan, Jilin, Henan, Hubei, Anhui, Gansu |
| IFI = bad | Heilongjiang, Xinjiang, Qinghai, Jiangxi, Hunan, Inner Mongolia, Yunnan, Guizhou, Tibet, Guangxi |
| Location = east | Beijing, Tianjin, Hebei, Liaoning, Shanghai, Jiangsu, Zhejiang, Fujian, Shandong, Guangdong, Hainan |
| Location = central | Shanxi, Jilin, Heilongjiang, Anhui, Jiangxi, Henan, Hubei, Hunan |
| Location = west | Inner Mongolia, Guangxi, Chongqing, Sichuan, Guizhou, Yunnan, Shaanxi, Gansu, Qinghai, Ningxia, Xinjiang, Tibet |
Table 10.
The regression results of different subsamples.
| Variable | Model 6 | Model 7 | Model 8 | Model 9 | Model 10 | Model 11 |
|---|---|---|---|---|---|---|
| IFI (Good) | IFI (Medium) | IFI (Bad) | East Regions | Central Regions | West Regions | |
| IFI | −0.0189 | −0.2127 | −0.3678 | 0.0190 | −0.5117 * | 0.2454 |
| (−0.2657) | (−0.8872) | (−1.2199) | (0.2093) | (−1.8315) | (1.4354) | |
| IFIt−1 | 0.0948 * | −0.0143 | 0.2700 | 0.0699 | 0.8844 *** | −0.2580 |
| (1.7903) | (−0.0621) | (0.9178) | (1.0116) | (2.7996) | (−1.4528) | |
| SIZE | 0.0141 | −0.0884 *** | −0.0459 *** | 0.0052 | −0.0042 | −0.0355 *** |
| (1.2709) | (−3.1950) | (−3.0421) | (0.3668) | (−0.0860) | (−3.7701) | |
| SIZEt−1 | −0.0012 | 0.0055 | −0.0079 | 0.0012 | 0.0803 * | 0.0034 |
| (−0.1040) | (0.2170) | (−0.9319) | (0.0839) | (1.9011) | (0.6137) | |
| BD | −0.0407 | −0.1947 * | −0.0289 | 0.4094 ** | 0.0883 | 0.0118 |
| (−0.2557) | (−1.7806) | (−0.3991) | (2.4863) | (0.3815) | (0.2797) | |
| BDt−1 | 0.1105 | 0.1869 | −0.0035 | 0.3870 ** | 0.5875 ** | 0.0187 |
| (0.6292) | (1.6484) | (−0.0553) | (2.3850) | (2.5129) | (0.4732) | |
| EDU | −0.0037 | 0.0127 * | 0.0049 | −0.0034 | 0.0121 | 0.0015 |
| (−0.4624) | (1.7212) | (0.7540) | (−0.3506) | (1.4609) | (0.3626) | |
| EDUt−1 | 0.0191 ** | 0.0047 | 0.0073 | 0.0231 ** | 0.0151 * | −0.0009 |
| (2.4530) | (0.6566) | (1.1173) | (2.4964) | (1.7577) | (−0.2339) | |
| UNE | −0.1300 | 0.0858 | 0.4420 | 0.0745 | −1.0853 | 0.6635 |
| (−0.2338) | (0.1493) | (0.4922) | (0.1204) | (−1.3491) | (1.2441) | |
| UNEt−1 | 0.5623 | 1.0713 * | −2.6788 *** | 0.6333 | 1.6219 * | −0.5313 |
| (1.1683) | (1.7043) | (−2.6806) | (1.1844) | (1.7340) | (−0.9772) | |
| RGDP | 0.0126 | 0.2923 ** | −0.0454 | 0.0371 | −0.4479 *** | −0.0188 |
| (0.1755) | (2.4791) | (−0.3848) | (0.3052) | (−3.0095) | (−0.2625) | |
| RGDPt−1 | −0.0560 | −0.0157 | 0.0349 | −0.0317 | 0.2152 * | 0.0484 |
| (−0.7438) | (−0.1608) | (0.3334) | (−0.2535) | (1.7775) | (0.8018) | |
| INFL | 0.1541 | −0.2972 | −0.3877 * | −0.1418 | −0.3043 | −0.3973 *** |
| (0.7340) | (−1.5623) | (−1.9631) | (−0.5636) | (−0.8549) | (−3.5093) | |
| INFLt−1 | −0.1391 | −0.1658 | −0.0333 | −0.2533 | −0.8373 ** | −0.2219 ** |
| (−0.7289) | (−0.8785) | (−0.1887) | (−1.0471) | (−2.6355) | (−2.0587) | |
| INV | 0.0367 * | −0.0168 | −0.0278 | 0.0136 | 0.0420 | −0.0260 |
| (1.7866) | (−0.5392) | (−1.0710) | (0.4542) | (1.4788) | (−1.5213) | |
| INVt−1 | −0.0633 ** | −0.0245 | −0.0335 | −0.0514 | −0.0352 | −0.0169 |
| (−2.3254) | (−0.8586) | (−1.2654) | (−1.4347) | (−1.2105) | (−0.8991) | |
| Constant | −0.1579 ** | −0.0664 | 0.1216 | −0.1535 | −0.1996 ** | 0.1031 ** |
| (−2.0713) | (−0.8934) | (1.5699) | (−1.4922) | (−2.1192) | (2.3061) | |
| Province—fixed effects | Yes | Yes | Yes | Yes | Yes | Yes |
| Period—fixed effects | Yes | Yes | Yes | Yes | Yes | Yes |
| Adjusted R2 | 0.7073 | 0.8881 | 0.8838 | 0.7256 | 0.9068 | 0.9252 |
| Observations | 110 | 121 | 110 | 121 | 88 | 132 |
| Cross sections | 10 | 11 | 10 | 11 | 8 | 12 |
| F statistic | 8.5257 *** | 27.4624 *** | 24.6940 *** | 9.8161 *** | 26.6406 *** | 44.7897 *** |
Note: figures in parentheses are the t statistics of estimated coefficients; ***, **, * represent the significance at the level of 1%, 5%, 10% respectively.
Table 11.
Regression results of overall samples in different period.
| Variable | Model 12 Pre-Crisis | Model 13 Crisis | Model 14 Post-Crisis |
|---|---|---|---|
| IFI | 0.1874 | −0.0327 | −0.0629 ** |
| (0.8323) | (−0.7259) | (−2.2143) | |
| IFIt−1 | 0.1338 | −0.0316 | −0.0042 |
| (0.9628) | (−0.8092) | (−0.1220) | |
| SIZE | −0.0812 * | 0.0022 | 0.0021 |
| (−2.0815) | (0.3302) | (0.5723) | |
| SIZEt−1 | 0.0016 | 0.0011 | −0.0104 *** |
| (0.2218) | (0.2627) | (−2.712) | |
| BD | −0.2090 | 0.0070 | 0.0360 * |
| (−1.3866) | (0.3275) | (1.7438) | |
| BDt−1 | 0.1552 | 0.0132 | −0.0325 |
| (0.6868) | (0.5666) | (−1.3501) | |
| EDU | −0.0213 | −0.0003 | 0.0008 |
| (−1.2337) | (−0.1131) | (0.6560) | |
| EDUt−1 | 0.0170 | −0.0022 | −0.0006 |
| (1.4611) | (−0.8492) | (−0.5052) | |
| UNE | −0.2586 | 0.2873 | 0.2762 * |
| (−0.2681) | (1.5290) | (1.9360) | |
| UNEt−1 | 3.3774 ** | −0.1357 | −0.1412 |
| (2.4643) | (−0.5249) | (−0.9902) | |
| RGDP | −0.1204 | −0.0313 | 0.0280 |
| (−0.9075) | (−1.0452) | (0.9823) | |
| RGDPt−1 | −0.0667 | 0.0406 | −0.0984 *** |
| (−0.5760) | (1.3871) | (−3.8062) | |
| INFL | −0.1357 | −0.0855 | −0.0434 |
| (−0.6749) | (−1.5881) | (−0.7495) | |
| INFLt−1 | 0.0377 | 0.0187 | −0.0574 |
| (0.1726) | (0.3831) | (−0.9055) | |
| INV | 0.0362 | −0.0099 | −0.0036 |
| (0.4231) | (−1.1178) | (−0.8039) | |
| INVt−1 | −0.0214 | −0.0214 ** | 0.0062 |
| (−0.2608) | (−2.5013) | (1.1421) | |
| Constant | 0.0134 | 0.0559 * | 0.0297 * |
| (0.0759) | (1.8689) | (1.7217) | |
| Province—fixed effects | Yes | Yes | Yes |
| Period—fixed effects | Yes | Yes | Yes |
| Adjusted R2 | 0.9785 | 0.8172 | 0.8214 |
| Observations | 62 | 124 | 155 |
| Cross sections | 31 | 31 | 31 |
| F statistic | 59.9693 *** | 12.2244 *** | 15.1630 *** |
Note: figures in parentheses are the t statistics of estimated coefficients; ***, **, * represent the significance at the level of 1%, 5%, 10%, respectively.
© 2018 by the authors. Licensee MDPI, Basel, Switzerland. This article is an open access article distributed under the terms and conditions of the Creative Commons Attribution (CC BY) license (http://creativecommons.org/licenses/by/4.0/).
Share and Cite
MDPI and ACS Style
Chen, F.-W.; Feng, Y.; Wang, W. Impacts of Financial Inclusion on Non-Performing Loans of Commercial Banks: Evidence from China. Sustainability 2018, 10, 3084. https://doi.org/10.3390/su10093084
AMA Style
Chen F-W, Feng Y, Wang W. Impacts of Financial Inclusion on Non-Performing Loans of Commercial Banks: Evidence from China. Sustainability. 2018; 10(9):3084. https://doi.org/10.3390/su10093084
Chicago/Turabian StyleChen, Feng-Wen, Yuan Feng, and Wei Wang. 2018. "Impacts of Financial Inclusion on Non-Performing Loans of Commercial Banks: Evidence from China" Sustainability 10, no. 9: 3084. https://doi.org/10.3390/su10093084
Note that from the first issue of 2016, this journal uses article numbers instead of page numbers. See further details here.