Sustainability and Shared Mobility Models


School of Geography and Planning, Cardiff University, Cardiff CF10 3WA, UK
Sustainability 2018, 10(9), 3194; https://doi.org/10.3390/su10093194
Submission received: 27 July 2018
/
Revised: 23 August 2018
/
Accepted: 23 August 2018
/
Published: 7 September 2018
(This article belongs to the Special Issue Sustainable Transport: Transport, Environment, and Development)
Abstract
:Shared mobility or mobility in the sharing economy is characterised by the sharing of a vehicle instead of ownership, and the use of technology to connect users and providers. Based on a literature review, the following four emerging models are identified: (1) peer to peer provision with a company as a broker, providing a platform where individuals can rent their cars when not in use; (2) short term rental of vehicles managed and owned by a provider; (3) companies that own no cars themselves but sign up ordinary car owners as drivers; and (4) on demand private cars, vans, or buses, and other vehicles, such as big taxis, shared by passengers going in the same direction. The first three models can yield profits to private parties, but they do not seem to have the potential to reduce congestion or CO2 emissions substantially. The fourth model, which entails individuals not only sharing a vehicle, but actually travelling together at the same time, is promising in terms of congestion and CO2 emissions reductions. It is also the least attractive to individuals, given the disbenefits in terms of waiting time, travel time, comfort, and convenience, in comparison with the private car. Potential incentives to encourage shared mobility are also discussed, and research needs are outlined.
1. Introduction
Shared mobility is seen as a promising way to reduce traffic congestion and CO2 emissions [1,2,3,4], although the extent of these reductions would depend on the type of shared mobility. For example, trips made by one person or a driver and a passenger, will yield lower benefits than public transport on demand, in terms of congestion and CO2 emissions [5] (p. 9).
Given the potential benefits of shared mobility, a comparison can be made with electric vehicles, which are also seen as a promising option for reducing CO2 emissions [6,7,8]. Indeed, governments at local and national level have implemented a range of incentives to accelerate electric vehicle uptake [9,10,11,12,13], and these incentives have been analysed and scrutinised in order to understand their impact [14,15,16,17,18,19] and learn lessons.
It seems surprising then that governments at national and local level do not appear to have introduced incentives to encourage shared mobility. Save a few hundred bicycle-sharing schemes in place in cities throughout the world, many of which were originally implemented before the Internet age, and most of which receive government subsidy, shared mobility is not being promoted by any government, although there are some pilot projects, which are small and localised. One example is the pilot mobility station in Munich. This mobility station, introduced in November 2014, is a hub with a public transport station, as well as parking places reserved for car-sharing vehicles and a bike-sharing station [20]. It should be emphasised that this is a very small project, with only six parking places for car-sharing vehicles and 20 docks for shared-bicycles.
One reason that governments have not actively encouraged shared mobility, in contrast with electric vehicle market penetration, may be that shared mobility is a much newer concept. Electric vehicles were already available, although to a much lesser extent than today, in the early 1990s, with Norway already introducing incentives for battery electric vehicles back then [9]. Shared mobility, defined as technology enabled mobility services in the sharing economy, on the other hand, is still emerging. Uber, for example, only started operations in 2009. Another reason that governments have not actively encouraged shared mobility may be that they are simply not interested in doing so, or are not clear on what benefits could be derived from such actions.
The literature offers a number of case studies [21,22,23] focusing on the impacts [24], travel behaviour [20,25,26,27], comparisons of car-sharing systems [28], technical papers on how to coordinate/manage shared mobility [29,30,31,32,33], and hypothetical uptake [34,35,36,37,38]. The research has also focused on Uber [39,40,41], probably because it has grown substantially since it started in 2009. Interestingly, no academic papers seem to have ever been published on incentives to encourage shared mobility, although there is a study on the lack of incentives for shared mobility in the United States, which concludes that taxes on car sharing services, in which vehicles are available to members at strategic locations, are actually in general higher than local taxes on sales and taxes on other forms of passenger transport [42].
On the basis of a literature review, we identify four models of shared mobility, discuss their impacts on sustainability, and potential incentives to promote them, with a focus on the one model that seems to have the potential to reduce congestion and CO2 emissions the most. Section 2 defines the models and discusses their impacts on sustainability, Section 3 concentrates on incentives, Section 4 highlights research needs, and Section 5 concludes.
2. Shared Mobility Models and Their Impact on Sustainability
There is no generally accepted definition of what activities constitute the ‘sharing economy’, sometimes also referred to as ‘collaborative consumption’, ‘access-based consumption’, or ‘connected consumption’ [43]. One non-controversial way of defining the sharing economy is as “the phenomenon of turning unused or under-used assets owned by individuals into productive resources” [41] (p. 3).
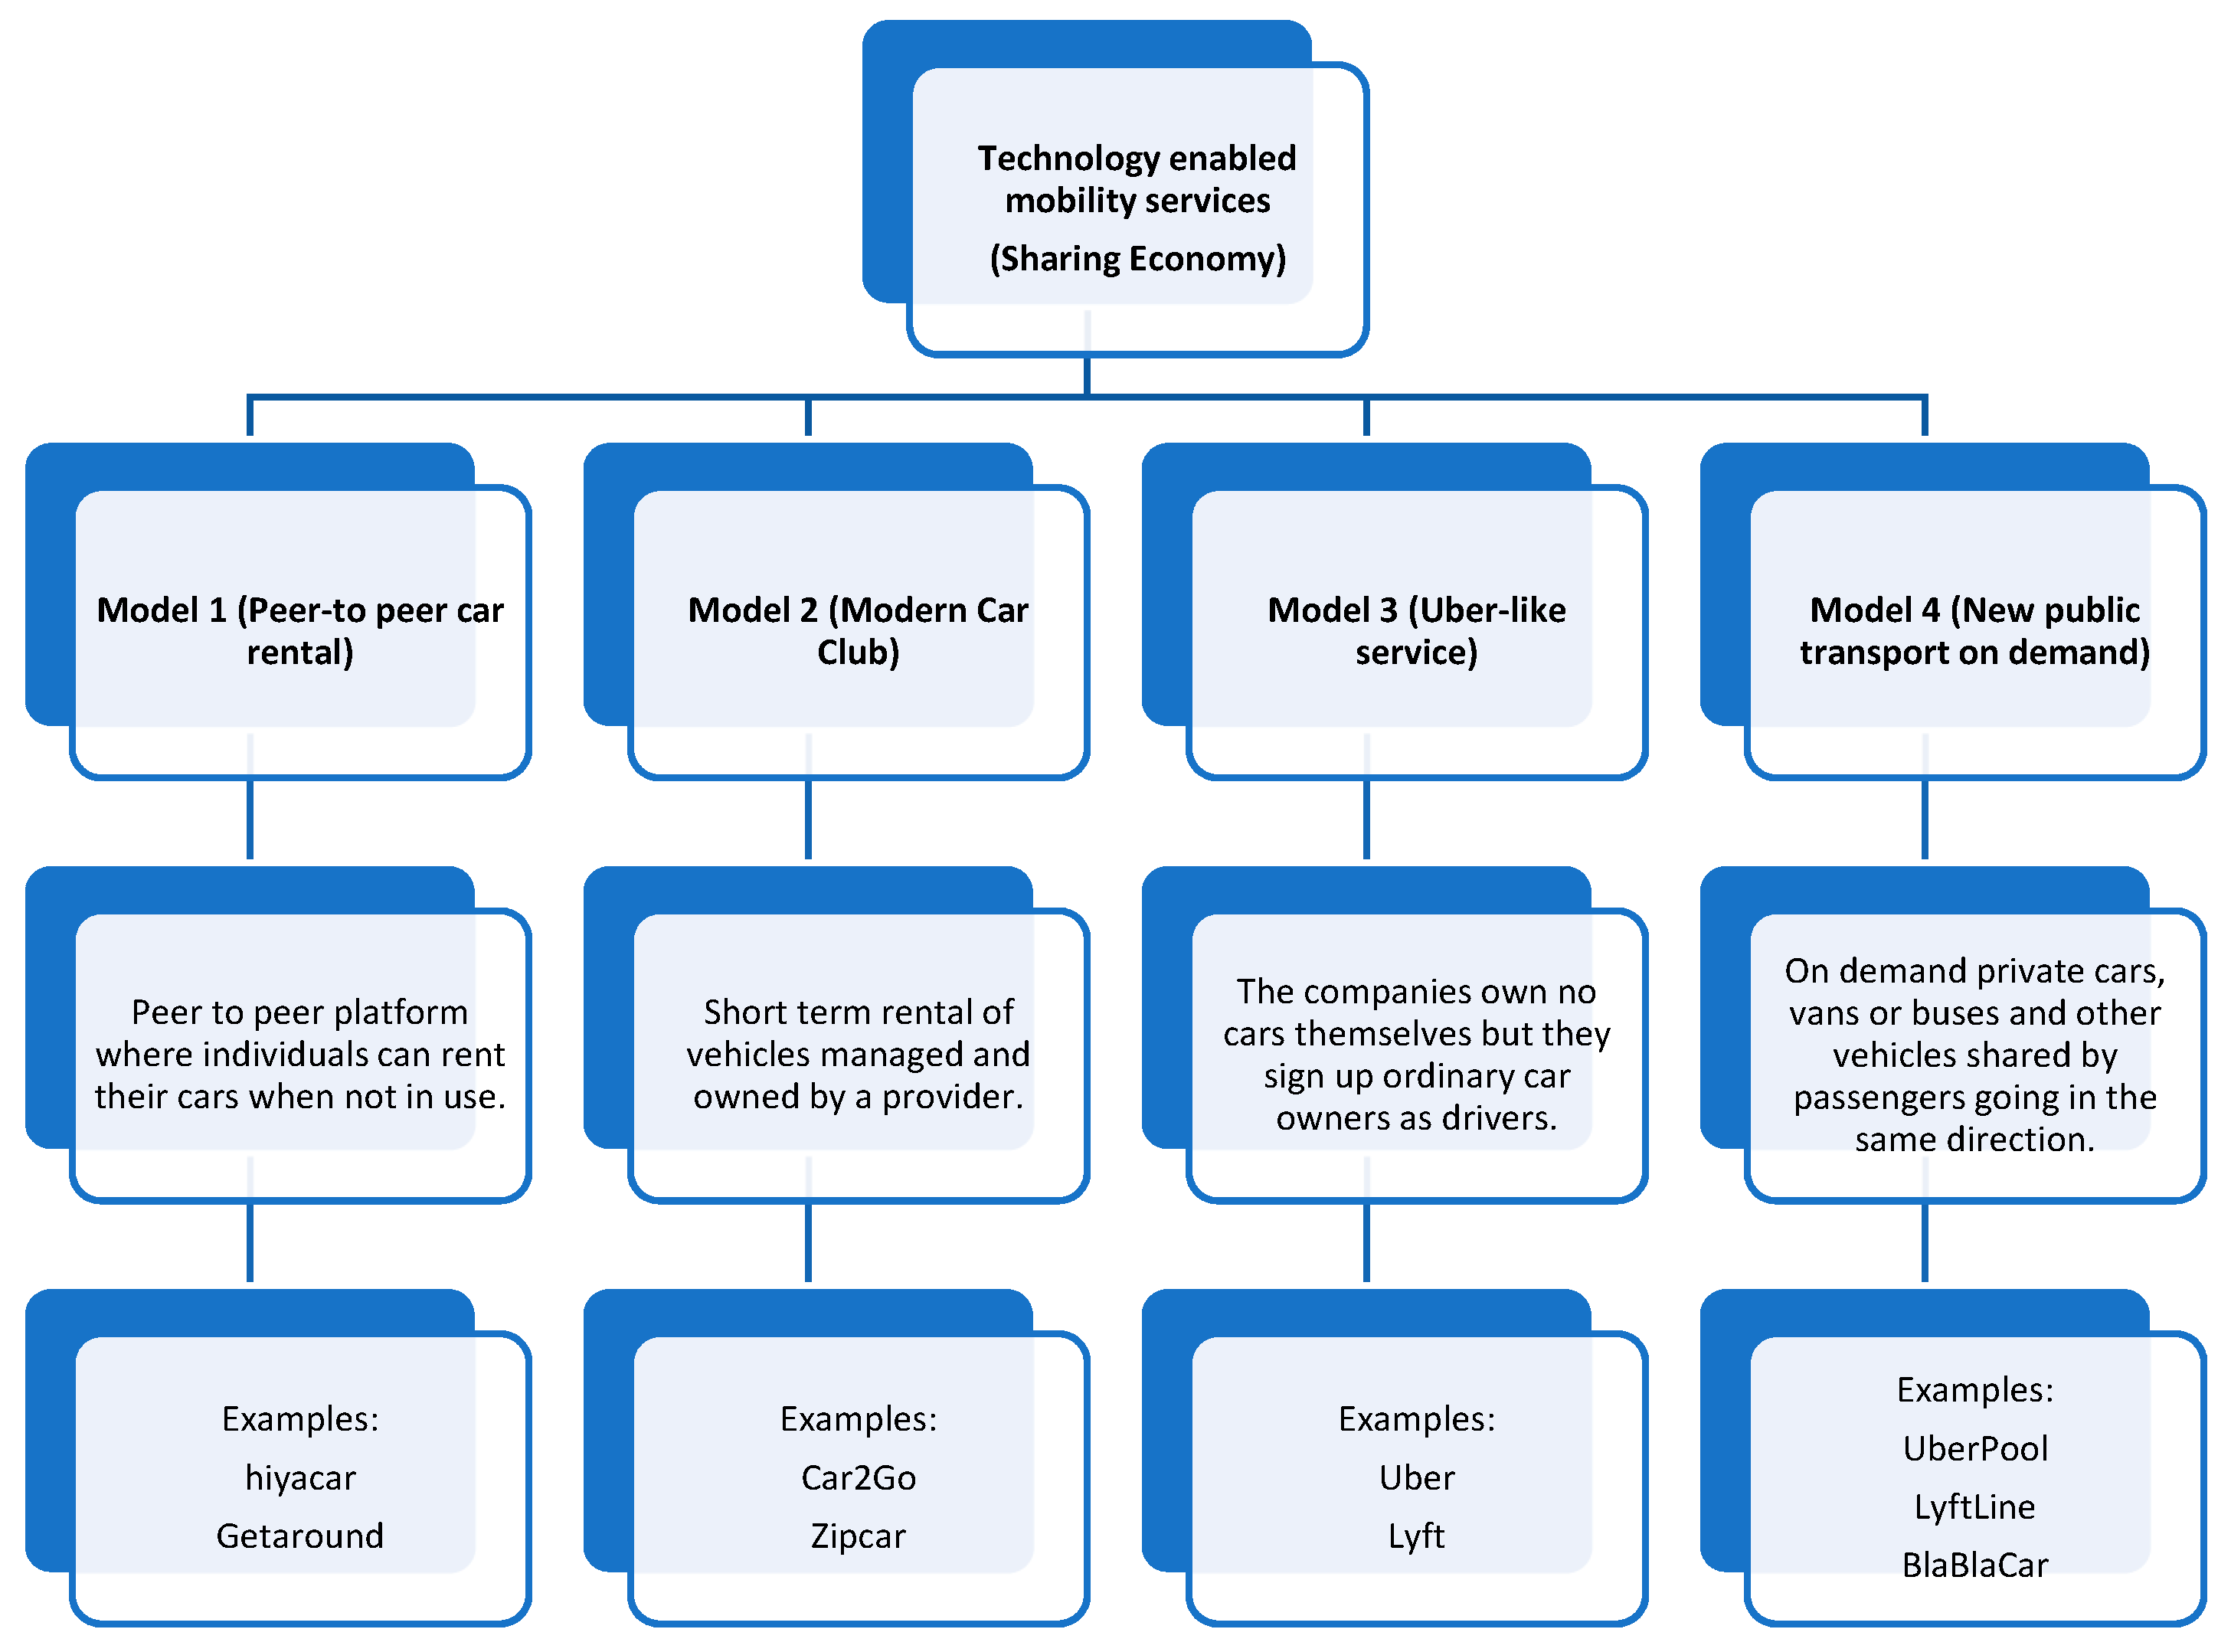
Shared mobility or mobility in the sharing economy is also a loose concept, which includes a number of emerging new models. The two features common to all of these new mobility services, is that there is an element of sharing an asset (a vehicle) instead of owning it, and that they rely on technology (i.e., a digital platform). There are four main models, as follows:
Model 1 (peer-to-peer car rental): Peer-to-peer provision [44] with a company as a broker. Individuals can rent their cars when not in use. These are not companies, but consumers allowing other people to use their vehicles, and supply and demand meet through a broker, which provides an on-line platform, such as a website and/or app, and collects the payment, taking a percentage of the total income. An analogous case is Airbnb, where people can rent a flat or house or even a room in a town or city for a short period, instead of booking themselves in a hotel or bed and breakfast (B&B).
- Model 1 examples:
- Turo (https://turo.com/)
- easyCar Club (https://carclub.easycar.com/)
- hiyacar (https://www.hiyacar.co.uk/)
- Getaround (https://www.getaround.com/)
Model 2 (modern car club): Short term rental of vehicles managed and owned by a provider. The provider owns a number of vehicles that are strategically parked in a city or in certain areas of a city [42], either in dedicated parking lots and/or on authorised public roads. Potential users can look for a vehicle near to where they are, go and drive themselves to their destination, then park the car at the end of their trip in another dedicated parking lot or in an authorised public parking space. Locking and unlocking is typically done with a smartphone or smartcard. This is all done via an app (finding the car via a live map, registering details, paying, etc.). This model has also been referred to as flexible car sharing [45]. Many, although not all of these services, require a membership and an annual fee. Customers can then individually access a fleet of cars for short-term usage in return for a fee, typically per minute [46,47].
- Model 2 examples:
- Car2Go (https://www.car2go.com)
- Zipcar (https://www.zipcar.co.uk/)
- Autolib (was based in Paris, with only electric cars available for short-term rental, but collapsed when it ran into debt and the local government refused to compensate the company for any losses)
This model has its origins in what used to be called car clubs. Car clubs began in Switzerland in 1987 and then spread to Germany, Austria, the Netherlands, the United Kingdom, Denmark, Italy, Sweden, Canada, and the United States [48,49]. One difference, however, is that whilst Model 2 mainly encompasses one-way trips, the pre-Internet age car clubs required users to return the vehicle to the same location from which it had been accessed [3]. Thirty years on, car clubs have not taken off at a wide scale, and it is not yet clear whether their modern version, which is Model 2, will ever represent a large share of total trips made.
Model 3 (Uber-like service): The companies own no cars themselves, but they sign up ordinary car owners who act as drivers. The service relies on an app, provided by the company, which also collects payment, taking a percentage of the total income [41].
- Model 3 examples:
- Uber (https://www.uber.com/en-GB/)
- Lyft (https://www.lyft.com/)
- Sidecar (was based in San Francisco, but collapsed because it could not compete with Lyft and Uber)
Interestingly, Getaround (from Model 1) has partnered with Uber (from Model 3) in San Francisco, so anyone can hire a Getaround car and serve as an Uber driver (registration with Uber is a pre-requisite to be allowed to hire the Getaround car as an Uber driver). In this way, Models 1 and 3 can be combined.
A substantial amount of research has gone into comparing licensed taxis and Model 3, usually exemplified by Uber in the literature. Taxi drivers are often required to hold an expensive medallion, granting them the right to drive, like in New York or Boston [39], or a special cab driving licence, only accessible after a rigorous exam, which potential drivers usually take years to prepare for, like in London [50]. The application process to become an Uber driver, on the other hand, takes days or hours [40], and there is no medallion, so drivers gain considerably from the opportunity to drive without it, even though a percentage of their receipts goes to the company [39]. Controlling for underlying trends and weather conditions, a study found an association between Uber’s growth and a decline in consumer complaints regarding taxis in New York and Boston, which may be the result of an improvement in taxi services in response to competition from the new entrant [41].
Model 4 (new public transport on demand): On demand private cars, vans, or buses, and other vehicles, such as big taxis, shared by passengers going in the same direction. It is essentially a user-oriented form of public transport. Options could include users specifying pick-up and drop-off locations and required departure and/or arrival times, which would essentially be shared taxi services, and taxi-bus services using pre-defined stops and requiring a reservation in advance [5]. A variation of this model, used for inter-city travel, is that of drivers offering rides from one city to another, for passengers willing to carpool.
- Model 4 examples:
- Via (https://ridewithvia.com)
- Chariot (https://www.chariot.com/)
- UberPool (https://www.uber.com/en-GB/ride/uberpool/)
- LyftLine (https://www.lyft.com/line)
- BlaBlaCar (https://www.blablacar.co.uk), for inter-city travel
Figure 1 summarises all four models.
2.1. Impacts on Sustainability
The impacts from shared mobility on congestion and CO2 emissions have been modelled and assessed to a certain extent, although mainly either focusing on small samples and case studies, or making heroic assumptions about the future. The problem with assessing the impacts is that the proportion of trips made with shared mobility modes of transport is not only small, but also difficult to quantify.
Whilst it is relatively simple to access information on the size of the transport sector, thanks to the statistics kept by governments and international organizations, the same cannot be said with respect to shared mobility services. For example, Transport Statistics Great Britain, an annual publication in the United Kingdom, does not have any information on shared mobility. The Committee for Review of Innovative Urban Mobility Services for the Transportation Research Board of the National Academy of Sciences in the United States found exactly the same problem, with the Committee’s report stating that whilst data and research on these new services are increasing, they are much less developed than data and research for other modes of transport, partly because the new but rapidly growing new mobility providers have not been making this information public [2] (p. 6). Their review therefore relies on anecdotal information, piecewise blogs and media articles, as does a report prepared for the European Parliament’s Committee on Transport and Tourism [51].
2.1.1. Market Size
A report on China, Europe, and the United States, found the shared-mobility market in those countries to be in the order of $54 billion in 2016 [52] (p. 1). The report does not define shared mobility, but states that in China and the United States, the shared mobility market is dominated by e-hailing players, or what is defined as Model 3 above. In 2016, the GDP for the United States, China, and Europe was $18.6 trillion, $11.2 trillion, and $16.4 trillion, respectively [53]. According to these figures, the shared mobility market in China, Europe, and the United States represents 0.12% of their combined GDP.
2.1.2. Car Ownership, Distance Travelled, CO2 Emissions, and Congestion
Taking into account that the size of the shared mobility market is not only (still) probably small, but also difficult to determine, a number of studies have attempted to assess its impacts on the basis of surveys or models. In the United States, for example, a survey of consumers using Model 2 revealed that those that had accessed these short-term rental cars more often had a higher likelihood of reducing car ownership [47]. It should be noted that ‘reducing’ does not equate to ‘giving up’ completely. Similarly, in Germany, 12% of respondents to a survey of also Model 2 car-sharing users reported giving up a car in their households (and the authors estimate that the total vehicle miles travelled by the households that had given up a car was on average 50% lower than the total vehicle miles travelled by the households that had not), 40% reported they had abstained from buying a car, and 27% reported they were considering giving up a car [54], cited in [20]. In the Netherlands, another survey of car-sharing users (Models 1 and 2) found a 30% lower car ownership rate amongst car sharers, and 15% to 20% fewer vehicle miles travelled than prior to car sharing, with the shared cars mostly replacing a second or third car [24]. The study also found that thanks to reduced car ownership and car use, car sharers emitted less CO2 per person, per year [24].
A model of the effects of full-scale implementation of shared mobility in the whole of the Lisbon metropolitan area (Model 4), assuming a 100% replacement of all car and bus trips by new shared modes, rail-based public transport, and walking, found that total vehicle miles travelled at peak times would be reduced by 55%, and CO2 emissions would be reduced by 62% [5]. The assumption of a 100% replacement of all car and bus trips by new shared modes can only be used as a threshold for reference, or as the very authors state, as ‘a conversation starter’ [5] (p. 37). A more realistic exercise for Helsinki, assuming that only 20% of car and taxi trips were replaced with shared mobility (Model 4), found that vehicle miles travelled would go down by 7%, CO2 emissions would go down by 2%, and congestion would go down by 13% [55] (p. 53).
It is difficult to determine the percentage of trips that could realistically be replaced with shared mobility services (Models 1 to 4) in any city. A report asserts that 30% of vehicle miles could be replaced by shared mobility (Model 2), but does not explain how that conclusion is arrived at [52]. The report also asserts that shared mobility services (Model 2) are only addressing 1% of that 30%. Furthermore, the increase in the market share of these new mobility services, especially Model 3, may simply reflect a shift from taxis rather than private cars. The share of the total paid car business trips made by Uber has reached around 50% in a number of cities in the United States, and there is some evidence that this share increase mirrors a decrease in the share of business trips made by taxi [56]. On the other hand, there is also evidence that taxis in New York have retained their number of trips and market share by increasing their geographic coverage and serving customers outside Manhattan, as customers in Manhattan have been partly grabbed by Uber, and this wider coverage has obviously benefited customers [57]. In any case, taxis account for a very small proportion of total trips in the United States. For example, taxi and limousine trips account for 0.39% of all trips in cities with populations of 1 million or more, and less than 0.1% in cities with populations of less than 500,000 [2] (p. 12). In London, only 1.5% of all trips made in 2016, were made by taxi or public hire vehicles [58] (p. 23). There is no reason to think that replacing taxi trips, which in any case represent a small proportion of the total trips, with Uber (or similar) trips, would yield any change in congestion or CO2 emissions.
3. Incentives to Encourage Shared Mobility
Despite the range of emerging models described above, shared mobility is still in its infancy. The reasons for this may be that it is still early days, or that the generalised costs of shared mobility can, in some cases, be higher than the generalised costs of other modes of transport, in particular the private car.
Incentives designed to motivate individuals to use shared mobility services instead of the private car would need to change relative generalised costs. This is a challenging task. Before proposing specific incentives, a number of points need to be noted, namely:
- (a)
- Short term rental of shared vehicles (Model 2 above, where vehicles are managed and owned by a provider) is “not considered an attractive substitute for private-vehicle ownership, because it is rarely appropriate for a daily commute” [42] (p. 105). Even young people may express enthusiasm over the idea of Model 2, but show reluctance to actually use it [59], and most aspire and plan to buy a car [60]. 67% of U.S. respondents to a survey preferred “driving their own cars over using ride-hailing apps” (Model 3 above, where companies own no cars themselves, but they sign up ordinary car owners who act as drivers), and 63% would not give up their vehicles for these types of rides, even if they were free [52]. Given the above, it will not be easy to convince consumers to switch to shared mobility services, especially those that entail simultaneously sharing a vehicle with strangers (Model 4) and compromising, even slightly, on departure and arrival times and travel duration.
- (b)
- Basic transport economics defines the generalised cost of a trip as the monetary cost or out-of-pocket expenditure, plus the time taken to complete the trip, times the value of time of the trip maker. Trip makers are assumed to be rational and to minimise their generalised cost of travel. The value of time varies according to a number of factors [61], with the most important one being income. In addition, it has long been recognised that business (working) travel time values are different from non-working travel time ones, which include commuting, and also travel for other purposes [61,62]. The estimates of the value of travel time during the course of work are typically three to five times higher than those for other purposes, and traditionally, travel time during working hours has been valued at the wage rate, although this practice has been recently challenged [62].
- (c)
- To complicate things further, there are many other factors that influence mode choice, such as reliability, convenience, and comfort, to name a few. Reliability has lately been incorporated in the generalised cost of travel [63] (p. 32), [64]. Convenience is difficult to define and value but there have been attempts to model it for public transport [65]. Comfort is related to crowding and it can be taken into account by using value of travel time multipliers for different modes of public transport [64]. These multipliers can take a range of values according to whether there are plenty of seats free and the passenger does not have to sit next to anyone, or there are no seats free, and the bus or train is densely packed, or situations in-between [64]. Evidence shows that the passengers, even those who regularly travel by bus, prefer to be in a relatively empty vehicle and not have to seat next to anyone else [64]. Convincing solo car drivers to share taxis or mini-buses may therefore be challenging, and will need strong financial incentives to compensate for the disutility caused by the reduction in comfort.
- (d)
- Last but not least, waiting time, for example, at bus stops or train stations, has a higher weight, mainly as a result of impatience. This has a long tradition and recent research provides fresh evidence for this to be the case, with waiting time multipliers being over 2 and even 3, depending on transport mode and trip purpose [64].
Any incentives designed to tip the balance in favour of shared mobility will need to, at the very least, tip generalised costs, by changing the monetary, out-of-pocket, costs, and not increasing, or even decreasing, travel time. Travel time increases for those with high values of time will need a very high monetary compensation. If waiting time and comfort were also to be included, then the financial incentive would need to be even higher. This may be difficult to achieve for business/working trips, but it may be possible for other trips, although it will be difficult to shift high earners with very high values of non-working time, as the financial compensation they would need could be higher than the benefit to society from them shifting from the private car to shared mobility.
An additional complication is that an unintended effect of an incentives package to encourage shared mobility could be to decrease public transport patronage, which may not be beneficial in terms of traffic congestion and CO2 emissions. Public transport users may be attracted to public transport on demand (smaller, quicker shared vehicles), which may be more expensive, but also quicker, more convenient, and more comfortable. Competition from shared mobility may be threatening cross-subsidies in franchises of profitable services and non-profitable services, and could harm public transport in particular, when minimum frequencies are imposed and/or peak time services finance off-peak ones [51] (p. 67). Importantly, as individuals switch from traditional public transport to shared mobility, public transport revenues could go down. Having said that, there could also be an increase in public transport patronage, because in the unlikely event that some households attracted to Models 1 and/or 2 were to give up owning a car altogether, and instead use one only when required, the fixed costs of owning a car and variable costs of operating it would be replaced with variable costs, and this would probably lead to different choices in terms of which mode is chosen for a particular trip. In other words, these households could potentially increase their use of public transport.
When designing incentives to encourage shared mobility, the Model (1, 2, 3, or 4) chosen by the regulator/transport agency/municipality will play an important role. Models 1 to 3 are different from Model 4, in that trips are not undertaken simultaneously with strangers.
Incentives Design
Incentives can be classified into three groups: command-and-control, financial, and in-kind.
Command-and-control incentives are essentially regulations that are introduced and enforced, such as restrictions on circulation. This type of policy has been tried in practice. In order to reduce air pollution, Mexico City, Bogotá, Athens, Santiago, and São Paulo, amongst others, have all restricted circulation according to the vehicle number plate and day of the week. Paris and Madrid had such a measure in place in December 2016, albeit only temporarily, to fight unusually high air pollution. When introduced on a permanent basis, this policy has had mixed success, because of households purchasing second cars, typically more polluting ones [66].
Another example of a command-and-control policy is the restriction on vehicle circulation in certain areas, such as that in place in a number of Italian cities, including Rome, Florence, Pisa, and Milan. These cities have implemented limited traffic zones in their historic (medieval) centres. Vehicles circulating in these limited traffic zones require a permit, and the permits are restricted to a number of essential users.
From an economic point of view, command-and-control policies are effective but inefficient, because the targets are not achieved at the least cost [67]. Nonetheless, if the aim is to deter motorists from using their cars, and to shift to shared mobility services, limited traffic zones restricting access to privately owned and driven cars, but not to shared mobility ones, would undoubtedly help.
One interesting way of controlling private car ownership is through restrictions on vehicle ownership. The only example of a direct quantity control of this sort is the vehicle quota system in Singapore, which was implemented in 1990 and is still in place today. This policy, however, is not, strictly speaking, a command-and-control policy, because prospective vehicle owners are required to purchase a certificate of entitlement, which is a licence that lasts for ten years. The allocation of these certificates of entitlement is done through auction, and so there is an element of market mechanism embedded in the process. Having said that, the idea of the government imposing a cap on the total number of vehicles in circulation in a country would sound alien in Western Europe, and certainly draconian.
Financial incentives include charges or fees, subsidies, and cap-and trade schemes. A combination of these, especially charges and cap-and-trade, is also possible [68]. Despite governments being strapped for cash, subsidies have been used in transport to encourage the purchase of fuel efficient and/or clean vehicles, or the scrappage of old ones [69]. Subsidising Models 1, 2, and 3 does not seem warranted (as there are no clear-cut benefits to society in terms of substantial congestion or CO2 emissions reductions), but subsidising Model 4 may be justified on economic grounds, given that the potential of this model to reduce CO2 emissions and congestion is important, as discussed in Section 2.1.2.
Cap-and-trade systems in road transport have been entertained to regulate different externalities [70,71], including CO2 emissions [72,73,74]. Although cap-and-trade schemes have been successful in regulating environmental externalities in the United States [75,76], and importantly, Greenhouse Gas (GHG) emissions in Europe through the European Union Emissions Trading Scheme (EU ETS), the number of installations subject to the policy in all of these cases has been relatively small. The EU ETS, for example, covers around 11,000 installations [77]. Regardless of what the aim of the policy was (which could be, for example, a cap-and trade system of permits for the privilege to use roads), if individual motorists were to enter a cap-and-trade system, it is obvious that transaction costs would be very high, as would the costs of monitoring and compliance, given the very large number of drivers. A cap-and-trade system, therefore, would not be suitable to encourage shared mobility.
Charges and fees often lack public and therefore political acceptability, especially if they charge for something that was previously free, such as the use of certain roads during peak times. Having said that, the use of revenues generated through these charges can increase public acceptability, especially when these are returned to the transport sector [69].
Incentives in-kind can also persuade consumers to change behaviour. In Norway, for example, there is evidence showing that many consumers purchased electric vehicles thanks not only to financial incentives, but also because electric vehicles had access to dedicated bus lanes [11].
Bearing in mind the challenging task of tipping generalised costs to make shared mobility more attractive, an incentive package could contain the following:
- -
- Command-and-control measures, such as the closure of certain roads or areas to privately owned and driven vehicles;
- -
- Subsidies to compensate for the disutility of waiting, taking longer to travel, and/or sharing the vehicle with other passengers;
- -
- Charges, such as congestion charges during peak times or simply charges for (the privilege of) using roads; and
- -
- Incentives in-kind, such as use of dedicated bus lanes for shared mobility vehicles
These incentives would obviously be implemented, administered, and supported by the regulator/transport agency/municipality. The question that arises is whether the impacts from Model 4 would be positive and large enough to justify the regulator introducing incentives.
4. Research Needs
Given the big gap in the literature, which has been made evident in the preceding sections, there are a number of questions that are worth asking, and that should shape research. Would it be in the local and national governments’ and society’s interest to increase shared mobility by introducing incentives? What incentives could be introduced? What would the impact of these incentives be? How would the costs and benefits of introducing incentives compare, from the point of view of the government and of society in general?
These research questions are simple, but the answers are not straightforward and require data collection, modelling, and cost-benefit analysis. The Models that are emerging (1, 2, 3, and 4) are all quite different.
Models 1 to 3 are models that yield profits to private parties, and the social benefits they provide in terms of congestion and CO2 emissions are not clear. Even if positive, they may be very small. This is a point, however, that needs further research. What benefits to society, in terms of congestion and CO2 emissions reductions, could Models 1, 2, and 3 yield?
Model 4 is the model that has the largest potential for reducing congestion and CO2 emissions, but at the same time, it seems the most challenging to sell to potential users, given the disbenefits in terms of waiting time, travel time, comfort, and convenience, relative to the private car. The research questions in this case are not only what the benefits would be in terms of congestion and CO2 emissions reductions under different market penetration scenarios, but also, what incentives could be implemented to promote it, how effective different incentive packages would be, and what would the costs and benefits of such policies be to both government and society.
5. Conclusions
Shared mobility or mobility in the sharing economy is characterised by the sharing of an asset (a vehicle) instead of owning it, and the use of technology (apps and the Internet) to connect users and providers. There are four main models, namely, peer-to-peer platform, where individuals can rent their cars when not in use (Model 1); short term rental of vehicles managed and owned by a provider (Model 2); companies owning no cars themselves, but signing up ordinary car owners to act as drivers offering a taxi-like service (Model 3); and on demand private cars, vans, or buses, and other vehicles, such as big taxis, shared by passengers going in the same direction (Model 4).
Models 1, 2, and 3 can yield profits to private parties, and given the evidence available, they do not seem to have the potential to reduce congestion or CO2 emissions substantially, although this should be further researched. There is also (limited) evidence showing that Models 1 and 2 will never replace the modes currently used for commuting trips. Model 2 has its origins in what was known as car clubs before the Internet age. Although apps are clearly helping boost this model, the (again, limited) evidence shows that households may give up a second or third car rather than become car-less and completely rely on these services.
Model 4, which entails individuals not only sharing a vehicle, but actually travelling together at the same time, is promising in terms of congestion and CO2 emissions reductions, but also the most challenging one, given the disbenefits in terms of waiting and travel time, comfort, and convenience, relative to the private car.
There is very limited data on the different models and their market share, but what there is points towards a very small share, albeit set to increase [52,78]. The question is whether it would be in the local and national governments’ and society’s interest to promote any of the models, in particular Model 4, by introducing incentives, what those incentives should be, what their impacts would be, and how the costs and benefits of introducing incentives for Model 4 would compare.
At present, no government anywhere has any incentives in place to increase shared mobility market penetration, except for the odd pilot project. This in itself may also be a sign that governments are not interested in encouraging shared mobility. It may also be a sign that they are not clear on what benefits shared mobility can provide, which is understandable, given the lack of robust evidence and the range of models. Another possible explanation is that shared mobility is a relatively new concept, which is still emerging, and governments need more time to react.
The field promises to foster fascinating research in the near future, as the research community attempts to shed light into the link between shared mobility and sustainability, potential incentives and their impacts, and policy makers endeavour to reduce congestion and CO2 emissions.
Funding
This research received no external funding, although it builds on work that was originally funded by the Centre on Regulation in Europe.
Acknowledgments
The author is indebted to Professor Chris Nash, from the Institute for Transport Studies at University of Leeds, for insightful comments on a previous draft, to the attendees of the Centre on Regulation in Europe Mobility Workshop, held in Brussels on 9 November 2017, and to two anonymous reviewers. Any remaining errors are the author’s responsibility.
Conflicts of Interest
The author declares no conflict of interest.
References
- Rabbitt, N.; Ghosh, B. Economic and environmental impacts of organised Car Sharing Services: A case study of Ireland. Res. Transp. Econ. 2016, 57, 3–12. [Google Scholar] [CrossRef]
- Taylor, B.; Chin, R.; Crotty, M.; Dill, J.; Hoel, L.; Manville, M.; Polzin, S.; Schaller, B.; Shaheen, S.; Sperling, D.; et al. Between Public and Private Mobility: Examining the Rise of Technology-Enabled Transportation Services; Special Report 319; Committee for Review of Innovative Urban Mobility Services, Transportation Research Board, The National Academy of Sciences: Washington, DC, USA, 2016; Available online: http://nap.edu/21875 (accessed on 19 October 2017).
- Shaheen, S.; Chan, N.; Micheaux, H. One-way carsharing’s evolution and operator perspectives from the Americas. Transportation 2015, 42, 519–536. [Google Scholar] [CrossRef]
- Martin, E.W.; Shaheen, S.A. Greenhouse Gas Emission Impacts of Carsharing in North America. IEEE Trans. Intell. Transp. Syst. 2011, 12, 1074–1086. [Google Scholar] [Green Version]
- Viegas, J.; Martinez, L. Transition to Shared Mobility: How large Cities Can Deliver Inclusive Transport Services; Corporate Partnership Board Report; International Transport Forum: Paris, France, 2017; Available online: https://www.itf-oecd.org/sites/default/files/docs/transition-shared-mobility.pdf (accessed on 18 October 2017).
- Andwari, A.M.; Pesiridis, A.; Rajoo, S.; Martinez-Botas, R.; Esfahanian, V. A review of Battery Electric Vehicle technology and readiness levels. Renew. Sustain. Energy Rev. 2017, 78, 414–430. [Google Scholar] [CrossRef]
- Hao, H.; Cheng, X.; Liu, Z.; Fuquan, Z. Electric vehicles for greenhouse gas reduction in China: A cost effectiveness analysis. Transp. Res. D Transp. Environ. 2017, 56, 68–84. [Google Scholar] [CrossRef]
- Newbery, D.; Strbac, G. What is needed for battery electric vehicles to become socially cost competitive? Econ. Transp. 2016, 5, 1–11. [Google Scholar] [CrossRef] [Green Version]
- Figenbaum, E. Perspectives on Norway’s supercharged electric vehicle policy. Environ. Innov. Soc. Transit. 2017, 25, 14–34. [Google Scholar] [CrossRef]
- Langbroek, J.; Franklin, J.; Susilo, Y. The effect of policy incentives on electric vehicle adoption. Energy Policy 2016, 94, 94–103. [Google Scholar] [CrossRef]
- Bjerkan, K.Y.; Nørbech, T.E.; Nordtømme, M.E. Incentives for promoting Battery Electric Vehicle (BEV) adoption in Norway. Transp. Res. D Transp. Environ. 2016, 43, 169–180. [Google Scholar] [CrossRef]
- Lieven, T. Policy measures to promote electric mobility—A global perspective. Transp. Res. A Policy Pract. 2015, 82, 78–93. [Google Scholar] [CrossRef]
- Sierzchula, W.; Bakker, S.; Maat, K.; van Wee, B. The influence of financial incentives and other socio-economic factors on electric vehicle adoption. Energy Policy 2014, 68, 183–194. [Google Scholar] [CrossRef]
- Coffman, M.; Bernstein, P.; Wee, S. Electric vehicles revisited: A review of factors that affect adoption. Transp. Rev. 2017, 37, 79–93. [Google Scholar] [CrossRef]
- Egbue, O.; Long, S.; Samaranayake, V.A. Mass deployment of sustainable transportation: Evaluation of factors that influence electric vehicle adoption. Clean Technol. Environ. Policy 2017, 19, 1927–1939. [Google Scholar] [CrossRef]
- Heidrich, O.; Hil, G.A.; Neaimeh, M.; Huebner, Y.; Blythe, P.T.; Dawson, R.J. How do cities support electric vehicles and what difference does it make? Technol. Forecast. Soc. Chang. 2017, 123, 17–23. [Google Scholar] [CrossRef]
- Wang, N.; Pan, H.; Zheng, W. Assessment of the incentives on electric vehicle promotion in China. Transp. Res. A Policy Pract. 2017, 101, 177–189. [Google Scholar] [CrossRef]
- Mersky, A.C.; Sprei, F.; Samaras, C.; Qian, Z. Effectiveness of incentives on electric vehicle adoption in Norway. Transp. Res. D Transp. Environ. 2016, 46, 56–68. [Google Scholar] [CrossRef] [Green Version]
- Zhang, X.; Wang, K.; Hao, Y.; Fan, J.-L.; Wei, Y.-M. The impact of government policy on preference for NEVs: The evidence from China. Energy Policy 2013, 61, 382–393. [Google Scholar] [CrossRef]
- Miramontes, M.; Pfertner, M.; Rayaprolu, H.; Schreiner, M.; Wulfhorst, G. Impacts of a multimodal mobility service on travel behavior and preferences: User insights from Munich’s first Mobility Station. Transportation 2017, 44, 1325–1342. [Google Scholar] [CrossRef]
- Schwieterman, J.; Bieszczat, A. The cost to carshare: A review of the changing prices and taxation levels for carsharing in the United States 2011–2016. Transp. Policy 2017, 57, 1–9. [Google Scholar] [CrossRef]
- Tyndall, J. Where no cars go: Free-floating carshare and inequality of access. Int. J. Sustain. Transp. 2017, 11, 433–442. [Google Scholar] [CrossRef]
- Ciari, F.; Balac, M.; Balmer, M. Modelling the effect of different pricing schemes on freefloating carsharing travel demand: A test case for Zurich. Transportation 2015, 42, 413–433. [Google Scholar] [CrossRef]
- Nijland, H.; van Meerkerk, J. Mobility and environmental impacts of car sharing in the Netherlands. Environ. Innov. Soc. Transit. 2017, 23, 84–91. [Google Scholar] [CrossRef]
- Becker, H.; Ciari, F.; Axhausen, K.W. Modeling free-floating car-sharing use in Switzerland: A spatial regression and conditional logit approach. Transp. Res. C Emerg. Technol. 2017, 81, 286–299. [Google Scholar] [CrossRef] [Green Version]
- Kim, J.; Rasouli, S.; Timmermans, H.J.P. The effects of activity-travel context and individual attitudes on car-sharing decisions under travel time uncertainty: A hybrid choice modeling approach. Transp. Res. D Transp. Environ. 2017, 56, 189–202. [Google Scholar] [CrossRef]
- Kopp, J.; Gerike, R.; Axhausen, K. Do sharing people behave differently? An empirical evaluation of the distinctive mobility patterns of free-floating car-sharing members. Transportation 2015, 42, 449–469. [Google Scholar] [CrossRef]
- Nourinejad, M.; Roorda, M. Carsharing operations policies: A comparison between one-way and two-way systems. Transportation 2015, 42, 497–518. [Google Scholar] [CrossRef]
- Bicocchi, N.; Mamei, M. Investigating ride sharing opportunities through mobility data analysis. Pervasive Mob. Comput. 2014, 14, 83–94. [Google Scholar] [CrossRef]
- Bongiovanni, C.; Kaspi, M.; Geroliminis, N. The Electric Autonomous Dial-a-Ride Problem. In Proceedings of the 17th Swiss Transport Research Conference, Monte Verità, Ascona, 17–19 May 2017; Available online: https://verolog2017.sciencesconf.org/140001/document (accessed on 23 October 2017).
- Hara, Y.; Hato, E. A car sharing auction with temporal-spatial OD connection conditions. Transp. Res. Procedia 2017, 23, 22–40. [Google Scholar] [CrossRef]
- Morency, C.; Verreault, H.; Demers, M. Identification of the minimum size of the shared-car fleet required to satisfy car-driving trips in Montreal. Transportation 2015, 42, 435–447. [Google Scholar] [CrossRef]
- Mallus, M.; Colistra, G.; Atzori, L.; Murroni, M.; Pilloni, V. Dynamic Carpooling in Urban Areas: Design and Experimentation with a Multi-Objective Route Matching Algorithm. Sustainability 2017, 9, 254. [Google Scholar] [CrossRef]
- Becker, H.; Loder, A.; Schmid, B.; Axhausen, K.W. Modeling car-sharing membership as a mobility tool: A multivariate Probit approach with latent variables. Travel Behav. Soc. 2017, 8, 26–36. [Google Scholar] [CrossRef] [Green Version]
- Paundra, J.; Rook, L.; van Dalen, J.; Ketter, W. Preferences for car sharing services: Effects of instrumental attributes and psychological ownership. J. Environ. Psychol. 2017, 53, 121–130. [Google Scholar] [CrossRef]
- Prieto, M.; Baltas, G.; Stan, V. Car sharing adoption intention in urban areas: What are the key sociodemographic drivers? Transp. Res. A Policy Pract. 2017, 101, 218–227. [Google Scholar] [CrossRef]
- Rinzivillo, S.; Pedreschi, D.; Giannotti, F. Never drive alone: Boosting car pooling with network analysis. Inf. Syst. 2017, 64, 237–257. [Google Scholar]
- Juschten, M.; Ohnmacht, T.; Thao, V.T.; Gerike, R.; Hössinger, R. Carsharing in Switzerland: Identifying new markets by predicting membership based on data on supply and demand. Transportation 2017, 1–24. [Google Scholar] [CrossRef]
- Angrist, J.D.; Caldwell, S.; Hall, J.V. Uber vs. Taxi: A Driver’s Eye View. National Bureau of Economic Research Working Paper 23891. 2017. Available online: http://www.nber.org/papers/w23891 (accessed on 20 August 2018).
- Einav, L.; Farronato, C.; Levin, J. Peer-to-Peer Markets. National Bureau of Economic Research Working Paper 21496. 2015. Available online: http://www.nber.org/papers/w21496 (accessed on 20 August 2018).
- Wallsten, S. The Competitive Effects of the Sharing Economy: How is Uber Changing Taxis? Technology Policy Institute: Washington, DC, USA, 2015; Available online: https://techpolicyinstitute.org/wp-content/uploads/2015/06/the-competitive-effects-of-the-2007713.pdf (accessed on 20 August 2018).
- Bieszczat, A.; Schwieterman, J. Carsharing: Review of its public benefits and level of taxation. Transp. Res. Rec. J. Transp. Res. Board 2012, 2319, 105–112. [Google Scholar] [CrossRef]
- Corciolani, M.; Borghini, S. Buying, renting, and sharing: Investigating new forms of acquisition. Mercati Competitività 2018, 1, 15–20. [Google Scholar] [CrossRef]
- Ballús-Armet, I.; Shaheen, S.A.; Clonts, K.; Weinzimmer, D. Peer-to-Peer Carsharing Exploring Public Perception and Market Characteristics in the San Francisco Bay Area, California. Transp. Res. Rec. J. Transp. Res. Board 2014, 2416, 27–36. [Google Scholar] [CrossRef]
- Barrios, J.A.; Doig-Godier, J. Fleet Sizing for Flexible Carsharing Systems Simulation-Based Approach. Transp. Res. Rec. J. Transp. Res. Board 2014, 2416, 1–9. [Google Scholar] [CrossRef]
- Bardhi, F.; Eckhardt, G.M. Access-Based Consumption: The Case of Car Sharing. J. Consum. Res. 2017, 39, 881–898. [Google Scholar] [CrossRef]
- Schaefers, T.; Lawson, S.; Kukar-Kinney, M. How the burdens of ownership promote consumer usage of access-based services. Mark. Lett. 2015, 27, 569–577. [Google Scholar] [CrossRef]
- Shaheen, S.; Sperling, D.; Wagner, C. Carsharing in Europe and North America: Past, Present, and Future. Transp. Q. 1998, 52, 35–52. [Google Scholar]
- Enoch, M.; Taylor, J. A worldwide review of support mechanisms for car clubs. Transp. Policy 2006, 13, 434–444. [Google Scholar] [CrossRef] [Green Version]
- Transport for London Website. Apply for a Taxi Driver Licence. Available online: https://tfl.gov.uk/info-for/taxis-and-private-hire/licensing/apply-for-a-taxi-driver-licence (accessed on 21 August 2018).
- Finger, M.; Bert, N.; Kupfer, D.; Montero, J.; Wolek, M. Research for the TRAN Committee—Infrastructure Funding Challenges in the Sharing Economy, Transport Area of the Florence School of Regulation (FSR Transport) at the European University Institute (EUI). Report prepared for the European Parliament’s Committee on Transport and Tourism, Directorate-General for Internal Policies; Policy Department for Structural and Cohesion Policies, Transport and Tourism. 2017. Available online: http://www.europarl.europa.eu/RegData/etudes/STUD/2017/601970/IPOL_STU(2017)601970_EN.pdf (accessed on 25 October 2017).
- Grosse-Ophoff, A.; Hausler, S.; Heineke, K.; Möller, T. How Shared Mobility Will Change the Automotive Industry. McKinsey & Company. 2017. Available online: https://www.mckinsey.com/industries/automotive-and-assembly/our-insights/how-shared-mobility-will-change-the-automotive-industry (accessed on 18 October 2017).
- World Bank Webpage. Countries and Economics. Available online: https://data.worldbank.org/country/ (accessed on 1 November 2017).
- Schreier, H.; Becker, U.; Heller, J.; Team Red Deutschland GmbH. Evaluation CarSharing (EVA-CS); Landeshauptstadt München; Team Red Deutschland GmbH: Berlin, Germany, 2015. [Google Scholar]
- Furtado, F.; Martinez, L.; Petrik, O. Shared Mobility Simulations for Helsinki; International Transport Forum: Paris, France, 2017; Available online: https://www.itf-oecd.org/shared-mobility-simulations-helsinki (accessed on 26 October 2017).
- Fischer, B. In Uber vs. Taxi Cab Fight, Expense Reports Offer Telling Barometer. N. Y. Bus. J. 2015. Available online: https://www.bizjournals.com/newyork/blog/techflash/2015/04/uber-taxi-expense-report-certify-study.html (accessed on 1 November 2017).
- Kim, K.; Baek, C.; Lee, J.-D. Creative destruction of the sharing economy in action: The case of Uber. Transp. Res. A Policy Pract. 2018, 110, 118–127. [Google Scholar] [CrossRef]
- Transport for London. Travel in London. Report 10. 2017. Available online: http://content.tfl.gov.uk/travel-in-london-report-10.pdf (accessed on 15 August 2018).
- Magnani, G.; Bertolotti, T.; Zucchella, A. Cognitive aspects of car sharing in Millennials. Active sharers and reluctant users. Mercati Competitività 2018, 1, 39–62. [Google Scholar] [CrossRef]
- Giffi, C.A.; Vitale, J.; Rodriguez, M.D.; Gangula, B.; Schmith, S. The Changing Nature of Mobility. Deloitte Review Issue 15. 2014. Available online: https://www2.deloitte.com/insights/us/en/deloitte-review/issue-15/automotive-trends-gen-y.html (accessed on 16 August 2018).
- Mackie, P.; Wardman, M.; Fowkes, A.; Whelan, G.; Nellthorp, J.; Bates, J. Values of Travel Time Savings in the UK—Full Report; Report to the UK Department for Transport; Institute for Transport Studies, University of Leeds: Leeds, UK, 2003; Available online: http://eprints.whiterose.ac.uk/2079/2/Value_of_travel_time_savings_in_the_UK_protected.pdf (accessed on 25 October 2017).
- Wardman, M.; Batley, R.; Laird, J.; Mackie, P.; Bates, J. How should business travel time savings be valued? Econ. Transp. 2015, 4, 200–214. [Google Scholar] [CrossRef] [Green Version]
- Small, K.; Verhoef, E. Economics of Urban. Transportation; Routledge: London, UK, 2007. [Google Scholar]
- Arup; Institute for Transport Studies (ITS); University of Leeds (and Affiliates); Accent. Provision of Market Research for Value of Travel Time Savings and Reliability. Report Prepared for the UK Department for Transport. 2015. Available online: https://www.gov.uk/government/uploads/system/uploads/attachment_data/file/470231/vtts-phase-2-report-issue-august-2015.pdf (accessed on 25 October 2017).
- International Transport Forum. Valuing Convenience in Public Transport; Roundtable Report 156; Organisation for Economic Co-operation and Development: Paris, France, 2014; Available online: http://www.oecd.org/publications/valuing-convenience-in-public-transport-9789282107683-en.htm (accessed on 17 October 2017).
- Eskeland, G.; Feyzioglu, T. Rationing Can Backfire: The ‘Day without a Car’ in Mexico City. World Bank Econ. Rev. 1997, 11, 383–408. [Google Scholar] [CrossRef]
- Baumol, W.; Oates, W. The Theory of Environmental Policy, 2nd ed.; Cambridge University Press: Cambridge, UK, 1988. [Google Scholar]
- Hepburn, C. Regulation by prices, quantities, or both: A review of instrument choice. Oxf. Rev. Econ. Policy 2006, 22, 226–247. [Google Scholar] [CrossRef]
- Santos, G.; Behrendt, H.; Maconi, L.; Shirvani, T.; Teytelboym, A. Externalities and Economic Policies in Road Transport. Res. Transp. Econ. 2010, 28, 2–45. [Google Scholar] [CrossRef]
- Verhoef, E.T.; Nijkamp, P.; Rietveld, P. Tradeable permits: Their potential in the regulation of road transport externalities. Environ. Plan. B Plan. Des. 1997, 24, 527–548. [Google Scholar] [CrossRef]
- Raux, C. The use of transferable permits in Transport Policy. Transp. Res. D Transp. Environ. 2004, 9, 185–197. [Google Scholar] [CrossRef]
- Albrecht, J. Tradable CO2 permits for cars and trucks. J. Clean. Prod. 2001, 9, 179–189. [Google Scholar] [CrossRef]
- Raux, C.; Marlot, G. A system of tradable CO2 permits applied to fuel consumption by motorists. Transp. Policy 2005, 12, 255–265. [Google Scholar] [CrossRef]
- Wadud, Z.; Noland, R.; Graham, D. Equity analysis of personal tradable carbon permits for the road transport sector. Environ. Sci. Policy 2008, 11, 533–544. [Google Scholar] [CrossRef]
- Hahn, R.; Hester, G. Marketable Permits: Lessons for Theory and Practice. Ecol. Law Q. 1989, 361, 361–406. [Google Scholar]
- Hansjürgens, B. The US approach to pollution control: Lessons for climate policy. In Emissions Trading for Climate Policy: US and European Perspectives; Hansjürgens, B., Ed.; Cambridge University Press: Cambridge, UK, 2005; pp. 61–62. [Google Scholar]
- European Commission Webpage. EU Emissions Trading System (EU ETS). Available online: https://ec.europa.eu/clima/policies/ets_en (accessed on 26 October 2017).
- Vaughan, R.; Daverio, R. Assessing the Size and Presence of the Collaborative Economy in Europe. Document Prepared for the European Commission (DG GROW). 2016. Available online: https://publications.europa.eu/en/publication-detail/-/publication/2acb7619-b544-11e7-837e-01aa75ed71a1/language-en (accessed on 1 November 2017).
Figure 1.
Shared mobility models.

© 2018 by the author. Licensee MDPI, Basel, Switzerland. This article is an open access article distributed under the terms and conditions of the Creative Commons Attribution (CC BY) license (http://creativecommons.org/licenses/by/4.0/).
Share and Cite
MDPI and ACS Style
Santos, G. Sustainability and Shared Mobility Models. Sustainability 2018, 10, 3194. https://doi.org/10.3390/su10093194
AMA Style
Santos G. Sustainability and Shared Mobility Models. Sustainability. 2018; 10(9):3194. https://doi.org/10.3390/su10093194
Chicago/Turabian StyleSantos, Georgina. 2018. "Sustainability and Shared Mobility Models" Sustainability 10, no. 9: 3194. https://doi.org/10.3390/su10093194
Note that from the first issue of 2016, this journal uses article numbers instead of page numbers. See further details here.