Household Food Security Status and Its Determinants in Maphumulo Local Municipality, South Africa

1
Department of Agriculture, University of Zululand, P. Bag X1001, KwaDlangezwa 3886, South Africa
2
Department of Agricultural Economics, Education and Extension, Bindura University of Science Education, Bindura 112, Zimbabwe
*
Author to whom correspondence should be addressed.
Sustainability 2018, 10(9), 3307; https://doi.org/10.3390/su10093307
Submission received: 24 May 2018
/
Revised: 27 August 2018
/
Accepted: 29 August 2018
/
Published: 16 September 2018
(This article belongs to the Section Sustainable Agriculture)
Abstract
:Food security at the household level remains a major issue in South Africa and for many other developing countries, particularly those in Africa. As a means of ensuring food security in KwaZulu-Natal province, various food security intervention programmes were launched. Nonetheless, food security remains an issue among households in the province. This paper estimates the household food security status of the “One Home One Garden” (OHOG) beneficiaries against that of non-beneficiaries and assesses the determinants of household food security status in Maphumulo. A stratified random sampling technique was used to sample 495 households (including 330 OHOG beneficiaries and 165 non-beneficiaries). The status of household food security was estimated by means of a “Household Dietary Diversity Score” (HDDS). Additionally, a Household Food Consumption Score” (HFCS) tool was employed to supplement the HDDS. The results showed that food consumption patterns were characterized by medium (4.89) and average (4.22) HDDS for the OHOG beneficiaries and non-beneficiaries, respectively. Taking HDDS as a proxy for household food security, an independent samples t-test (Levene’s test—equal variances assumed) reveals a significant (p < 0.001) relationship between the sample means of the two groups. A greater proportion (65%) of the OHOG beneficiaries had an acceptable (≥35) HFCS level, whereas just over half (54%) of the non-beneficiaries fell in the borderline (21.5 to 35) HFCS level. The determinants of household food security status were elicited by means of a binary logistic regression model. The results revealed that education (p = 0.036), receiving infrastructural support (irrigation) (p = 0.001), and participation in the OHOG programme (p = 0.000) positively influenced the food security status of households, yet household income (p = 0.000) and access to credit (p = 0.002) showed a negative correlation. This paper proposes that government and developmental agencies, in their efforts to enhance food security through food security intervention programmes, should support households by investing in education and agricultural infrastructure, as well as giving priority to smallholder infrastructural irrigation support for households that largely rely on rain-fed systems.
1. Introduction
South Africa is mostly perceived to be food secure, either in relation to producing sufficient staple food or in its ability to import sufficient and nutritional food for its populace [1,2]. However, while South Africa is seen as food secure at a macro level, Hart et al. [3] and Mkhawani et al. [4] have argued that at the household level, food security is still a critical challenge for some. As a means to enhance food security, the Department of Agriculture, Forestry, and Fisheries (DAFF) has promoted the development of agricultural projects as a way of creating jobs and generating household income [3,5].
According to Statistics South Africa [6], nearly 4.75 million South African households are living below the poverty line. Sekhampu [7] further indicated that South Africa has close to 14 million people who are susceptible to food insecurity. Altman and Ngandu [8] revealed that in South Africa, factors such as extensive unemployment, low wage levels relative to the rising cost of living, and dependent ratios for households contribute to food insecurity. In order to attain food security, there should be adequate amounts of appropriate food at all times [9]. The United States Agency for International Development (USAID) [10] and Deitchler et al. [11] define food security as a state in which all people at all times have both physical and economic access to sufficient food to meet their dietary needs for a productive and healthy life. Hence, the South African Government Bill of Rights Section 27 (1) (b) of the South African Constitution, Act 108 of 1996, states that everyone has a right to have access to sufficient food [12]. In addition, individuals need to have sufficient income or other means to be able to buy or exchange for food.
Furthermore, Statistics South Africa [6] indicated that many South African households are not able to buy food mainly due to limited income-generating opportunities—this is more prevalent in rural areas. The Food and Agriculture Organization (FAO) [1] highlighted that since 1994, food security has been acknowledged as a national priority in South Africa. According to the FAO [1], South Africa is largely deemed a food secure nation, producing enough staple food or having the capacity to import food, if needed, in order to meet the basic nutritional requirements of its population. Notably, studies pertaining to the estimation of household food security status have been attempted in different provinces in South Africa. However, only certain areas of the provinces may have been considered. Misselhorn and Hendriks [13] mentioned that the causes and consequences of food insecurity in South Africa are not uniform from place to place and from household to household. Therefore, results from other areas arguably may not depict an accurate picture of the food security status for varied population groups in defined locations, as contended by Govender et al. [14].
The KwaZulu-Natal Department of Agriculture and Environmental Affairs (KZNDAEA) [15] highlighted that the province of KwaZulu-Natal (KZN) has relatively high agricultural potential compared to the other provinces, mainly due to its climate, soils, and access to water. The province has approximately 6.5 million hectares of land available for farming purposes, of which 18% is suitable for arable farming and 82% for extensive livestock production. The South African National Treasury [16] estimated that KZN has approximately 8000 commercial farmers and around 400,000 rural farming families, involved in smallholder farming. Commercial agriculture in KZN contributes 90% of South Africa’s agricultural output and 37% of national food exports [17]. According to the National Department of Agriculture [18], a large number of households are involved in limited homestead-based food production, which is a significant livelihood source. Although the province of KwaZulu-Natal has a large agricultural potential, many hectares of land are either largely underused or overexploited.
Altman et al. [19] also stated that the province of KZN has been hardest-hit by high levels of unemployment and that household food insecurity in communities that benefited from the interventions is still a common feature. Yet, various programmes in KZN aiming to safeguard against food insecurity have been launched since 2007 [20]. Some of these include the Comprehensive Agricultural Support Programme (CASP), Livestock Programme, Mechanization Programme, Mushroom Programme, Women, Youth, and People with Disabilities, Indigenous Nguni Livestock Programme, Rural Development Programme, Impact Partnership, and Land Care Projects. These intervention programmes aimed to improve food security among households as well as create job opportunities.
The aforementioned programmes highlight the efforts by government institutions towards achieving food security for all in South Africa. Although Misselhorn and Hendriks [13] noted that the country has a tradition of evidence-based decision-making, grounded in the findings of national surveys, there is little evidence made available to the public to suggest that the implemented national food security programmes have achieved successful outcomes. Again, the government does not do justice by not providing the public with detailed reports about these programmes. Such information could also be useful to civil society organisations that have the same objective as the government of achieving food security at the household level. Additionally, the information would be useful for obtaining feedback on the opportunities as well as the constraints which arise through the implementation of these intervention programmes. It is therefore very difficult to determine the nature of support to be given to households, with little or no evidence to suggest that the previously implemented programmes have been effective to stimulate rural growth, poverty alleviation, and food security.
Despite the efforts made, food security among households is still an issue in the poorest areas of KZN [20,21]. A study by D’Haese et al. [20] confirmed that experience-based food insecurity levels are still high, despite some respondents attributing improved dietary diversity and better access to resources to the agricultural support programmes and the social government income transfers. In 2009, due to the unsatisfactory results of previous food security intervention programmes, DAFF developed and promoted the “One Home One Garden” food security intervention programme aimed at achieving household food security stability by producing some food for consumption purposes with a long-term goal of producing enough food to sell at local markets such as the KwaZulu-Natal Dube Trade Port near the King Shaka International Airport [5]. The Department of Agriculture and Environmental Affairs (DAEA) [22] estimated that 580,000 households in KZN were food insecure; as a means to address this widespread problem, the DAEA embarked on the “One Home One Garden” intervention programme. The specification of the “One Home One Garden” intervention programme was a distribution of seeds and fertiliser packs to households. According to the KwaZulu-Natal Provincial Government [23], the “One Home One Garden” programme was well-received by stakeholders, with over 650,000 beneficiary households assisted with seeds to cultivate vegetables, maize, and beans. About 30% of the most deprived households received implements and fertiliser as a starter pack, with over 34,000 packs distributed. While promoting a culture of producing vegetables for household consumption and to enhance food security at the household level, agricultural training and financial advice to cooperatives were also provided.
Furthermore, the South African government continues to support rural farmers with garden inputs, including infrastructure, training, and mentoring with the aim of boosting household production through the “One Home One Garden” campaign that has encouraged household gardens throughout the province. This paper therefore focusses on the “One Home One Garden” food security intervention programme, given its background and that it was widely rolled out in the province of KZN, with a special focus on Maphumulo Local Municipality of iLembe District.
Machethe [24], the Parliament of South Africa [25], and Statistics South Africa [26] have indicated that South Africa generally is marred by high unemployment levels, and is battling to achieve food security and alleviate poverty. Thus, there is a direct need to ensure that government efforts such as the “One Home One Garden” programme do not end up as failed programmes but rather as a plan that delivers measurable sustainable results that improve rural people’s livelihoods, poverty, and food security.
Despite the popularity of the “One Home One Garden” programme in KZN, there is still limited information with respect to its impact on food security and the determinants of the food security status by households, particularly in Maphumulo Local Municipality. A number of factors are noted in the literature that affect food availability at the household level; however, there is no consensus on some of the determinants of household food security. Hendriks et al. [27] also noted that there is a lack of guidance or consistent classification across indicators on determining household food security indicators in South Africa. This highlights the necessity to conduct this research, with the aim of eliciting the determinants of household food security status in KZN.
The main objective of this paper is to analyse the determinants of the food security status of households in rural Maphumulo in the province of KZN, South Africa. The specific objective is to estimate the food security status between the “One Home One Garden” beneficiaries and non-beneficiary households in Maphumulo Local Municipality.
2. Methodology
2.1. Selection and Description of the Study Area
Maphumulo Local Municipality is found in iLembe District of KZN in South Africa. Maphumulo Local Municipality is predominantly rural and has the poor absorptive capacity of the local economy. The search for a better quality of life has resulted in a loss of human capital for the municipality, which further weakens the ability of the local economy to grow. The study area falls within the government’s priority food security pilot project. iLembe District Municipality has four local municipalities: KwaDukuza, Mandeni, Maphumulo, and Ndwendwe. Maphumulo Local Municipality consists of 11 wards but only three wards were selected for inclusion in this study, namely Wards 3, 6 and 10. Wards 6, 3 and 10 represents low, restricted and high agricultural potential areas, respectively. Hence, these wards were purposely selected because of their different agricultural potentials. According to Mugenda and Mugenda [28], purposive sampling is part of the multi-stage sampling used to obtain the location in which units of observation (study) have the required characteristics. Another reason for selecting these wards was that the food security intervention programme, “One Home One Garden”, of interest in this paper, was widely implemented in these wards. From each ward, three sub-wards were randomly selected. Fifteen (15) pieces of paper were cut (each with a name of one of the sub-wards) and put in three separate containers according to the ward. From each container, three pieces were handpicked with eyes closed. The names on the picked pieces of paper were confirmed to be Mabhobhane, Masiwela, Mangongo, representing Ward 3; Mbitane, Sihlushwaneni, UMpumulo, representing Ward 6; and KwaNdaba, Ntombiyahlunina, Nyamazane, representing Ward 10. In total, nine sub-wards were selected for investigation. Figure 1 is a map of Maphumulo Local Municipality and its surrounding areas.
2.2. Research Design
A cross-sectional descriptive research design that encompasses quantitative research methods was used to conduct the study in assessing the status of household food security among the beneficiaries and non-beneficiaries of the “One Home One Garden” programme in Maphumulo Local Municipality [30]. Creswell [31] stated that a descriptive research method gathers information about the present situation. The design allowed the researcher to assess household food production levels, household food consumption patterns, and household food sources. This study made use of the descriptive cross-sectional research design because it describes rather than judges or interprets the situation. This method was considered to be appropriate because it was less costly both in terms of money and time, but also because it enables rational and sound conclusions. Furthermore, it allows the use of a structured questionnaire as the research instrument and produces empirical evidence about the current food security status of households.
2.3. Description and Selection of Participants
The target population included both the beneficiary and non-beneficiary households of the “One Home One Garden” programme. To ensure equal representation, the researcher used stratified random sampling from a presumed homogenous population of households in Maphumulo Local Municipality. Stratified random sampling divides the population into smaller groups, or strata, based on shared characteristics. The benefit of a stratified sampling procedure is the possibility to classify subgroups of a population and frame a sample that reflects the subgroups. The sample is therefore deemed to be more representative of the population within the identified subgroups [31,32]. A complete sampling frame of households that participated in the “One Home One Garden” programme was obtained from the Maphumulo Local Agricultural offices. According to the Maphumulo Local Agricultural office’s “One Home One Garden” inputs distribution list for 2014/2015, there were 750 beneficiaries of the “One Home One Garden” programme in the study areas. As for the non-beneficiary households, it was difficult or nearly impossible to obtain a complete list (sampling frame) of the households. Using the “One Home One Garden” beneficiary household sampling frame to estimate an appropriate or required sample size, a sample size calculator at a 5% confidence interval (margin of error) and 95% confidence level was used, as is commonly done in quantitative research [33]. A sample size of 330 and 165 “One Home, One Garden” beneficiary and non-beneficiary households, respectively, was obtained. The total sample consisted of 495 households that were randomly picked from each strata. A household in this paper is described as the family structure of people who reside in one homestead, working and eating together as a family. The actual respondents in the household were the persons who were responsible for household food preparation. In the absence of those, an adult member involved in food preparation who was available at the time of the study was selected to participate.
2.4. Data Collection
A survey method was used to collect data through a pretested questionnaire in November 2015 (avoiding unusual times such as funerals, weddings, feasting events, and social grant pay-out dates). November falls within the main crops growing season (October–April) in South Africa. The pretesting of the questionnaire was done to ensure that the questions to be asked were relevant to the study’s focus and to ensure that the persons being interviewed would be able to answer without being limited. The idea of pretesting the questionnaire was therefore to make sure that the instrument would be able to capture as close as possible to a true reflection of the household’s food security status. During the pretesting stage, ethnographic fieldwork practice was applied to ensure that the researcher obtained a thick description of the household’s food security status and the livelihood conditions of Maphumulo Local Municipality. The researcher resided in the study area to gain a better understanding of the socioeconomic characteristics of the target group; this also helped the researcher to identify key issues that affect the stability of household food security in the study area. The researcher made full and accurate notes of what transpired.
Prior to the survey, ethical clearance was obtained from the University of Zululand Research Ethics Committee (UZREC) and respondents were required to sign a consent form that was translated in the native isiZulu language. The survey was conducted at the household level and a structured questionnaire was used to collect data. In view of this, it could be argued that the advantage of a structured questionnaire is to allow respondents to answer questions as quickly as possible and that respondents answer exactly the same questions, making the research method reliable. The questions included household characteristics such as demographics (gender, age, education, marital status); farm specific characteristics (crops and livestock production information); food and non-food expenditure; 24-h recall food security questions; extension support-related information; employment status; income; agricultural activities; and factors affecting the food security status. Prior to the data collection process, four research assistants were trained to help collect data from the three wards in the study area. The training of research assistants is important to standardise data collection in order to minimise variations in the data collection procedures that may bias the results [28]. Hoey [34] suggested that providing training to research assistants is intended for those persons new to the research approach. Here, the trainer (researcher) discussed, for example, the centrality of field notes in conducting the research. The research assistants were familiarised with the questionnaire and some points to consider in collecting data. The questionnaire was translated to the native isiZulu language. The questionnaire sessions lasted between 15 min and 1 h. The questionnaires were interviewer-administered to alleviate the problem of misinterpretations or misunderstandings of words or questions.
2.4.1. Household Dietary Diversity Score (HDDS)
According to Swindale and Bilinsky [35], the Household Dietary Diversity Score (HDDS) is the number of different food groups consumed over a given reference period. This is an attractive proxy indicator. However, the expanded set should be combined back into the original 12 food groups so that the total HDDS is based on the same 12 food groups. Therefore, this study adopts the 12 food groups proposed by the FAO, World Health Organization (WHO), and the Food and Nutrition Technical Assistance (FANTA) in calculating the HDDS [35], which include: “cereals, roots and tubers, vegetables, fruits, meat-poultry-and-offal, eggs, fish and sea food, pulses-legumes-and-nuts, milk and milk products, oil/fats, sugar and honey, and miscellaneous” [36]. Different food groups ate by a household within a reference period represented the household dietary diversity and were based on a 24-h recall of food consumed by household members. Questions relating to dietary diversity were administered either at the individual or household level, creating the possibility of examining food security based on an individual’s dietary nutritional quality and/or at household and intra-household levels. Dietary diversity (a qualitative measure) reflects household access to diverse foods; this is commonly used as an indicator for nutrient adequacy with regard to individuals’ diets [37]. A dietary diversity questionnaire is a low-cost tool, quick and easy to administer [38], wherein scoring and data analysis is straightforward. Here, indicators of household food insecurity are based on dietary diversity, food frequency, and food sources [38] based on the 12 food groups [35].
2.4.2. Household Food Consumption Score (HFCS)
To supplement the HDDS, the paper makes use of the Household Food Consumption Score (HFCS). The HFCS is a seven-day quantitative aspect of food frequency or consumption pattern by the International Food Policy Research Institute (IFPRI) [39]. The HFCS is a frequency-weighted HDDS [39]. The HFCS is an indicator of dietary diversity and frequency of consumption, which is based on a food consumption record of the previous seven days’ food consumption. It is computed using the consumption frequency of eight differing food groups: “main staples, pulses, vegetables, fruit, meat and fish, milk, sugar and oil” [39,40]. The HFCS was used because it presents the possibility to calculate both dietary diversity and food frequency.
2.5. Data Analysis
During the data collection field work, data analysis was informal. This refers to the analysis of written field notes as the researcher writes them while making observations. Informal analysis reveals emergent themes while observing allows the researcher to shift attention in ways that can foster a more developed investigation. Upon withdrawing from the field, the researcher worked systematically through the collected data. Descriptive and inferential statistics were used to analyse data, expressing and testing assumed relationships between variables. Apart from the frequency distributions, measures of central tendency such as the mean, minimum, maximum, and standard deviation were used to describe the data. To estimate the food security status for the two sampled household groups—“One Home One Garden” beneficiaries and non-beneficiaries—the HDDS and HFCS indices were computed. Using the HDDS tool as a dependent variable (proxy of food security; refer to Section 2.5.1 and Section 2.5.3), the determinants of the household’s food security status were estimated by means of a binary logistic regression model after having employed a bivariate model (correlation coefficients) to explore whether a practical relationship existed between the dependent variable—household food security status—and the independent variables. If a significant relationship was established, then only those variables were investigated further using the binary logistic regression model.
2.5.1. Computing the Household Dietary Diversity Score (HDDS)
After collecting information related to the different food groups a specific household consumes, the food items were grouped into food groups. Currently there is no clear international cut off points for high or low HDDS levels, but for the purpose of this paper an average HDDS was computed per overall sample group (that is for the “One Home, One Garden” beneficiary and non-beneficiary households). Households which fell above the average HDDS level were treated as food secure and those that fell below the average HDDS level were treated as food insecure. The HDDS is a widely used tool and is promoted by the FAO and USAID as a proxy for food access. Therefore, the HDDS was used to serve as a proxy for household food security status in this paper (see Section 2.5.3). An increment in the dietary diversity of a household would generally reflect dietary improvement by a household. However, it should be noted that the quantity of the food consumed is not depicted by the dietary diversity score. Again, there is seasonal variation in dietary consumption, with other foods being available for a limited time in larger quantities and at a lesser cost.
2.5.2. Computing the Household Food Consumption Score (HFCS)
The Household Food Consumption Score is estimated using a typical seven-day food dataset through categorising food items into food groups and subsequently adding the consumption frequency of food items belonging to that particular group. A consumption frequency beyond 7 is captured as 7, and multiplied by the attained score for every food group by its weighting. Weighted food group scores are added together, and finally the HFCS, a continuous measure, is categorised into appropriate thresholds of food consumption groups as follows: 0 to 21 (poor), 21.5 to 35 (borderline), and above 35 (acceptable) [41].
2.5.3. Binary Logistic Regression Model
The binary logistic regression analytical framework is appropriate for modelling dichotomous endogenous variables. For this paper, the HDDS proxies the household food security status, where households were classified into food secure (assigned a numeric value 1) and food insecure (assigned a numeric value 0) (see Section 2.5.1). The binary logistic regression model then provides a framework for detecting the likelihood of being food secure or otherwise (food insecure) by a household. The choice of the determinants of household food security status was guided by various studies, such as the works of Mannaf and Uddin [42], Agbola [43], Mango et al. [44], and Zakari et al. [45]. Equation (1) portrays the specification of the binary logistic regression modelling:
where Xi represents a set of parameters that determine the ith household’s food security status. Zi is the odds of a household being food secure or not, a dichotomous dependent variable (coded with 1 if food secure, 0 otherwise). β0 represents the model intercept and β1 to βi represents the coefficients of the explanatory variables, X1 to Xki.
where Pi denotes the likelihood of the ith household’s food security status being secure and (1 − Pi) is the likelihood of the household being food insecure. The odds (Y = 1 against Y = 0) define the proportion of the likelihood of a household being food secure (Pi) to the likelihood of being food insecure (1 − Pi); that is, odds = Pi/(1 − Pi). Using the natural logarithm, the prediction is portrayed in Equation (3):
whereby the value of:
Zi = ƥµ + Σ(βiXki)
Zi is also denoted as the logarithm of the odds ratio in relation to a household being food secure, as portrayed in the regression Equation (5):
where Zi represents the household food security status (assigned a numeric value 1 if food secure and 0 if otherwise), β0 is the vector of unknown parameters (intercept), and µi denotes the error term.
Description of the Explanatory Variables Used in the Binary Logistic Regression Model
The explanatory (independent) variables inputted in the binary logistic regression modelling to elicit the determinants of household food security status include respondent’ age, household size, household income, farm size, gender, marital status, education status, employment status, access to credit, livestock farming, receiving infrastructural support (irrigation), and participation in the “One Home One Garden” programme. Table 1 summaries the explanatory variables entered in the binary logistic regression modelling and their expected outcomes.
Age, household size, household income, and farm size were all measured and inputted in the binary logistic regression model as continuous variables. According to Abdullah et al. [46] citing Mango, age has an effect on the food security status of households. The age of respondents was measured in actual years since the respondent’s birth date and was anticipated to negatively correlate with household food security status.
Household size represented the sum of members residing in a home together at the time of the study. The chances for a large household size to be poor are high [47] and therefore add more pressure on the household in terms of the number of people required to feed [48]. On the other hand, household size can mean the availability of family labour by delegating important farming activities to other household members; this is likely to boost the food security situation of a household [49]. Hence, the effect of household size on household food security status may not be predetermined.
Household income, both farm and non-farm (including wages, government social transfers and remittances), contributes to the total household income in rural areas. The total income received by a household was measured in South African rand (ZAR) and converted to United States dollars (US$) for analysis purposes. Household income was expected to improve the status of household food security because the ability to purchase food largely relies on household income and asset (wealth) status [50,51].
In South Africa, smallholder farming households are described as engaging in farming activities on relatively small pieces of land due to limited access to arable land. Farm size in this paper refers to arable land and was measured in hectares. It was expected to have a positive correlation with the food security status of a household [52], because more access to arable land suggests that the household can grow its own food, provided it has the necessary inputs and resources.
Gender, marital status, education status, employment status, access to credit, receiving extension support, practicing livestock farming, and receiving infrastructural irrigation support were measured and inputted into the binary logistic regression model as categorical variables. Elias et al. [53] pointed out that if both men and women have more equal participation in agriculture, production can be enhanced and with it the food security status. Therefore, the effect of gender as a variable (taken as a dummy variable, with male coded as 1, and 0 if otherwise) on the household food security status could not be predetermined.
Marital status, a dummy variable, was coded as follows: if a respondent was married they were assigned a numeric value 1, and 0 if otherwise. Married household caregivers are alleged to be better off in terms of their food security status in relation to their unmarried counterparts [54]. The marital status of the household caregivers was therefore anticipated to positively correlate with the food security status of a household.
Nnadi and Akwiwu [55] asserted that an educated farmer is in a better position to practice what he/she might have learnt from school in their farming projects. A respondent who had a formal education qualification was assigned a numeric value 1, and 0 if otherwise. Education status was therefore expected to positively correlate with household food security status.
Employment in this paper denotes the state of an economic active individual working either on a full-time and/or part-time basis and earning an income. Employment status was taken as a dummy variable (being employed—full-time or temporarily—was coded with a numeric value 1, and 0 if otherwise). A household with an employed individual increases its ability to consistently acquire food [56]. It was thus expected that the employment status would have a positive effect on the food security situation of households.
Access to credit in this paper refers to the ability of a household to obtain finance either as formal credit, referred to as debt from commercial banks, and/or semi-formal credit, which includes consumption credit (obtained from local shops). This variable excludes informal credit (debts obtained from friends and relatives). Access to credit was therefore taken as a dummy; if the respondent had access to credit they were coded with a numeric value 1, and 0 if otherwise. Credit, if acquired timely, can increase the likelihood of a household procuring production necessities such as seeds, chemicals, and fertiliser, among other inputs [57], which could improve production and thus the household food situation [58]. Access to credit by households was therefore anticipated to positively correlate with household food security status.
Gebrehiwot [59] mentioned that households engage in livestock farming to assist with access to cash during times of need for food and other household items. Livestock farming is an increasingly important livelihood strategy in rural households. Livestock farming was taken as a dummy variable (if the respondent was engaged in livestock rearing they were coded with 1, and 0 if otherwise). Practicing livestock farming was expected to boost the food security status of a household.
Farmers under intensive irrigation management schemes have a higher likelihood of improving their food security state compared to dryland farmers. Receiving infrastructural support with irrigation technology taken as a proxy, receiving infrastructural support for irrigation was measured as a dummy variable (receiving support was coded with a numeric value 1, and 0 if otherwise). Irrigation infrastructure reduces the risk of crop failure and the increment in yields can be substantial if properly managed [60], thus ensuring food security for the household.
As indicated earlier, the beneficiaries of the “One Home One Garden” programme received support from the government in the form of seeds, implements, and fertiliser, including training for home garden production. This was expected to boost the production of the beneficiary households and thus improve their food security status. Participation in the “One Home One Garden” programme by a household was measured as a dummy variable and was coded with a numeric value 1, and 0 if otherwise (for the “One Home One Garden” non-beneficiaries). Participation in the “One Home One Garden” programme was therefore expected to positively correlate with the household food security status.
3. Results
3.1. Summary of Socioeconomic Characteristics of Respondents
Table 2 shows a summary of the socioeconomic characteristics of respondents. The age of the respondents ranged from 19 to 86 years for all households. The mean age was about 53 years for all households. Household size ranged between 3 and 25 members for all households. The mean household size was about 12 members for all households. Household members consisted of grandchildren, parents, and other extended family members. Households income ranged from as low as US$ (United States Dollar (US$) converted from South African Rand (ZAR) on 5 July 2018. https://www.bloomberg.com/quote/USDZAR:CUR) 36.57 to US$ 512.07 for both groups. The mean income for the “One Home One Garden” beneficiaries was US$ 165.23, slightly lower than the mean for the whole sample of US$ 173.80. The mean income for the non-beneficiary households was slightly higher, at US$ 190.97.
Farm sizes ranged from 2 to 16 hectares and from 1 to 34 hectares for the “One Home One Garden” beneficiaries and non-beneficiaries, respectively. The average farm size was about 6 hectares for both groups. The study sample was dominated by more (about 89%) females for all households. Married respondents are more likely to be the primary care givers in the household, and are responsible for food preparation for all household members. Married respondents accounted for a higher proportion (about 51%) of respondents for all households. The majority (about 93%) of respondents for all households had attained formal educational qualifications (these ranged from primary to secondary and up to tertiary levels of education). The results confirmed high unemployment levels in South Africa in general [25,26], particularly in rural areas, as revealed by the majority (about 99%) of all households that were not formally employed. Only about 4% reported temporary employment for the “One Home One Garden” non-beneficiaries. Only a smaller proportion (about 7%) of the “One Home One Garden” beneficiaries attested to having received credit support, with the majority (about 95%) of the total sample indicating that they had never received credit support. The results further showed that the majority (about 57%) of all households owned livestock (which included cattle, goats, sheep, chicken, and pigs). The results affirmed that the majority (about 78%) of the total sample indicated that they do not receive infrastructural support such as irrigation infrastructure from the government and relied on dryland crop production. By default, all (100%) households that participated in the “One Home One Garden” programme reported to have received support (extension) from the government through the Department of Agriculture and Rural Development (DARD), in contrast to the “One Home One Garden” non-beneficiary households. Despite the “One Home One Garden” non-beneficiaries denying receiving any support, some respondents mentioned in passing that they received assistance—for example, in the rabies control and dipping of their cattle—although it was not formal.
3.2. Source of Household Food Procurement
Respondents were requested to indicate the means of household food procurement. The results revealed that the main source of food procurement by households was through government social grants (reported by the majority (53%) of the total sample) (Table 3). This source of food procurement was more dominant (reported by about 74%) among the “One Home One Garden” non-beneficiaries. Further probing revealed that the government social grants were in the form of old age and child support grants. About 13% of the total sample (that is, 30% and 11% of the “One Home One Garden” beneficiaries and non-beneficiaries, respectively) relied on both their own agricultural production and market purchase as a means of securing food for their households. This is despite the revelation of Statistics South Africa [6] that many rural households in South Africa cannot afford to buy food, mainly because of their low buying power as a result of low income-generation opportunities. Own agricultural production, including gathering, hunting, and fishing, only accounted for about 13% for all households as a means of household food procurement. A smaller proportion (about 4%) of all households depended on their own agricultural production, market purchase, and borrowing as a way of procuring food for their households.
3.3. The Type of Food Consumed by Household Members
Table 4 illustrates the various food groups consumed by households. The majority (about 88%)—that is, about 82% and 92% of the “One Home One Garden” beneficiaries and non-beneficiaries, respectively—had consumed maize the previous seven days. Maize is a staple food in South Africa and forms the main ingredient in household meals; for example, it is used for porridge preparation and pap, which is a common local staple food. Similarly, beans and rice were consumed by about 78% and 66% of all households in the previous seven days. The most usual response was that beans were eaten as a complimentary product with rice/mealie meal/steamed bread. Beans are easily stored for future consumption and can also be used as a seed in the next growing season. Furthermore, both groups consumed potatoes, sugar, milk, and oils; these are some of the food items that fall into the high consumption bandwidth. Qualitative data indicated that starchy foods such as rice and mealie meal were seen as desirable, although cost prohibitive.
3.4. Household Dietary Diversity Score (HDDS)
A Household Dietary Diversity Score was estimated so as to elicit a deeper understanding of the food groups consumed by households. The various food groups that different households consumed were used to compute the HDDS in a 24-h recall period. An independent samples t-test was performed to compare the status of household food security (proxied by the HDDS) of the two groups (that is, the “One Home One Garden” beneficiaries and non-beneficiaries) at a 0.05 significance level. The independent samples t-test (Levene’s test—equal variances assumed) revealed a significant relationship between the two sample groups and the status of household food security of t(493) = 4.156, α < 0.001. Thus, the null hypothesis was rejected and we concluded that there is a statistically significant difference between the food security status of the “One Home One Garden” beneficiaries and the non-beneficiary group (households). The results revealed that the mean HDDS was 4.67 for all households; the mean HDDS values were 4.89 and 4.22 for the “One Home One Garden” beneficiaries and non-beneficiaries, respectively (Table 4). The mean HDDS of the “One Home One Garden” beneficiaries was slightly higher than that of the total sample (all households), whereas the mean of the “One Home One Garden” non-beneficiaries was lower than the total sample mean. The HDDS results were further separated into three dietary classes; lowest diversity (three or less foods groups), medium diversity (between four and five food groups), and high diversity (six or more food groups). The results in Figure 2 revealed that the majority (about 50%) of the total sample—that is, about 61% of “One Home One Garden” beneficiaries versus 29% of the “One Home One Garden” non-beneficiaries—fell in the medium dietary diversity class/category (consumed four to five food groups). Furthermore, the results also revealed that the majority of all households—about 52% of the “One Home One Garden” beneficiaries versus about 19% of the “One Home One Garden” non-beneficiaries—consumed less than three food groups (classified as the lowest dietary diversity group). The justification for this finding could be that the “One Home One Garden” beneficiaries relied primarily on their own agricultural production and less on off-farm income such as government grants, whereas the “One Home One Garden” non-beneficiaries relied less on their own agricultural production and more on government social grants as food procurement sources (Table 4). Lastly, it is interesting from these results to note that the “One Home One Garden” non-beneficiaries in the high dietary consumption category constituted a larger proportion (36%), as compared to about 20% of the “One Home One Garden” beneficiaries. Nonetheless, on average the “One Home One Garden” beneficiaries had better food dietary diversity than the non-beneficiary households.
3.5. Household Food Consumption Score (HFCS)
The dietary diversity score, however, does not show the amount (quantity) of food a household consumed. Diet differs between seasons and other foods are presumed to be obtainable in large amounts and at lower costs for short periods. A Household Food Consumption Score (HFCS), a frequency-weighted HDDS, was further estimated as an indicator of dietary diversity and frequency of consumption by use of the frequency consumption of eight various food groups. The findings in Table 5 revealed that the majority (about 65%) of the “One Home One Garden” beneficiaries had an acceptable HFCS (≥35) as compared to 35% of the “One Home One Garden” non-beneficiaries in the same HFCS level, while the majority (about 54%) of the “One Home One Garden” non-beneficiaries had a borderline HFCS (21.5 to 35) as compared to 33% of the “One Home One Garden” beneficiaries in the same HFCS level. About 2% and 11% of the “One Home One Garden” beneficiaries and non-beneficiaries, respectively, fell within the poor food consumption category. Overall, about 55% of all households had an acceptable food consumption score. Nonetheless, the “One Home One Garden” beneficiaries were better off than the “One Home One Garden” non-beneficiaries in their dietary levels of food consumption with regard to the HFCS. This finding is congruent with the mean HDDS results, as was expected. This supports the notion that the higher the HDDS, the more acceptable the HFCS [39].
3.6. Bivariate Analysis between the Household Food Security Status (HDDS) and the Explanatory Variables
A bivariate correlation analysis ascertains whether there is an empirical relationship (association) between two variables in question. In the bivariate analysis, this paper makes use of the Pearson’s r or Pearson product-moment correlation coefficients. Guided by the literature on the possible determinants of household food security status, 12 explanatory variables were inputted in the bivariate model. Seven were found to be significant (Table 6). Pearson’s correlation coefficients with p < 0.05 were taken as significant. These variables included household size, household income (US$), education status, employment status, access to credit, receiving infrastructural support (irrigation), and participation in the “One Home One garden” programme. The significant variables from the bivariate analysis were subjected to further statistical analysis; the binary logistic regression model was employed to establish a better understanding of their influence in determining household food security status in Maphumulo.
3.7. Binary Logistic Regression Model Results of the Determinants of Household Food Security Status (HDDS)
The variables that were significant from the bivariate analysis were subjected to a collinearity diagnosis using the variance inflation factors (VIF) test before running the binary logistic regression model. Variance inflation factors estimate how much the variance is inflated. Many researchers suggest that explanatory variables with a high VIF (usually from 5 to 10 and above) suggest a problem of multicollinearity and that the violating predictors be excluded from the model. Two variables—employment status and participation in the “One Home One Garden” programme—had a VIF value higher than 10 and were thus excluded from further analysis. Table 7 presents the results of the combined analysis (for both the “One Home One Garden” beneficiaries and non-beneficiaries) from the binary logistic regression model on the determinants of household food security status in Maphumulo. The results were combined for ease of analysis and interpretation because it would be too lengthy and confusing to present separate results on the determinants of household food security status for the two groups in one analysis. Again, Table 6 shows that the independent variables showed significant association with the dependent variable in a combined analysis.
In the binary logistic regression modelling, although there is no consensus on the goodness of the model fit, the Hosmer and Lemeshow chi-square test is regarded as a more robust test of the model fitness, despite the fact that it is sometimes criticised. In contrast to most p-values, here a p-value greater than 0.05 (p ≥ 0.05) indicates a better fit of the model to data. As for this dataset, the p-value = 0.045 (p ≤ 0.05) was significant (as would be expected in a large sample) and the pseudo-Nagelkerke R Square (0.296) is quite low; this suggests that the model might not be a good fit (Table 7). However, the −2 log likelihood (deviance) measure of how well the model explains variations in the outcome of interest has a chi-squared distribution and, similarly, the overall predictive power of the model (about 74%) is high, indicative of how well the model fitted the data. Five variables of the six that were finally tested in the binary logistic regression model were found to be significant in determining a household’s food security status in Maphumulo. These variables include household income, education, access to credit, receiving infrastructural support (irrigation), and participation in the “One Home One Garden” programme.
The variable household income was found to be significant at the 1% level (p = 0.000) and had a negative correlation with the household food security status, which is in contrast to what was expected, with a beta coefficient (β) = −0.004 and an odds ratio (Exp(β)) = 0.996. The model predicts that for a one unit increase in income by a household, the household would be less likely to be food secure by 0.006 times while holding all other independent factors constant.
The variable education status was found to be significant at the 5% level (p = 0.036) and was positively correlated with the household food security status, as was expected, with a beta coefficient (β) = 0.817 and an odds ratio (Exp(β)) = 2.264. The model predicts that educational status would increase the odds of a household to be food secure while holding all other independent factors constant.
The variable access to credit was found to be significant at the 1% level (p = 0.002) and was negatively correlated with the household food security status of households, contrary to what was expected, with a beta coefficient (β) = −0.733 and an odds ratio (Exp(β)) = 0.481. The model predicts that when a household has access to credit, the odds of a household to be food secure is less likely while holding all other independent factors constant.
The variable infrastructural support (irrigation) with irrigation infrastructure taken as a proxy was found to be significant at the 1% level (p = 0.001) and was positively influenced the household food security status, with a beta coefficient (β) = 1.886 and an odds ratio (Exp(β)) = 6.591. The model predicts that with an improvement in infrastructural support from the government such as irrigation technology, the chances of a household becoming food secure will increase.
The variable participation in the “One Home One Garden” programme was found to be significant at the 1% level (p = 0.000) and positively influenced the household food security status, with a beta coefficient (β) = 1.259 and an odds ratio (Exp(β)) = 3.522. The model predicts that participation in the “One Home One Garden” programme by a household would improve the likelihood of a household to become food secure.
4. Discussion
This paper sought to analyse the determinants of the food security status of households in rural Maphumulo in the province of KZN in South Africa. This was achieved by first estimating the food security status between the “One Home One Garden” beneficiary and the non-beneficiary households in the study area. Taking HDDS and the HFCS as proxies for household food security with regards to dietary diversity and frequency of consumption, respectively, on average the “One Home One Garden” beneficiaries seem to be better off than their non-beneficiary counterparts. In both instances, households consumed mainly cereals. According to the FAO [61], there is a global upward consumption trend of cereals; this supports the finding of this paper.
The descriptive results showed that households were mainly dominated by the elderly for both the “One Home One Garden” beneficiaries and the non-beneficiary households. There is no consensus as to the influence of age on the food security status of households. Other scholars, for example Arene and Anyaeji [62] and von Fintel and Pienaar [63], are of the view that older farmers tend to be more food secure, while others contradict this, for example Mannaf and Uddin [42] and Adenike [54]. Some studies, such as those of Mango et al. [39] and Sekhampu [48], could not establish any significant link between age and household food security status. In consonance with Mango et al. [39] and Sekhampu [48], the bivariate analysis in this paper did not find a significant association between the age variable and the food security status of households in Maphumulo.
In both sampled groups, households had a low level of income (which was below the minimum wage for South Africa for employees in the farm and forestry workers’ sectors—US$ 203.28) [64]. This may suggest that the ability by households to purchase food and have adequate diverse foods available at the household at all times is undermined. However, an analysis of the effect of household income on the food security status of households, although negative, showed that additional income of households seems to imply no change in food security status while holding all other independent factors constant. This is in contrast with our prior expectation, as well as findings throughout the literature, for example those of Mannaf and Uddin [42], Sekhampu [48], and Mark et al. [56], that increasing the income of a household would increase the likelihood of a household to be food secure as it increases the means or ability to purchase food. This may be explainable in the sense that as households receive more income, they would want to satisfy needs other than food requirements and choose not to channel the additional income into their food baskets.
On average, all households’ analyses revealed that the average farm size was about 6 hectares in Maphumulo. A farm of this size can be efficient if utilised properly to ensure household food security. Nonetheless, the bivariate analysis in this paper did not find a significant association between farm size and the food security status of households in Maphumulo. Gender was highlighted as an important predictor of household food security status by Elias et al. [53]. Males in both sampled groups were a minority, with females dominating as household heads. This is attributed to the fact that in most instances, men in rural areas migrate to urban areas in search of better employment opportunities. Nonetheless, the bivariate analysis in this paper did not find a significant association between the gender variable and the food security status of households in Maphumulo.
The descriptive results showed that respondents were of diverse levels of education. The results from both groups revealed that the respondents were literate and thus it can be inferred that the sampled households are able to utilise the information passed on to them efficiently. Therefore, it is expected that such households are more likely to participate in agricultural activities and more likely to boost their food production, thereby improving the likelihood of them being food secure. Again, education may expose households to diversified livelihood portfolios that are likely to increase food procurement means. The finding from this paper agrees with those of Agbola [43] and Mango et al. [44], that education status has a positive correlation with household food security status.
The finding from this paper confirms the assertion of Musemwa et al. [65] that employment opportunities are still minimal, particularly in rural South Africa where the majority of people rely on government grants to secure food. Government social grants, as evident from the results, were the main source of food procurement by households. This was particularly true for the “One Home One Garden” non-beneficiaries, followed by their own agricultural production and market purchase, since most people were neither formally employed nor earning a stable income. Although the bivariate analysis suggested a significant association between employment status and household food security status, it was not possible in this paper to further determine its influence on the status of household food security in Maphumulo, as this variable was excluded from further analysis in the binary logistic regression model due to collinearity.
The descriptive results revealed that access to credit remains a stumbling block in rural South Africa [66]. Disappointingly, only a few households that belonged to the “One Home One Garden” beneficiaries and none of the “One Home One Garden” non-beneficiaries reported to have received any credit assistance from financial institutions. This finding could imply that respondents relied largely on informal credit networks. Throughout the literature, credit support is highlighted as a crucial aspect for promoting the food security status of households, as seen in Iftikhar [58] and Matchaya and Chilonda [67]. Surprisingly, the variable of access to credit was found to negatively influence the status of household food security in Maphumulo. This could be attributed to the fact that either formal credit facilities are not well exploited and/or probably that most households in Maphumulo (both the “One Home One Garden” beneficiaries and non-beneficiaries) were not receiving any formal credit support; rather, qualitative data suggested that they were more likely to depend on the informal credit sector within the community (such as stokvels, friends, and neighbours). Therefore, when household members borrow from the informal sector, the negative correlation may be the lower calorie and protein intake which may arise when the households have to repay the loan (at exorbitant rates). Again, it could also be due to the fact that the loan from the informal creditors was not enough in the first place to guarantee the intended investment and therefore households end up lowering their food consumption to make up for shortfalls.
Own agricultural production, together with market purchase, was reported as the second most important source of food procurement by all households. Own agricultural production, market purchase, and borrowing constituted the least common source of food procurement by households. This finding is supported by the FAO’s [68] indication that in developing countries, only a few households rely on gardens as a major source of food to meet household consumption requirements. Apart from crop production, livestock farming is also an important livelihood strategy in rural areas, ensuring food security for many households within rural and peri-urban areas [69]. However, through the bivariate analysis, this paper did not find a significant association between practicing livestock farming and the food security status of households in Maphumulo.
Irrigation infrastructure is one of the major challenges facing a number of farming households due to the huge capital outlay needed to kick start its implementation. The results showed that the majority of households in Maphumulo relied on dryland farming systems and mentioned that they were experiencing a shortage of water for irrigation. Irrigation infrastructure empowers farming households to adopt more diversified cropping patterns and to change from low-value subsistence production to high-value market-oriented production, which has the potential to boost productivity and thus household food security. Irrigation infrastructure, used as a proxy for infrastructural support in this paper, was found to be a significant determinant of household food security status. This finding confirms the assertions by Dube [70] and Gohar et al. [71] that infrastructural irrigation support can improve the food security status of households.
Of interest in this paper is the assessment of whether participation in the “One Home One Garden” programme by beneficiary households influences their food security status compared to their non-beneficiary counterparts. The variable participation in the “One Home One Garden” programme was found to be a significant determinant of household food security status in Maphumulo. The results showed that participation in the “One Home One Garden” programme is likely to improve the likelihood of households becoming food secure. This may hold true given that the “One Home One Garden” programme beneficiaries, apart from receiving home gardening inputs and implements, received further assistance from the government through the DARD-provided extension services to households, such as training in agricultural production (relevant information about cropping practices including managerial skills and optimal input use). In contrast, the non-beneficiary households did not seem not to receive this kind of support. Participation in a government food security intervention programme by households is therefore crucial to empowering those households with their own food production, which is likely to improve the food security status by increasing their optimal production.
5. Conclusions and Policy Implications
The results presented in this paper provide evidence that food security still remains an issue in rural South Africa. The descriptive results confirmed that the majority of households that benefited from the “One Home One Garden” intervention programme had medium dietary diversity levels, as compared to the “One Home One Garden” non-beneficiaries, where the majority fell in the lowest food dietary diversity category. This finding confirms that although households can have access to food, from a nutritional perspective, households may still not be able to meet the dietary diversity requirements to be deemed as food secure. The lower dietary diversity level for the majority of “One Home One Garden” non-beneficiaries and the limited access to other food groups by the “One Home One Garden” beneficiaries is evidence that only a few households are truly food secure in Maphumulo. As a result, households usually eat what is available, what they grow in their gardens or farms, and what is affordable at any point in time.
The odds of being food secure in Maphumulo were determined by factors that include household income, education status, access to credit, receiving infrastructural support (irrigation), and participation in the “One Home One Garden” programme. These factors were found to be significant in improving the household food security status, save for household income and access to credit, which were found to be negatively correlated with the food security status of households in Maphumulo.
These findings highlight the importance of education, infrastructural irrigation support, and participation in a food security intervention initiative, such as the “One Home One Garden” programme, in boosting household food security status. Education is key in determining a household’s food security status as it helps the members within a household to be aware of the available means and options of being receptive to new practices of farming, such as technological inputs, that are likely to boost the productivity of households and thus their food security status following a good yield and/or harvest. Again, education can mean that household members are able to diversify their livelihood portfolios, which can also improve a households’ food supply.
Hardships associated with rain-fed farming systems such as drought, which greatly affects agricultural production, can be greatly reduced by investing in infrastructural irrigation support, especially for smallholder farmers. Vibrant infrastructural irrigation will then in turn improve productivity and thus guarantee food security for households.
The findings also highlight the importance of government food security intervention programmes. Participation in a food security intervention initiative (the “One Home One Garden” programme) was found to be a positive determinant of household food security status. Participation by households in a government food security intervention programme, if harnessed and made accessible to all, can potentially improve households’ farming knowledge, increase production, and bring about household food security.
The findings from this paper have crucial implications for the government and other development agencies for improving household food security status in rural Maphumulo and other areas in general. Since own agricultural production and food purchasing, apart from government social grants (which create dependency), were among the major means to procure food by households in Maphumulo, mechanisms should be put in place that will promote own agricultural production through extension. This could be achieved by investments in education and agricultural infrastructure, giving priority to smallholder infrastructural irrigation, providing support for households that largely rely on rain-fed systems, and implementing government food security intervention programmes. Finally, it is recommended to undertake an in-depth inquiry on the household coping measures as well as the effect of household income (particularly government social grants) and access to credit in relation to household food security status so as to better understand the dynamics of this issue.
Author Contributions
P.Z.N. conceptualised the study during her MSc studies under the guidance of both M.S. and L.M. P.Z.N. collected data. M.S. and L.M. assisted with some sections of data analysis and the development of the draft manuscript. The final manuscript is the result of discussion and contribution from all authors.
Acknowledgments
The authors gratefully acknowledge the Research and Innovation Office of the University of Zululand for inspirational support towards this work.
Conflicts of Interest
There are no conflicting interests declared by authors.
References
- Food and Agriculture Organization (FAO). The State of Food and Agriculture; Viale delle Terme: Rome, Italy, 2008. [Google Scholar]
- Masipa, T.S. The impact of climate change on food security in South Africa: Current realities and challenges ahead. JÀMBÁ J. Disaster Risk Stud. 2017, 9, a411. [Google Scholar] [CrossRef] [PubMed]
- Hart, T.; Voster, I.; Jansen van Rensberg, W. Indigenous Knowledge and African Vegetables. Available online: http://ecommons.hsrc.ac.za/bitstream/handle/20.500.11910/4565/6098.pdf?sequence=1&isAllowed=y (accessed on 10 April 2018).
- Mkhawani, K.; Motadi, S.A.; Mabapa, N.S.; Mbhenyane, X.G.; Blaauw, R. Effects of rising food prices on household food security on female-headed households in Runnymede Village, Mopani District, South Africa. S. Afr. J. Clin. Nutr. 2016, 29, 69–74. [Google Scholar] [CrossRef]
- Department of Agriculture, Forestry and Fisheries (DAFF). Strategic Plan 2013, 14–2017/18 for the Department of Agriculture, Forestry and Fisheries; Government Printer: Pretoria, South Africa, 2013. [Google Scholar]
- Statistics South Africa. Community Survey: A Survey that Explains a Lot; Statistics South Africa: Pretoria, South Africa, 2011. [Google Scholar]
- Sekhampu, T.J. Determinants of poverty in a South African township. J. Soc. Sci. 2013, 34, 145–153. [Google Scholar] [CrossRef]
- Altman, M.; Ngandu, S. Would halving unemployment contribute to improved household food security for men and women? Agenda Empower. Women Gend. Equity 2010, 24, 52–65. [Google Scholar]
- Human Science Research Council (HSRC). Policy Paper: Government’s Role in Ensuring and Improving Food Security in South Africa; The Research and Development Directorate: Johannesburg, South Africa, 2013. [Google Scholar]
- United States Agency for International Development (USAID). Policy Determination, Definition of Food Security; USAID: Washington, DC, USA, 2010. [Google Scholar]
- Deitchler, M.; Ballard, T.; Swindale, A.; Coates, J. Validation of a Measure of Household Hunger for Cross-Cultural Use; Food and Nutrition Technical Assistance (FANTA): Washington, DC, USA, 2010. [Google Scholar]
- Western Cape Government. Bill of Rights (Chapter 2 of the Constitution of the Republic of South Africa). Available online: https://www.westerncape.gov.za/legislation/bill-rights-chapter-2-constitution-republic-south-africa#27 (accessed on 8 August 2018).
- Misselhorn, A.; Hendriks, L. A systematic review of Sub-National Food in-security Research in South Africa: Missed opportunities for policy insight. PLoS ONE 2017, 12, e0182399. [Google Scholar] [CrossRef] [PubMed]
- Govender, L.; Pillay, K.; Siwela, M.; Modi, A.; Mabhaudhi, T. Food and nutrition insecurity in selected rural communities of KwaZulu-Natal, South Africa—Linking human nutrition and agriculture. Int. J. Environ. Res. Public Heal. 2017, 14, 17. [Google Scholar] [CrossRef] [PubMed]
- KwaZulu-Natal Department of Agriculture and Environmental Affairs (KZNDAEA). Final Formulation Report (6 September 2005); KZNDAEA: Pretoria, South Africa, 2005. [Google Scholar]
- South African National Treasury. Provincial Budgets and Expenditure Review: 2010/11–2016/17; South African National Treasury: Pretoria, South Africa, 2015. [Google Scholar]
- KwaZulu-Natal (KZN) Top Business Portfolio. KZN Trade and Investment; SESALOS: Durban, South Africa, 2018. [Google Scholar]
- National Department of Agriculture (NDA). Agricultural Policy in South Africa; NDA: Pretoria, South Africa, 1998. [Google Scholar]
- Altman, M.; Hart, T.G.B.; Jacobs, P.T. Household food security status in South Africa. Agrekon 2009, 48, 345–361. [Google Scholar] [CrossRef]
- D’Haese, M.; Vink, N.; Nkunzimana, T.; van Damme, E.; van Rooyen, J.; Remaut, A.; Staelens, L.; D’Haese, L. Improving food security in the rural areas of KwaZulu-Natal province, South Africa: Too little, too slow. Dev. S. Afr. 2013, 30, 468–490. [Google Scholar] [CrossRef]
- Masuku, M.; Selepe, M.; Ngcobo, N. Status of Household Food Security in Rural Areas at uThungulu District, Kwa-Zulu Natal, South Africa. Afr. J. Hosp. Tour. Leis. 2017, 6, 1–11. [Google Scholar]
- Department of Agriculture and Environmental Affairs (DAEA). Maphumulo Local Municipality Agricultural Projects Development Plan; DAEA: KwaZulu-Natal, South Africa, 2013. [Google Scholar]
- KwaZulu-Natal Provincial Government. Operation Sukuma Sakhe: Implementation Model, Guidelines for Coordination; KwaZulu-Natal Provincial Government: KwaZulu-Natal, South Africa, 2012. [Google Scholar]
- Machethe, C. Agriculture and Poverty in South Africa: Can Agriculture Reduce Poverty? Presented at the Overcoming Underdevelopment Conference, Pretoria, South Africa, 28–29 October 2004. [Google Scholar]
- Parliament of South Africa. Report of the High Level Panel on the Assessment of Key Legislation and the Acceleration of Fundamental Change. Available online: https://www.parliament.gov.za/storage/app/media/Pages/2017/october/High_Level_Panel/HLP_Report/HLP_report.pdf (accessed on 23 April 2018).
- Statistics South Africa. Whither a Demographic Dividend South Africa: The Overton Window of Political Possibilities; Statistics South Africa: Pretoria, South Africa, 2017. [Google Scholar]
- Hendriks, S.L.; Van Der Merwe, C.; Ngidi, M.S.; Manyamba, C.; Mbele, M.; McIntyre, M.; Mkandawire, E.; Molefe, Q.; Mphephu, M.Q.; Ngwane, L. What are we measuring? A comparison of household food security indicators from a sample of households in the Eastern Cape Province, South Africa. Ecol. Food Nutr. 2016, 55, 141–162. [Google Scholar] [CrossRef] [PubMed]
- Mugenda, O.; Mugenda, A. Research Methods: Quantitative and Qualitative Approaches; Acts Press: Nairobi, South Africa, 2003. [Google Scholar]
- Yes Media. Maphumulo Local Municipality (KZN294). Available online: https://municipalities.co.za/map/1072/maphumulo-local-municipality (accessed on 13 April 2018).
- Scrimshaw, S.C.M. Combining Quantitative and Qualitative Methods in the Study of Intra-Household Resource Allocation; United Nations University Press: Geneva, Switzerland, 1990; pp. 186–198. [Google Scholar]
- Creswell, J.W. Research Design: Qualitative & Quantitative Approaches; Sage Publication: Thousand Oaks, CA, USA, 1994. [Google Scholar]
- Youth, R. Population and Sampling: The Rational of Sampling Steps in Sampling, Types in Sampling. Inferential Statistics: A Look ahead the Case Study Approach; Prentice Hall: Upper Saddle River, NJ, USA, 2006. [Google Scholar]
- Schrijver, W. How to Estimate Your Population and Survey Sample Size? Available online: https://www.checkmarket.com/2013/02/how-to-estimate-your-population-and-survey-sample-size/ (accessed on 20 November 2014).
- Hoey, B.A. Simple Introduction to Practice of Ethnographic and Guide to Ethnographic Field Notes; Marshall University, Bepress: Berkeley, CA, USA, 2014. [Google Scholar]
- Swindale, A.; Bilinsky, P. Household Dietary Diversity Score (HDDS) for Measurement of Household Food Access: Indicator Guide; International Food Policy Research Institute (IFPRI): Washington, DC, USA, 2006. [Google Scholar]
- Government of Kenya (GOK). Food Security and Nutrition Strategy; Second Draft; Government Printer: Nairobi, Kenya, 2011. [Google Scholar]
- Food and Agriculture Organization (FAO). FAO Support to NEPAD and Its Planning and Coordinating Agency (NPCA); Viale delle Terme: Rome, Italy, 2012. [Google Scholar]
- Grobler, W.C.J. Spending Patterns of Food Insecure Households in Low Income Neighbourhoods in South Africa. Available online: http://www.wbiworldconpro.com/...2013.../1382555073-205-Wynand-pdf (accessed on 23 July 2018).
- International Food Policy Research Institute (IFPRI). Validation of Food Frequency and Dietary Diversity as Proxy Indicators of Household Food Security; World Food Programme; Food Security Analysis Service: Rome, Italy, 2008. [Google Scholar]
- United States Agency for International Development (USAID). FFP Indicators Handbook Part 1: Indicators for Baseline and Final Evaluation Survey; Food and Nutrition Technical Assistance III Project (FANTA III); Connecticut Avenue: Washington, DC, USA, 2015. [Google Scholar]
- Food and Agriculture Organization (FAO). The State of Food and Agriculture, Food and Agriculture Organization of The United Nations; FAO: Rome, Italy, 2011. [Google Scholar]
- Mannaf, M.; Uddin, M.T. Socioeconomic factors influencing food security status of maize growing households in selected areas of Bogra District. Bangladesh J. Agric. Econ. 2012, 35, 1–2. [Google Scholar]
- Agbola, P.O. Factors influencing food insecurity among small farmers in Nigeria. Afr. J. Agric. Res. 2014, 9, 2104–2110. [Google Scholar] [CrossRef]
- Mango, M.; Zamasiya, B.; Makate, C.; Nyikahadzoi, K.; Siziba, S. Factors influencing household food security among smallholder farmers in the Mudzi district of Zimbabwe. Dev. S. Afr. 2014, 31, 625–640. [Google Scholar]
- Zakari, S.; Ying, L.; Songet, B. Factors Influencing Household Food Security in West Africa: The Case of Southern Niger. Sustainability 2014, 6, 1191–1202. [Google Scholar] [CrossRef] [Green Version]
- Abdullah; Zhou, D.; Shah, T.; Ali, S.; Ahmad, W.; Ud Din, I.; Ilyas, A. Factors affecting household food security in rural northern hinterland of Pakistan. J. Saudi Soc. Agric. Sci. 2017. [Google Scholar] [CrossRef]
- Obi, A.; Tafa, S. The Determinants of Household Poverty in South Africa. Afr. Public Serv. Deliv. Perform. Rev. 2016, 4, 516–538. [Google Scholar] [CrossRef]
- Sekhampu, T.J. Determinants of the Food Security Status of Households Receiving Government Grants in Kwakwatsi, South Africa. Mediterr. J. Soc. Sci. 2013, 4, 147–153. [Google Scholar]
- Etwire, P.M.; Dogbe, W.; Wiredu, A.N.; Martey, E.; Etwire, E.; Owusul, R.K.; Wahaga, E. Factors Influencing Farmer’s Participation in Agricultural Projects: The Case of the Agricultural Value Chain Mentorship Project in the Northern Region of Ghana; CSIR-Savanna Agricultural Research Institute: Legon Uccra, Ghana, 2013. [Google Scholar]
- Jacobs, P.T. The status of household food security targets in South Africa. Agrekon 2009, 48, 321–356. [Google Scholar] [CrossRef]
- Anderson, P.M.; Butcher, K.F.; Hilary, W.; Hoynes, H.W.; Schanzenbach, D.W. Beyond Income: What Else Predicts Very Low Food Security among Children? Available online: https://gspp.berkeley.edu/assets/uploads/research/pdf/RevisedSEJFinal.pdf (accessed on 23 April 2018).
- Muraoka, R.; Jin, S.; Jayne, T.S. Land Access, Land Rental and Food Security: Evidence from Kenya. In Proceedings of the Agricultural & Applied Economics Association’s 2014 AAEA Annual Meeting, Minneapolis, MN, USA, 27–29 July 2014. [Google Scholar]
- Elias, A.; Nohmi, M.; Yasunobi, K.; Ishida, A. Effect of agricultural extension programme on smallholders’ farm productivity: Evidence from three peasant associations in the highlands of Ethiopia. J. Agric. Sci. 2013, 5, 1916–9752. [Google Scholar]
- Adenike, A.A. The Effect of Family Planning Methods on Food Security in Oyo State, Nigeria. J. Life Sci. 2016, 10, 100–112. [Google Scholar]
- Nnadi, F.N.; Akwiwu, C.D. Determinants of youths’ participation in rural agriculture in Imo State, Nigeria. J. Appl. Sci. 2008, 8, 328–333. [Google Scholar] [CrossRef]
- Mark, N.; Coleman-Jensen, A.; Gregory, C. Prevalence of U.S. Food Insecurity Is Related to Changes in Unemployment, Inflation, and the Price of Food; ERR-167; United States Department of Agriculture (USDA): Washington, DC, USA, 2014. [Google Scholar]
- Kuwornu, J.K.M.; Mensah-Bonsu, A.; Ibrahim, H. Analysis of foodstuff price volatility in Ghana: Implications for food security. Eur. J. Bus. Manag. 2012, 3, 100–118. [Google Scholar]
- Iftikhar, S.; Mahmood, H.Z.; Yildiz, F. Ranking and relationship of agricultural credit with food security: A district level analysis. Cogent Food Agric. 2017, 3, 133242. [Google Scholar] [CrossRef]
- Gebrehiwot, T. Rural Food Security in Tigray, Ethiopia: Policy Impact Evaluation; International Institute for Geo-Information Science and Earth Observation: Enschede, The Netherlands, 2008. [Google Scholar]
- Sikwela, M.M. The Impact of Farmers Support Programmes on Market Access of Smallholder Farmers in the Eastern Cape and KwaZulu-Natal Provinces, South Africa. Ph.D. Thesis, University of Fort Hare Alice, Alice, South Africa, 2013. [Google Scholar]
- Food and Agriculture Organization (FAO). The Economic Review of Agriculture; Ministry of Agriculture: Nairobi, Kenya, 2010. [Google Scholar]
- Arene, C.J.; Anyaeji, J. Determinants of Food Security among Households in Nsukka Metropolis of Enugu State, Nigeria. Pak. J. Soc. Sci. 2010, 30, 9–16. [Google Scholar]
- Von Fintel, D.; Pienaar, L. Small-Scale Farming and Food Security: The Enabling Role of Cash Transfers in South Africa‘s Former Homelands; Discussion Paper No. 10377; Institute for the Study of Labor: Bonn, Germany, 2016. [Google Scholar]
- Department of Labour. 2018 Minimum Wages for Employees in the Farm and Forestry Workers Sectors. Available online: https://www.labourguide.co.za/workshop/1397-2018-farm-and-forestry1/file (accessed on 13 April 2018).
- Musemwa, L.; Zhou, L.; Ndhleve, S.; Aghdasi, F. Factors affecting household access to enough food in the Eastern Cape Province of South Africa. J. Dev. Agric. Econ. 2013, 4, 84–91. [Google Scholar] [CrossRef]
- Biyase, M.; Fisher, B. Determinants of Access to Formal Credit by the Poor Households. Stud. Univ. Babes Bolyai Oeconomica 2017, 62, 50–60. [Google Scholar] [CrossRef] [Green Version]
- Matchaya, G.C.; Chilonda, P. Estimating effects of constraints on food security in Malawi: Policy lessons from regressions quantiles. Appl. Econ. Int. Dev. 2012, 12, 165–190. [Google Scholar]
- Food and Agriculture Organization (FAO). The Millennium Development Goals: The Road Ahead; United Nations: New York, NY, USA, 2007. [Google Scholar]
- Reddy, V.; Goga, S.; Timol, F.; Molefi, S.; Mather, A.; Chetty, T.; Wallace, D. Gender, Small-Scale Livestock Farming and Food Security: Policy Implications in the South African Context; HSRC Policy Brief; HSRC: Pretoria, South Africa, 2015. [Google Scholar]
- Dube, K. Implications of rural irrigation schemes on household economy. A case of Lower Gweru Irrigation Scheme, Zimbabwe. Services on Demand. S. Afr. J. Agric. Ext. 2016, 44, 75–90. [Google Scholar]
- Gohar, A.A.; Amer, S.A.; Ward, F.A. Irrigation infrastructure and water appropriation rules for food security. J. Hydrol. 2016, 520, 85–100. [Google Scholar] [CrossRef]
Figure 1.
Map of Maphumulo Local Municipality. Source: Yes, Media [29].
Figure 1.
Map of Maphumulo Local Municipality. Source: Yes, Media [29].

Figure 2.
Household Dietary Diversity Scores (HDDS). Source: Survey data (2015).


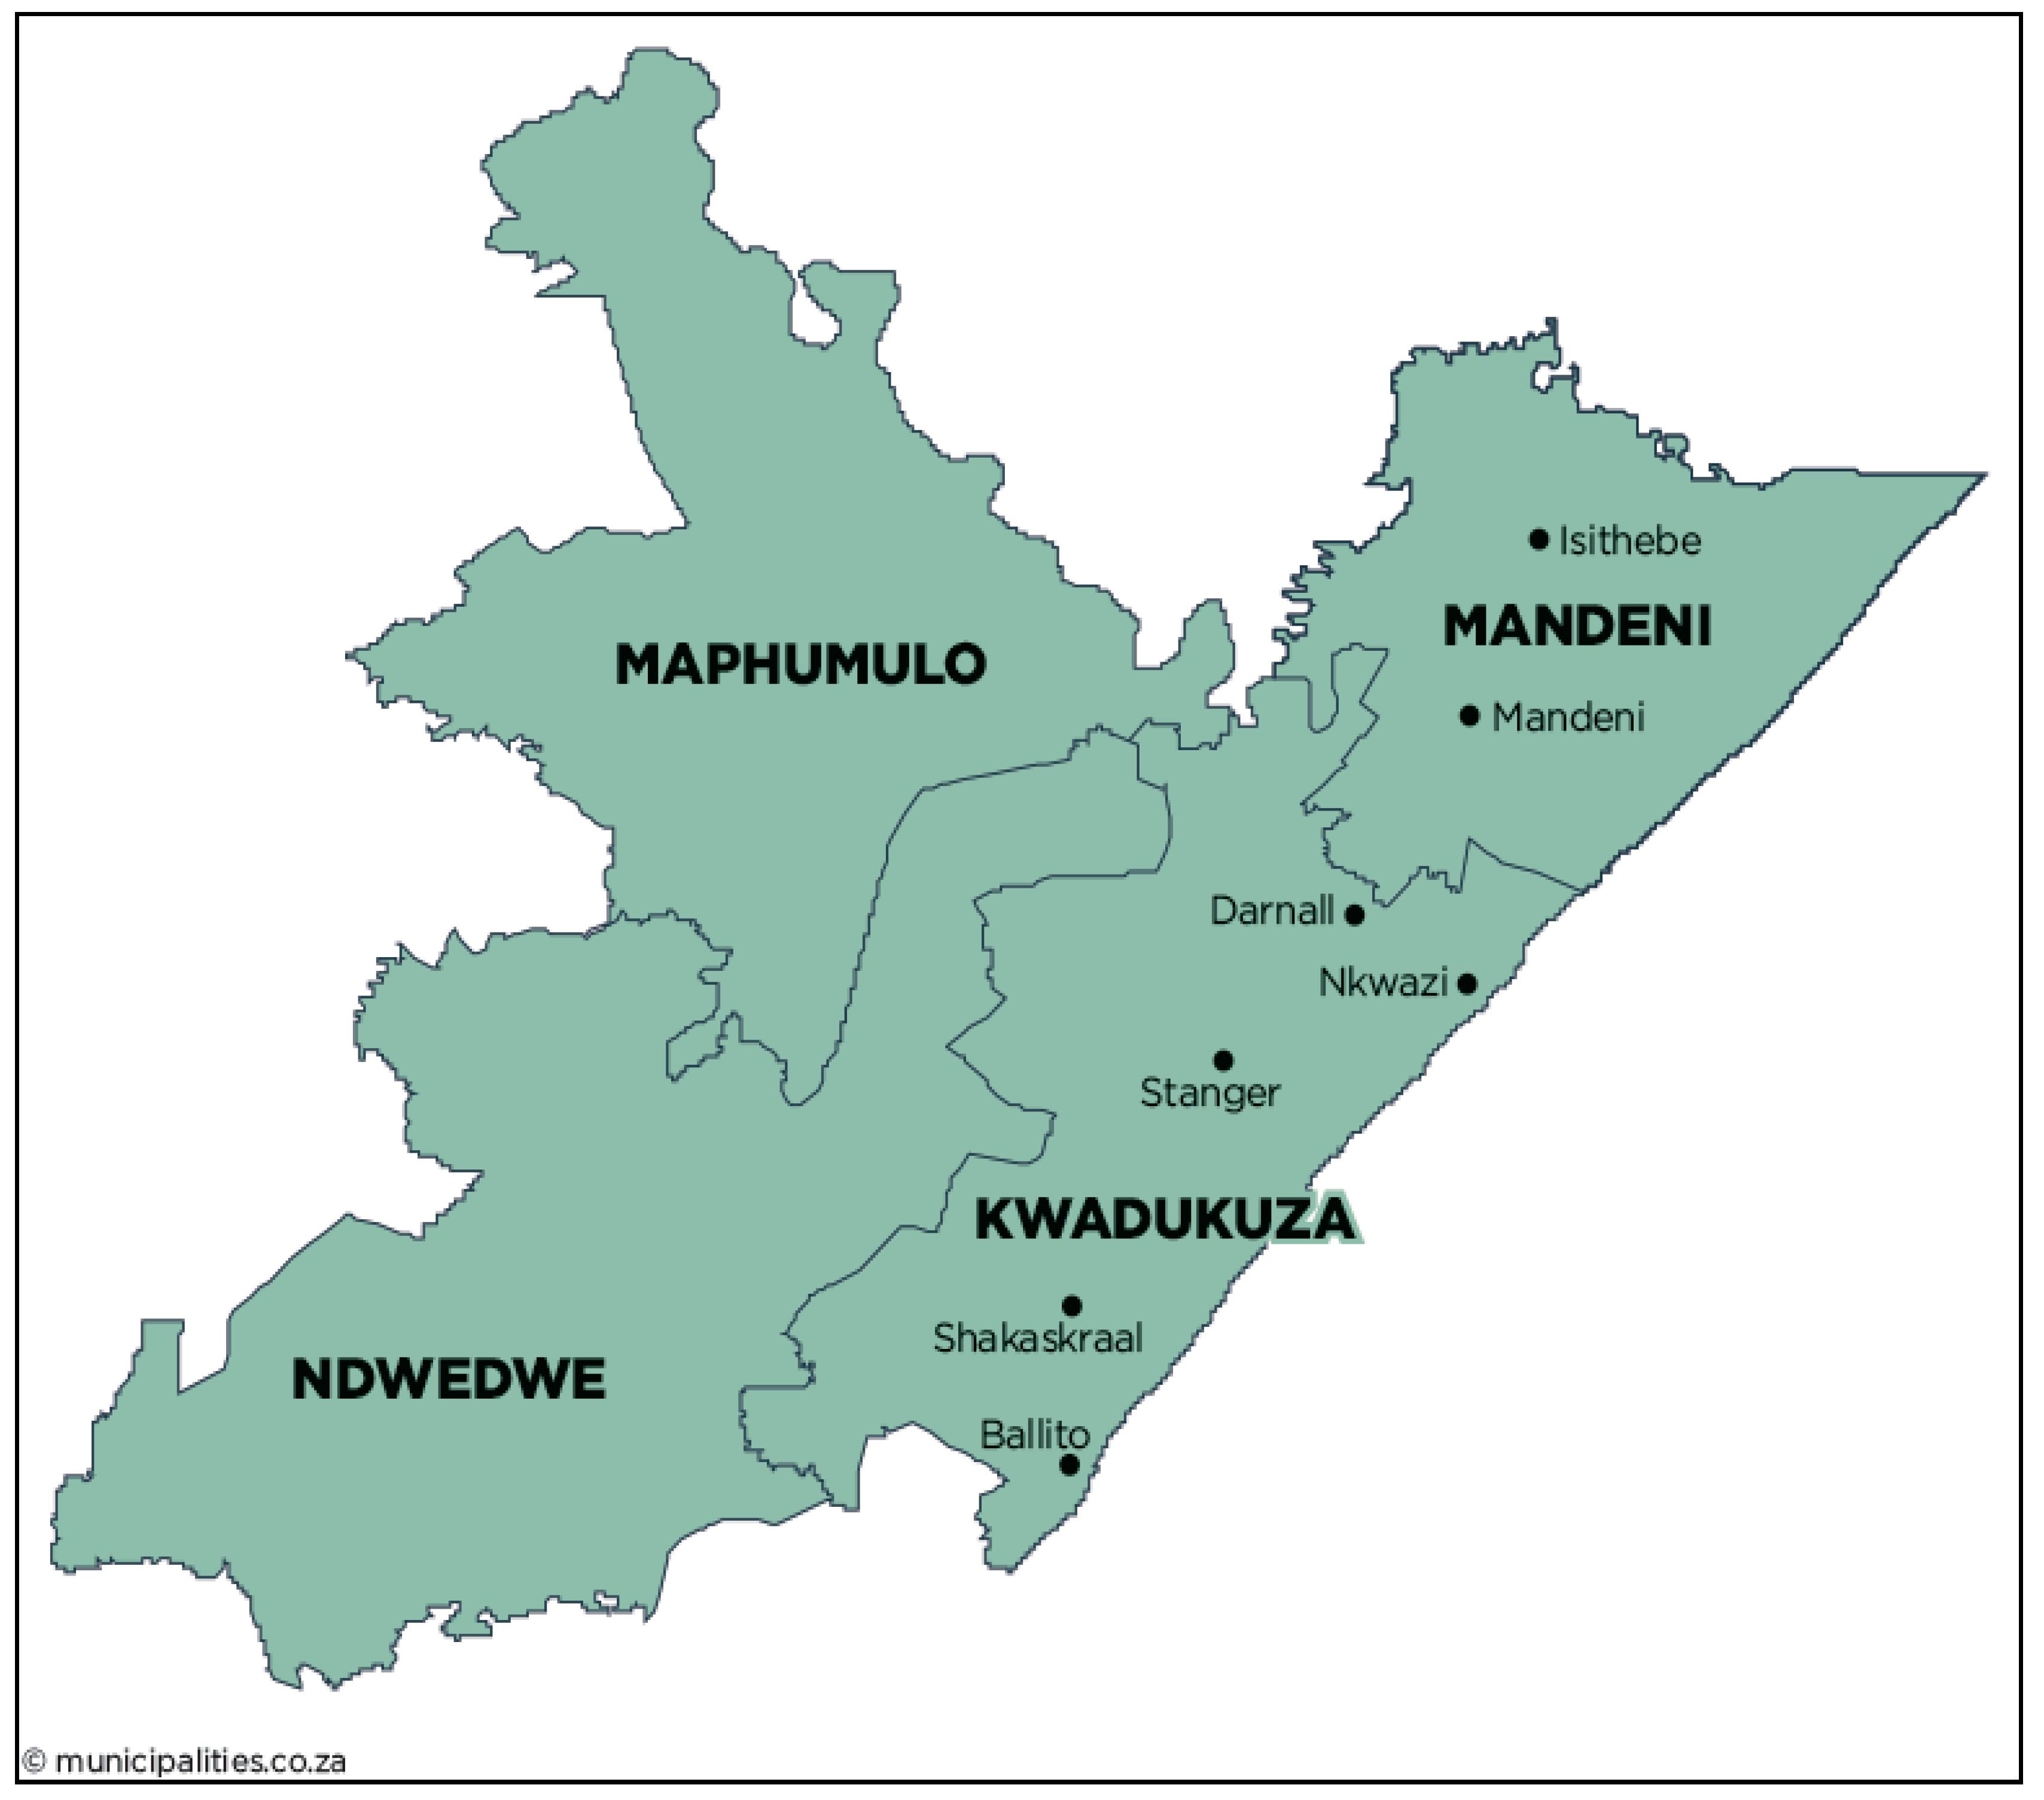
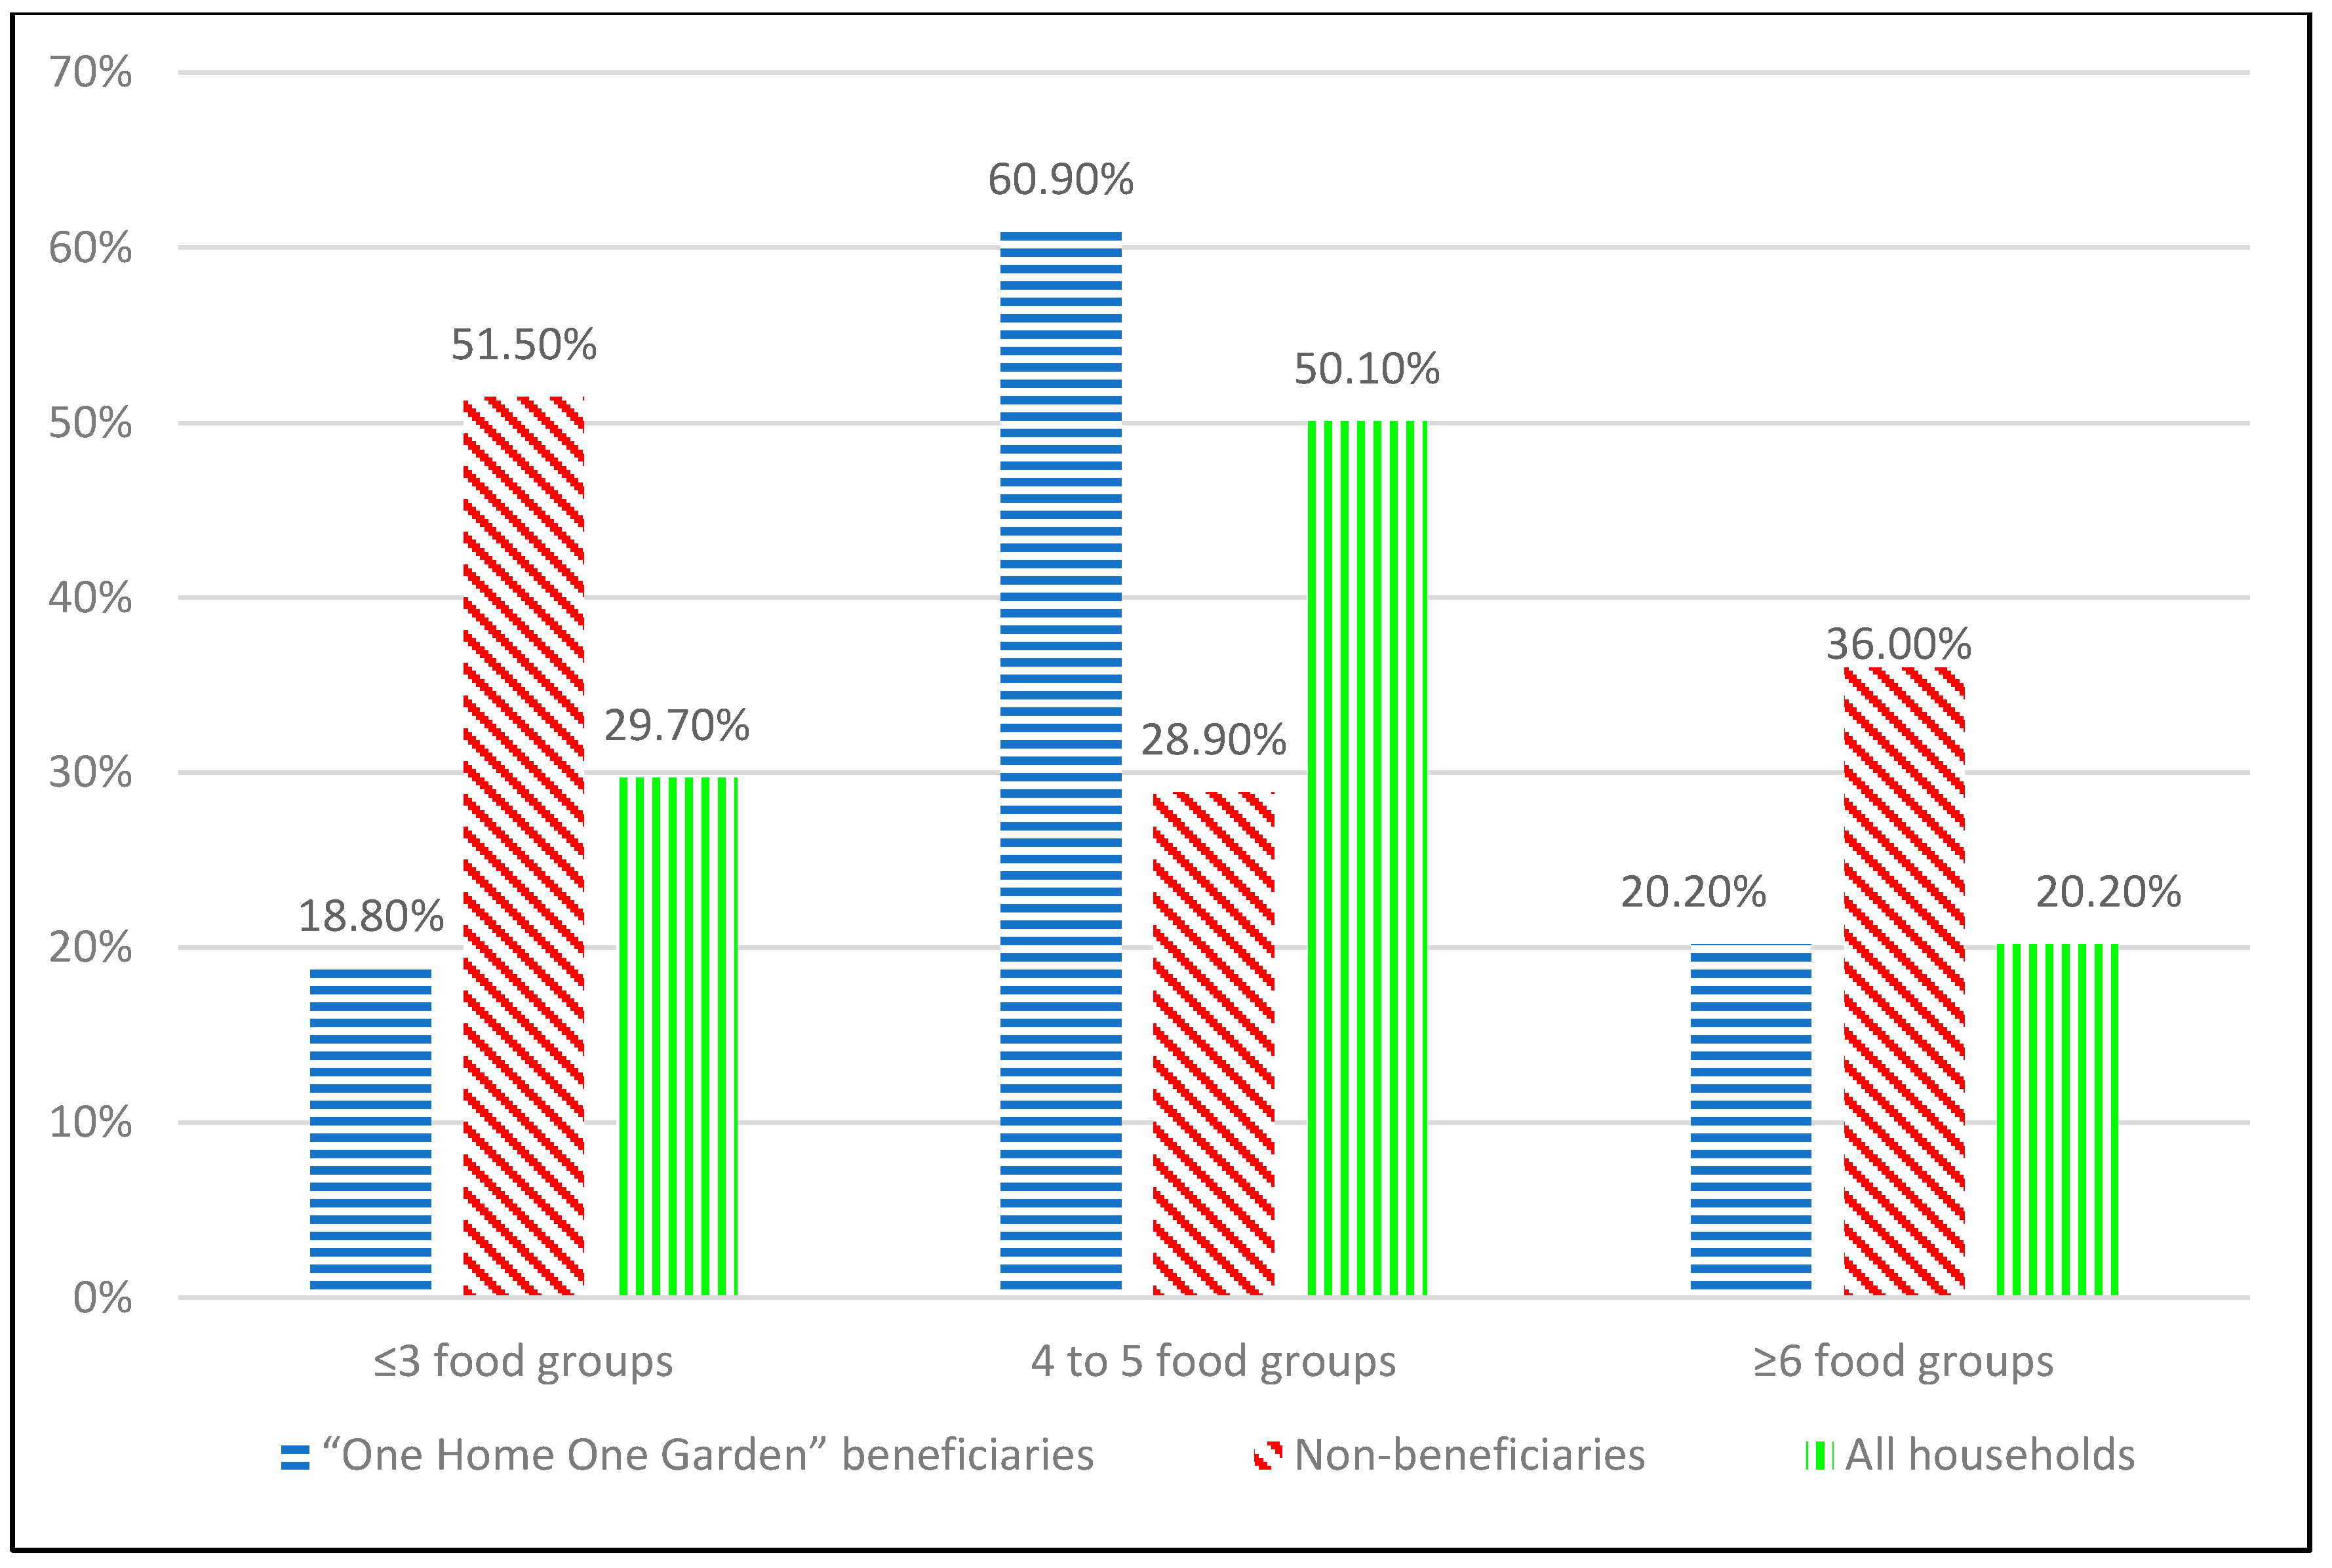
Table 1.
Explanatory variables used in the binary logistic regression modelling on factors determining the households’ food security status and their expected outcomes.
Table 1.
Explanatory variables used in the binary logistic regression modelling on factors determining the households’ food security status and their expected outcomes.
| Variable | Description | Expected Outcome (+/−) |
|---|---|---|
| Age (years) | Respondent’s age in years (continuous) | − |
| Household size | Number of household members (continuous) | +/− |
| Household income (US$) | Total household income (continuous) | + |
| Farm size | Actual farm size in hectares (continuous) | + |
| Gender | Respondent’s sex; 1 = male, 0 = female (categorical-dummy) | +/− |
| Marital status | Marital status of respondent; 1 = married, 0 = single (categorical-dummy) | + |
| Education status | Whether respondent had received any formal education; 1 = yes, 0 = no (categorical-dummy) | + |
| Employment status | Employment status of respondent; 1 = employed, 0 = unemployed (categorical-dummy) | +/− |
| Access to credit | Whether the household has access to credit or not; 1 = yes, 0 = no (categorical-dummy) | + |
| Practice livestock farming | Whether household practices livestock farming or not; 1 = yes, 0 = no (categorical-dummy) | + |
| Receiving infrastructural support (irrigation) | Whether household receives irrigation support or not; 1 = yes, 0 = no (categorical-dummy) | + |
| Participation in the “One Home One Garden” programme | Whether a household participated in the “One Home One Garden” programme or not; 1 = yes, 0 = no (categorical-dummy) | + |
United States Dollar (US$). Source: Authors (2018).
Table 2.
Summary of socioeconomic characteristics of respondents (n = 495).
| “One Home One Garden” Beneficiaries (n = 330) | Non-Beneficiaries (n = 165) | All Households (n = 495) | ||||||||||
|---|---|---|---|---|---|---|---|---|---|---|---|---|
| Variable | Mean | Min | Max | SD | Mean | Min | Max | SD | Mean | Min | Max | SD |
| Age (years) | 52.22 | 19 | 86 | 15.63 | 54.86 | 22 | 81 | 12.09 | 53.11 | 19 | 86 | 14.58 |
| Household size | 12.42 | 3 | 25 | 4.41 | 11.09 | 3 | 20 | 4.49 | 11.98 | 3 | 25 | 4.481 |
| Household income (US$) | 165.23 | 36.58 | 512.07 | 126.79 | 190.97 | 36.58 | 512.07 | 115.04 | 173.80 | 36.57 | 512.07 | 123.48 |
| Farm size (hectares) | 6.08 | 2 | 16 | 3.27 | 6.21 | 1 | 34 | 4.33 | 6.12 | 1 | 34 | 3.66 |
| Variable | Percentage (%) | Percentage (%) | Percentage (%) | |||||||||
| Gender_Female | 89.39 | 87.27 | 88.5 | |||||||||
| Male | 10.61 | 12.73 | 11.5 | |||||||||
| Marital status_Single | 49.09 | 46.66 | 49.7 | |||||||||
| Married | 50.91 | 53.34 | 50.3 | |||||||||
| Education status_No formal education | 4.86 | 12.73 | 7.5 | |||||||||
| Formal education | 95.14 | 87.27 | 92.5 | |||||||||
| Employment status_Unemployed | 100.0 | 95.75 | 98.58 | |||||||||
| Employed | - | 4.24 | 1.42 | |||||||||
| Access to credit_No | 93.03 | 100 | 95.35 | |||||||||
| Yes | 6.97 | - | 4.65 | |||||||||
| Practice livestock farming_No | 44.24 | 38 | 43.4 | |||||||||
| Yes | 55.75 | 61.81 | 56.6 | |||||||||
| Receiving infrastructural support (irrigation)_No | 66.36 | 100 | 77.6 | |||||||||
| Yes | 33.64 | - | 22.4 | |||||||||
| Participation in the “One Home One Garden” programme_No | - | 100 | 33.33 | |||||||||
| Yes | 100 | - | 66.67 | |||||||||
Min—Minimum; Max—Maximum; SD—Standard Deviation. Source: Survey data (2015).
Table 3.
Primary source of food procurement for households (n = 495).
| Primary Source of Obtaining Food | “One Home One Garden” Beneficiaries (n = 330) | Non-Beneficiaries (n = 165) | All Households (n = 495) |
|---|---|---|---|
| Percentage (%) | Percentage (%) | Percentage (%) | |
| Own agricultural production including gathering, hunting, and fishing | 16.96 | 5.45 | 13.13 |
| Market purchase | 6.36 | 3.63 | 5.45 |
| Own agricultural production and market purchase | 30 | 10.90 | 23.64 |
| Own agricultural production, market purchase, and borrowing | 3.64 | 6.06 | 4.44 |
| Government social grants | 43.04 | 73.93 | 53.33 |
| Total | 100 | 100 | 100 |
Source: Survey data (2015).
Table 4.
Type of food consumed by household members (n = 495).
| Food Type | “One Home One Garden” Beneficiaries (n = 330) | Non-Beneficiaries (n = 165) | All Households (n = 495) |
|---|---|---|---|
| Percentage (%) | Percentage (%) | Percentage (%) | |
| Maize meal | 82.3 | 92.5 | 85.7 |
| Beans | 71.5 | 89.6 | 77.5 |
| Onion | 23.1 | 7.5 | 17.90 |
| Red meat | 35.2 | 25.7 | 32.03 |
| Poultry meat | 41.0 | 39.9 | 40.63 |
| Fish | 16.9 | 8.11 | 13,97 |
| Rice | 69.5 | 59.03 | 66.01 |
| Cabbage | 38.9 | 2.9 | 26.90 |
| Fruits | 19.0 | 3.5 | 13.83 |
| Eggs | 44.2 | 38.7 | 42.37 |
| Spinach | 11.1 | 2.12 | 8,11 |
| Potatoes | 62.7 | 52.1 | 59.17 |
| Sweet potatoes | 9.4 | 11.0 | 9.93 |
| Amadumbes | 13.2 | 21.9 | 16.10 |
| Milk | 60.8 | 44.5 | 55.37 |
| Butternut | 3.5 | 4.15 | 3.72 |
| Carrots | 2.9 | 2.19 | 2.66 |
| Fats oils | 61.9 | 51.10 | 58.30 |
| Sugar | 60.1 | 50.00 | 56.73 |
| Average HDDS | 4.89 | 4.22 | 4.67 |
Source: Survey Data (2015).
Table 5.
Household Food Consumption Scores (n = 495).
| Household Food Consumption SCORE (HFCS) Category | “One Home One Garden” Beneficiaries (n = 330) | Non-Beneficiaries (n = 165) | All Households (n = 495) |
|---|---|---|---|
| Percentage (%) | Percentage (%) | Percentage (%) | |
| 0 < 21 (poor) | 1.5 | 10.90 | 4.64 |
| 21.5 < 35 (borderline) | 33.3 | 53.93 | 40.21 |
| ≥35 (acceptable) | 65.2 | 35.15 | 55.15 |
| Total | 100 | 100 | 100 |
Source: Survey Data (2015).
Table 6.
Bivariate correlations between household food security status (HDDS) and the explanatory variables.
Table 6.
Bivariate correlations between household food security status (HDDS) and the explanatory variables.
| Variable | “One Home One Garden” Beneficiaries (n = 330) | Non-Beneficiaries (n = 165) | All Households (n = 495) | |||
|---|---|---|---|---|---|---|
| Pearson Correlation (r) | Sig. (Two-Tailed) | Pearson Correlation (r) | Sig. (Two-Tailed) | Pearson Correlation (r) | Sig. (Two-Tailed) | |
| Age (years) | −0.050 | 0.368 | −0.089 | 0.256 | −0.028 | 0.529 |
| Household size | −0.111 ** | 0.044 | −0.090 | 0.250 | −0.142 *** | 0.002 |
| Household income (US$) | −0.266 *** | 0.000 | −0.109 | 0.165 | −0.157 *** | 0.000 |
| Farm size | 0.028 | 0.616 | 0.038 | 0.628 | 0.037 | 0.411 |
| Gender | −0.078 | 0.156 | −0.043 | 0.583 | −0.050 | 0.263 |
| Marital status | 0.060 | 0.280 | −0.027 | 0.727 | 0.046 | 0.305 |
| Education status | −0.164 *** | 0.003 | −0.030 | 0.704 | −0.136 *** | 0.002 |
| Employment status | .c | - | −0.024 | 0.763 | −0.330 *** | 0.000 |
| Access to credit | 0.285 *** | 0.000 | −0.075 | 0.338 | 0.176 *** | 0.000 |
| Practice livestock farming | 0.019 | 0.729 | −0.075 | 0.338 | −0.012 | 0.782 |
| Receiving infrastructural support (irrigation) | −0.250 *** | 0.000 | .c | - | −0.286 *** | 0.000 |
| Participation in the “One Home One Garden” programme | .c | - | .c | - | −0.337 *** | 0.000 |
***; ** denote that the correlation is significant at the 0.01 and 0.05 levels (two-tailed); c could not be computed because at least one of the variables is constant. Source: Survey data (2015) computed from SPSS software (version 25). Sig.—significance level.
Table 7.
Determinants of the household food security status (HDDS) of households in Maphumulo (n = 495).
Table 7.
Determinants of the household food security status (HDDS) of households in Maphumulo (n = 495).
| Variable | B | S.E. | Wald | df | Sig. | Exp(B) | 95% C.I. for EXP(B) | |
|---|---|---|---|---|---|---|---|---|
| Lower | Upper | |||||||
| Constant | −1.743 | 0.639 | 7.454 | 1 | 0.006 | 0.175 | ||
| Household size | −0.039 | 0.027 | 2.147 | 1 | 0.143 | 0.962 | 0.913 | 1.013 |
| Household income (US$) | −0.004 | 0.001 | 15.233 | 1 | 0.000 | 0.996 *** | 0.993 | 0.998 |
| Education | 0.817 | 0.389 | 4.409 | 1 | 0.036 | 2.264 ** | 1.056 | 4.856 |
| Access to credit | −0.733 | 0.232 | 10.015 | 1 | 0.002 | 0.481 *** | 0.305 | 0.757 |
| Receiving infrastructural support (irrigation) | 1.886 | 0.543 | 12.083 | 1 | 0.001 | 6.591 *** | 2.277 | 19.102 |
| Participation in the “One Home One Garden” programme | 1.259 | 0.247 | 26.032 | 1 | 0.000 | 3.522 *** | 2.172 | 5.713 |
| 2 Log likelihood | 466.877 a | |||||||
| Cox and Snell R Square | 0.204 | |||||||
| Nagelkerke R Square | 0.296 | |||||||
| LR Chi2(8) | 15.824 (p = 0.045) | |||||||
| Overall correct prediction | 73.5 | |||||||
Asterisks denote significant at the 1% ***; 5% **, and 10% * levels. Source: Survey data (2015) computed from SPSS software (version 25). a: Estimation terminated at iteration number 6 because parameter estimates changed by less than 0.001. B—Beta coefficient, S.E.—Standard error around the coefficient , df—degrees of freedom for the Wald chi-square test, Exp(B)—exponentiation of the B coefficient and C.I.—confidence interval.
© 2018 by the authors. Licensee MDPI, Basel, Switzerland. This article is an open access article distributed under the terms and conditions of the Creative Commons Attribution (CC BY) license (http://creativecommons.org/licenses/by/4.0/).
Share and Cite
MDPI and ACS Style
Ngema, P.Z.; Sibanda, M.; Musemwa, L. Household Food Security Status and Its Determinants in Maphumulo Local Municipality, South Africa. Sustainability 2018, 10, 3307. https://doi.org/10.3390/su10093307
AMA Style
Ngema PZ, Sibanda M, Musemwa L. Household Food Security Status and Its Determinants in Maphumulo Local Municipality, South Africa. Sustainability. 2018; 10(9):3307. https://doi.org/10.3390/su10093307
Chicago/Turabian StyleNgema, Primrose Zama, Melusi Sibanda, and Lovemore Musemwa. 2018. "Household Food Security Status and Its Determinants in Maphumulo Local Municipality, South Africa" Sustainability 10, no. 9: 3307. https://doi.org/10.3390/su10093307
Note that from the first issue of 2016, this journal uses article numbers instead of page numbers. See further details here.