PV Waste Management at the Crossroads of Circular Economy and Energy Transition: The Case of South Korea


1
Corporate Course for Climate Change, Sejong University, Seoul 05006, Korea
2
Asian Institute for Energy, Environment & Sustainability, Seoul National University, Seoul 08826, Korea
*
Author to whom correspondence should be addressed.
Sustainability 2018, 10(10), 3565; https://doi.org/10.3390/su10103565
Submission received: 30 July 2018
/
Revised: 9 September 2018
/
Accepted: 30 September 2018
/
Published: 5 October 2018
(This article belongs to the Special Issue Circular Economy—Sustainable Energy and Waste Policies)
Abstract
:The South Korean government’s renewable energy deployment plan aims to increase the share of electricity generated from renewables to 20% by 2030. To reach this goal, the rate of photovoltaic (PV) installation will accelerate in the coming years. This energy transition creates a new challenge: PV wastes. This study estimates the amount of PV waste generated, the material composition of PV waste, and the amount of recyclable metals in South Korea by 2080 under four different scenarios (combining shape parameters of 5.3759 [regular-loss] and 3.5 [early-loss] with PV module lifespans of 25 and 30 years) using the Weibull distribution function. The annual waste generated will fluctuate over time depending on the scenario, but between 4299 and 5764 thousand tons of PV waste will have been generated by 2080. Under the early-loss/25-year lifespan scenario, annual PV waste generation will increase to exceed 130,000 tons in 2045, then decrease through 2063 before increasing once again. The fluctuation in annual PV waste generation appears stronger under regular-loss scenarios. An appropriate system for the monitoring, collection, and storage of PV waste needs to be arranged even before the volume becomes high enough for recycling to be economically viable. International cooperation could be a way to maintain the PV waste stream at an economically feasible scale. It would also be a good idea if the PV module could be designed in a way that would enable easier recycling or reuse.
1. Introduction
Solar photovoltaic (PV) is in the spotlight of the global energy industry. At the end of 2017, total global solar PV capacity was estimated to be about 402 GW, after 98 GW was added during that year. This annual increase reflects the rapid growth of solar PV capacity: in 2016, 76 GW was installed [1]. A recent report by the International Energy Agency (IEA) shows that solar PV is the only power technology that has experienced uninterrupted investment growth during the past three years (2015–2017) [2]. Solar PV growth will be sustained at least for a while. In order to limit global warming to an increase of only 2 degrees Celsius from pre-industrial era levels, the IEA estimated that solar PV capacity should grow about 15 percent every year from 2014 to 2030 [3].
This global trend for solar PV is evident in South Korea. The South Korean government aims to increase the share of electricity generated from renewables to 20% by 2030. To achieve this ambitious target, the government plans to deploy 63.8 GW of renewable energy by 2030; solar PV would account for 57% of the total capacity added [4].
Solar PV is often promoted based on the perception that it is an environmentally friendly technology. However, the nearly exponential growth of PV capacity means there will also be rapid growth in the amount of waste generated from aging and defective solar PV facilities. The European Union (EU), recognizing the environmental impact of solar PV waste, has directed producer responsibility for the appropriate disposal and recycling of PV modules [5]. To help appropriately manage PV waste, the EU Member States are asked to estimate and submit their PV module waste generation using a common tool that was developed by the European Commission (EC). Germany became one of the first countries to implement the EU Waste Electrical and Electronic Equipment (WEEE) Directive by adding the regulation of PV waste to its electrical and electronic equipment law (“Elektro- und Elektronikgerätegesetz” or “ElektroG”) in 2015.
In South Korea, however, PV waste is classified as industrial waste, which needs to be handled in a way that relieves environmental and health impacts. The status of PV module operation is not currently monitored, however, nor was the generation of waste from past PV installation calculated. Because the installation of PV will be augmented and accelerated under the government plan, a tangible projection of Korea’s PV waste generation will encourage citizens and policymakers to introduce measures and legal instruments to address the anticipated socio-environmental issues.
This study investigates the PV waste generated from solar PV deployment in South Korea and suggests policy implications for a South Korean PV waste management system. The quantitative estimates will shed light on the policy debate about how to minimize the harmful effects of ambitious PV capacity expansion and maximize the benefits of the country’s renewable energy promotion policy.
To attain this research goal, this study unfolds as follows. Section 2 introduces the background of this study: international and domestic (South Korean) solar PV deployment and the potential adverse effects of solar PV expansion. In Section 3, the authors select a methodology for estimating PV waste generation and specify the scope of the analysis after reviewing previous studies. Section 4 describes the methodology used, including the parameters and assumptions. Section 5 presents the results and provides implications. Section 6 discusses the findings and the limitations of this study.
2. The Solar Boom and PV Waste Management
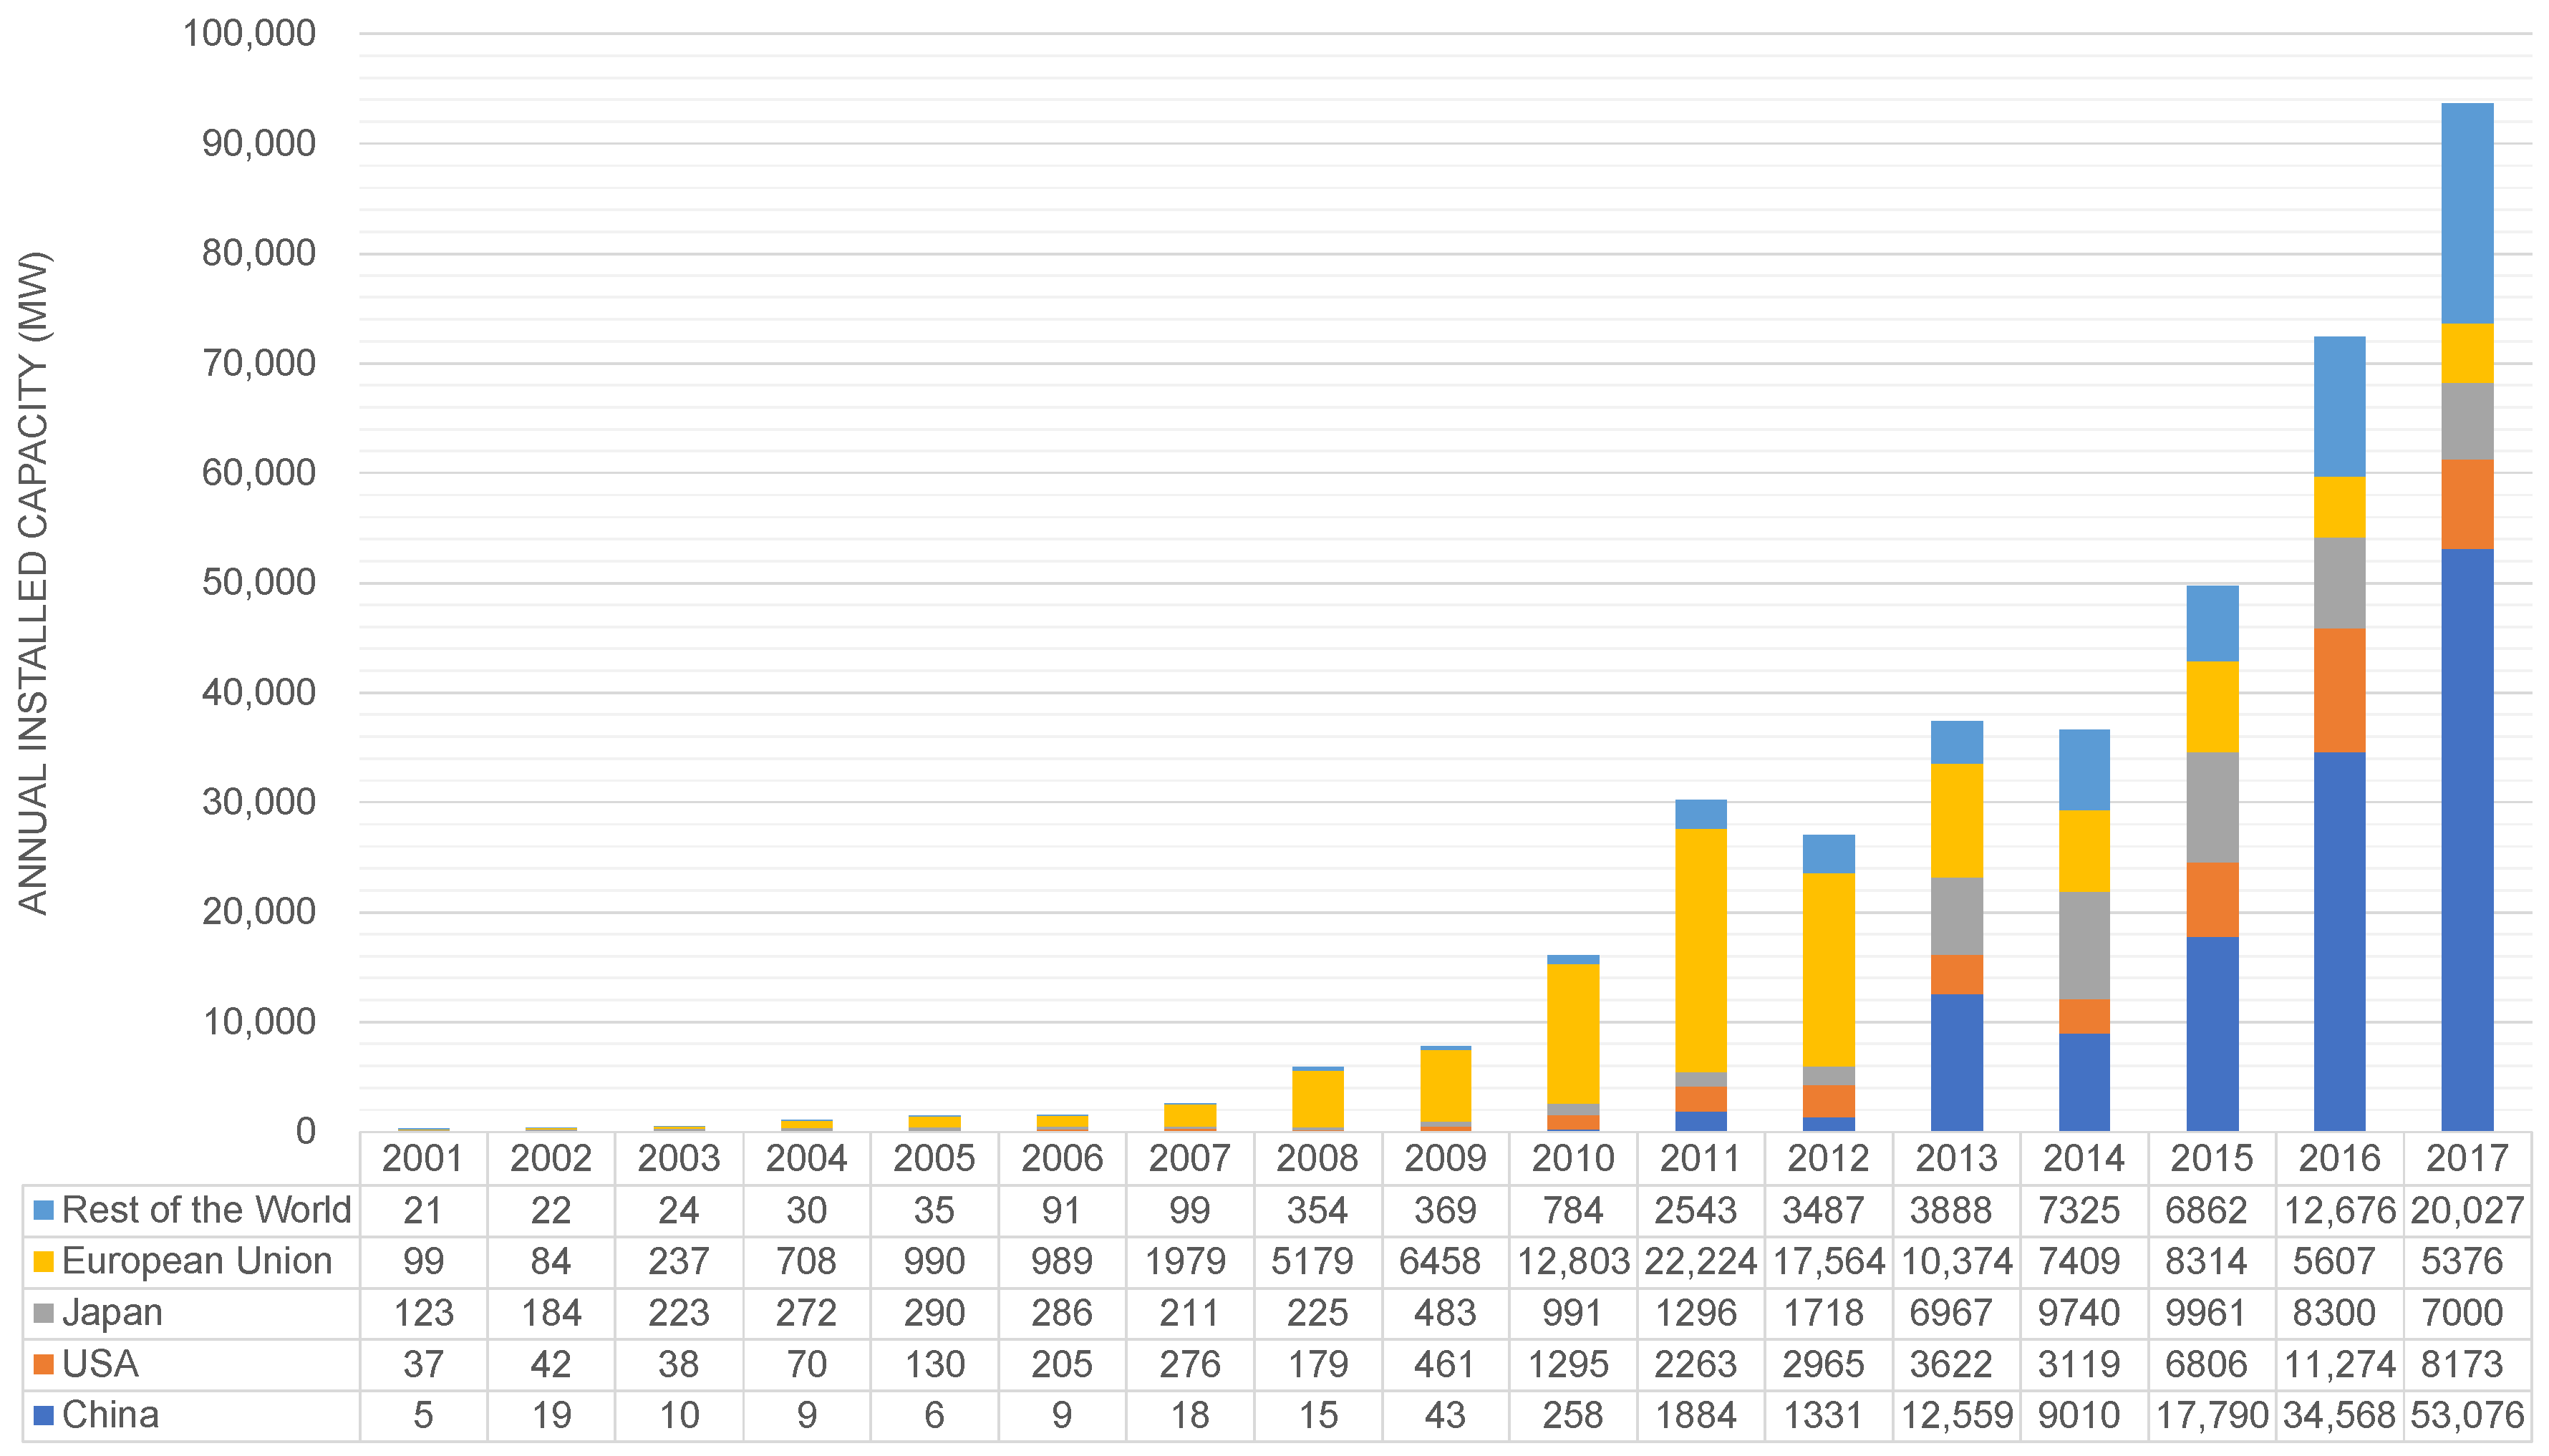
The international solar PV market is experiencing rapid growth (See Figure 1). Up until 2015, most of the growth was in OECD countries; recently, however, China has become a major contributor. In 2017, China accounted for more than half of the global growth (53 of 98 GW) in installed capacity. Thanks to annual installations, the cumulative installed capacity is almost exponential. At the end of 2017, global total PV capacity was 402.5 GW.
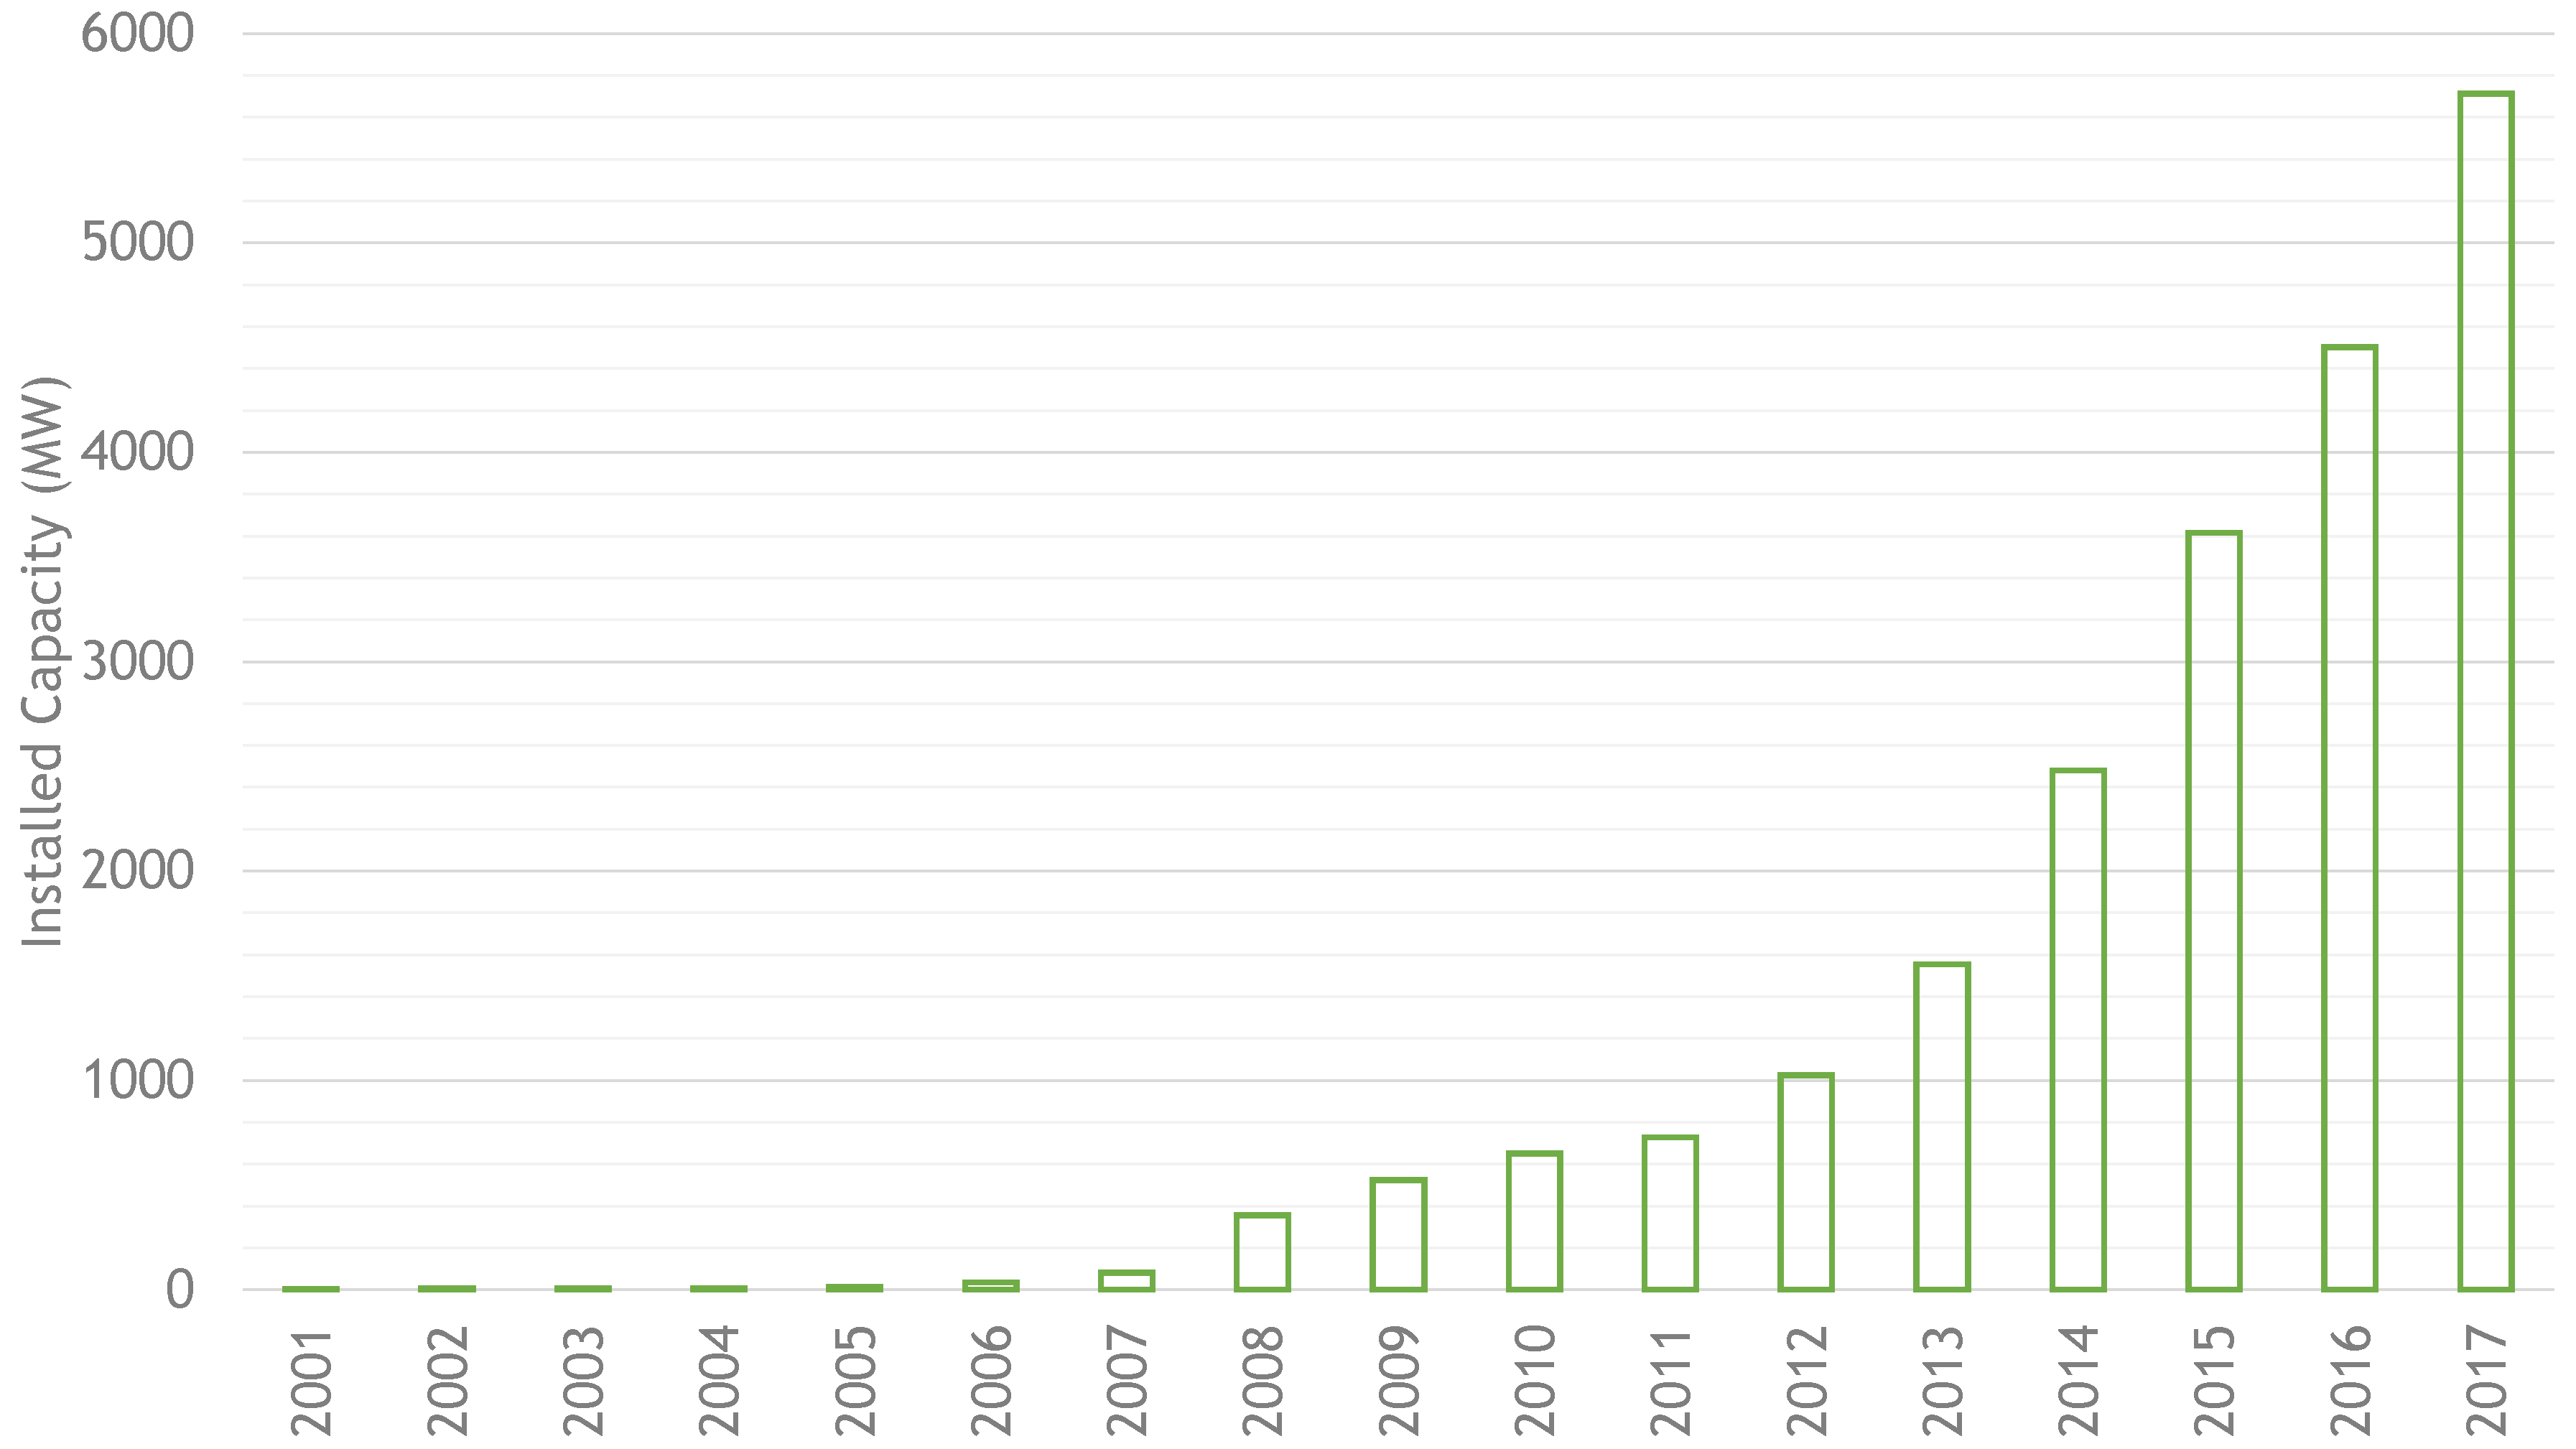
In South Korea, the first solar PV was installed on the rooftop of a school in 1980. Solar PV increased rapidly after the implementation of the Feed-in-Tariff in 2002, which was replaced with the Renewable Portfolio Standard policy in 2012. However, total PV capacity (5.7 GW as of 2017) (See Figure 2) accounts for a very small fraction of total power capacity (120.8 GW as of 2017). In addition, the electricity generated from solar PV was 5.1 TWh in 2016, which accounted for only 0.9% of the total electricity generated that year [7].
In South Korea, solar PV is on the brink of a rapid expansion. The South Korean government aims to increase the share of electricity generated from renewables to 20% by 2030. To achieve this ambitious target, the government plans to deploy 63.8 GW of renewable energy by 2030; solar PV would account for 57% of the total capacity added (See Table 1) [4]. Solar PV installed capacity would increase from 5.7 GW (or 5.3% of total capacity) in 2017 to 36.5 GW (or 29.7% of total capacity) in 2030 by growing at a 15.4% annual rate during that time [4,11]. In other words, the Korean government’s policy would boost the solar PV industry to a more than six-fold growth in capacity over just 13 years.
However, the recycling industry is in a nascent phase with respect to PV. Currently, only the European Union is requiring PV plants to recycle their PV waste. In the EU, producer responsibility for appropriate collection, reuse, or recycling and disposal of PV modules is mandated by the 2012 Waste Electrical and Electronic Equipment (WEEE) Directive (Directive 2012/19/EU) [5]. The WEEE Directive sets minimum recovery targets according to category; the targets become stronger over time. For example, at least 75 percent of the PV must be recovered between 13 August 2012 and 14 August 2015; this increases to 80 percent of the PV from 15 August 2015 to 14 August 2018 and 85 percent of the PV after 15 August 2018. Regarding recycling and reuse, the targets are strengthened stepwise over timeframe, but the targets are lower than the minimum targets for recovery. Because Germany has the longest history of PV installation (See Figure 3), it is responsible for the largest share of PV waste generated in Europe. PV Cycle is a global nonprofit organization of PV waste recycling companies with members spanning Europe, the United States, and Japan. PV Cycle’s latest annual report states that more than half of their material recovery comes from German PV waste [12]. While commercial recycling of PV waste is active in Europe, in the United States only a few states mandate recycling future PV waste [13].
Unlike the EU, South Korea has just initiated the discussion about PV waste. PV waste is included as one of industrial wastes in Annex Table 4 of Article 4.2 of South Korea’s Enforcement Rule of Wastes Control Act (Act No. 14783), Article 4.2 delineates detailed classifications of waste and possible recyclables. Article 4.2 was added after this rule was revised on 21 July 2016. According to the Article 17 of the Waste Control Act, industrial waste dischargers are asked to treat the waste properly and to reduce waste by installing waste-reducing facilities, developing technologies, and recycling wastes. In 2017, the Ministry of Trade, Industry, and Energy decided to build a facility to recycle PV module waste in North Chungcheong Province, South Korea [15].
3. Literature Review
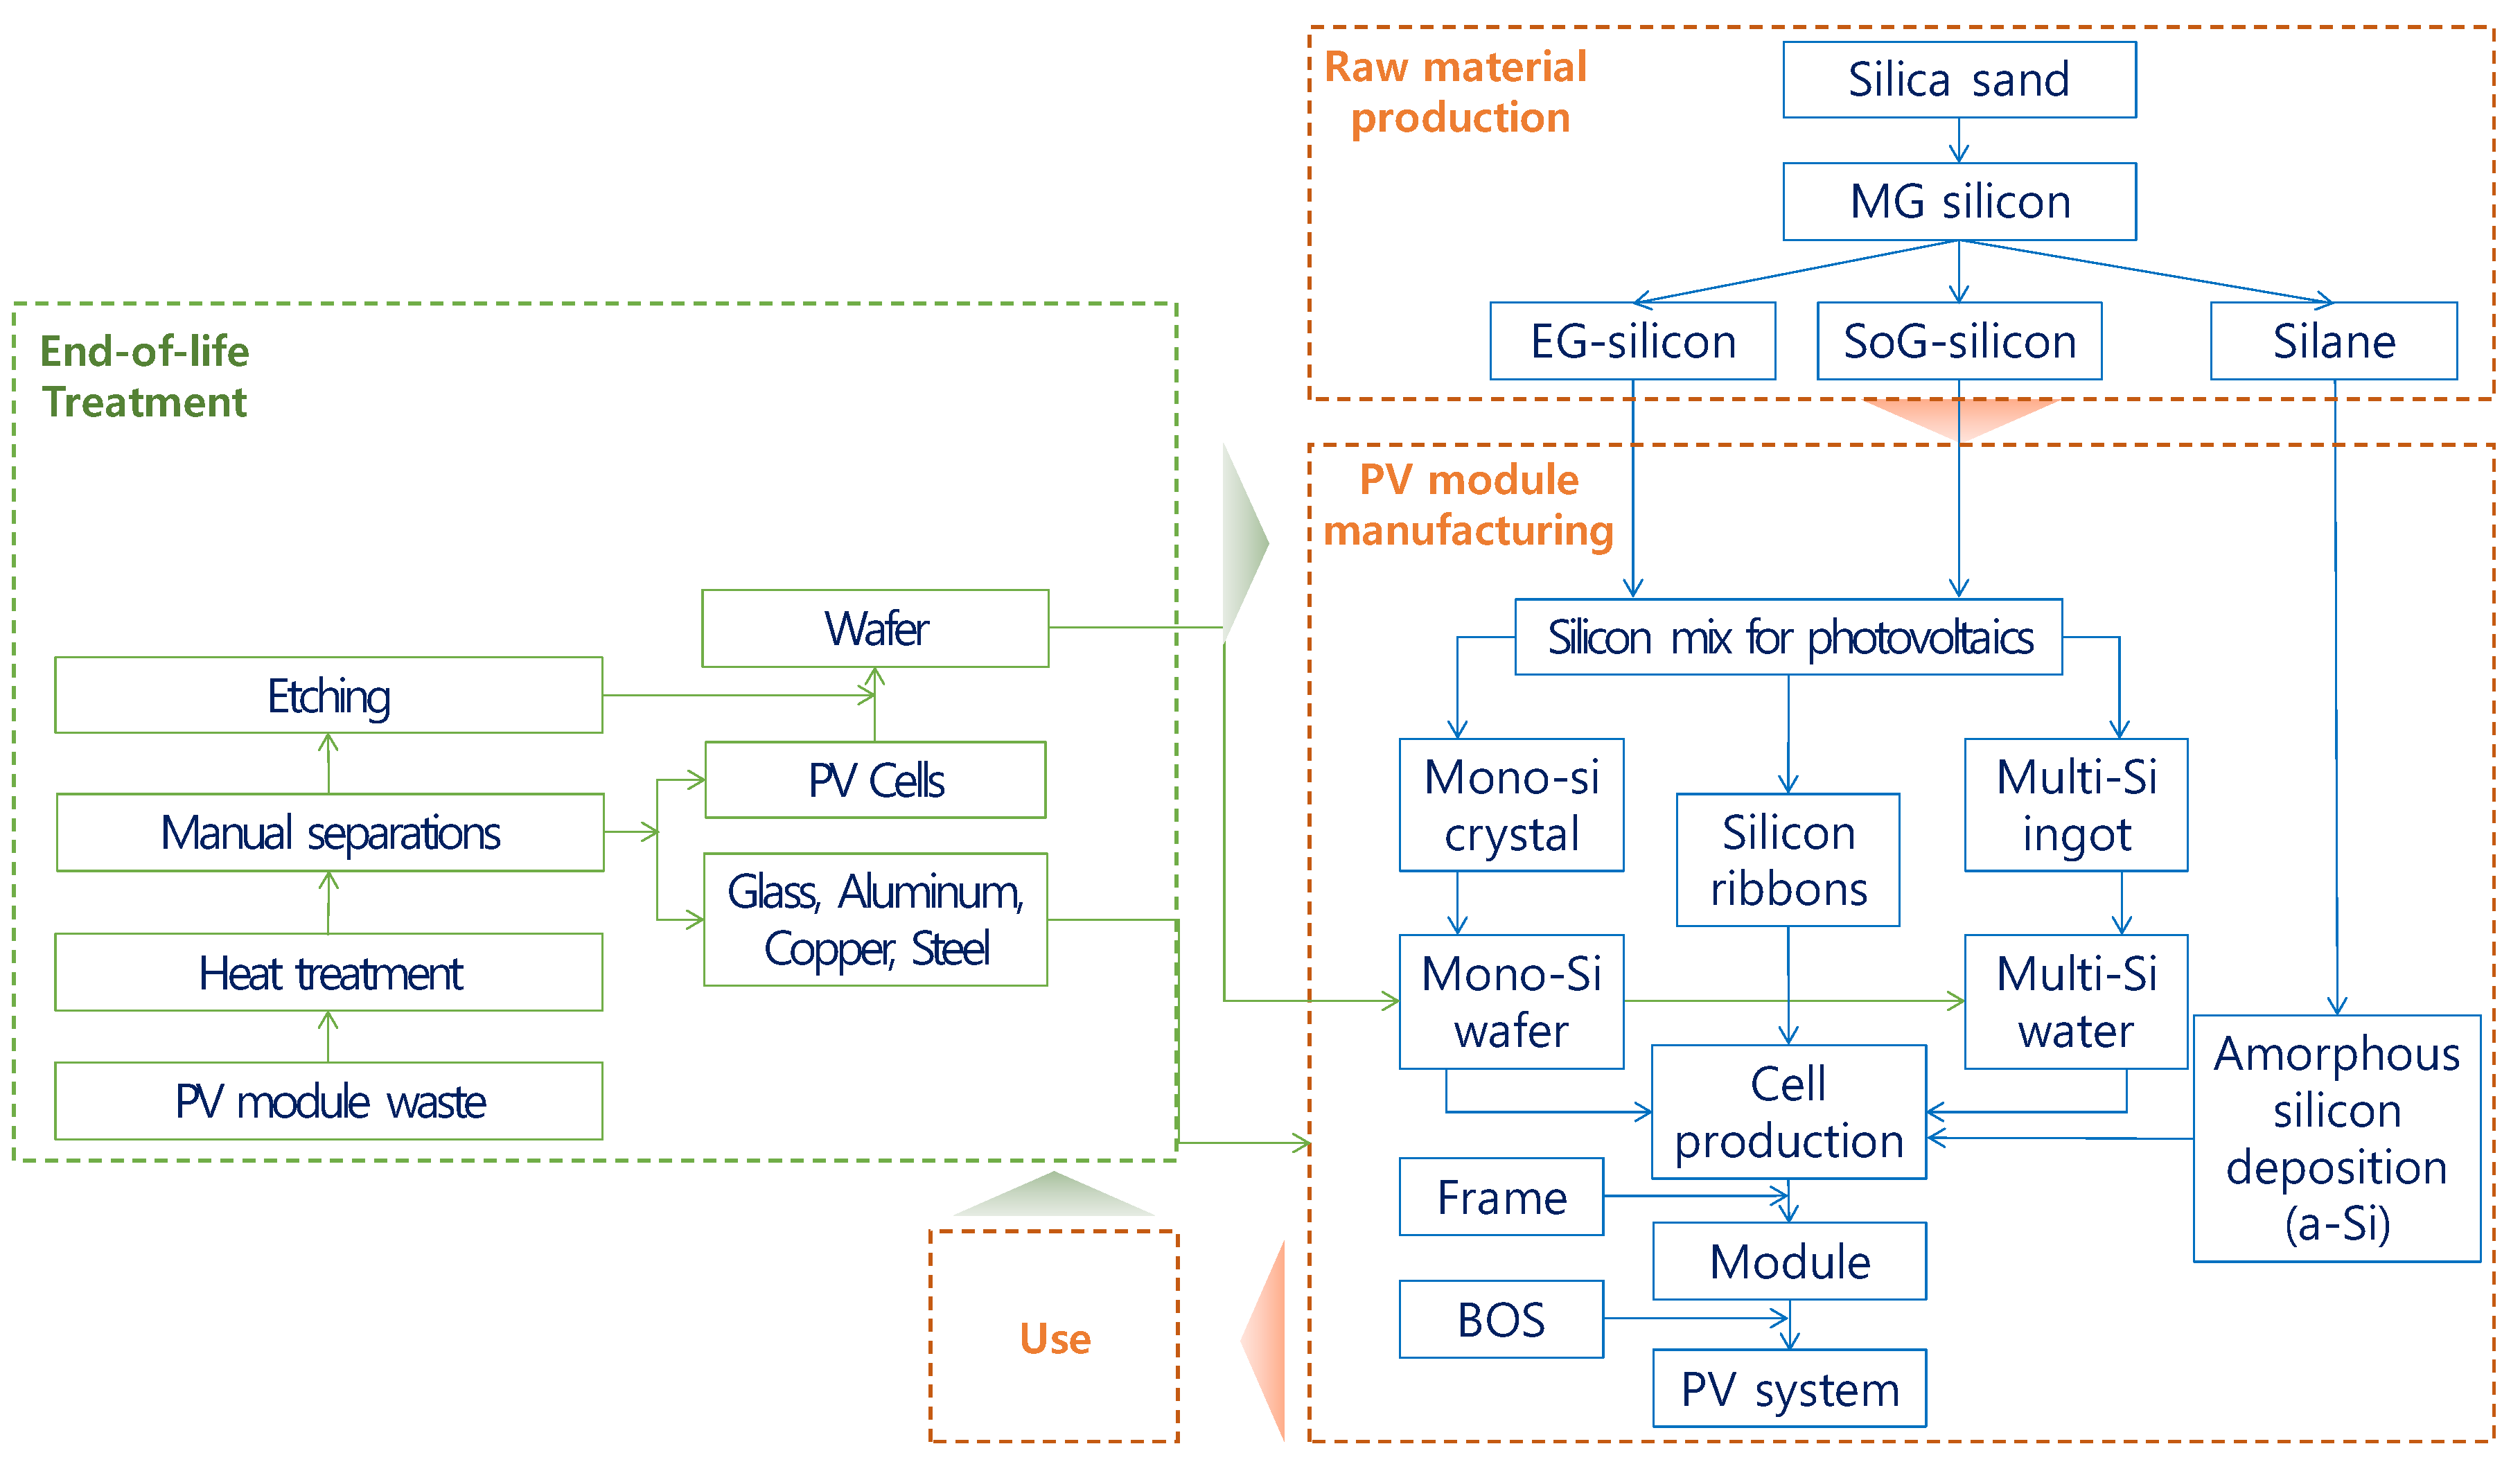
PV waste is a comprehensive term, which needs to be clarified to avoid confusion. The life cycle of PV passes through four major stages: raw material production, PV module manufacturing, end-use, and end-of-life treatment. In an open-loop model, waste is generated at every stage and discharged into the environment. In contrast, some waste can be used as inputs for raw material production or PV module manufacturing in a closed-loop model [16]. Currently, PV waste issues are focused more on the waste generated at the end-of-life stage. For example, Xu et al. [17] reviewed end-of-life solar panel waste recycling technologies and management.
The components of a photovoltaic system can be usefully divided into the PV modules and the balance of system (BOS). PV modules or solar panels are layers of glass, ethylene vinyl acetate (EVA), metals (such as silver or aluminum), and PV cells, etc. [16]. The BOS includes all the other components, including inverter, transformer, mounting structure, cables, tracking systems, and batteries [18]. Most studies investigating PV wastes have excluded the BOS wastes, focusing only on the wastes from the PV module or panel [17,19,20] even though the BOS accounts for 45% of the materials used in a PV system. Domínguez and Geyer [18] estimated the amount of PV waste (including BOS) and the amount of recyclable metal in PV waste when 7.8 GW of massive PV installed between 2016 and 2018 reach the module lifespan of 30 years.
PV modules are generally categorized into two groups: crystalline silicon (c-Si) and thin-film technologies, which are called the first and second generation technologies, respectively [21]. Cd-Te PV, the most representative thin-film PV model, has not been installed on a meaningful scale in South Korea because of the potential environmental impacts of cadmium (an interview with experts in Korea Institute of Energy Research and the former president of Korea New & Renewable Energy Center on 7 June 2018), so this study focuses on c-Si PV.
The materials comprising c-Si PV module waste can be recycled through a series of processes. After EVA is selectively burned or dissolved using solvents, then solar cells, glasses, and metals could be separated (See Figure 4). Solar cells could be recycled after etching unless solar cells are defected through the process [21,22]. However, this technology is currently not economically feasible, so materials like silicon, glasses, and metals such as silver are recycled and used to produce raw materials for new PV systems [17]. The lifespan of modules manufactured using recycled materials is guaranteed for another 25 to 30 years. The output of the modules manufactured using recycled materials is comparable to that of newly manufactured modules [23].
The amount of PV waste and the recyclable materials in PV waste are estimated using existing databases. Domínguez and Geyer [18] used data on the market share of different PV module technologies for a single year (2014), which enabled them to build specific assumptions about the weight of PV modules and the average material composition of each technology from external datasets. They estimated that 1.2 million mt of PV waste (including BOS) would be generated after a 30-year lifespan. In addition, 920 thousand mt of metal could be recycled.
Paiano [21] projected the amount of PV waste for two periods, 2012–2038 and 2039–2050, assuming a 25-year lifespan for PV. For the first period, end-of-life PV waste generated from PV installed from 1987 to 2012 is assumed to emerge in 2012 through 2038, which is controlled by WEEE directive. For the second period, the PV waste is generated from the forecasted PV installation from 2013 to 2025. This study used historical data to forecast the market share of five PV technologies, including c-Si, a-Si, Cd-Te, Cu-In-Ga-Se (CIGS), and emerging technologies, extrapolating 2020 market shares and assuming that market shares would then remain constant through 2025. They estimated waste generation and its material composition for each PV technology, together with the average material composition gathered from previous studies.
Peeters et al. [25] pointed out the uncertainty in estimating the stream of PV waste because the material composition of individual technologies will change due to the rapid development of PV technology. The authors forecasted the material composition of emerging waste streams of silicon-based PV in Flanders, Belgium, taking into account the probabilities of early failures caused by errors in the processes of production, transportation and installation stages, constant accidental failures due to unexpected events such as storms, and wear-out failures among aging PV (rather than simply assuming the lifespan of PV panels). The authors detailed three different waste scenarios based on average lifespan, constant failure rates, and early failure rates. Furthermore, they forecasted the evolution of material composition. For example, TPT (Tributyltin) accounted for 100% of the back sheet material in the early 2000s, but PET (Poly Ethylene Terephthalate) is currently used along with TPT, which will continue through 2040. The authors found that up to 22,000 tonnes of silicon-based PV modules would need to be recycled annually. Silver would comprise between 0.07% and 0.16% of waste in 2023, depending on waste scenarios and silver concentration scenarios.
Sica et al. [24] estimated worldwide PV panel waste for regular-loss and early-loss scenarios, thus describing the shape parameters of the Weibull function supposing that the lifespan is 30 years. In addition, they estimated the number of PV panels that could be produced using the recovered inputs. By 2030, 1.7 million tons of cumulative PV waste would be generated. At current market value, the amount of recoverable raw materials would be enough to produce about 72 million new panels with a total capacity of 21 GW.
Santos and Alonso-García [22] estimated PV module waste in Spain by 2050 using the Weibull function, as Sica et al. [24] had (this function will be explained in detail in following section). The authors found that cumulative PV waste would reach 100,000 tons between 2020 and 2030, faster than other European countries thanks to the 2007–2008 PV boom in Spain. Then, the PV waste inflow would decline, which would adversely affect the PV waste recycling industry. Based on this, the authors suggested modifying policy measures.
4. Methodology
This study estimates the end-of–life waste of c-Si PV modules that will be installed under South Korea’s Renewable Energy 3020 Implementation Plan. Because Cd-Te PV, the representative thin-film PV model, have not been installed on a meaningful scale in South Korea because of potential environmental impacts caused by cadmium, this study focuses on c-Si PV. A great deal of money and effort has been invested in R&D projects for CIGS PV by universities and corporate and government-funded research institutes, but no company commercially produces CIGS PV in South Korea, nor has that type of PV yet been imported or installed on a meaningful scale [26]. Recently, n-type PV attracts attention because of its efficiency and reliability; however, its material composition is nearly the same as typical c-Si PV (Interview with experts in Korea Institute of Energy Research and the former president of Korea New & Renewable Energy Center on 7 June 2018). Therefore, this study uses the specifications of a typical c-Si PV that has been installed in South Korea (capacity = 250 Wp, weight = 18.6 kg, area = 1.48 m2) to estimate PV module waste generation [27]. In addition, this study estimates the PV waste for different materials by using and adjusting the material composition of c-Si PV technology as established by Domínguez and Geyer [18]. Then, recyclable metals among PV module waste are calculated using the maximum recycling rates in Domínguez and Geyer [18].
Device lifespan is defined as the time that a device smoothly conducts its designed functions before it fails. Generally, the lifespan of devices follows a probability distribution. The Weibull distribution is a well-known and commonly used model for analyzing the lifespan or reliability of a device [24,27]. Weibull models can include up to three parameters: shape, lifespan/scale, and failure-free life/location. Often, the location parameters are not used (set to 0) [28], in which case it becomes a 2-parameter Weibull distribution function.
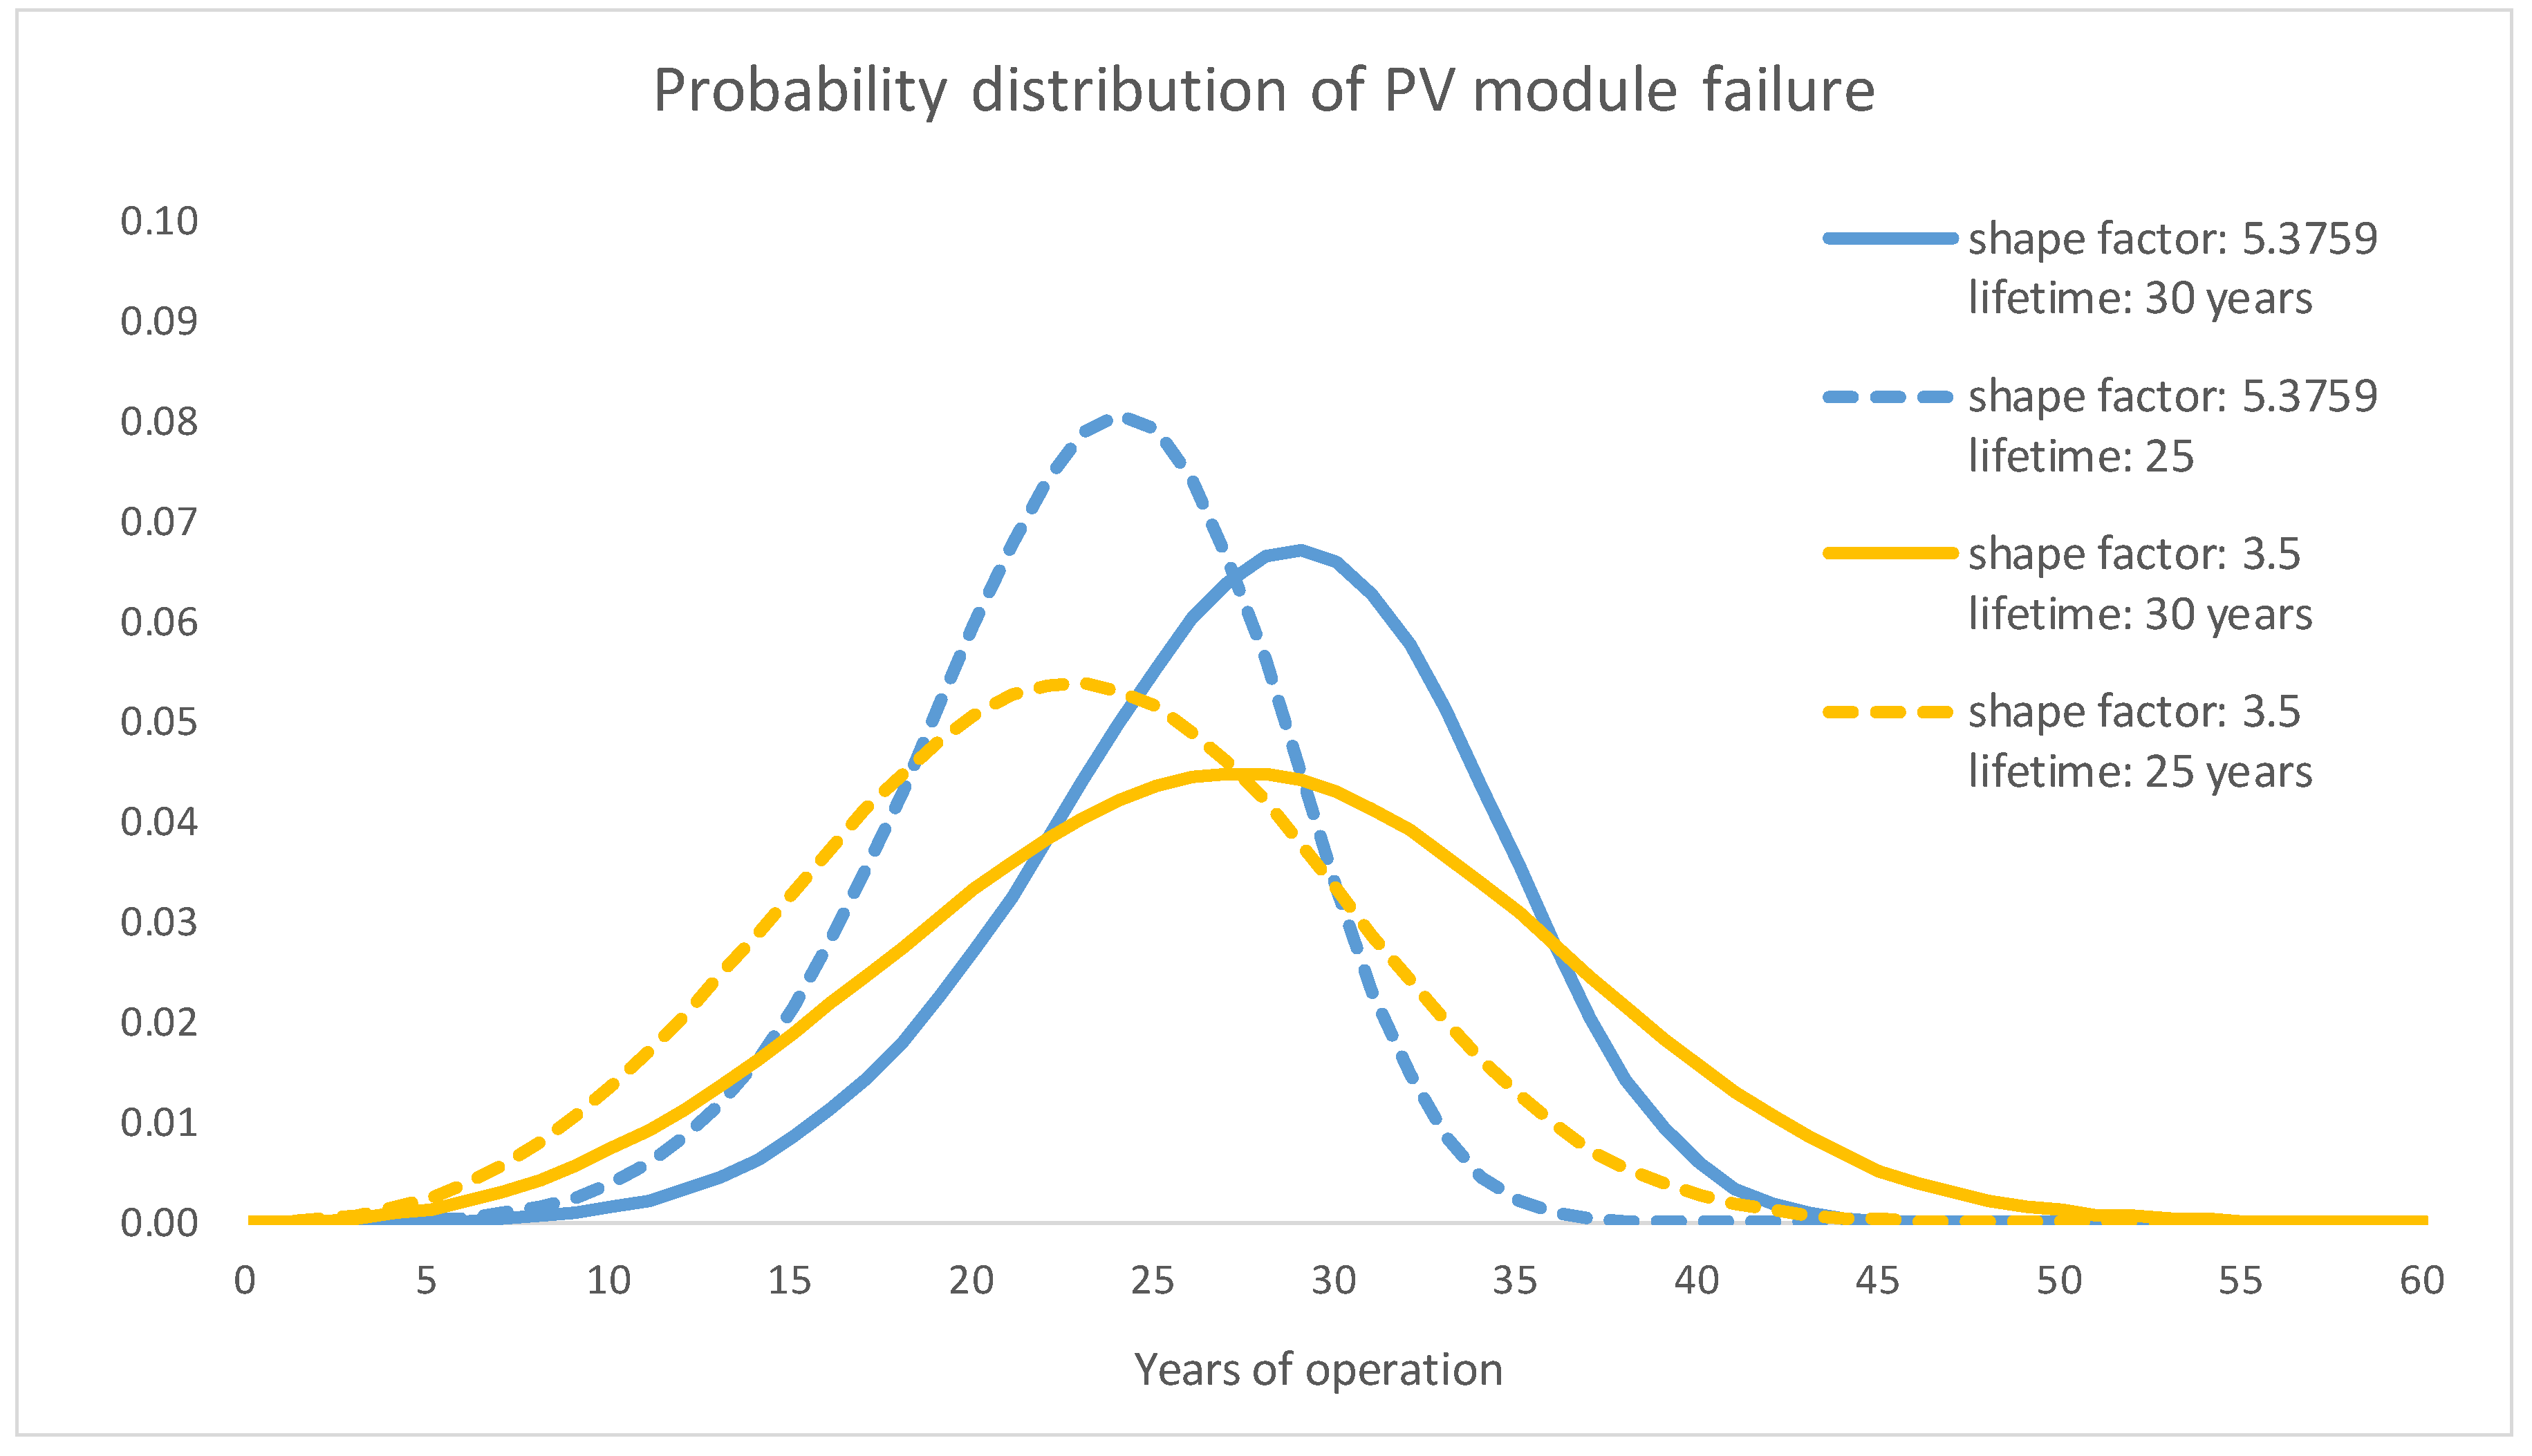
Equation 1 shows the probability density function, and Equation (2) shows the cumulative distribution function. Two parameters are necessary to estimate the lifespan distribution of PV in South Korea using the Weibull function: shape parameter () and mean lifespan (). The lifespan distribution or the loss/failure distribution varies according to the shape parameter [29]. In other words, it illustrates how the failure rate of a device changes according to time. When the shape parameter is less than 1, the failure rate decreases over time. The probability of loss decreases drastically in the initial years, then it decreases more slowly but continuously. A shape parameter of 1 means a constant rate of loss. A shape parameter greater than 1 means the failure rate increases with time, which is generally the case [30]. When the shape parameter is between 3 and 4, the probability of failure of a device is distributed along a bell curve. These two parameters define the distribution of failure of a device, as shown in Figure 5.
Here, : shape parameter, : scale parameter, : time.
This study tested four scenarios, combining two shape parameters and two lifespans (See Figure 5 and Table 2). These two parameters are critical for forecasting PV waste generation and must be based on real observations. The wear-out of PV is also dependent on climate factors such as temperature. However, data to estimate these parameters are not obtainable for South Korea. Therefore, this study conducted an extensive review of PV reliability studies; Table 3 presents the shape parameters that were measured using field or experimental test data. Among these parameters, this study uses 5.3759 from Kuitche [31] and 3.5 from EC [31] as shape parameters for estimating PV module waste generation in South Korea. The shape parameter estimated by Kuitche [31] is used for many studies [22,29,32] because it was found using field data. The shape parameter being used in EC [33] is also used to estimate PV waste generation. According to Commission Decision 2005/306/EC, EU Member States are required to report to the Commission on the status of compliance with the WEEE on generation, collection, re-use, and recycling or recovery. The EC established a common methodology for Member States to use in calculating their reports. This study tests two lifespans, 25 [24,34] and 30 years [24,32], which match the general range used in PV waste generation studies. Using these widely used shape and lifespan parameters, the results of this study could be compared with the forecasted PV waste in other countries.
As mentioned earlier, the government aims to increase solar PV capacity to 36.5 GW by 2030. If the government achieves this target, the electricity generated from PV would account for 8.44% of total electricity demand in 2030 [11,34]. Regarding future annual PV installations, this study initially assumed annual PV installation using a 15.4% annual growth rate. However, due to the wearing-out of installed PV, the government could not thereby achieve its PV deployment target by 2030, falling short by 0.3 GW (RL-1) to 1.8 GW (EL-2) under different scenarios.
To complement the wearing-out of installed PV and to obtain the government’s PV deployment target in 2030, this study assumes additional installations beginning in 2018. Depending on scenarios, two (RL) or three (EL) iterations are conducted. Consequently, the number of annual installations vary with scenarios. Table 4 presents the annual PV installations needed to obtain the 36.5 GW of PV capacity by 2030 in each scenario. Under EL-2, early loss of PV occurs and the lifespan is shorter. Therefore, more PV capacity (1.836 GW for EL-2) needs to be installed than in other scenarios.
The South Korean government plans (the Renewable Energy 3020 Implementation Plan and the 8th Electricity Demand and Supply Basic Plan) span up to 2030 or 2031. Therefore, it is hard to find any foundations that allow the estimation of future PV installations.
This study assumes that additional PV will be installed after 2030 to keep PV capacity at 36.5 GW. These additional PV will replace previously installed PV that have worn out. As mentioned earlier, the electricity generated from PV will account for a proportion of total electricity demand in 2030 similar to the current solar PV contribution in Germany. In 2015, solar PV contributed 5.54% of the total electricity generated in Germany [38]. Because South Korea needs to curb electricity demand to meet its responsibility for climate stabilization, unlimited deployment of PV seems unlikely even though the technical potential for South Korean PV is high [39]. As of 2017, South Korea had installed 5.7 GW of PV capacity, and its installation rate was very high thanks to the Renewable Energy 3020 Implementation Plan. However, this expansion of PV has already resulted in several adverse impacts (for example, reckless deployment in rural areas [40]). Therefore, this study takes a conservative approach on PV capacity beyond 2030, rather than assuming it will increase exponentially.
5. Results and Discussion
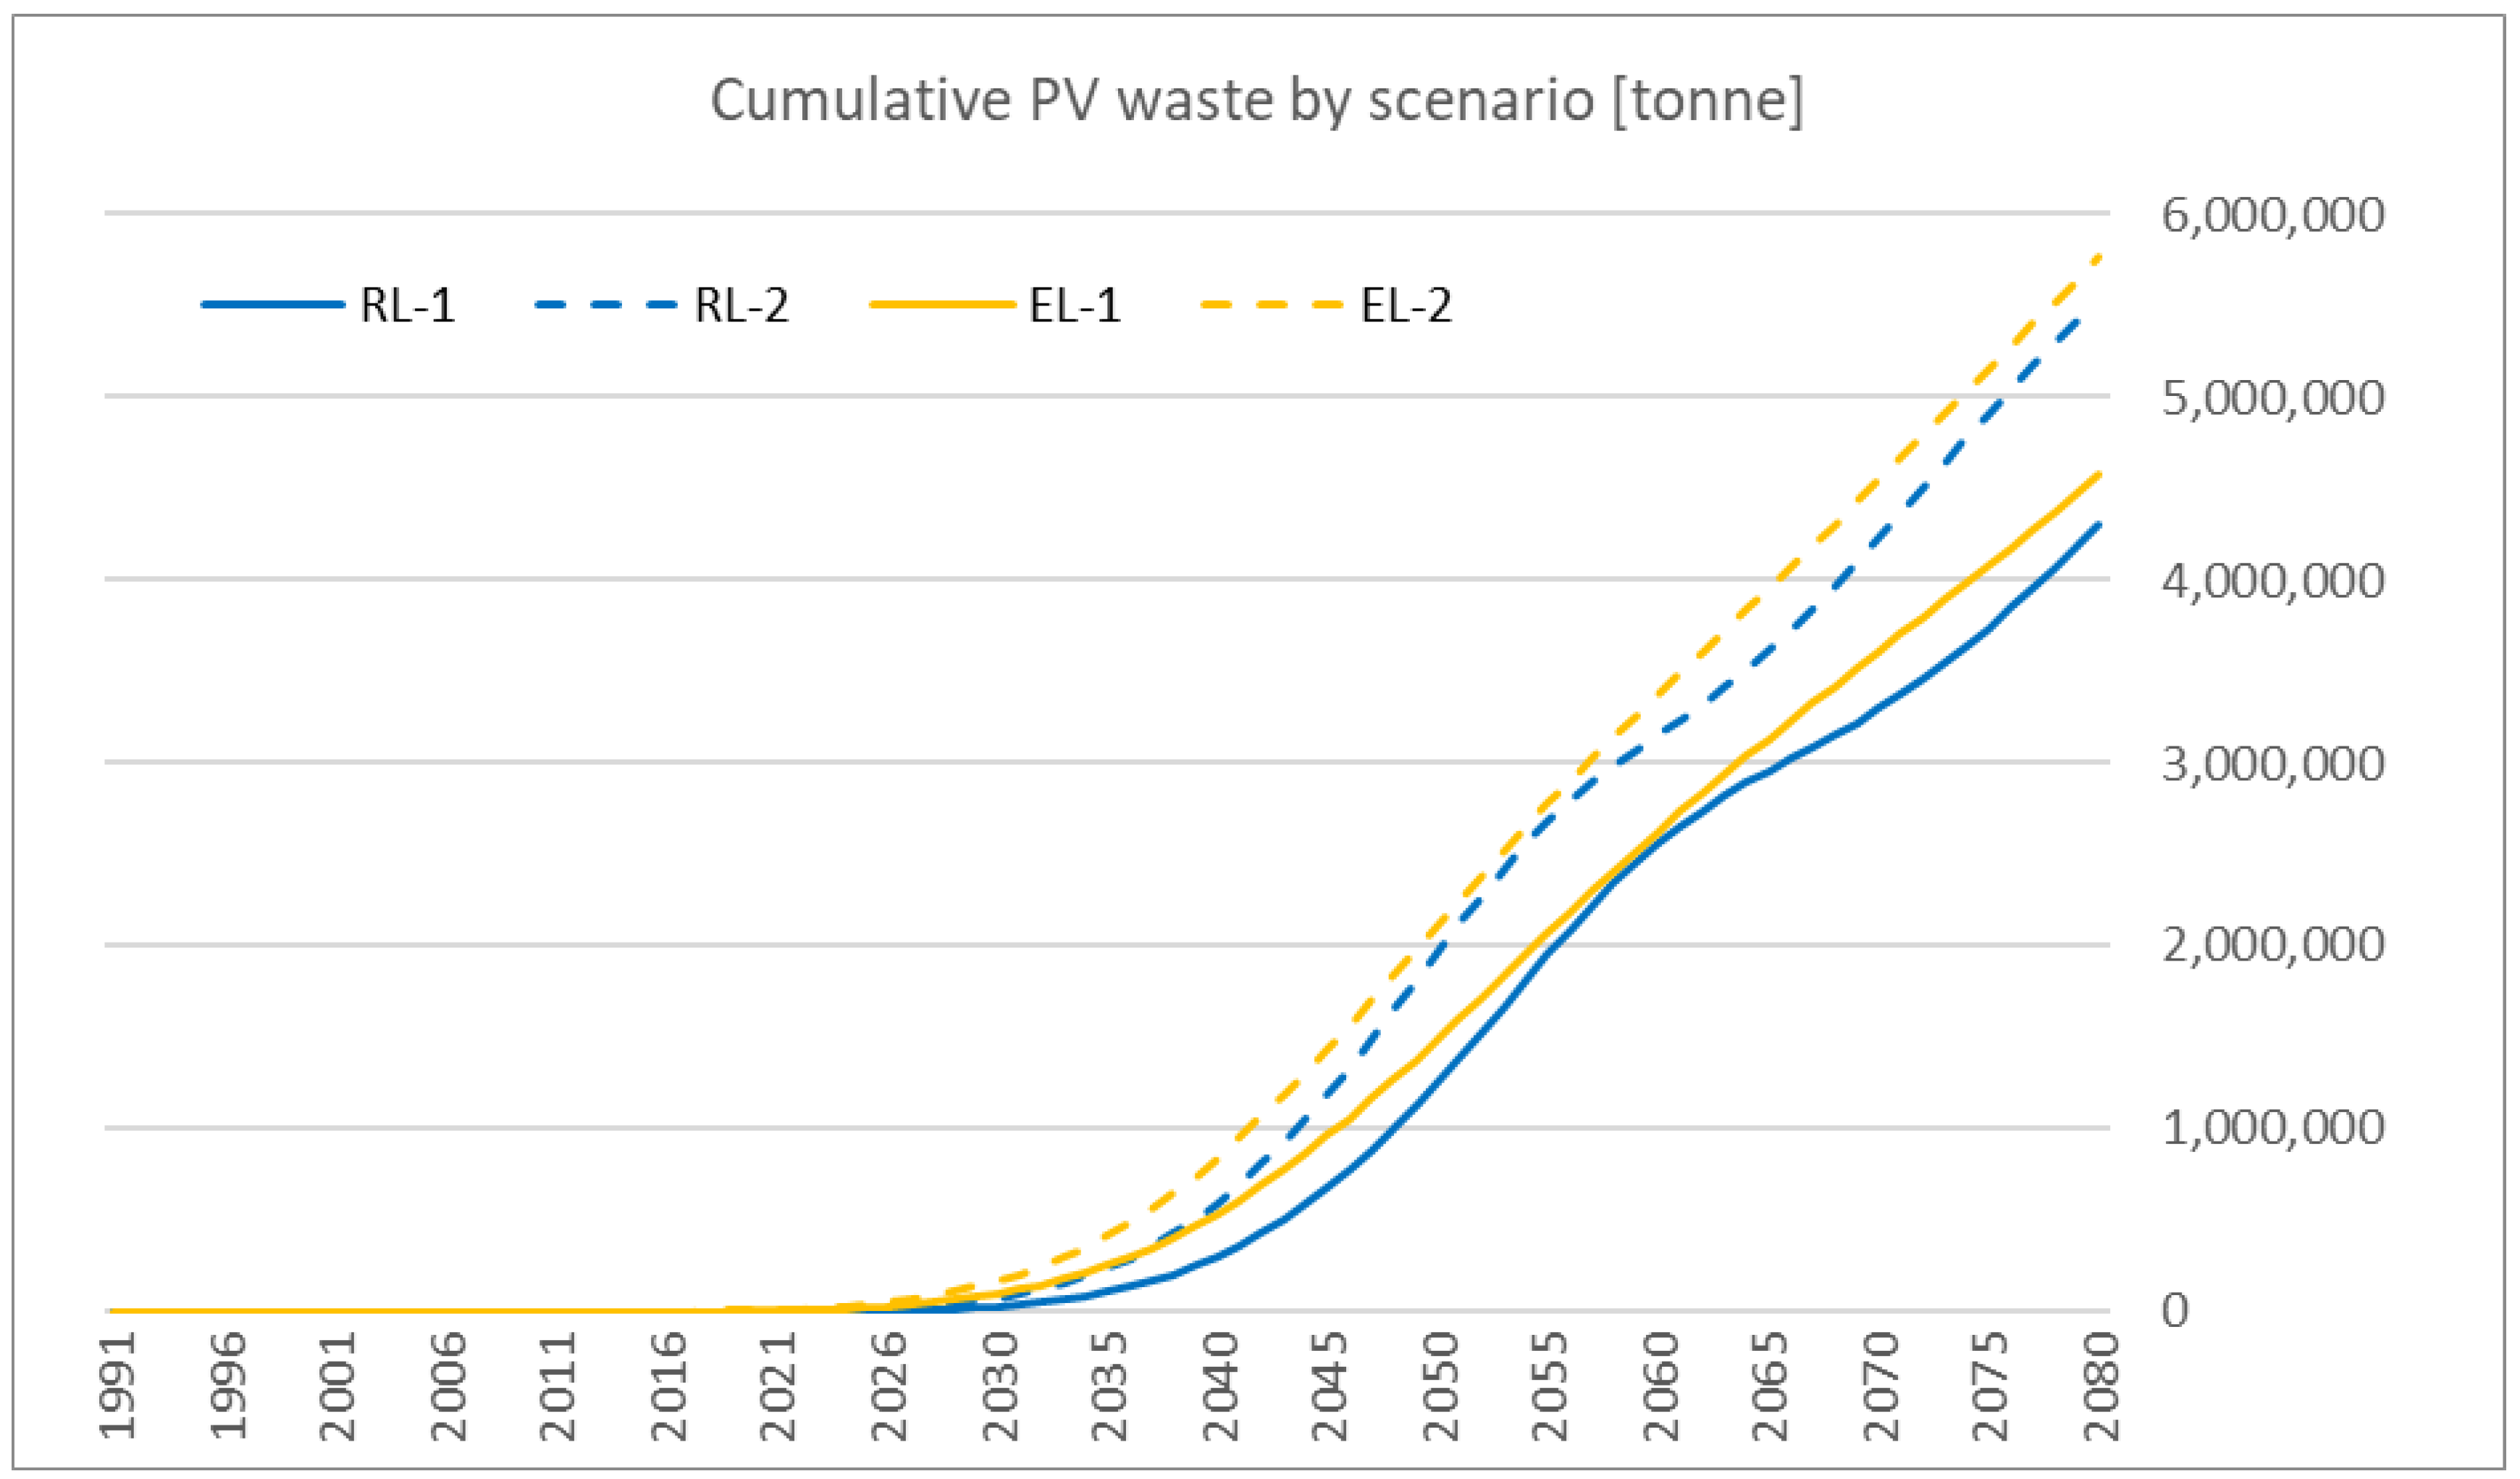
As mentioned earlier, this study assumes that PV capacity will remain constant at 36.5 GW beyond 2030, as new PV will be installed to replace those that wear out. Figure 6 presents the cumulative waste generated from PV installed from 1991 to 2080. Cumulative PV waste will exceed 100,000 tons by 2029 under EL-2 and by 2035 under RL-1. Like the PV installation scenarios presented in Table 4, the final amounts of PV waste vary in different scenarios. The final amount was the largest under EL-2 (about 5764 thousand tons), followed by RL-2 (about 5538 thousand tons), EL-1 (about 4574 thousand tons), and RL-1 (about 4299 thousand tons).
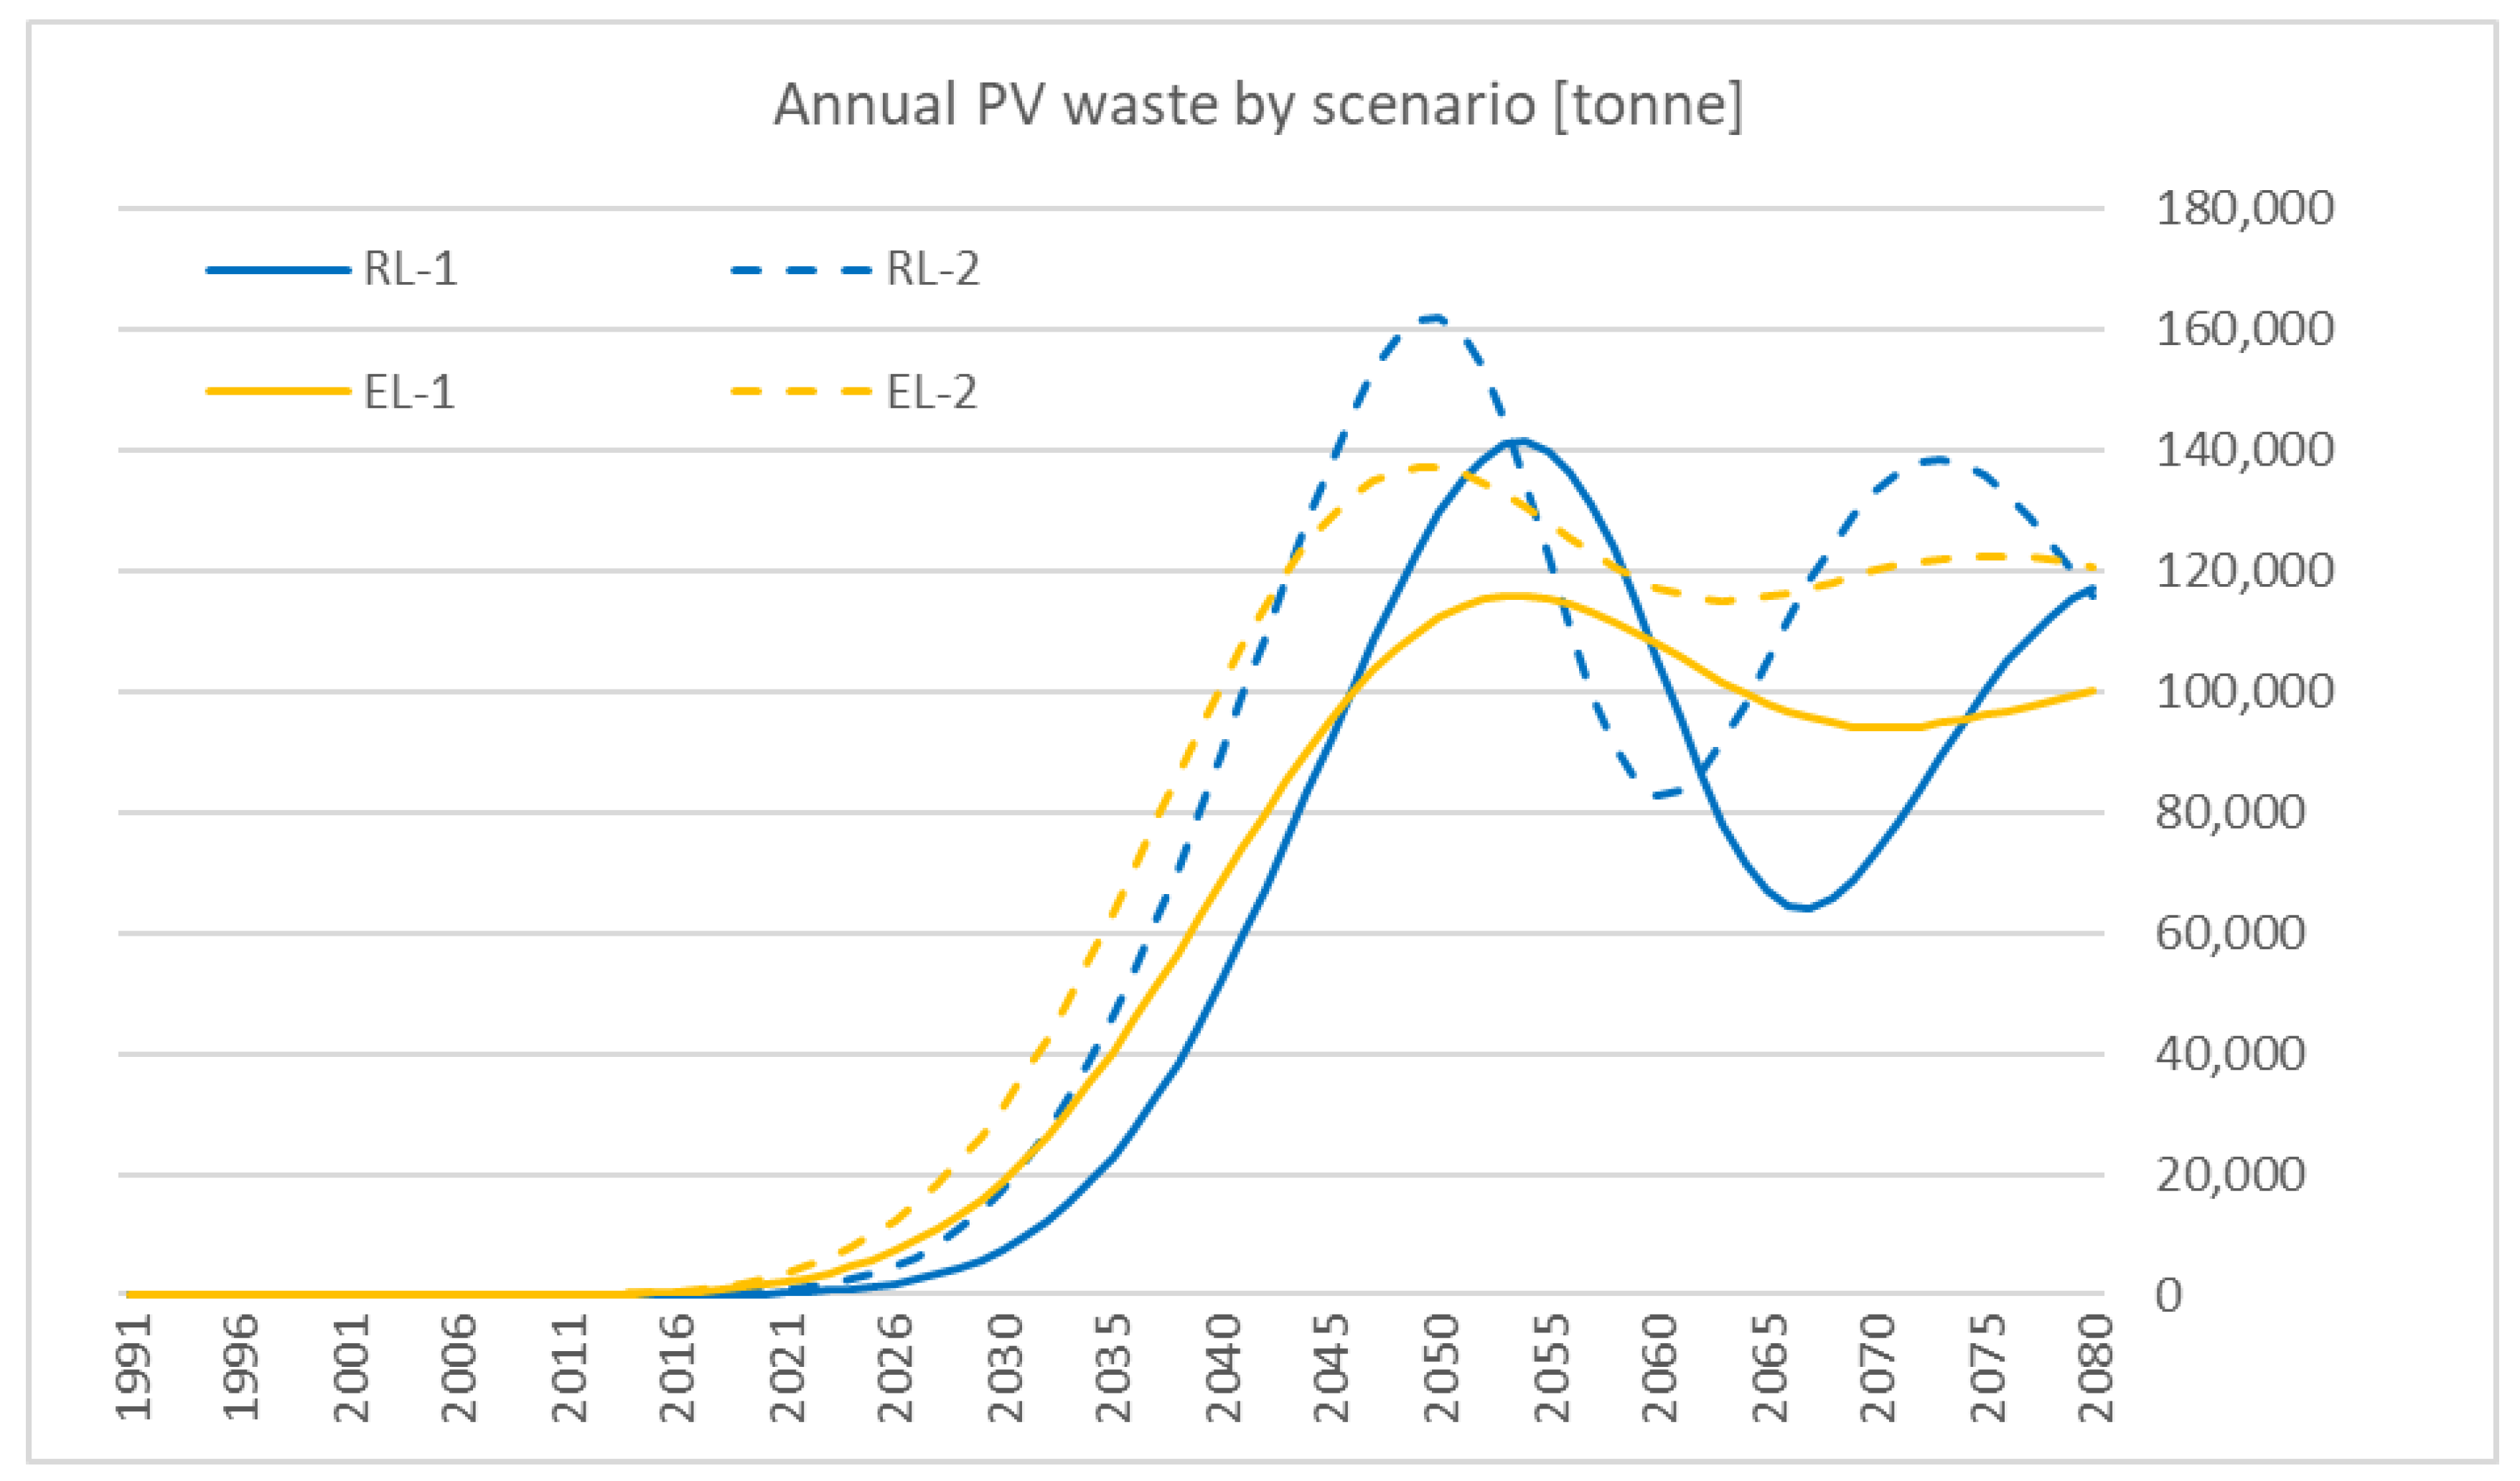
Annual PV waste will be augmented in parallel with accelerated PV installation. Annual PV waste generation will fluctuate (See Figure 7). The fluctuations are smaller under early-loss scenarios (EL-1 and EL-2) than under regular-loss scenarios (RL-1 and RL-2). Under EL-2, annual PV waste generation does not exceed 1500 tons by 2018; however, annual PV waste generation will exceed 130,000 tons in 2045 and peak at 136,981 tons in 2049. After that, annual PV waste will decrease to 114,972 tons by 2063 and then increase to 120,597 tons by 2080. Similarly, under RL-1, annual PV waste does not exceed 100 tons by 2018, however annual PV waste generation will exceed 130,000 tons in 2051 and peak at 141,297 tons in 2054. After that, annual PV waste will decrease to 64,048 tons by 2067 and then increase to 116,976 tons by 2080. While PV waste will be generated sooner under early-loss scenarios (ELs), PV waste generation will be more concentrated under regular-loss scenarios (RLs).
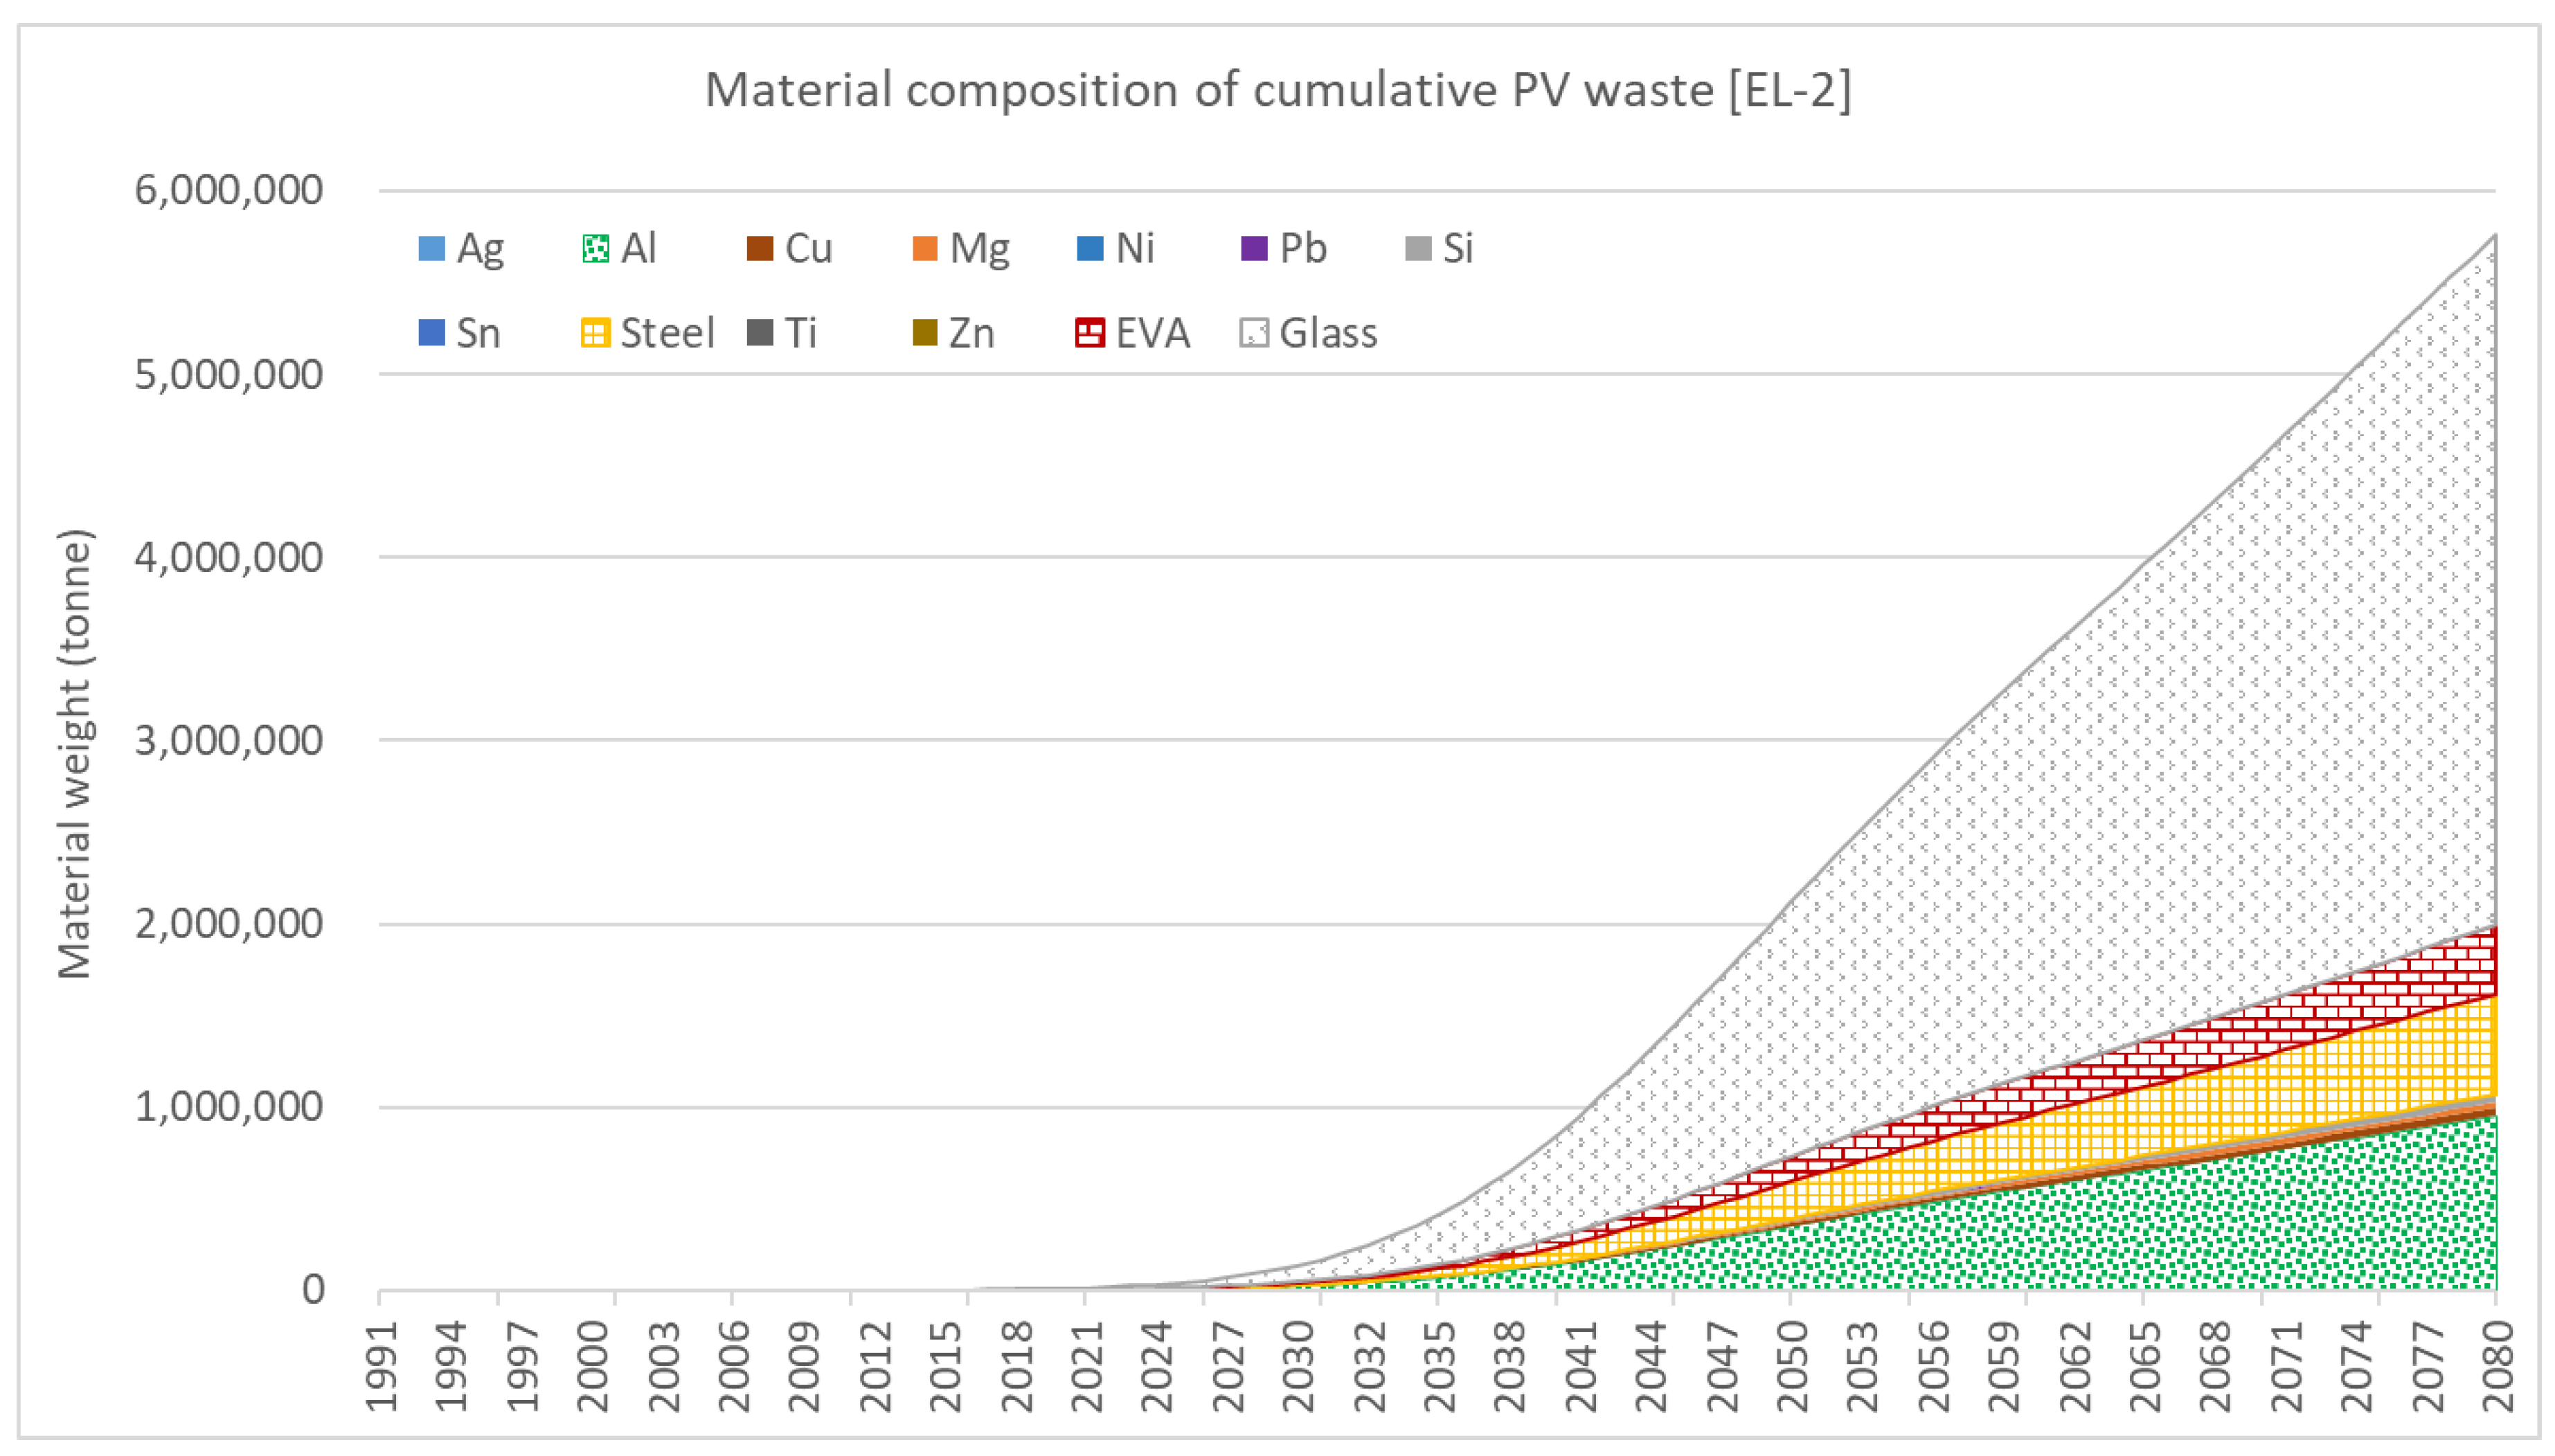
This study conducts further analysis to estimate the material composition of cumulative PV waste. Based on a more precautionary approach, the additional analysis is conducted for EL-2, in which the largest amount of PV waste would be generated soonest and the final cumulative PV waste in 2080 would be the largest. Figure 8 and Table 5 present the material composition of cumulative PV waste under EL-2. Glass accounts for more than half of the cumulative PV module waste (65.4% in 2080), followed by aluminum (16.5%), steel (9.5%), and EVA (6.5%). Other materials account for a negligible fraction of the waste.
Unlike the thin-film PV (specifically, Cd-Te), c-Si PV does not include cadmium; however, the c-Si module includes heavy metals such as lead (Pb) and tin (Sn) that could adversely affect health. Therefore, even though the amounts are negligible, an appropriate disposal and treatment process for PV waste should be established. In addition, among these negligible components of PV waste, tin is very valuable metal—its price per million tons was 19,485 USD as of 20 July 2018, according to Bloomberg [41].
This study estimates the recyclable materials in PV waste using the assumptions for the best available technologies set forth in Domínguez and Geyer [18]. As of 2080, about 1,049 thousand tons of metals could be recyclable under EL-2. Of this amount, aluminum would account for 90.37% of the total metals, and copper and silicon would account for 4.02% and 4.34%, respectively (See Table 6).
The PV industry is expected to change dramatically, thanks to the political will for energy transition that focuses on renewable energy. This study estimates the PV module waste generated from the PV that has been and will be installed by 2080. As the results show, the annual PV waste becomes significant after some point. Before that time, the volume of PV waste is too small for recycling to be economically viable. The threshold volume for sustainable recycling, according to the European Association for Recovery of PV modules (as cited in [19]), is 130,000 tons of annual PV module waste generation. A system for proper PV waste management, including collection and storage, needs to be established before the volume reaches that level. In addition, annual PV waste generation will fluctuate, and the fluctuation depth (the difference between the largest and smallest annual PV wastes) and width (the period spanning the largest and smallest annual PV wastes) vary in different scenarios. For PV recycling to be economically feasible, the volume of the PV waste stream should be kept constant. When PV waste exceeds the threshold, the waste needs to be kept at a storage center. When the volume is smaller than the threshold, there could be opportunities for international cooperation with neighboring countries like Japan or China.
The legal foundation has started to be prepared and PV waste issues have started getting attention in South Korea. Generally, solar panels are seldom monitored due to their reliability. As a result, out-of-order PV is left as they are without being noticed [42]. In a recent survey of installed PV in public buildings, it was found that “a significant proportion were found to be out of order” (interview with experts in the PV industry in South Korea, 14 June 2018). These PV systems were installed through nearly 100% financial support by the government, so their status is not monitored appropriately. As part of the waste management system, a monitoring system to check the operation status of PV needs to be established, which would enable a proper judgment about whether the PV should be repaired or disposed of.
The principles found in studies that tried to define the concept of “circular economy” include 3Rs (reduce, reuse, and recycle) and sustainable design strategies (SDS) [43]. In addition to 3Rs, the design of the PV module or BOS needs to be modified to consider the possibility of 3R after PV panels reach end-of-life [44], because “component reuse has smaller close-loop life cycle paths than material recycling and generally have better environmental and economic performances” [16].
This study also estimates the amount of recyclable metal in PV waste. Recycling of solar PV waste is technologically possible but still costly [16]. Even with the environmental benefits of recycling of PV wastes, the economic feasibility of recycling technologies is a significant barrier [16,45]. McDonald and Pearce [45] found that recycling is not cost-efficient compared to landfill in the absence of political supports such as producer responsibility. Even though this study estimates the amount of recyclable metals from PV module waste, it should be noted that the best available technology is not commercially feasible as of now. It could, however, be feasible in the future. Investment in PV waste-related R&D projects, such as PV recycling, design, and monitoring, needs to be augmented.
6. Conclusions
This study presents PV waste generation according to different PV installation paths due to the wearing-out of the installed PV based on different assumptions about shape parameters and lifespans. To complement the wearing out of the installed PV and attain the government PV deployment target by 2030, an additional 1.836 GW of PV needs to be installed to attain the 2030 solar PV deployment target under the early-loss scenario with a 25-year PV lifetime (EL-2), in which PV experiences relatively earlier failure. From 2031 to 2080, an additional 43.2 GW of PV needs to be constructed to maintain 36.5 GW of PV capacity. Because of the larger amount of installed PV, the ultimate amount of PV waste in 2080 is also the largest for EL-2 (5764 thousand tons); this compares to 4299 thousand tons for RL-1. The early losses in EL-2 imply that a PV waste management system needs to be prepared sooner than in other scenarios because the cumulative PV waste will exceed 100,000 tons by 2029. The establishment of a PV waste management system requires comprehensive efforts. Firstly, the government needs to establish a monitoring and audit system for PV to check operational status and recommend disposal or repair. Meanwhile, the performance of installed PV in South Korea, which decides the parameters of Weibull function, should be identified. At the same time, the government should augment R&D investment for PV design to make the PV module more favorable for recycling or reuse and to promote the industrialization of this design. Secondly, the government should try to determine the appropriate scale of a PV waste management system, given the inconsistent PV waste stream. If necessary, international cooperation to ensure economically feasible PV waste recycling should be investigated by the government. Lastly, the government should increase R&D to accelerate the development of PV recycling technologies. Although this study investigated the South Korean case, its findings could be meaningful for any country that decided to drastically increase PV installation. The appropriate scale of PV waste management system will need country-specific data.
Previous literature has generally either estimated PV waste generation from PV that was installed in the past or it has estimated PV waste generation from assumed future PV installation trends without considering the retirement of PV capacity. This study considers the wearing-out of PV capacity in its estimates of annual PV installation. Also, this study carried out an extensive literature review for parameters. However, this study has several limitations. This study used conservative assumptions about PV installments beyond 2030, which means PV capacity would be added to complement the retired PV capacity. To capture more practical implications for PV waste management, a future profile of energy sources needs to be investigated. In addition, this study investigates PV waste generation considering only the wearing-out of the PV modules; however, the solar panel is installed together with the BOS. The lifespan of the PV system is also dependent on the lifespan of other components, such as cables, inverter, etc. Each part has different shape and scale parameters that define the distribution of device wear-out [42]. To capture the full implications for PV waste, the BOS should be explored as well. Furthermore, because this study used shape and scale parameters taken from previous studies, the actual shape and scale parameters for PV panels and BOS that have been installed in South Korea need to be investigated to provide more exact estimates for PV waste generation. In addition, this study did not consider topics related to maintenance of PV systems, including monitoring and repair. Regular maintenance could increase the lifespan of the PV systems. The limitations of this study need to be addressed in future research.
Author Contributions
Conceptualization, H. Kim and H. Park; Methodology, H. Kim.; Validation, H. Kim and H. Park; Formal Analysis, H. Kim; Investigation, H. Kim and H. Park; Resources, H. Kim and H. Park.; Data Curation, H. Kim and H. Park; Writing—Original Draft Preparation, H. Kim and H. Park.; Writing—Review & Editing, H. Kim and H. Park; Visualization, H. Kim and H. Park.
Funding
This work is financially supported by the National Research Foundation of Korea (NRF-2018S1A5A8028278) and Korea Ministry of Environment (MOE) as Graduate School specialized in Climate Change.
Conflicts of Interest
The authors declare no conflict of interest.
References
- REN21. Renewables 2018 Global Status Report; REN21 Secretariat: Paris, France, 2018. [Google Scholar]
- IEA. World Energy Investment 2018; IEA Publications: Paris, France, 2018. [Google Scholar]
- IEA. Energy Technology Perspectives 2017: Catalysing Energy Technology Transformations; IEA Publications: Paris, France, 2017. [Google Scholar]
- MOTIE. Renewable Energy 3020 Implementation Plan; MOTIE: Sejong, Korea, 2017.
- PV Cycle. Solar Waste. Available online: http://www.solarwaste.eu/ (accessed on 11 April 2018).
- IRENA. Renewable Electricity Capacity and Generation Statistics. (IRENA); IREA, Ed.; IRENA: Abu Dhabi, UAE, 2018. [Google Scholar]
- Korea Electric Power Corporation. Statistics of Electric Power in Korea; Korea Electric Power Corporation: Naju, Korea, 2018. [Google Scholar]
- KEA. New and Renewalbe Energy Deployment Statistics; Korea Energy Agency: Yongin, Korea, 2017. [Google Scholar]
- Office of Member of Parliament Jwahyeon Boo. Solar PV Recycling System Policy Orientations; Office of Member of Parliament Jwahyeon Boo: Melbourne, Australia, 2014.
- KEA. Deployed Capacity of New and Renewable Energy during the 4th Quarter 2017; Korea Energy Agency: Yongin, Korea, 2018. [Google Scholar]
- MOTIE. The 8th Electricity Demand and Supply Basic Plan (2017–2031); Ministry of Trade, Industry and Energy: Sejong, Korea, 2017.
- PV Cycle. Annual Report 2016; PV Cycle Association: Brussels, Belgium, 2017. [Google Scholar]
- 3P Contributor. The Carbon Footprint of Solar Panels Manufacturing; Triple Pundit: Northampton, MA, USA, 2018. [Google Scholar]
- BMWi. Zeitreihen zur Entwicklung der Erneuerbaren Energien in Deutschland 1990–2017; Bundesministerium für Wirtschaft und Energie (BMWi): Berlin, Germany, 2018. [Google Scholar]
- Byeon, W. “Solar PV Moduel Will be Recycled.” ... The First R&D Center Will be Established in Jincheon; YonhapNews: Seoul, Korea, 2017. [Google Scholar]
- Tao, J.; Yu, S. Review on feasible recycling pathways and technologies of solar photovoltaic modules. Sol. Energy Mater. Sol. Cells 2015, 141, 108–124. [Google Scholar] [CrossRef]
- Xu, Y.; Li, J.; Tan, Q.; Peters, A.L.; Yang, C. Global status of recycling waste solar panels: A review. Waste Manag. 2018, 75, 450–458. [Google Scholar] [CrossRef] [PubMed]
- Domínguez, A.; Geyer, R. Photovoltaic waste assessment in mexico. Resour. Conserv. Recycl. 2017, 127, 29–41. [Google Scholar] [CrossRef]
- Yi, Y.K.; Kim, H.S.; Tran, T.; Hong, S.K.; Kim, M.J. Recovering valuable metals from recycled photovoltaic modules. J. Air Waste Manag. Assoc. 2014, 64, 797–807. [Google Scholar] [CrossRef] [PubMed] [Green Version]
- Dias, P.; Javimczik, S.; Benevit, M.; Veit, H.; Bernardes, A.M. Recycling weee: Extraction and concentration of silver from waste crystalline silicon photovoltaic modules. Waste Manag. 2016, 57, 220–225. [Google Scholar] [CrossRef] [PubMed]
- Paiano, A. Photovoltaic waste assessment in italy. Renew. Sustain. Energy Rev. 2015, 41, 99–112. [Google Scholar] [CrossRef]
- Santos, J.D.; Alonso-García, M.C. Projection of the photovoltaic waste in spain until 2050. J. Clean. Prod. 2018, 196, 1613–1628. [Google Scholar] [CrossRef]
- Ashfaq, H.; Hussain, I.; Giri, A. Comparative analysis of old, recycled and new pv modules. J. King Saud Univ. Eng. Sci. 2017, 29, 22–28. [Google Scholar] [CrossRef]
- Sica, D.; Malandrino, O.; Supino, S.; Testa, M.; Lucchetti, M.C. Management of end-of-life photovoltaic panels as a step towards a circular economy. Renew. Sustain. Energy Rev. 2018, 82, 2934–2945. [Google Scholar] [CrossRef]
- Peeters, J.R.; Altamirano, D.; Dewulf, W.; Duflou, J.R. Forecasting the composition of emerging waste streams with sensitivity analysis: A case study for photovoltaic (PV) panels in flanders. Resour. Conserv. Recycl. 2017, 120, 14–26. [Google Scholar] [CrossRef]
- Kim, K.; Yun, J. Research trends and mid-&long-term development directions of Cu(In,Ga)Se2 solar cells. KIC News 2017, 20, 1–12. [Google Scholar]
- Carrasco, J.M.F.; Ortega, E.M.M.; Cordeiro, G.M. A generalized modified weibull distribution for lifetime modeling. Comput. Stat. Data Anal. 2008, 53, 450–462. [Google Scholar] [CrossRef]
- Kumar, S.; Sarkar, B. Design for reliability with weibull analysis for photovoltaic modules. Int. J. Curr. Eng. Technol. 2013, 3, 129–134. [Google Scholar]
- Watari, T.; McLellan, B.; Ogata, S.; Tezuka, T. Analysis of potential for critical metal resource constraints in the international energy agency’s long-term low-carbon energy scenarios. Minerals 2018, 8, 156. [Google Scholar] [CrossRef]
- Laronde, R.; Charki, A.; Bigaud, D. Lifetime Estimation of a Photovoltaic Module based on Temperature Measurement. In Proceedings of the 2nd IMEKO TC 11 International Symposium, Cavtat, Croatia, 15–17 June 2011. [Google Scholar]
- Kuitche, J.M. Statistical Lifetime Prediction for Photovoltaic Modules. In Proceedings of the Photovoltaic Module Reliability Workshop 2010, Denver, Colorado, 18–19 February 2010. [Google Scholar]
- IRENA; IEA-PVPS. End-of-Life Management: Solar Photovoltaic Panels; International Renewable Energy Agency and International Energy Agency Photovoltaic Power Systems: Abu Dhabi, UAE, 2016. [Google Scholar]
- EC. Waste Electrical & Electronic Equipment (WEEE). Available online: http://ec.europa.eu/environment/waste/weee/data_en.htm (accessed on 11 July 2018).
- KPX. Solar PV Capacity Factors Vary among Regions; KPX: Naju, Korea, 2009. [Google Scholar]
- Collins, E.; Dvorack, M.; Mahn, J.; Mundt, M.; Quintana, M. Reliability and Availability Analysis of a Fielded Photovoltaic System. In Proceedings of the 34th IEEE Photovoltaic Specialists Conference (PVSC), Philadelphia, PA, USA, 7–12 June 2009. [Google Scholar]
- Dietrich, S.; Pander, M.; Sander, M.; Ebert, M. Mechanical investigations on metallization layouts of solar cells with respect to module reliability. Energy Procedia 2013, 38, 488–497. [Google Scholar] [CrossRef]
- Tont, G.; Tont, D.G. Reliability performance assessment in modeling photovoltaic networks. In Advances in Environmental Development, Geomatics Engineering and Tourism; WSEAS Press: Brasov, Romania, 2014; pp. 63–68. [Google Scholar]
- IEA. Electricity Information; IEA: Paris, France, 2017. [Google Scholar]
- KEA. New & Renewable Energy White Paper 2016; Korea Energy Agency: Yongin, Korea, 2016. [Google Scholar]
- Song, T. The Reckless Deployment of Photovoltaics Inflicts Damage to Rural Communities; YTN: Seoul, Korea, 2018. [Google Scholar]
- Bloomberg. Precious and Industrial Metals. Available online: https://www.bloomberg.com/markets/commodities/futures/metals (accessed on 22 July 2018).
- Perdue, M.; Gottschalg, R. Energy yields of small grid connected photovoltaic system: Effects of component reliability and maintenance. IET Renew. Power Gener. 2015, 9, 432–437. [Google Scholar] [CrossRef] [Green Version]
- Prieto-Sandoval, V.; Jaca, C.; Ormazabal, M. Towards a consensus on the circular economy. J. Clean. Prod. 2018, 179, 605–615. [Google Scholar] [CrossRef]
- Bogacka, M.; Pikon, K.; Landrat, M. Environmental impact of pv cell waste scenario. Waste Manag. 2017, 70, 198–203. [Google Scholar] [CrossRef] [PubMed]
- McDonald, N.C.; Pearce, J.M. Producer responsibility and recycling solar photovoltaic modules. Energy Policy 2010, 38, 7041–7047. [Google Scholar] [CrossRef]
Figure 1.
Global Annual photovoltaic (PV) installation. Source: [6].
Figure 1.
Global Annual photovoltaic (PV) installation. Source: [6].


Figure 3.
Growth of Photovoltaic Power Installations in Germany. Source: [14].
Figure 3.
Growth of Photovoltaic Power Installations in Germany. Source: [14].


Figure 5.
Effect of shape parameter and scale parameter on the Weibull distribution.

Figure 6.
Cumulative PV waste by Scenario (including historical and future PV installations by 2080).
Figure 6.
Cumulative PV waste by Scenario (including historical and future PV installations by 2080).

Figure 7.
Annual PV waste by Scenario (including historical and future PV installations by 2080).

Figure 8.
Material composition of cumulative PV waste of EL-2 scenario.


Table 1.
Mid-term projection of renewable power capacity according to Renewable Energy 3020 Implementation Plan.
Table 1.
Mid-term projection of renewable power capacity according to Renewable Energy 3020 Implementation Plan.
| Year | 2017 | 2030 | CAGR (2017–2030) |
|---|---|---|---|
| Solar PV | 5.7 GW | 36.5 GW | 15.4% |
| Renewables total | 15.1 GW | 63.8 GW | 11.7% |
| Renewables + Non-Renewables | 117.0 GW | 173.7 GW | 3.09% |
Table 2.
Scenarios.
| Lifetime | |||
|---|---|---|---|
| 30 Years | 25 Years | ||
| Shape factor | 5.3759 | RL-1 | RL-2 |
| 3.5 | EL-1 | EL-2 | |
Note: RL stands for regular-loss, where the shape factor is 5.3759. EL stands for early-loss, where the shape factor is 3.5.
Table 3.
Summary of shape parameters for PV modules in existing studies.
| Source | Shape Parameter | Explanation | ||
|---|---|---|---|---|
| Lower | Upper | Median | ||
| Collins et al. [35] | 1.9055 |
| ||
| Kuitche [31] | 3.3 | 8.7488 | 5.3759 |
|
| Laronde et al. [30] | 2.6 | 7.56 | 5.03 |
|
| Dietrich et al. [36] | 7 |
| ||
| Kumar and Sarkar [28] | 9.982 | 14.41 |
| |
| EC [33] | 3.5 |
| ||
| Tont and Tont [37] | 1.0739 |
| ||
Table 4.
Future annual PV installation by scenario.
| Annual PV Installation [MW] | |||||
|---|---|---|---|---|---|
| Baseline | Regular-Loss (Shape Factor: 5.3759) | Early-Loss (Shape Factor: 3.5) | |||
| RL-1 (Lifetime: 30 Years) | RL-2 (Lifetime: 25 Years) | EL-1 (Lifetime: 30 Years) | EL-2 (Lifetime: 25 Years) | ||
| 2018 | 876 | 880 | 886 | 917 | 949 |
| 2019 | 1010 | 1011 | 1014 | 1025 | 1036 |
| 2020 | 1165 | 1167 | 1172 | 1185 | 1201 |
| 2021 | 1343 | 1347 | 1354 | 1372 | 1392 |
| 2022 | 1550 | 1556 | 1565 | 1587 | 1614 |
| 2023 | 1788 | 1796 | 1810 | 1836 | 1872 |
| 2024 | 2062 | 2075 | 2095 | 2124 | 2169 |
| 2025 | 2379 | 2397 | 2424 | 2457 | 2513 |
| 2026 | 2744 | 2769 | 2806 | 2841 | 2910 |
| 2027 | 3165 | 3199 | 3249 | 3285 | 3368 |
| 2028 | 3651 | 3697 | 3763 | 3797 | 3897 |
| 2029 | 4212 | 4272 | 4357 | 4388 | 4507 |
| 2030 | 4858 | 4937 | 5045 | 5071 | 5210 |
| Newly installed capacity [GW] | 30.8 | 31.1 | 31.5 | 31.9 | 32.6 |
| Gap [GW] | 0.302 | 0.740 | 1.084 | 1.836 | |
Table 5.
The share of material in cumulative PV waste in 2080.
| Material | Ag | Al | Cu | Mg | Ni | Pb | Si | Sn | Steel | Ti | Zn | EVA | Glass |
|---|---|---|---|---|---|---|---|---|---|---|---|---|---|
| Share (%) | 0.1 | 16.5 | 0.7 | 0.5 | 0.001 | 0.005 | 0.8 | 0.0001 | 9.5 | 0.00001 | 0.00001 | 6.5 | 65.4 |
Table 6.
Maximum recyclable metals from PV module waste in 2080.
| Maximum Recycling Rates (%) | Maximum Recyclable Amount (ton) | Share (%) | |
|---|---|---|---|
| Ag | 95 | 3153.8 | 0.30% |
| Al | 99.97 | 948,221.4 | 90.37% |
| Cu | 100 | 42,197.3 | 4.02% |
| Mg | 33 | 9883.1 | 0.94% |
| Ni | 41 | 25.0 | 0.00% |
| Pb | 96 | 258.1 | 0.02% |
| Si | 99.9 | 45,512.60 | 4.34% |
| Sn | 32 | 1.1 | 0.00% |
| Ti | 52 | 0.2 | 0.00% |
| Zn | 27 | 0.1 | 0.00% |
| Total | 1,049,252.6 |
© 2018 by the authors. Licensee MDPI, Basel, Switzerland. This article is an open access article distributed under the terms and conditions of the Creative Commons Attribution (CC BY) license (http://creativecommons.org/licenses/by/4.0/).
Share and Cite
MDPI and ACS Style
Kim, H.; Park, H. PV Waste Management at the Crossroads of Circular Economy and Energy Transition: The Case of South Korea. Sustainability 2018, 10, 3565. https://doi.org/10.3390/su10103565
AMA Style
Kim H, Park H. PV Waste Management at the Crossroads of Circular Economy and Energy Transition: The Case of South Korea. Sustainability. 2018; 10(10):3565. https://doi.org/10.3390/su10103565
Chicago/Turabian StyleKim, Hana, and Hun Park. 2018. "PV Waste Management at the Crossroads of Circular Economy and Energy Transition: The Case of South Korea" Sustainability 10, no. 10: 3565. https://doi.org/10.3390/su10103565
Note that from the first issue of 2016, this journal uses article numbers instead of page numbers. See further details here.