Social Impacts of Dam-Induced Displacement and Resettlement: A Comparative Case Study in China

1
Department of Construction and Real Estate, Southeast University, Nanjing 211189, China
2
Department of Architecture and Civil Engineering, The City University of Hong Kong, Hong Kong, China
*
Author to whom correspondence should be addressed.
Sustainability 2018, 10(11), 4018; https://doi.org/10.3390/su10114018
Submission received: 1 August 2018
/
Revised: 7 October 2018
/
Accepted: 17 October 2018
/
Published: 2 November 2018
(This article belongs to the Special Issue Innovative Management Practice for Resilience and Sustainability of Civil Infrastructures)
Abstract
:Dam projects are inevitably accompanied by massive displacement and resettlement, which imposes intricate social impacts on the host community. This study aims to investigate the social impacts of dam-induced displacement and resettlement in China through a comparative case study where both the control and experimental groups were investigated. Data were collected through a mix of questionnaire-survey, archival files, and face-to-face interviews. The results show that dam-induced displacement and resettlement was conducive to improving residence conditions and facilitating the acceptance of rural cooperative medical insurance. But it had negative impacts on employment, income level and income resource, and overall well-being. Implications for theory and for practice are provided in the end.
1. Introduction
By 2017, there were 58,519 dam projects in operation globally [1] and China had nearly half of these projects [2]. Dams play an important role in accelerating economic, societal development and improving public service quality by providing irrigation, flood protection, and hydroelectricity [3]. Although schedule delay and significant cost overrun of dam projects have been fiercely discussed [3,4,5], a significant challenge facing the construction and operation of dam projects is the intricate social impacts imposed on the host community [3,4,5]. Empirical studies found that dam projects may worsen the living conditions of a significant number of people, especially those who are displaced.
One important aspect of the social impacts caused by dam projects is involuntary displacement and resettlement [3,4,6]. It is estimated that there were approximate 40–80 million people who were subjected to dam-induced displacement and resettlement from 1950 to 2000 [3,7]. The dam-induced displacement and resettlement brought about considerable impacts on the societal stability and livelihoods of the displaced people. Therefore, assessing social impacts caused by dam-induced displacement and resettlement and mitigating the adverse social impacts would be of great importance to dam project development in particular and sustainable development in general.
In order to assess the social impacts of dam projects, it is common to request for the respondents to recall conditions before or after the displacement and resettlement. However, it appears to be difficult to assess the social impacts that have resulted from a specific dam project given that host communities are inevitably exposed to multiple interventions [8,9]. The limitation in the methodological issue constitutes the gap in knowledge.
The objective of this research was to compare the social impacts of dam-induced displacement and resettlement before and after the development through a comparative case study. Comparative case study was chosen where control and experimental groups were investigated. The use of comparative case study could help to increase the reliability of the social impact assessment results. The social impacts include the impacts on employment, income, consumption, recreation, residence conditions, social network, social security, and well-being.
The remainder of this paper is organized as follows. Section 2 presents the literature review of social impacts of dam projects, and dam-induced displacement and resettlement. The research method of the comparative case study is shown in Section 3. It is followed by the elaboration of the key results in Section 4. Discussion and implication for theory and practices are provided in Section 5 and Section 6 respectively.
2. Literature Review
2.1. Social Impacts of the Dam Project
Social impact assessment provides decision-makers with proper strategies to cope with adverse social impacts of the development projects [5]. It is common to examine the social impacts of dam projects through a series of qualitative and quantitative indicators (see Table 1).
Several frameworks were proposed for assessing the social impacts of development projects in general. Cernea (2000) summarized nine social risks facing project development: landlessness, joblessness, homelessness, marginalization, food insecurity, increasing morbidity, loss of access to common property resources, education loss, and social disarticulation [7]. DIFD (1999) provided a sustainable livelihood framework, which comprised human capital, natural capital, financial capital, physical capital, and social capital [10]. The sustainable livelihood framework was applied to assess the livelihood changes in hydropower projects along the Mekong River [14]
There are also frameworks established for assessing dam projects in particular. Kibler et al. (2012) developed an integrated dam assessment (IDAM) and divided socioeconomic impacts into social cohesion, cultural knowledge, material culture, infrastructure, income, wealth, and macro impacts [11]. They tested this model in the Lancang and Nu River Mainstream dams. Wang et al. (2013) proposed a wealth analytical framework and applied it to the dam projects on the Upper-Mekong River [12]. The framework comprised material wealth (e.g., farmland, house, livestock, cash crops etc.), embodied wealth (e.g., agricultural skill, fishery and ferry, and business skill) and relational wealth (e.g., social infrastructure: social network, language, customs, physical infrastructure, transportation, and healthcare). Kirchherr and Charles (2016), through examining research related to 217 dam projects, developed a systematical matrix framework, which contained impacts on infrastructure (electricity, irrigation & water, flood control, roads & transportation), livelihood land and house (land & housing, income & employment, health & nutrition), and community (social cohesion, cultural change) [13]. These three dimensions span across space (e.g., upstream, downstream), time (e.g., design, construction, operation) and value (positive and negative).
Despite abundant research on the social impacts of dam projects [14], a commonly recognized framework is absent [13]. One reason may be the high level of the complexity of dams’ social impacts, which occur over time, space and value dimensions [13]. To assess the social impacts of dam projects, studies often adopt differentiated assessment frameworks (see Table 2). For instance, Fearnside (1999) investigated the Tucuruí dam in Brazil through the framework of the displaced population, downstream residents, indigenous people, health and economic distortion [15]. Tilt et al. (2009) examined the Manwan dam projects and Lesotho Highlands water projects using the framework based on the impact on the rural economy, transportation, housing, culture, health, and gender [16]. Égré and Senécal (2003) investigated the social impacts of Three Gorges Project in terms of the loss of landmark associated with an ancient cult, the redistribution of contracted land, job conversion to the nonagricultural sector in a rural area and living condition, reduction in social cohesion, the closure of outcome factories in the urban area [6].
One significant challenge facing the assessment of social impacts of dam projects is the differentiated impacts on diverse groups or regions. Mathur (2011) found that social impacts are often severe for vulnerable groups, such as tribal groups, female household, elderly persons, landless persons and the poor [22]. Tulsi (2009) identified that the Tehri dam in India had different social impacts on women and men [23]. Tilt, Braun and He (2009) found that some social impacts (e.g., increased labor allocation and nutritional deficiencies) are stronger on women, children and poor families in the Lesotho Highlands Water Project [16].
A few limitations exist in the extant research. From the methodology perspective, the assessment exercise requested subjects influenced by the displacement and resettlement to recall changes in the social conditions. However, this method might not be able to present an accurate recall of the conditions that took place multiple years in the past. In addition, the community as a coupled socio-ecology system is exposed to multiple interventions [24]. Therefore, it is difficult to prevent noise conditions when assessing social impacts that result from a specific dam project [25].
2.2. Dam-Induced Displacement and Resettlement
Previous studies found that dam-induced displacement and resettlement have negative impacts on the socio-economic conditions of the local regions (e.g., [29,30]). For instance, Cernea (1988) identified that resettlement would cause disruption by causing impoverishment of host communities, destruction of productive assets, and disruption of the social fabric [31]. Relocated people suffer from the loss of farmland, forestland, houses and other properties, which may then reduce their income and their possibilities of reemployment [12]. Dwivedi (2002) added that displacement and resettlement could result in asset and job losses, the breakdown of the social and food security, credit, labor exchanges, networks, social capital and kinship ties [32]. In addition, Heggelund (2010) found that the resettlement in Three Gorges Project relocated local people to different places, which caused their social networks to become disconnected and also led to potential conflicts with the new host community [33]. Tilt and Gerkey (2016) explored that resettlement is associated with diminished social capital in the inter-household exchange of financial resources, and inter-household exchange of agricultural labor [2]. The World Commission on Dams (2000a) found that resettlement plans primarily focused on physical relocation and paid less attention to the social impacts on the displaced [3]. Also, the compensation was often inadequate for restoring the lives of displaced [3].
Meanwhile, studies also supported that dam-induced resettlement might bring about positive social impacts. McDonald et al. (2008) found resettlement could have positive impacts on maintaining and raising the income level of the resettled community [34]. Galipeau et al. (2013) compared the difference between a resettled community and a non-resettled community in term of income and landholding, showing that resettled communities have a higher income level [25]. Other benefits comprised improved transportation and residence conditions [16].
In China, studies found that development-induced resettlement is associated with a range of negative impacts on communities, such as reduced land holdings [35], reduced access to natural resources and ecological services [36,37], declined household incomes [16], wider inter-household and inter-community economic disparities [12], and diminished mental health and well-being [38].
Besides these, it is also found that the impacts of the displacement and resettlement plans on the resettled people are not always consistent over different regions and groups [39]. McDonald et al. (2004) investigated different villages after resettlement caused by Xiaolangdi dam project and found that some villages have higher incomes than others [21]. Wang et al. (2013) compared far-relocated people with the near-relocated people and found that far-relocated people have higher living standards, since they obtain advantages in housing conditions, possession of farmland and access to new information and techniques [12].
3. Comparative Case Study
3.1. Project Background
Project Gangkouwan was selected as a typical case. It is located in the middle of China, serving the multiple functions of power generation, irrigation, aquaculture, and tourism. The dam covered 1120 m2 land and created a 32.8 m2 reservoir. Besides this, the dam project was equipped with a full reservoir capacity of 940 million m3 and a storage capacity of 430 million m3.
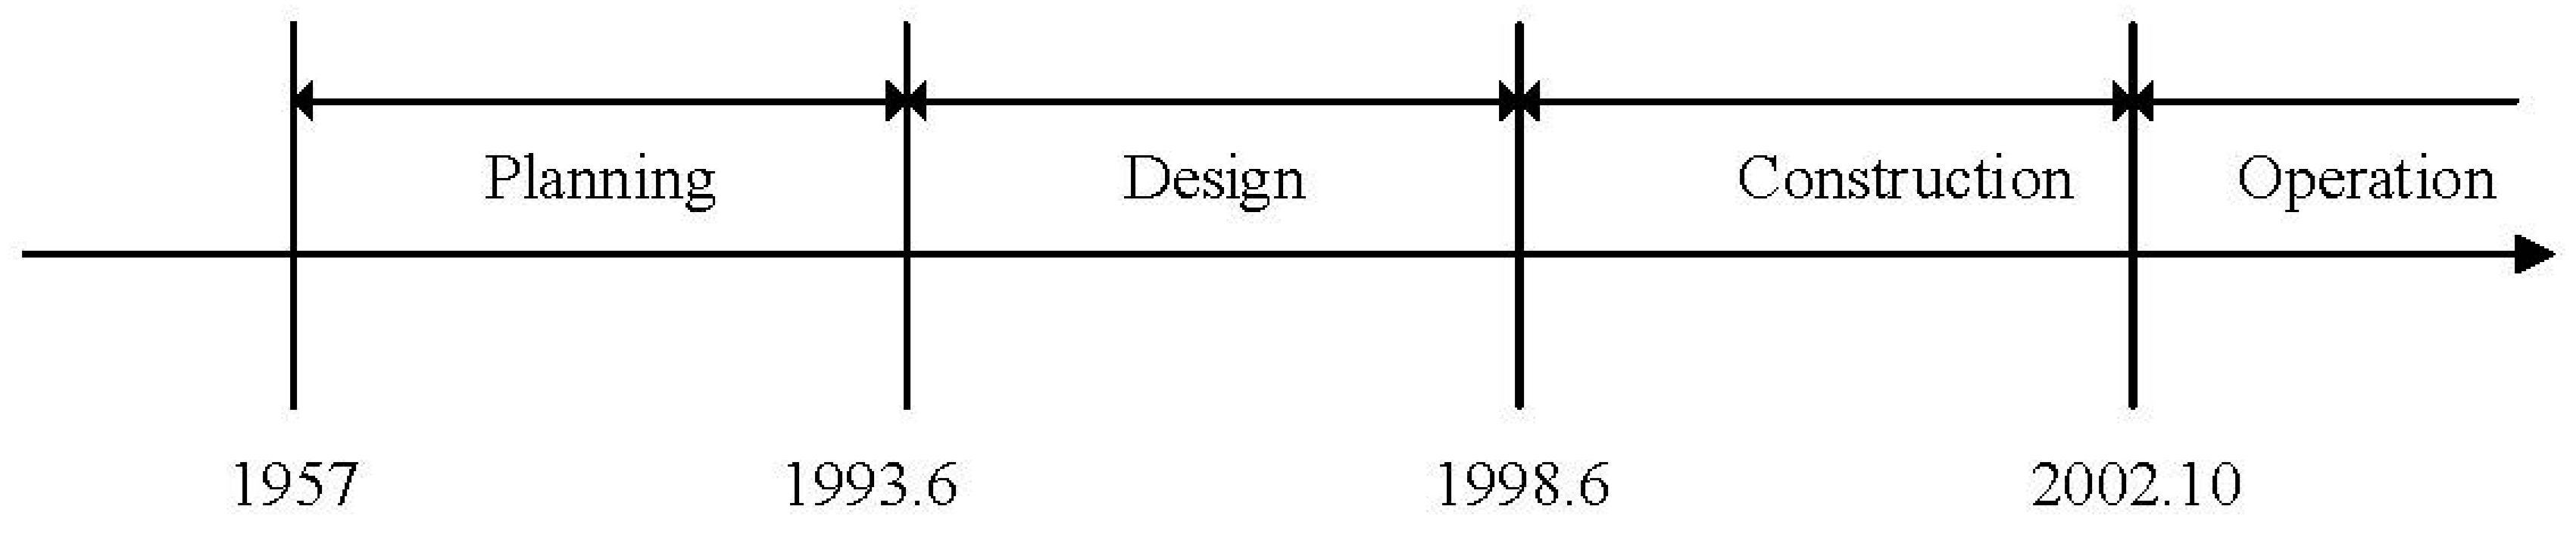
The construction of the project started in October 1998 and came into operation in October 2002 (see Figure 1). It took 2.5 years to complete the displacement and resettlement, which affected 5 towns, 21 communities, 138 villages, 120 companies, 4 690 families and 18 324 persons as a whole.
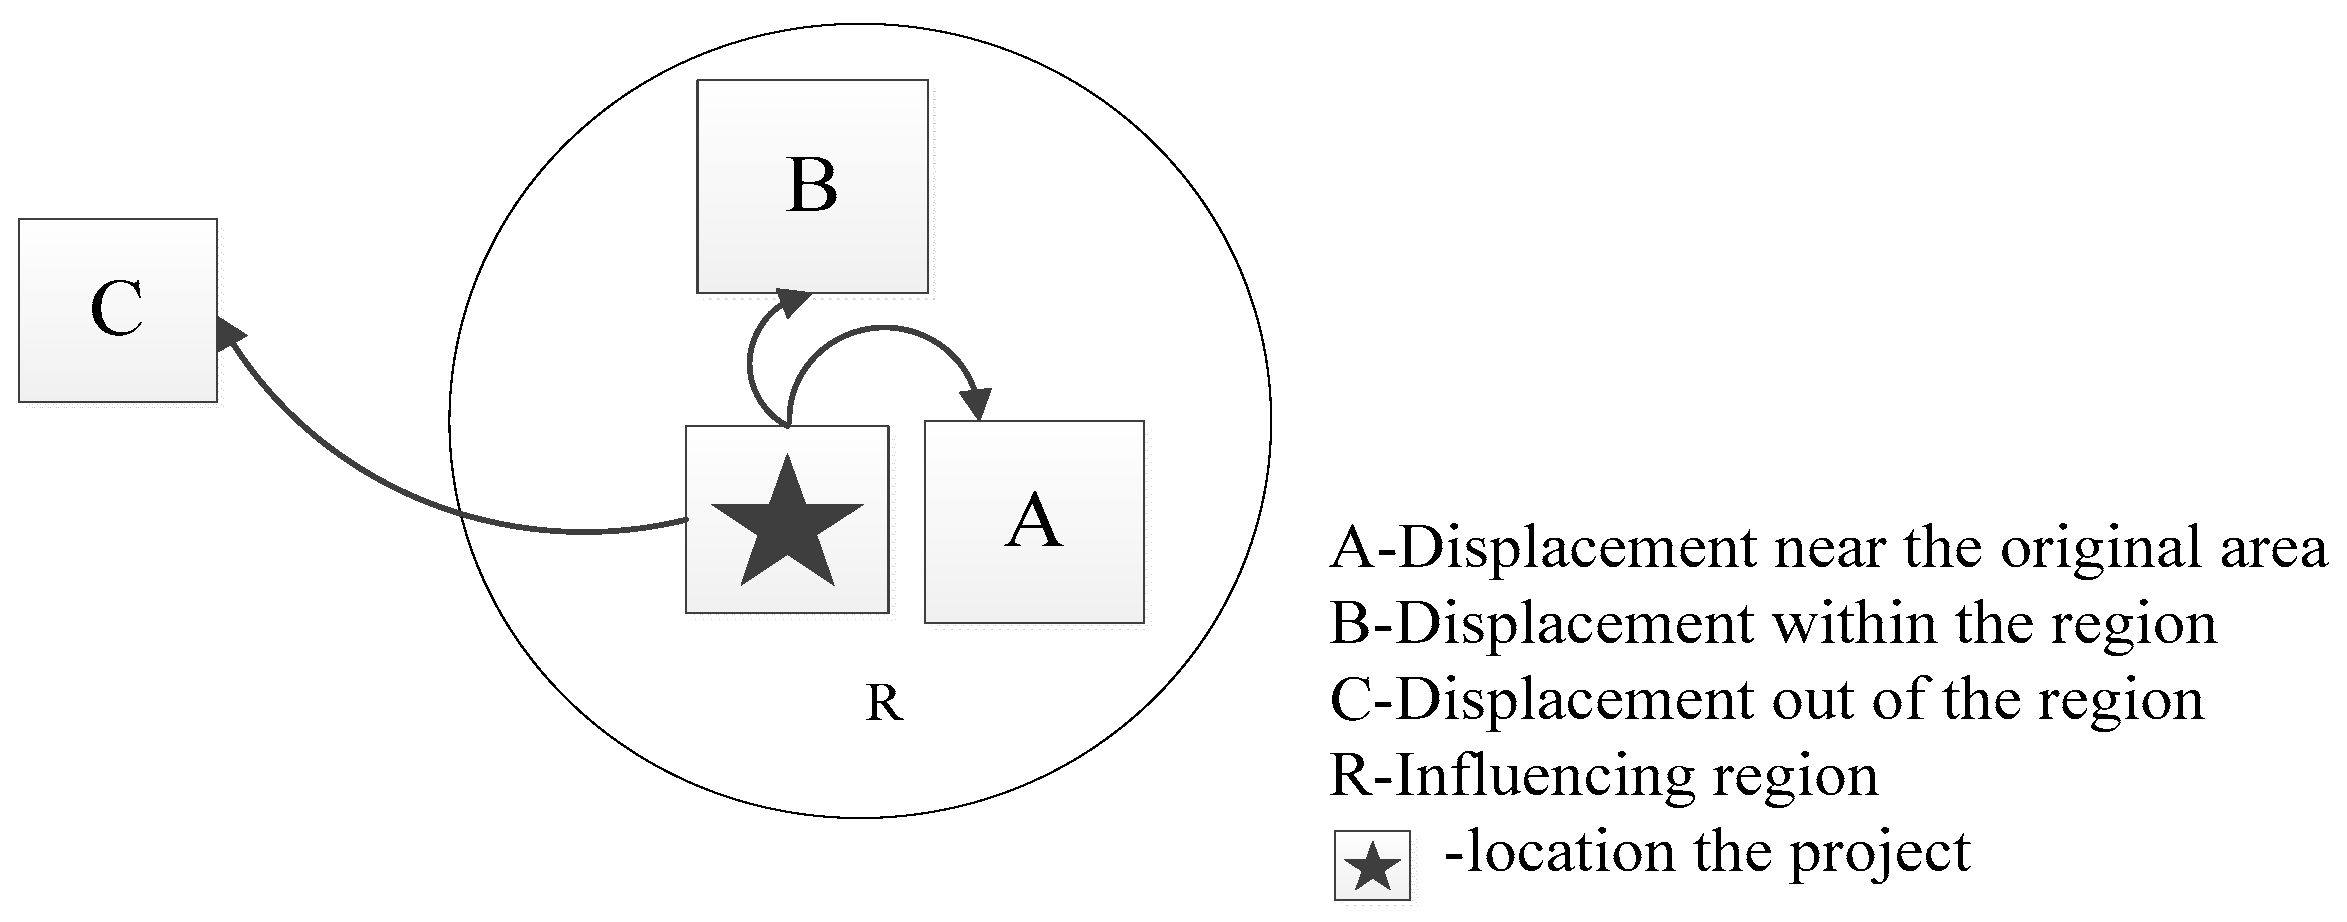
Two types of displacement and resettlement plans were implemented, namely near-resettlement and far-resettlement (see Figure 2). The former referred to the plan of resettling people into a nearby region (points A and B in Figure 2). By contrast, the latter required people to move out far away from their original community (point C in Figure 2).
Table 3 illustrates the primary differences between the two plans. Near-resettled people received a lump-sum cash compensation and a small proportion of compensation land. Those who resettled outside the region got a higher proportion of land compensation and monetary compensation. In Group B1, people took responsibility for building their houses as they got cash and land compensation from the government. However, in Group B2, local government was responsible for constructing the houses.
3.2. Sampling Strategies
Comparative case studies were undertaken where the experimental group (Group B) and control group (Group A) were sampled (see profiles of the case in Table 4). The experimental group refers to the community where people were impacted by the project. Within Group B, two subgroups were selected based on the resettlement plans (Group B1 and Group B2). By contrast, another group that was not affected by the dam project but shared similar demographic conditions with experimental group B was identified as the control group (Group A). Such a comparison between the control group and experimental group could help to explicate the social impact and to minimize noises from other interventions.
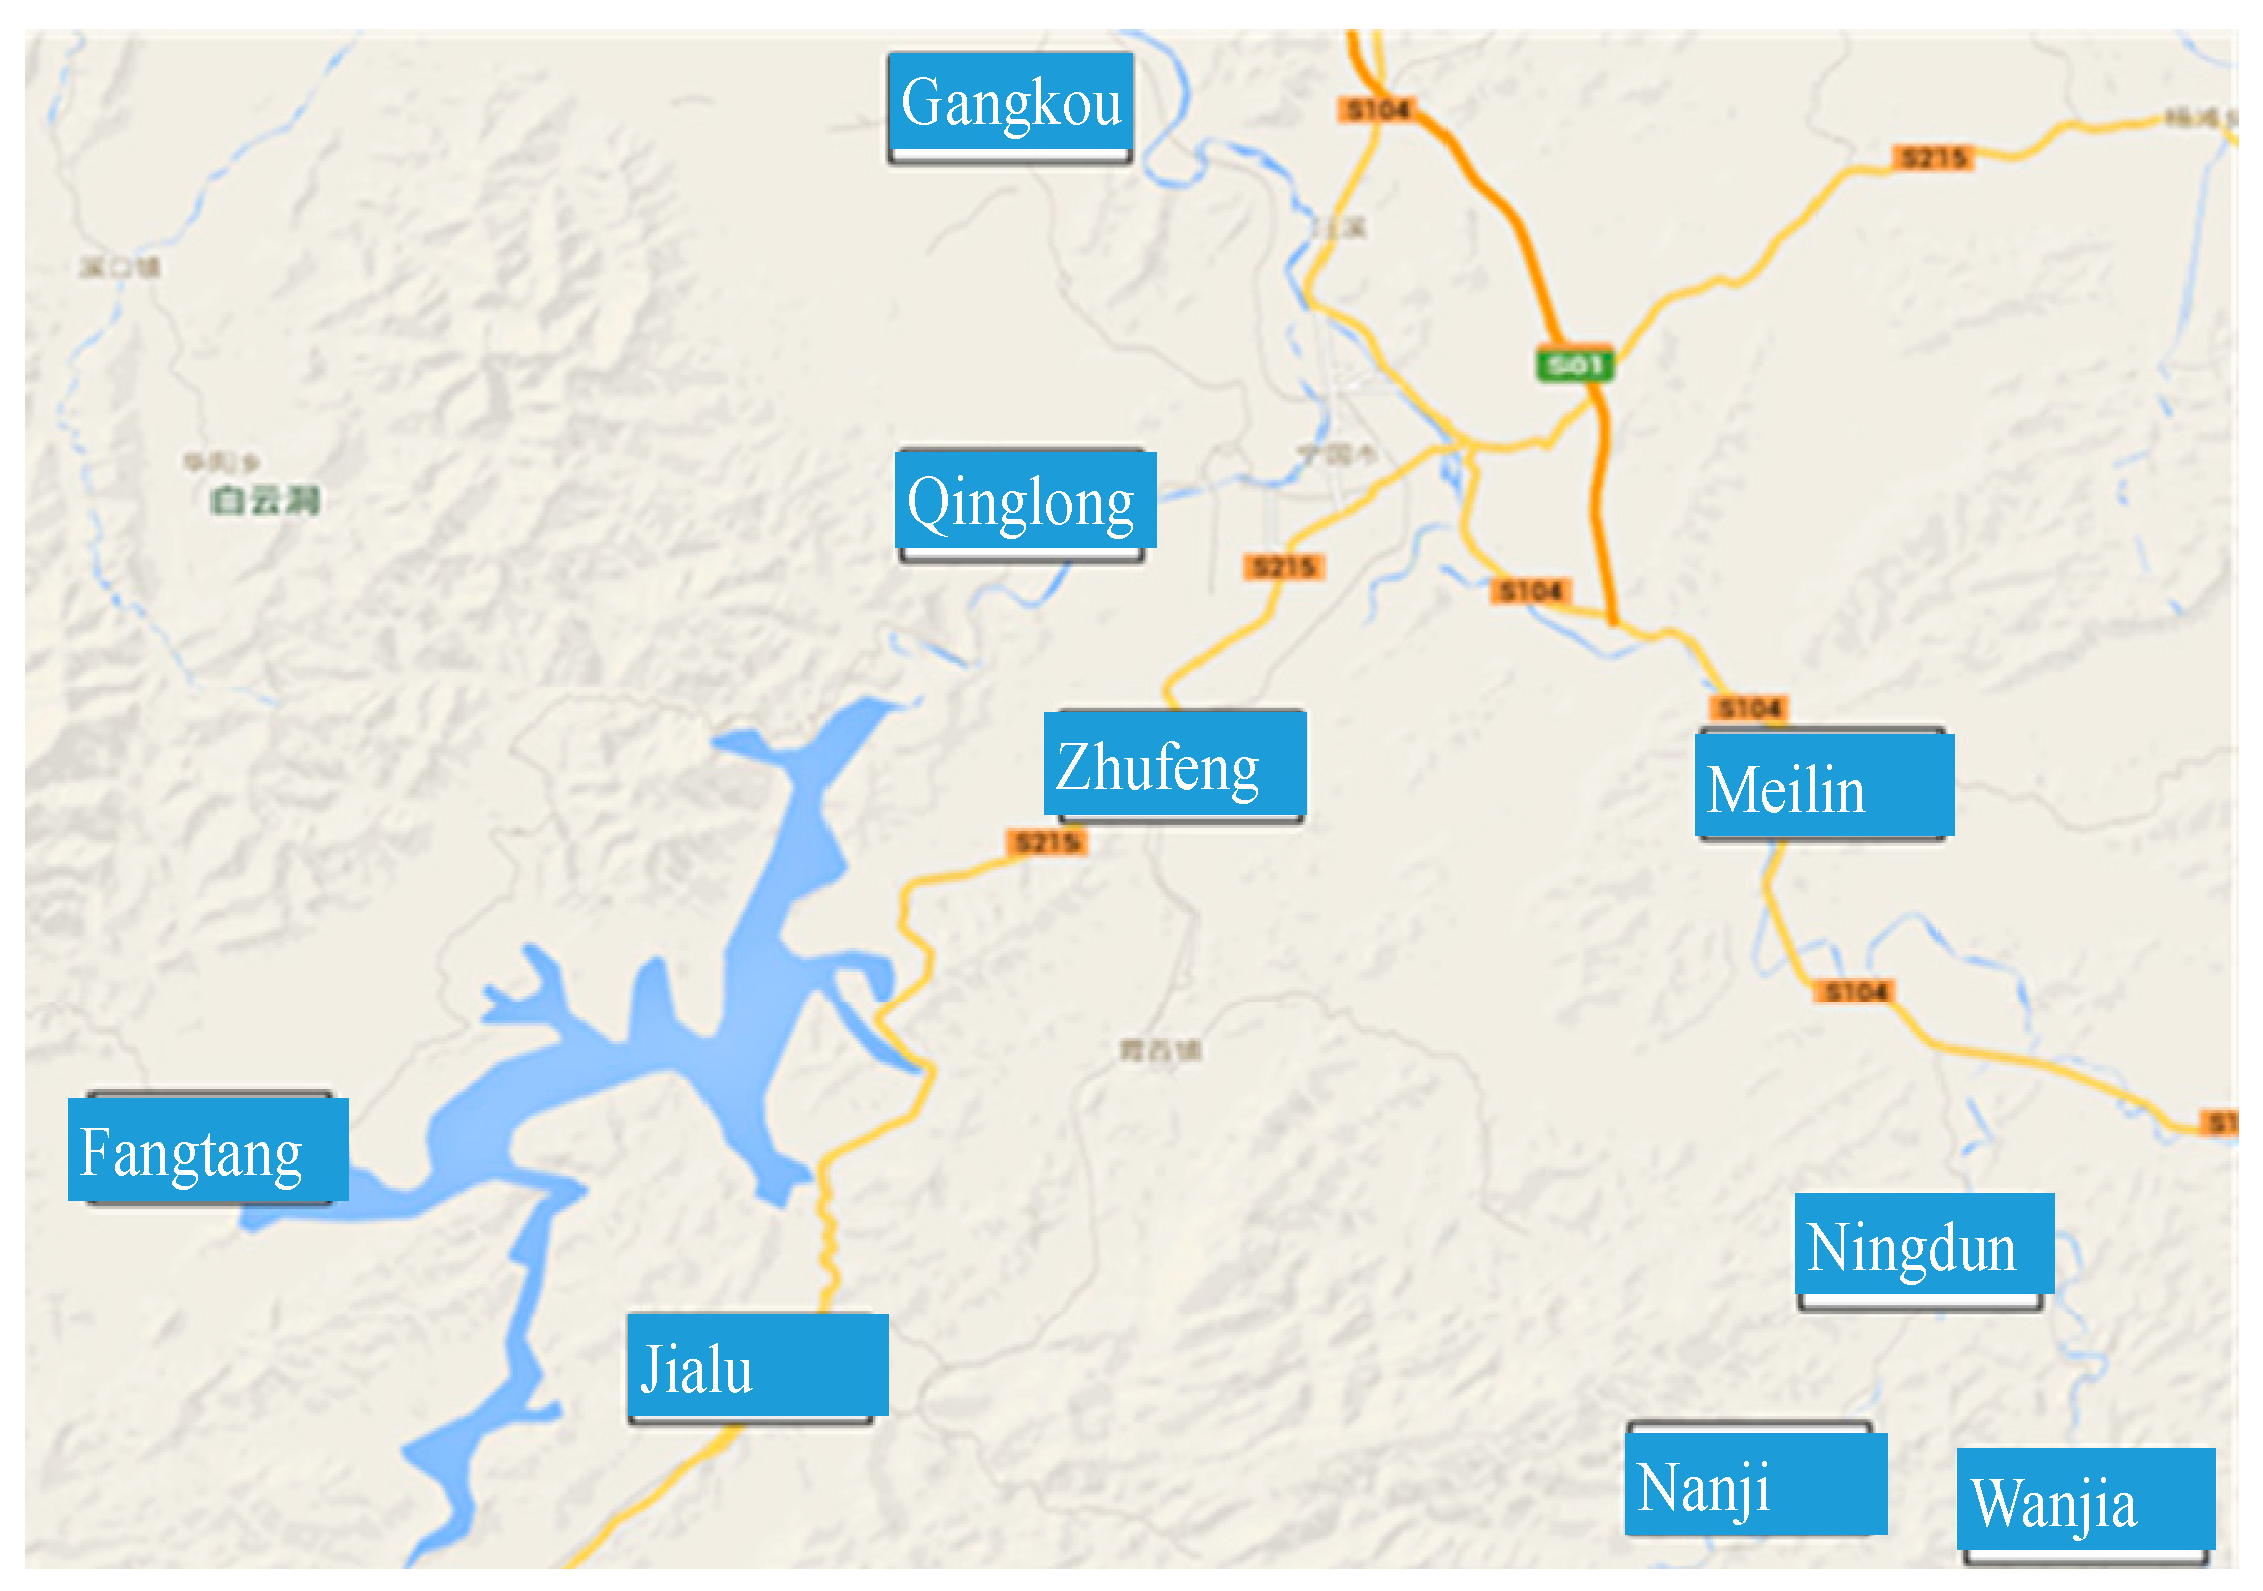
Gangkou, Qinglong, Zhufeng, Fangtang, and Jialu were sampled in Group B1 (see Figure 3), which adopted the near-resettlement plan. Under the far-resettlement plan, people resettled in Juntianhu was chosen as Group B2. Meilin, Ningdun, Wanjiaxiang, Nanji had much common with the experimental group in population and GDP, thereby justifying selecting them as a control group (Group A).
3.3. Questionnaire Design
A structured-questionnaire was adopted to collect data. The questionnaire comprised eight factors (see Table 5). These are employment, income, consumption, recreation, residence conditions, social network, social security, and well-being.
The impacts on employment were investigated through the questions: What was your family member’s occupation before and after the construction (Q1). The impact on income was represented by two aspects: How much was your family annual income before and after the construction (Q2); what kind of income source did your family have before the project and how did they change after the project (Q3). Two questions, how much was your family’s monthly consumption expenses before and after the project (Q4) and what was your family consumption attitude before and after the project (Q5), were designed to investigate the impact on the consumption? To obtain the impact on recreation, one question was designed: How much leisure time did you have every day (Q6). Residence conditions were operationalized into two ways: Residence areas (Q7) and residence type (Q8). Family relationships (Q9) and neighborhood relationships (Q10) compared with the past were the factors related to the impact on social networks. What kind of insurance did you purchase before and after the project (Q11) and a question regarding overall well-being toward current conditions compared with before the project (Q12) were asked in the end.
3.4. Data Collection
The unit of analysis was the individual household and unit of observation was the personal level. Face-to-face interviews through structured-questionnaire were employed to collect data. The sampling strategy was convenience sampling. This is because it is not known that whether the persons live in the villages as many have jobs in urban cities. In addition, sending questionnaires by post would be less effective given that the respondents were not used to using postal mails. Face-to-face interviews were advantageous for obtaining qualitative information, which was used to verify the survey results.
4. Results
4.1. Comparison between the before and after Resettlement
Table 7 presents the comparison results between Groups A and B before and after the resettlement using a paired t-test. The results showed that significant changes took place in the following factors: Employment for the older generation, income level, income source, residence type, and well-being.
4.1.1. Change of Employment Status
(1) Employment Rate (Q1)
Table 8 shows that before the project, unemployment for the older generation only accounted for a small proportion of the overall group (A 9.2%, B1 13.8%, and B 2 3.8%). By contrast, unemployment of Group B had a great increase after the project, especially for group B1 (from 13.8% to 30.3%). However, Group A’s unemployment rate decreased slightly from 9.2% to 4.2%. Therefore, it might be inferred that this project caused negative impacts on the employment rate. The interview results showed that the employment difference between Group B1 and B2 resulted from the resettlement and compensation plan. Group B2 were displaced in Junitianhu far away from the original location. However, they received a mix of land and monetary compensation. Thus, they were able to continue as farmers (Code #9). By contrast, Group B1 only received a lump-sum monetary compensation without any natural resources. They would be more vulnerable to job changes.
(2) Employment Structure (Q1)
Table 8 shows that over 60% of the respondents were formerly farmers in the older generation group. After the project, occupations of Groups A and B2 remained as in the past. But Group B1 had a significant change, with the occupation of farmers declining from 62% to 26.9%. The interview results showed that Group B1 had no farmland or other natural resources. Thus, they were forced to seek for other job opportunities. This finding was also supported by the results in Table 6. In the past, the employment rate for the older generation indicated no significant difference. Yet, a significant difference appeared after the resettlement. This indicated that the resettlement caused significant impacts on employment for the older generation.
As the young generation was at school when the project was constructed, only present occupations were investigated. Unlike the older generation which had a big proportion of farmers, the younger generation had mixed occupation types. The comparison between different groups showed no significant difference (Table 7). This might suggest that this project did not have a significant impact on occupations for the younger generation.
4.1.2. Change of Income
(1) Income Level (Q2)
Table 7 showed that before the project, the income level among the three groups had a non-significant difference. However, after this project, a significant difference among groups appeared. Therefore, this result supported that this project had a significant impact on income levels.
The results showed that before the project, the majority fell into the category of below 30,000 RMB, and only a small proportion reached over 30,000 RMB. By contrast, the present income level reached 30,000 to 50,000 RMB (see Table 9). Although all groups had a noticeable rise in income, there was a significant difference between before and after the resettlement, which also further supported the theory that this project had impacts on the income level.
(2) Income Source (Q3)
Table 7 showed the differences in areas of income obtained from farmland, forestland, livestock breeding, fishing farming, dividend share, minimum living allowance, retirement pensions, and land compensation and fund while other sources of income remained stable. This supported the theory that this project had impacts on the income source. The interview corroborated this finding that the vast majority of resettled people suffered from the loss of traditional income sources (e.g., farmland, forest, and fishing) since the dam project inundate a large area of land and villages. However, they had another income source, for instance, monetary compensation and other properties from the local government or incomes obtained from small business. In conclusion, this project significantly changed the sources of income.
4.1.3. Change of Consumption
(1) Consumptions (Q4)
Table 10 showed that in the past, the consumption level of the majority of Groups A, B1, B2 remained under 500 RMB per month, accounting for 71.5%, 79.8%, and 79.6% respectively. However, 78.1%, 81.3% and 89.9% of these groups reached over 500 RMB per month after the project. Given that the difference between the experimental group and control group was not significant, it was inferred that this increase was not attributed to the project. Respondents also explained that the increase in consumption expenditure was caused by the rise in the costs of goods and products, as well as due to economic development.
(2) Consumption Attitude (Q5)
Table 10 showed that over half respondents (51.6%, 65.7%, and 59.2%) had low income, which was the main consumption status in the past. However, the consumption status became more diversified after the project. The percentage of persons who had a low income and were living frugally decreased, while other consumption attitudes increased. However, Table 7 showed that the changes in consumption attitude were not directly caused by the project. Therefore, it is inferred that this project had not caused changes towards consumption attitudes.
4.1.4. Change of Recreation Style
(1) Leisure Time (Q6)
4.1.5. Change of Residence Condition
(1) Residence Areas (Q7)
Table 10 shows that at present people had more residence areas, with an increase of 50.16%, 32.23% and 60.05% for Groups B1, B2 and A respectively. However, Table 7 indicated that there was no significant difference among groups for before and present. The evidence together supported that this project has no significant impacts on the residence areas.
(2) Residence Type (Q8)
Table 12 showed that bungalows gained popularity in the past; only a small proportion lived in two to three-story buildings. At present, the percentage of bungalows has declined dramatically, while two-three story buildings have increased, making up 70.8%, 59.0% and 83.7% for Groups A, B1, and B2 respectively. Besides this, a small proportion of the surveyed population lived in multi-story residential buildings. Table 7 showed that in the past, a significant difference was observed among the three groups in the past, but the difference did not exist after the project. Thus, it could be inferred that the dam project had significant impacts on the residence type.
4.1.6. Change of Social Network
(1) Family Relationship Quality (Q9)
As shown in Table 13, the majority of respondents reported a closer family relationship than in the past. Although the percentage of Group B1 indicating this was lower than Group B2 and Group A, Table 6 showed there was no significant difference. Therefore, it can be inferred that the dam project did not have significant impacts on family relationships.
(2) Neighbor Relationship Quality (Q10)
Similar to the family relationship, 78.9%, 76.7% and 84.8% of respondents fell into close and very close in terms of neighbor relationship quality and no significant difference existed among the groups (see Table 6). This supported the theory that this dam project had no significant impacts on the quality of relationships with neighbors.
4.1.7. Social Insurance Plan
(1) Social Insurance (Q11)
Before the project, the vast majority of the respondents had no social insurance. After the project, the majority of the respondents indicated that they had rural endowment insurance, Groups B1, B2 and A constituted 57.3%, 75.5%, 79.8% respectively. Meanwhile, 93.9%, 98%, 92.1% of Groups B1, B2 and A respondents chose the rural cooperative medical insurance. Other types of insurances were also purchased by a small proportion such as urban medical insurance and commercial insurance. Compared with Group A, this project had a significantly positive effect on Group B2 in terms of purchasing rural cooperative medical insurance (see Table 14). Therefore, it was concluded that this project had a positive impact on the purchase of rural cooperative medical insurance.
4.1.8. Overall Wellbeing (Q12)
Table 12 shows that the well-being of Group B1 (47.6%) and Group B2 (59.2%) was noticeably lower than that of Group A (93.4%). Also, Table 6 showed that significant differences appeared between groups A and B. Therefore, it could be concluded that this project had significant negative impacts on the overall well-being.
5. Discussion
5.1. Mixed Social Impacts on the Host Communities
The comparative case study identified that the host communities received mixed social impacts from the dam project. This is in line with the report of World Commission on Dams (2000a) [3]. On one hand, the dam project brought about positive impacts on residence types and residents’ social insurance. Unlike the Manwan dam project which resulted in worse residence conditions [6], the majority of respondents, in this case, were satisfied with their current residence conditions. In the past, the majority chose bungalows. Group B1, previously being in a remote area, was resettled to a region with better transportation and infrastructure conditions. Meanwhile, the monetary compensation they received was helpful for rebuilding a house.
The results also supported the idea that the dam project had a positive impact on social insurance. This result has not been found by previous studies. Displaced people showed a high acceptance of rural cooperative medical insurance. The respondents indicated that the disruption to their livelihood caused by the resettlement intensified their concerns regarding healthcare and social security. The rural cooperative medical insurance helped to lessen their concerns. Thus, it could be inferred that the dam project increased the acceptance of social insurance.
On the other hand, this project brought about negative impacts on the host community in terms of employment rate, income level, income source, and overall wellbeing. It was identified that the impact on employment structure was significant in terms of the unemployment rate and changed farmer-based employment. In line with other dam projects, residents’ forests and wooded area were submerged in the reservoir and some of the best arable lands were lost in the river basin area [46]. These changes in production asset reduced income from farming. This finding is consistent with Three Gorges Project [41] and dams on the Mekong River [14].
Meanwhile, it is found that the dam project had not brought about job opportunities for the host communities. This was inconsistent with Galipeau et al. (2013) [25] who indicated that that one significant controversy over the social impacts of dam project was the availability of jobs opportunities for local people. Before the project, the primary income source for local people was farming and timber production. However, the dam project deprived the community of natural resources. The local community was thus confronted with significant changes in their income structures and natural production assets. Due to a lack of natural resources, displaced people had to seek new jobs such as working in factories and starting small businesses. However, due to the lack of professional skills and qualification, a large proportion cannot find satisfactory jobs. These factors together resulted in a noticeably increased unemployment rate.
It was also found that the dam project caused negative impacts on overall well-being. While there were some benefits for local residents (e.g., improved housing conditions, new roads, and other public infrastructure), many residents suffered from the disruption of livelihood. Thus, the percentage of being satisfied with their life in Group A was higher than that of Group B, indicating that the project reduced satisfaction. This was consistent with Scudder (2005) [45]. Besides this, some respondents showed disappointment towards the compensation package and distrusted the local government. These factors together reduced the overall wellbeing.
5.2. Divergent Impacts of Displacement and Resettlement Plans
This study identified that resettlement plans had significant impacts on displaced communities. In this project, Group B2 relocated out of the original region received land for land compensation and cash compensation while Group B1 relocated within the region was just compensated for a small proportion of land and a lump-sum monetary compensation. This compensation package was similar to Wang et al. (2013) [12] who found that in the Manwan dam project and Daochao dam project, near-relocated people got compensation of lump-sum payment and a small proportion of land, while far-relocated people were compensated with land-for-land as well as monetary compensation.
With less farmland, people in Group B1 had to seek other income sources, such as working in factories and self-employment. This was consistent with the research of Tilt et al. (2009) [16] and Chen (2008) [35]. Local people were forced to abandon their traditional farming livelihood activities (e.g., farming and timber production). Instead, they resorted to off-farm employment. However, not all people could succeed in self-employment or re-employment due to their limited professional skills. By contrast, Group B2 was compensated with sufficient land. Therefore, they could continue farming and maintain their traditional production and income source.
In addition, the results identified that resettlement plans had significant impacts on housing conditions. Far relocated people were given better housing than that of near-relocated people. This was also consistent with the findings of Wang et al. (2013) [12]. Before this project, near-relocated people (Group B1) lived in a remote mountain area with poor transportation and house conditions, which was worse than Group B2. Due to the displacement, Group B1 having been provided with land and cash compensation had an opportunity to rebuild and improve their living conditions. Unlike Group B2 adopting a uniform house style for house compensation, Group B1 could make a choice based on their financial capacity and personal preferences.
The third difference was pertaining to social insurance. The displacement induced by dam projects has impacts on social insurance. Respondents in Group B2 commented that in resettling in a new place, they were more concerned about their lives and long-term welfare compared with Group B1 which was resettled in the nearby region. Rural cooperation medical insurance, through providing healthcare service, can lessen their worries, thereby increasing their acceptance of the dam project.
The last difference was concerned with the extent to which displaced people were satisfied with their lives. The satisfaction level in Group B2 was significantly higher than Group B1. This was consistent with Wang et al. (2013) [12] who found that in most cases far-relocated people had better living conditions than that of near-relocated people. The interview results indicated that this might be caused by land compensation and housing compensation. Group B2 suffered from less disruption from the dam project because they have continued income and job opportunities. By contrast, Group B1 faced disrupted income from the loss of land and farmland. The loss of land and income would impair their capacity to cope with unexpected events [41].
6. Implications for Theory and Practice
6.1. Theoretical Implication
Through a comparative case study, this research identified the social impacts of dam-induced displacement and resettlement, which indicated that the dam project resulted in both positive and negative consequences. The findings showed that that dam-induced displacement and resettlement was conducive to improving residence conditions and promoting the acceptance of rural cooperative medical insurance. But it had negative impacts on employment, income level and income resource and overall well-being. The study also confirmed that houses and farmland were the most important possessions loss during dam construction [12]. However, the dam project had little impact on other factors, such as social networks, consumptions, and entertainment. Furthermore, the research added that the displacement of the dam project would prompt displaced people to accept rural medical insurance.
Form the methodological perspective, this study contributed a comparative case study approach to assessing social impacts of dam projects. The comparison between the experimental groups and control groups would help to reduce the noise from the recall-method, providing more reliable results.
6.2. Practical Implications
This study provided several practical implications. First, it was suggested that the compensation package is encouraged to incorporate physical assets, such as land or job opportunities and training programs. Monetary compensation alone might face great challenges in achieving a sustainable livelihood. For those who are vulnerable to the interventions, the government should take priority for land-for-land compensation. Land compensation could minimize the disruptions and maintain income source and livelihood capital. Second, it is recommended to identify the most vulnerable residents and provide them with project-related benefits, such as job opportunities or purchasing the construction materials from them. This could help to foster a good relationship between developers and local communities and to achieve livelihood restoration.
7. Conclusions
This study aimed to investigate the social impacts of dam-induced displacement and resettlement in China through a comparative case study where contrasting control and experimental groups were investigated. Data were collected through a mix of questionnaire-survey, archival files, and face-to-face interviews.
The case study results showed that dam-induced displacement and resettlement is conducive to improving residence conditions and promoting the acceptance of rural cooperative medical insurance. But it has negative impacts on employment rate, income level, income resource, and overall well-being. In addition, this study identified that different resettlement plans exert different impacts on the host community in terms of residence conditions, employment, income, and overall wellbeing.
There still exist several limitations for the research. One limitation is that this study focused on the Chinese context. It is important to note that displacement and resettlement plans vary in different regions. Thus, caution should be applied in generalizing to other contexts. Nevertheless, the methodological approach might be useful to probe into the social impacts of large dam projects worldwide. Another limitation is that this study requested that the respondents recall the conditions that took place years ago. Although the recall method has been widely adopted by social impact assessment research, the limitation is acknowledged. This study mainly investigated the social impacts of dam projects and failed to present a procedure on how to identify social impacts. Future studies that combine “what to assess” with “how to assess” are suggested. In addition, this study examined only one case in-depth. With the purpose of generalizing the findings to a wider context of dam projects, comparing multiple cases is suggested for future studies.
Author Contributions
Research administration, Y.H.; data collection, W.L.; data analysis: W.L., Y.N. and S.L.; writing, W.L., Y.N. and S.L.
Funding
This research is funded by the National Social Science Foundation (12BJY021), Hong Kong General Research Fund (9041988), City University of Hong Kong, Strategic research grant (7004633), National Natural Science Foundation of China (71502032; 71872039), and the Fundamental Research Funds for the Central Universities.
Conflicts of Interest
The authors declare no conflict of interest.
References
- ICOLD (International Commission on Large Dams). World Register of Dams, General Synthesis. Available online: http://www.icold-cigb.org/GB/World_register/general_synthesis.asp (accessed on 1 November 2018).
- Tilt, B.; Gerkey, D. Dams and population displacement on China’s Upper Mekong River: Implications for social capital and social–ecological resilience. Glob. Environ. Chang. 2016, 36, 153–162. [Google Scholar] [CrossRef] [Green Version]
- World Commission on Dams. Dams and Development: A New Framework for Decision-Making: The Report of the World Commission on Dams; Earthscan: Abingdon, UK, 2000. [Google Scholar]
- World Commission on Dams. Social Impact Assessment: WCD Thematic Review V. 2. Environmental and Social Assessment for Large Dams; World Commission on Dams: Cape Town, South Africa, 2000. [Google Scholar]
- Koirala, S.; Hill, D.; Morgan, R. Impacts of the delay in construction of a large scale hydropower project on potential displacees. Impact Assess. Proj. Apprais. 2017, 35, 106–116. [Google Scholar] [CrossRef]
- Égré, D.; Senécal, P. Social impact assessments of large dams throughout the world: Lessons learned over two decades. Impact Assess. Proj. Apprais. 2003, 21, 215–224. [Google Scholar] [CrossRef]
- Cernea, M.M.; Cernea, M.M.; Mcdowell, C. Risks, safeguards, and reconstruction: A model for population displacement and resettlement. Econ. Political Wkly. 2000, 35, 3659–3678. [Google Scholar]
- Vanclay, F. Conceptualising social impacts. Environ. Impact Assess. Rev. 2002, 22, 183–211. [Google Scholar] [CrossRef]
- Vanclay, F. Project-induced displacement and resettlement: From impoverishment risks to an opportunity for development? Impact Assess. Proj. Apprais. 2017, 35, 3–21. [Google Scholar] [CrossRef]
- DFID. Sustainable Livelihoods Guidance Sheets. 1999. Available online: http://www.worldfish.org/GCI/GCI_II_assets/Module%20A%20DFID%20Livelihood%20approach.pdf (accessed on 1 November 2018).
- Kibler, K.; Tullos, D.; Tilt, B.; Wolf, A.; Magee, D.; Foster-Moore, E.; Gassert, F. Integrative Dam Assessment Model (IDAM) Documentation: Users Guide to the IDAM Methodology and a Case Study from Southwestern China; Oregon State University: Corvallis, OR, USA, 2012; Available online: http://transboundarywaters.science.oregonstate.edu/sites/transboundarywaters.science.oregonstate.edu/files/Facilitations/IDAM%20Manual%20on%20Methodology%202012.pdf (accessed on 6 April 2017).
- Wang, P.; Lassoie, J.P.; Dong, S.; Morreale, S.J. A framework for social impact analysis of large dams: A case study of cascading dams on the Upper-Mekong River, China. J. Environ. Manag. 2013, 117, 131–140. [Google Scholar] [CrossRef] [PubMed]
- Kirchherr, J.; Charles, K.J. The social impacts of dams: A new framework for scholarly analysis. Environ. Impact Assess. Rev. 2016, 60, 99–114. [Google Scholar] [CrossRef] [Green Version]
- Kura, Y.; Joffre, O.; Laplante, B.; Sengvilaykham, B. Coping with resettlement: A livelihood adaptation analysis in the mekong river basin. Land Use Policy 2017, 60, 139–149. [Google Scholar] [CrossRef]
- Fearnside, P.M. Social impacts of Brazil’s tucuruí dam. Environ. Manag. 1999, 24, 483–495. [Google Scholar] [CrossRef]
- Tilt, B.; Braun, Y.; He, D. Social impacts of large dam projects: A comparison of international case studies and implications for best practice. J. Environ. Manag. 2009, 90, S249–S257. [Google Scholar] [CrossRef] [PubMed]
- Bui, T.M.H.; Schreinemachers, P.; Berger, T. Hydropower development in Vietnam: Involuntary resettlement and factors enabling rehabilitation. Land Use Policy 2013, 31, 536–544. [Google Scholar] [CrossRef]
- Hanna, P.; Vanclay, F.; Langdon, E.J.; Arts, J. The importance of cultural aspects in impact assessment and project development: Reflections from a case study of a hydroelectric dam in Brazil. Impact Assess. Proj. Apprais. 2016, 34, 306–318. [Google Scholar] [CrossRef]
- Sayatham, M.; Suhardiman, D. Hydropower resettlement and livelihood adaptation: The Nam Mang 3 project in Laos. Water Resour. Rural Dev. 2015, 5, 17–30. [Google Scholar] [CrossRef]
- Sikka, G.; Mathur, V. Gender Analysis of Post Resettlement Transformation in Livelihood Opportunities at Sardar Sarovar Project Resettlement Sites, India. J. Land Rural Stud. 2018, 6, 1–14. [Google Scholar] [CrossRef]
- Webber, M.; McDonald, B. Involuntary resettlement, production and income: Evidence from Xiaolangdi, PRC. World Dev. 2004, 32, 673–690. [Google Scholar] [CrossRef]
- Mathur, H.M. Social impact assessment: A tool for planning better resettlement. Soc. Chang. 2011, 41, 97–120. [Google Scholar] [CrossRef]
- Bisht, T.C. Development-induced displacement and women: The case of the tehri dam, India. Asia Pac. J. Anthropol. 2009, 10, 301–317. [Google Scholar] [CrossRef]
- Turner, B.L.; Kasperson, R.E.; Matson, P.A.; McCarthy, J.J.; Corell, R.W.; Christensen, L.; Polsky, C. A framework for vulnerability analysis in sustainability science. In Proceedings of the National Academy of Sciences, Worcester, MA, USA, 7 March 2003; pp. 8074–8079. [Google Scholar]
- Galipeau, B.A.; Ingman, M.; Tilt, B. Dam-induced displacement and agricultural livelihoods in China’s Mekong Basin. Hum. Ecol. 2013, 41, 437–446. [Google Scholar] [CrossRef]
- Parkins, J.R.; Mitchell, R.E. Social impact assessment: a review of academic and practitioner perspectives and emerging approaches. In Environmental Impact Assessment: Practice and Participation, 3rd ed.; Hanna, K.S., Ed.; Oxford University Press: Toronto, ON, Canada, 2016; pp. 122–140. [Google Scholar]
- Huang, Y.; Ning, Y.; Zhang, T.; Fei, Y. Public acceptance of waste incineration power plants in China: Comparative case studies. Habitat Int. 2015, 47, 11–19. [Google Scholar] [CrossRef]
- Tetteh, I.K.; Frempong, E.; Awuah, E. An analysis of the environmental health impact of the barekese dam in kumasi, ghana. J. Environ. Manag. 2004, 72, 189–194. [Google Scholar] [CrossRef] [PubMed]
- Cernea, M.M. For a new economics of resettlement: A sociological critique of the compensation principle. Int. Soc. Sci. J. 2004, 55, 37–45. [Google Scholar] [CrossRef]
- Cernea, M.M. Social Impacts and Social Risks in Hydropower Programs: Preemptive Planning and Counter-Risk Measures. Available online: http://www.rlarrdc.org.in/images/Social%20Impacts%20and%20Social%20Risks.pdf (accessed on 1 November 2018).
- Cernea, M.M. Involuntary Resettlement in Development Projects: Policy Guidelines in World Bank-Financed Projects. Involuntary Resettlement in Development Projects; World Bank Technical Paper 180; World Bank: Washington, DC, USA, 1988. [Google Scholar]
- Dwivedi, R. Models and methods in development–induced displacement. Dev. Chang. 2002, 33, 709–732. [Google Scholar] [CrossRef]
- Heggelund, G. Resettlement programmes and environmental capacity in the three gorges dam project. Dev. Chang. 2010, 37, 179–199. [Google Scholar] [CrossRef]
- McDonald, B.; Webber, M.; Yuefang, D. Involuntary resettlement as an opportunity for development: The case of urban resettlers of the Three Gorges Project, China. J. Refug. Stud. 2008, 21, 82–102. [Google Scholar] [CrossRef]
- Chen, L. Contradictions in dam building in Yunnan, China cultural impacts versus economic growth. China Rep. 2008, 44, 97–110. [Google Scholar] [CrossRef]
- Kittinger, J.N.; Coontz, K.M.; Yuan, Z.; Han, D.; Zhao, X.; Wilcox, B.A. Toward holistic evaluation and assessment: Linking ecosystems and human well-being for the Three Gorges Dam. Ecohealth 2009, 6, 601–613. [Google Scholar] [CrossRef] [PubMed]
- Wilmsen, B.; Webber, M.; Yuefang, D. Development for whom? Rural to urban resettlement at the Three Gorges Dam, China. Asian Stud. Rev. 2011, 35, 21–42. [Google Scholar] [CrossRef]
- Xi, J.; Hwang, S.S. Relocation stress, coping, and sense of control among resettlers resulting from China’s three gorges dam project. Soc. Indic. Res. 2011, 104, 507–522. [Google Scholar] [CrossRef]
- Curran, B.; Sunderland, T.; Maisels, F.; Oates, J.; Asaha, S.; Balinga, M.; von Loebenstein, K. Are Central Africa’s protected areas displacing hundreds of thousands of rural poor? Conserv. Soc. 2009, 7, 30–45. [Google Scholar] [CrossRef]
- Fuggle, R.; Smith, W. Large Dams in Water and Energy Resource Development in the People’s Republic of China; Country Review Paper Prepared as an Input to the World Commission on Dams; World Commission: Cape Town, South Africa, 2000. [Google Scholar]
- Wilmsen, B. After the Deluge: A longitudinal study of resettlement at the Three Gorges Dam, China. World Dev. 2016, 84, 41–54. [Google Scholar] [CrossRef]
- Li, X. Lifestyle Changes and Select; People’s Publishing House: Beijing, China, 2012. (In Chinese) [Google Scholar]
- Wyrick, J.R.; Rischman, B.A.; Burke, C.A.; Mcgee, C.; Williams, C. Using hydraulic modeling to address social impacts of small dam removals in southern New Jersey. J. Environ. Manag. 2009, 90, S270–S278. [Google Scholar] [CrossRef] [PubMed]
- Tan, Y.; Yao, F. Three Gorges Project: Effects of resettlement on the environment in the reservoir area and countermeasures. Popul. Environ. 2006, 27, 351–371. [Google Scholar] [CrossRef]
- Scudder, T. The Future of Large Dams: Dealing with Social, Environmental, Institutional and Political Costs; Earthscan: London, UK, 2005. [Google Scholar]
- Kirchherr, J.; Pohlner, H.; Charles, K.J. Cleaning up the big muddy: A meta-synthesis of the research on the social impact of dams. Environ. Impact Assess. Rev. 2016, 60, 115–125. [Google Scholar] [CrossRef]
Figure 1.
The Milestone of Gangkouwan Dam Project.

Figure 2.
Displacement and resettlement plans.

Figure 3.
Locations of Group B and Group A.


Table 1.
Conceptual frameworks for assessing social impacts of development projects and dam projects.
Table 1.
Conceptual frameworks for assessing social impacts of development projects and dam projects.
| Framework | Social Impact Indicators | Context | References |
|---|---|---|---|
| Impoverishment risks and reconstruction model | Landlessness, joblessness, homelessness, marginalization, food insecurity, morbidity, and social disarticulation, | General development project | [7] |
| Sustainable livelihoods framework | Human capital, natural capital, financial capital, physical capital, and social capital | General development project | [10] |
| Social framework for project | People, community, culture, livelihoods, infrastructure, housing, environment, and land | General development project | [9] |
| Integrative dam assessment model | Social cohesion, cultural knowledge and behavior, material culture, infrastructure, income, wealth, and macro-impacts | Dam project | [11] |
| Wealth analytical framework | Material wealth; embodied wealth, and relational wealth | Dam project | [12] |
| Matrix framework on the dam’s social impacts | Infrastructure, livelihood, and community | Dam project | [13] |
Table 2.
Illustrative cases of social impacts of dam projects.
| Case | Social Impacts | References |
|---|---|---|
| Son La Hydropower Project | Human capital, natural capital, financial capital, physical capital | [17] |
| Three Gorges Project | Rural area: the loss of cultural landmark and contracted land, employment conversion to non-agriculture Urban area: living condition, the closure of outcome factories, reduced social cohesion | [6] |
| Ilisu Project | Health-related impacts, repercussions of new roads, gender-related impacts, community relation, religious belief, lifestyle or quality of life | [6] |
| Tucuruí dam | Displacement and subsequent of the population, the collapse of the fishery in the downstream, the relocation and disruption of indigenous people, health effect, economic distortion, limited employment opportunity | [15] |
| Lajeado Hydroelectric Dam | Cultural dimension | [18] |
| Nam Mang 3 project | human capital, physical capital, financial capital, and natural capital | [19] |
| Sardar Sarovar Project | Gender, livelihood opportunities | [20] |
| Manwan and Lesotho Highlands Water Project | Rural economy and employment structure, infrastructure, transportation, and housing, culture, health, and gender | [16] |
| Xiaolangdi | Income levels, equality, and forms of production | [21] |
Table 3.
Resettlement plans.
| Plans | Town | Loss | Compensation |
|---|---|---|---|
| Near-resettled | Gangkou, Qinaglong, Zhufeng, Jialu, Fangtang | Farmland, forestland, house and other properties | A small proportion of land for land compensation Monetary compensation People built house and government built community facilities |
| Far-resettled | Juntianhu | Farmland, forestland, house and other properties | Almost equal farmland and forestland Monetary compensation Government built house and community facilities |
Table 4.
Statistics of the population in Groups A and B.
| Group | Location | EDP/Person | Population | No. of Household | No. of Person/Household |
|---|---|---|---|---|---|
| Group B | Gangkou | 3990 | 15,039 | 4652 | 3.23 |
| Qinglong | 2257 | 13,975 | 4070 | 3.43 | |
| Fangtang | 2119 | 10,257 | 3173 | 3.23 | |
| Jialu | 4669 | 10,648 | 3013 | 3.53 | |
| Zufeng | 3026 | 13,319 | 3892 | 3.42 | |
| Mean | 3212 | 12,647 | 3760 | 3.36 | |
| Group A | Meilin | 4318 | 9013 | 2866 | 3.14 |
| Ningdun | 3758 | 13,971 | 4228 | 3.3 | |
| Nanji | 2857 | 11,552 | 3525 | 3.28 | |
| Wanjia | 2578 | 14,778 | 4270 | 3.46 | |
| Mean | 3378 | 12,328 | 3722 | 3.31 |
Table 5.
Data collection instruments.
| Dimensions | Indicators | Options |
|---|---|---|
| Employment [16,40] | Occupation types (Q1) | Occupation types:
|
| Income [6,11,15,16,41] | Income level (Q2) | Income level:
|
| Income source (Q3) | Ten types of income source Before the project, 0 means absence, 1 means yes After the project, 1 means decrease; 2 means no change; 3 means a rise | |
| Consumption [42] | Consumption level (Q4) | Consumption level:
|
| Consumption attitudes (Q5) | Consumption level:
| |
| Recreation [6,11,15,16,41,43] | Leisure time (Q6) | Hours of leisure time:
|
| Residence conditions [6,16,41] | Residence areas (Q7) | Your residence area is__m2 |
| Residence types (Q8) | Residence type:
| |
| Social networks [40,41] | Family relationship (Q9) | Very close (1) to very bad (5) |
| Neighborhood relationship (Q10) | Very close (1) to very bad (5) | |
| Social insurance and well-being [12,41,44,45] | Social insurance (Q11) | 10 kinds of insurance; 0 represents no and 1 means yes |
| Overall well-being (Q12) | Satisfaction before and after the project: better (1) to worse (3) |
Table 6.
Profiles of respondents.
| No. | Age | Gender | Education | ||||||
|---|---|---|---|---|---|---|---|---|---|
| 30–40 | 40–50 | 50–60 | Male | Female | Higher | Secondary | Illiteracy & Primary | ||
| Group A | 86 | 23% | 32% | 45% | 51% | 49% | 6% | 38% | 56% |
| Group B1 | 125 | 24% | 33% | 43% | 53% | 47% | 4% | 43% | 53% |
| Group B2 | 45 | 28% | 35% | 37% | 48% | 52% | 3% | 42% | 55% |
Table 7.
Difference between Groups A and B.
| Code | Social Impacts | p-Value Past | p-Value Present |
|---|---|---|---|
| Q1a | Employment for the older generation | 0.060 | 0.003 |
| Q1b | Employment for the young generation | / | 0.361 |
| Q2 | Income level | 0.062 | 0.019 |
| Q3a | Contracted responsible farmland | 0.070 | 0.000 |
| Q3b | Contracted responsible forestland | 0.712 | 0.006 |
| Q3c | Livestock breeding | 0.019 | 0.010 |
| Q3d | Fishing farming | 0.175 | 0.045 |
| Q3e | Agricultural processing | 0.109 | 0.891 |
| Q3f | Non-agricultural operating | 0.112 | 0.154 |
| Q3g | Wage | 0.382 | 0.524 |
| Q3h | Dividend share | 0.700 | 0.045 |
| Q3i | Rental income | 1.000 | 0.347 |
| Q3j | Minimum pension | 0.518 | 0.011 |
| Q3k | Retirement pension | 0.030 | 0.162 |
| Q3l | Children or relative | 0.578 | 0.812 |
| Q3m | Land compensation and fund | 0.700 | 0.000 |
| Q4 | Consumption level | 0.184 | 0.577 |
| Q5 | Consumption attitudes | 0.063 | 0.470 |
| Q6 | Leisure time | 0.164 | 0.674 |
| Q7 | Residence space | 0.164 | 0.234 |
| Q8 | Residence type | 0.000 | 0.073 |
| Q9 | Family relationship | / | 0.144 |
| Q10 | Neighbor relationship | / | 0.556 |
| Q12 | Over well-being | / | 0.000 |
Table 8.
Employment and occupation.
| Older Generation | Younger Generation | ||||||||
|---|---|---|---|---|---|---|---|---|---|
| Past | Present | Present | |||||||
| A | B1 | B2 | A | B1 | B2 | A | B1 | B2 | |
| 1 (%) | 0.0 | 0.4 | 1.3 | 0.0 | 0.4 | 0.0 | 0.0 | 0.0 | 0.0 |
| 2 (%) | 0.0 | 0.0 | 0.0 | 0.0 | 0.0 | 0.0 | 3.4 | 2.1 | 2.1 |
| 3 (%) | 1.1 | 0.0 | 0.0 | 3.5 | 0.4 | 0.0 | 0.0 | 0.0 | 0.0 |
| 4 (%) | 2.2 | 1.3 | 3.8 | 1.4 | 0.4 | 0.0 | 13.8 | 14.6 | 12.4 |
| 5 (%) | 1.3 | 0.8 | 0.0 | 7.7 | 3.4 | 5.1 | 13.8 | 0.0 | 9.3 |
| 6 (%) | 6.6 | 3.8 | 10.3 | 14.7 | 9.7 | 16.7 | 3.4 | 8.3 | 7.2 |
| 7 (%) | 2.2 | 0.8 | 3.8 | 2.1 | 3.8 | 1.3 | 10.3 | 8.3 | 8.2 |
| 8 (%) | 15.3 | 16.5 | 5.1 | 11.2 | 24.8 | 7.7 | 41.4 | 50.0 | 46.4 |
| 9 (%) | 61.8 | 62.4 | 71.8 | 55.2 | 26.9 | 60.3 | 0.0 | 3.4 | 2.0 |
| 10 (%) | 9.2 | 13.9 | 3.8 | 4.2 | 30.3 | 9.0 | 10.3 | 10.4 | 12.4 |
Note 1: civil servant in government; 2: managers; 3: private entrepreneurs; 4: professional and technical personnel; 5: staff class, office clerks; 6: individual entrepreneur; 7: workers in the service sector; 8 factory workers; 9: farmer: 10: unemployment.
Table 9.
Income level.
| Past | Present | |||||
|---|---|---|---|---|---|---|
| A | B1 | B2 | A | B1 | B2 | |
| 1 (%) | 17.4 | 25.4 | 14.3 | 0.0 | 1.5 | 0.0 |
| 2 (%) | 20.9 | 18.7 | 16.3 | 7.0 | 4.5 | 0.0 |
| 3 (%) | 20.9 | 23.9 | 20.4 | 2.3 | 5.2 | 4.1 |
| 4 (%) | 11.6 | 21.6 | 40.8 | 16.3 | 14.2 | 10.2 |
| 5 (%) | 15.1 | 3.7 | 2.0 | 10.5 | 25.4 | 18.4 |
| 6 (%) | 5.8 | 5.2 | 6.1 | 17.4 | 26.1 | 36.7 |
| 7 (%) | 3.5 | 0.7 | 0.0 | 30.2 | 14.9 | 18.4 |
| 8 (%) | 4.7 | 0.7 | 0.0 | 16.3 | 8.2 | 12.2 |
Note: 1: <2000; 2: 2000–5000; 3: 5000–10,000; 4: 10,000–20,000; 5: 20,000–30,000; 6: 30,000–50,000; 7: 50,000–100,000; 8: >100,000.
Table 10.
Consumption level and consumption attitudes.
| Consumption Level | Consumption Attitudes | |||||||||||
|---|---|---|---|---|---|---|---|---|---|---|---|---|
| Past | Present | Past | Present | |||||||||
| A | B1 | B2 | A | B1 | B2 | A | B1 | B2 | A | B1 | B2 | |
| 1 (%) | 35.2 | 44.0 | 34.7 | 3.3 | 3.7 | 0.0 | 51.6 | 65.7 | 59.2 | 30.8 | 38.1 | 38.8 |
| 2 (%) | 36.3 | 35.8 | 44.9 | 18.7 | 14.9 | 10.2 | 27.5 | 22.4 | 14.3 | 38.5 | 33.6 | 18.4 |
| 3 (%) | 17.6 | 17.2 | 16.3 | 17.6 | 14.9 | 22.4 | 17.6 | 11.2 | 16.3 | 26.4 | 24.6 | 32.7 |
| 4 (%) | 5.5 | 3.0 | 2.0 | 25.3 | 34.3 | 28.6 | 2.2 | 0.7 | 10.2 | 3.3 | 2.2 | 8.2 |
| 5 (%) | 5.5 | 0.0 | 2.0 | 35.2 | 32.1 | 38.8 | 1.1 | 0.0 | 0.0 | 1.1 | 1.5 | 2.0 |
Note: consumption level 1: <200 RMB; 2: 200–500 RMB; 3: 500–1000 RMB; 4: 1000–2000 RMB; 5: >2000 RMB. Consumption attitude 1: low income and live frugally; 2: deposit for children’s education and health care; 3: expenses only for necessary occasions; 4: consumption without a deposit; 5: in debt.
Table 11.
Leisure time and residence area.
| Leisure Time | Residence Area | ||||||||||
|---|---|---|---|---|---|---|---|---|---|---|---|
| Past (Hour) | Present (Hour) | Past (m2) | Present (m2) | ||||||||
| A | B1 | B2 | A | B1 | B2 | A | B1 | B2 | A | B1 | B2 |
| 2.02 | 1.84 | 2.04 | 2.86 | 2.86 | 2.65 | 35.62 | 37.22 | 36.68 | 57.01 | 55.89 | 48.87 |
Table 12.
Residence type and well-being.
| Residence Type | Well-Being | ||||||||
|---|---|---|---|---|---|---|---|---|---|
| Past | Present | Present | |||||||
| A | B1 | B2 | A | B1 | B2 | A | B1 | B2 | |
| 1 (%) | 65.2 | 81.3 | 53.1 | 28.1 | 37.3 | 16.3 | 93.4 | 47.6 | 59.2 |
| 2 (%) | 34.8 | 18.7 | 46.9 | 70.8 | 59.0 | 83.7 | 4.4 | 26.2 | 18.4 |
| 3 (%) | 0.0 | 0.0 | 0.0 | 1.1 | 3.7 | 0.0 | 2.2 | 26.2 | 22.4 |
Note: Residence type: 1: bungalow; 2: 2–3-story building; 3: multi-residential building. Well-being: 1: better; 2: no changes; 3: worse.
Table 13.
Family relationship quality and neighbor relationship quality.
| Family Relationship | Neighbor Relationship | |||||
|---|---|---|---|---|---|---|
| A | B1 | B2 | A | B1 | B2 | |
| 1 (%) | 23.8 | 27.8 | 40 | 25.6 | 37.2 | 28.3 |
| 2 (%) | 65.5 | 47.6 | 46.7 | 53.3 | 39.5 | 56.5 |
| 3 (%) | 10.7 | 23.8 | 11.1 | 20.0 | 22.5 | 15.2 |
| 4 (%) | 0.0 | 0.8 | 2.2 | 1.1 | 0.8 | 0.0 |
| 5 (%) | 0.0 | 0.0 | 0.0 | 0.0 | 0.0 | 0.0 |
Not: 1: very close; 2: close; 3: no changes; 4: bad; 5: very bad.
Table 14.
Social insurance.
| Past | Present | |||||
|---|---|---|---|---|---|---|
| A | B1 | B2 | A | B1 | B2 | |
| Rural endowment insurance | 3.4 | 1.5 | 0.0 | 79.8 | 57.3 | 75.5 |
| Rural cooperative medical insurance | 13.5 | 13.0 | 6.1 | 92.1 | 93.9 | 98.0 |
| Rural minimum living standard security | 0.0 | 0.8 | 0.0 | 2.2 | 8.4 | 6.1 |
| Five Guarantees | 0.0 | 0.0 | 0.0 | 0.0 | 0.0 | 0.0 |
| Urban endowment insurance | 1.1 | 0.8 | 0.0 | 6.7 | 3.8 | 2.0 |
| Urban medical insurance | 0.0 | 0.8 | 0.0 | 5.6 | 2.3 | 4.1 |
| Urban unemployment insurance | 0.0 | 0.0 | 0.0 | 0.0 | 1.5 | 2.0 |
| Urban minimum living standard insurance | 0.0 | 0.0 | 0.0 | 0.0 | 0.0 | 0.0 |
| Commercial insurance | 2.2 | 0.8 | 0.0 | 7.9 | 6.1 | 10.2 |
| None | 77.5 | 63.4 | 93.9 | 0.0 | 2.3 | 2.0 |
© 2018 by the authors. Licensee MDPI, Basel, Switzerland. This article is an open access article distributed under the terms and conditions of the Creative Commons Attribution (CC BY) license (http://creativecommons.org/licenses/by/4.0/).
Share and Cite
MDPI and ACS Style
Huang, Y.; Lin, W.; Li, S.; Ning, Y. Social Impacts of Dam-Induced Displacement and Resettlement: A Comparative Case Study in China. Sustainability 2018, 10, 4018. https://doi.org/10.3390/su10114018
AMA Style
Huang Y, Lin W, Li S, Ning Y. Social Impacts of Dam-Induced Displacement and Resettlement: A Comparative Case Study in China. Sustainability. 2018; 10(11):4018. https://doi.org/10.3390/su10114018
Chicago/Turabian StyleHuang, Youliang, Wensheng Lin, Shan Li, and Yan Ning. 2018. "Social Impacts of Dam-Induced Displacement and Resettlement: A Comparative Case Study in China" Sustainability 10, no. 11: 4018. https://doi.org/10.3390/su10114018
Note that from the first issue of 2016, this journal uses article numbers instead of page numbers. See further details here.