Research on the Evaluation Model of a Smart Grid Development Level Based on Differentiation of Development Demand

1
School of Economics and Management, North China Electric Power University, Beijing 102206, China
2
Beijing Key Laboratory of New Energy and Low-Carbon Development, North China Electric Power University, Beijing 102206, China
3
State Grid Economic and Technological Research Institute CO., LTD., Beijing 102209, China
*
Author to whom correspondence should be addressed.
Sustainability 2018, 10(11), 4047; https://doi.org/10.3390/su10114047
Submission received: 22 September 2018
/
Revised: 22 October 2018
/
Accepted: 1 November 2018
/
Published: 5 November 2018
(This article belongs to the Special Issue Smart Energy Management for Smart Grids)
Abstract
:In order to eliminate the impact of inter-regional differentiation of development demand on the objective evaluation of the development level of smart grid, this paper establishes the evaluation model of weight modification, transmission mechanism and combination of subjective and objective weights. Firstly, the Analytic Hierarchy Process method is used to calculate the weights of evaluation indices of effect layer and then the indices of development demand are used to modify the weights of them. The association analysis and the correlation coefficient are used to establish the weights conduction coefficient between the effect level and the base level. Then the subjective weights of the indices of the base layer are calculated. The objective weights of the indices of the base layer are obtained by using the entropy method. The subjective weights of the base layer and the objective weights obtained by the entropy method are averagely calculated, and the comprehensive weights of the evaluation indices of the base layer are obtained. Then each index is scored according to the weights and index values. Finally, the model is used to quantitatively inspect the level of development of smart grid in specific regions and make a horizontal comparison, which provides a useful reference for the development of smart grids. The relevant examples verify the correctness and validity of the model.
1. Introduction
Based on an integrated and high-speed bi-directional communication network, smart grid is designed to be reliable, safe, economical, efficient, and environment-friendly through advanced sensing and measurement technologies, equipment technologies, control methods, and decision support system technologies. Key features of it include self-healing, motivating and engaging users, defending against attacks, providing power quality that meets 21st century user needs, allowing access to a variety of power generation forms, activating power markets, and optimizing asset applications for efficient operation. As for its application range, it is more and more extensive. For example, in recent years, some areas have combined smart grids with intelligent transportation to build new smart cities [1]. As an important part of the energy internet, it has drawn wide attention from all of the world and has now become a new trend in the development of the world’s power grid [2,3,4].
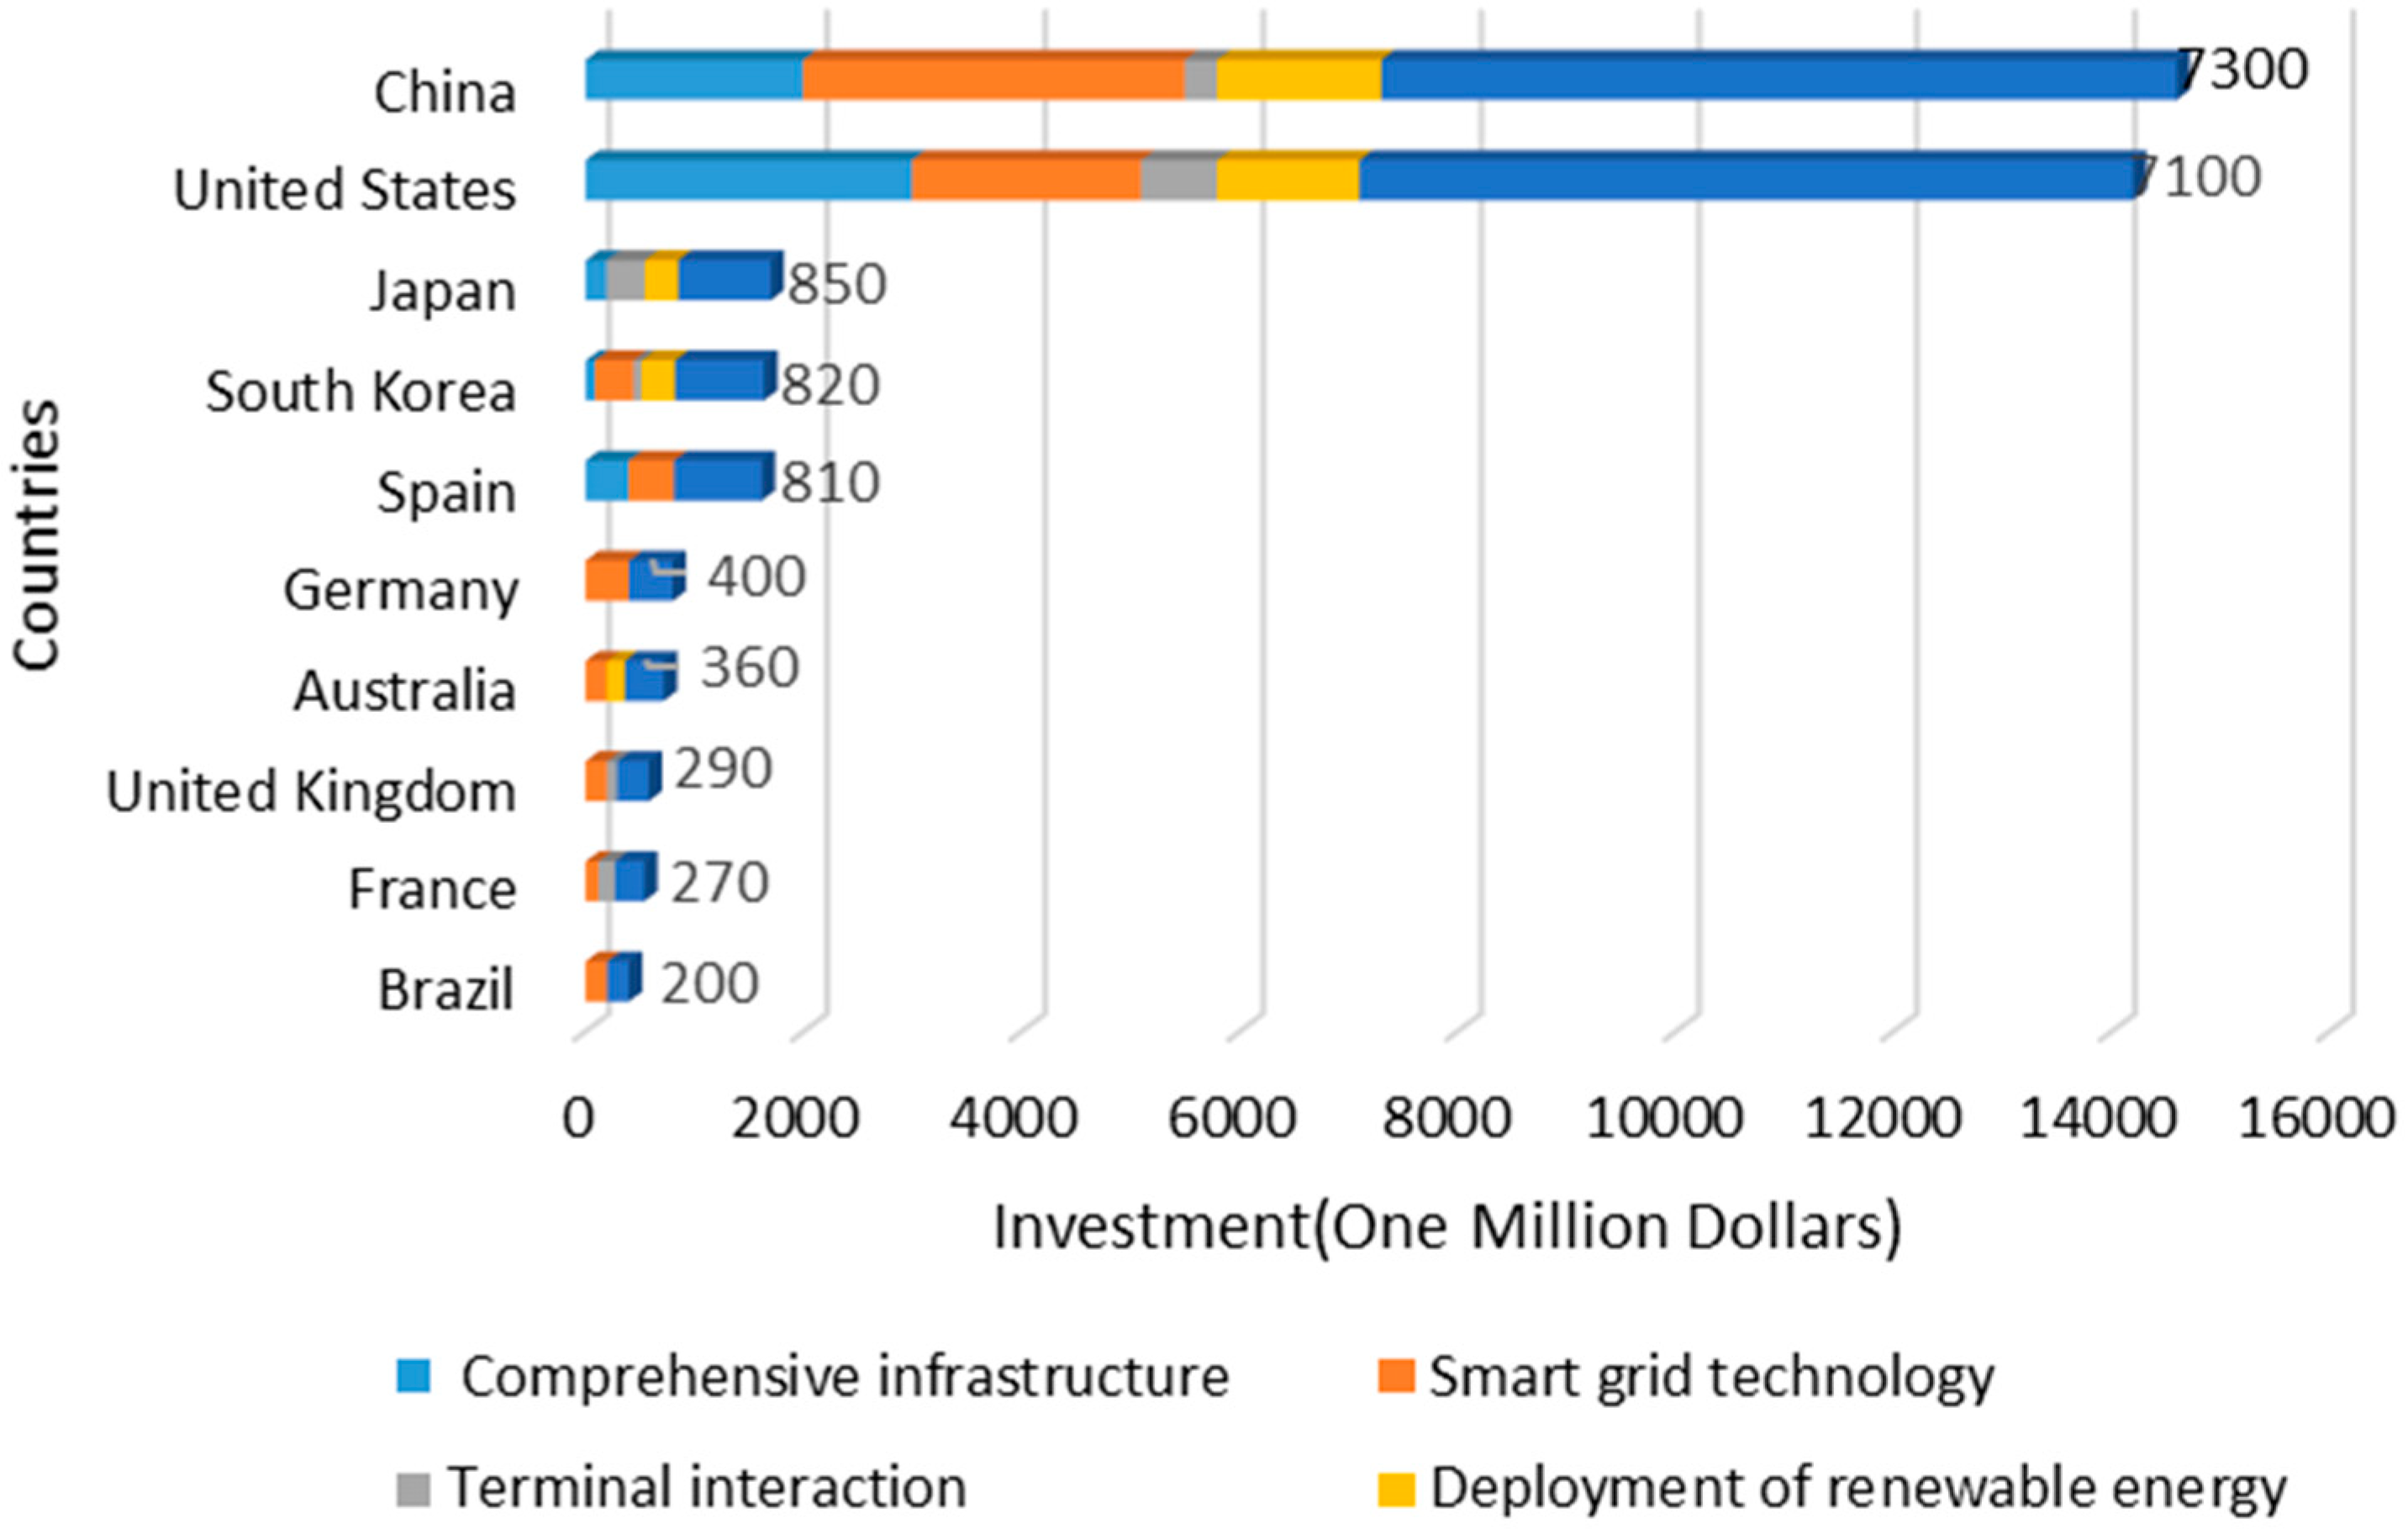
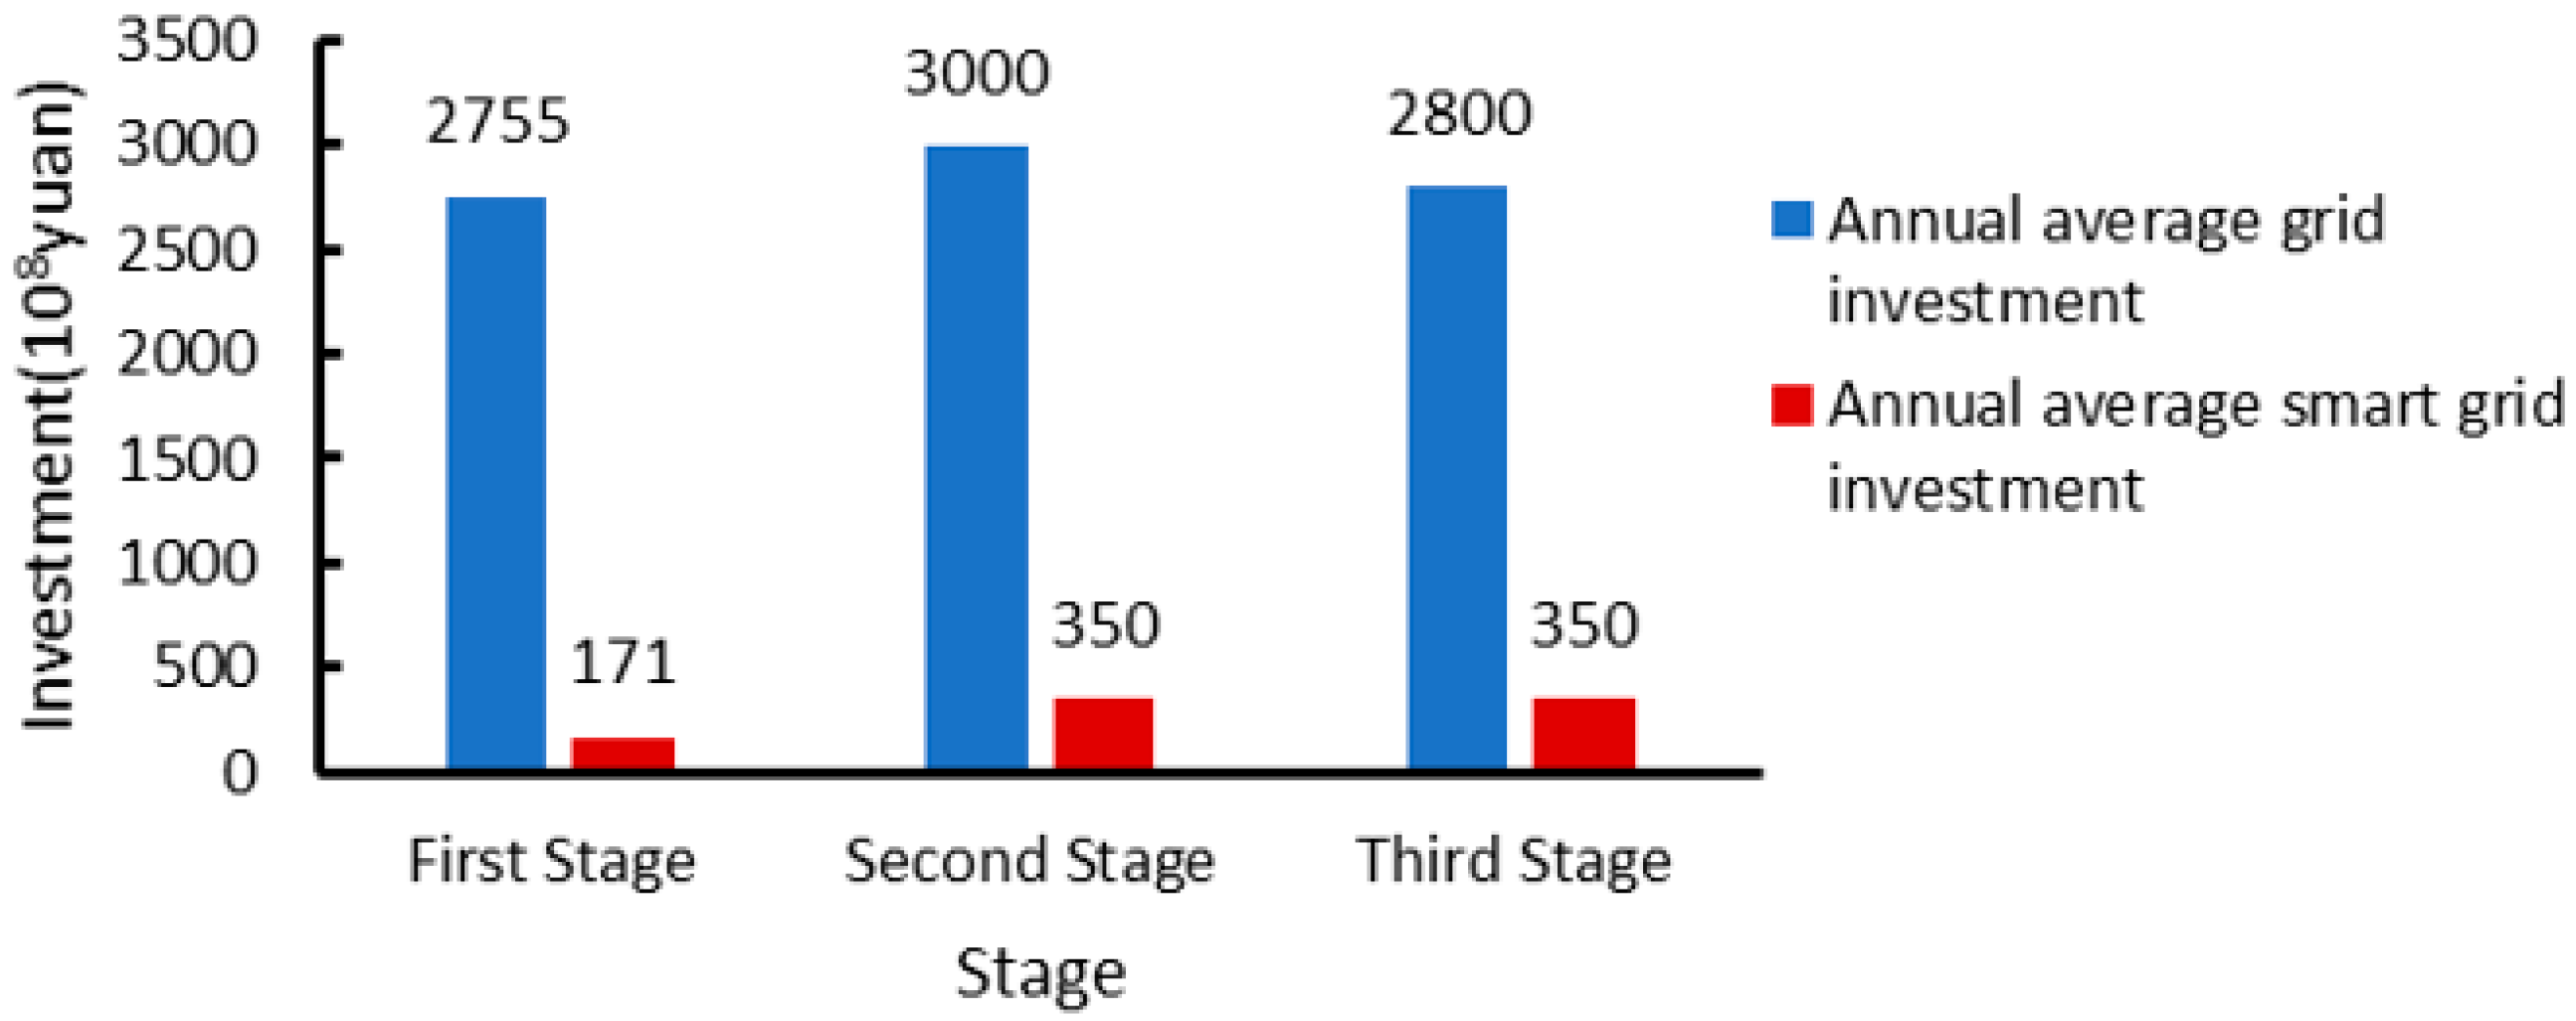
Investment is the economic foundation for the development of smart grids, but due to the different driving forces of smart grid development in different countries, the focus of investment in the construction of smart grids is also different. In 2010, the top ten countries that the central government invested in the smart grid are shown in the Figure 1. Their total investment has reached $18.4 billion and will continue to grow in the future. For Europe, its development focus is on the optimal operation of the power grid, the optimization of power grid infrastructure, and the development of communications and information technology. For the United States, its development and construction focus is on low-carbon and energy efficiency. For Japan, its construction focus is on the green economy. In China, its construction focus at present is to improve the resource allocation capability, safety level, and operating efficiency of the power grid. The development of smart grids in China is divided into three stages: pilot stage for planning, stage of comprehensive construction, and stage of guiding and improving. The situation of smart grid investment in each stage is shown in Figure 2 below.
After high-speed construction in recent years, the development of smart grid at abroad has entered a stage of normalization. As developed countries such as Europe and the United States have a high level in the development, construction, and operation management of power grids, a great deal of research work has been carried out on the assessment of smart grids. The experience has been accumulated and relatively rich achievements have been achieved [5,6,7]. For China, the development of the smart grid has also entered a critical stage. Under the layout of the State Grid Corporation on smart grids, provincial power grid companies have responded to the call to speed up the pace of development and construction. Therefore, it is urgent to establish a sound evaluation system and mechanism to evaluate the level of smart grid development to guide its direction of development. Based on this background, this paper establishes an index system that combines the effect layer and the base layer, evaluates the development level of the smart grid in a specific region, looks for its weak links, and gives corresponding optimization suggestions.
The paper is organized as follows. The second part serves as a literature review. The third part introduces the establishment of the index system. The fourth part and the fifth part respectively introduce the effect layer index system and the base layer index system. In the sixth part, the paper gives the evaluation process of the development level of the smart grid. The seventh part analyzes the examples. Finally, the eighth part offers conclusion.
2. Literature Review
At present, evaluations of smart grids have been conducted by scholars at home and abroad. The specific literatures are shown in the Table 1 below.
3. Construction of the Index System
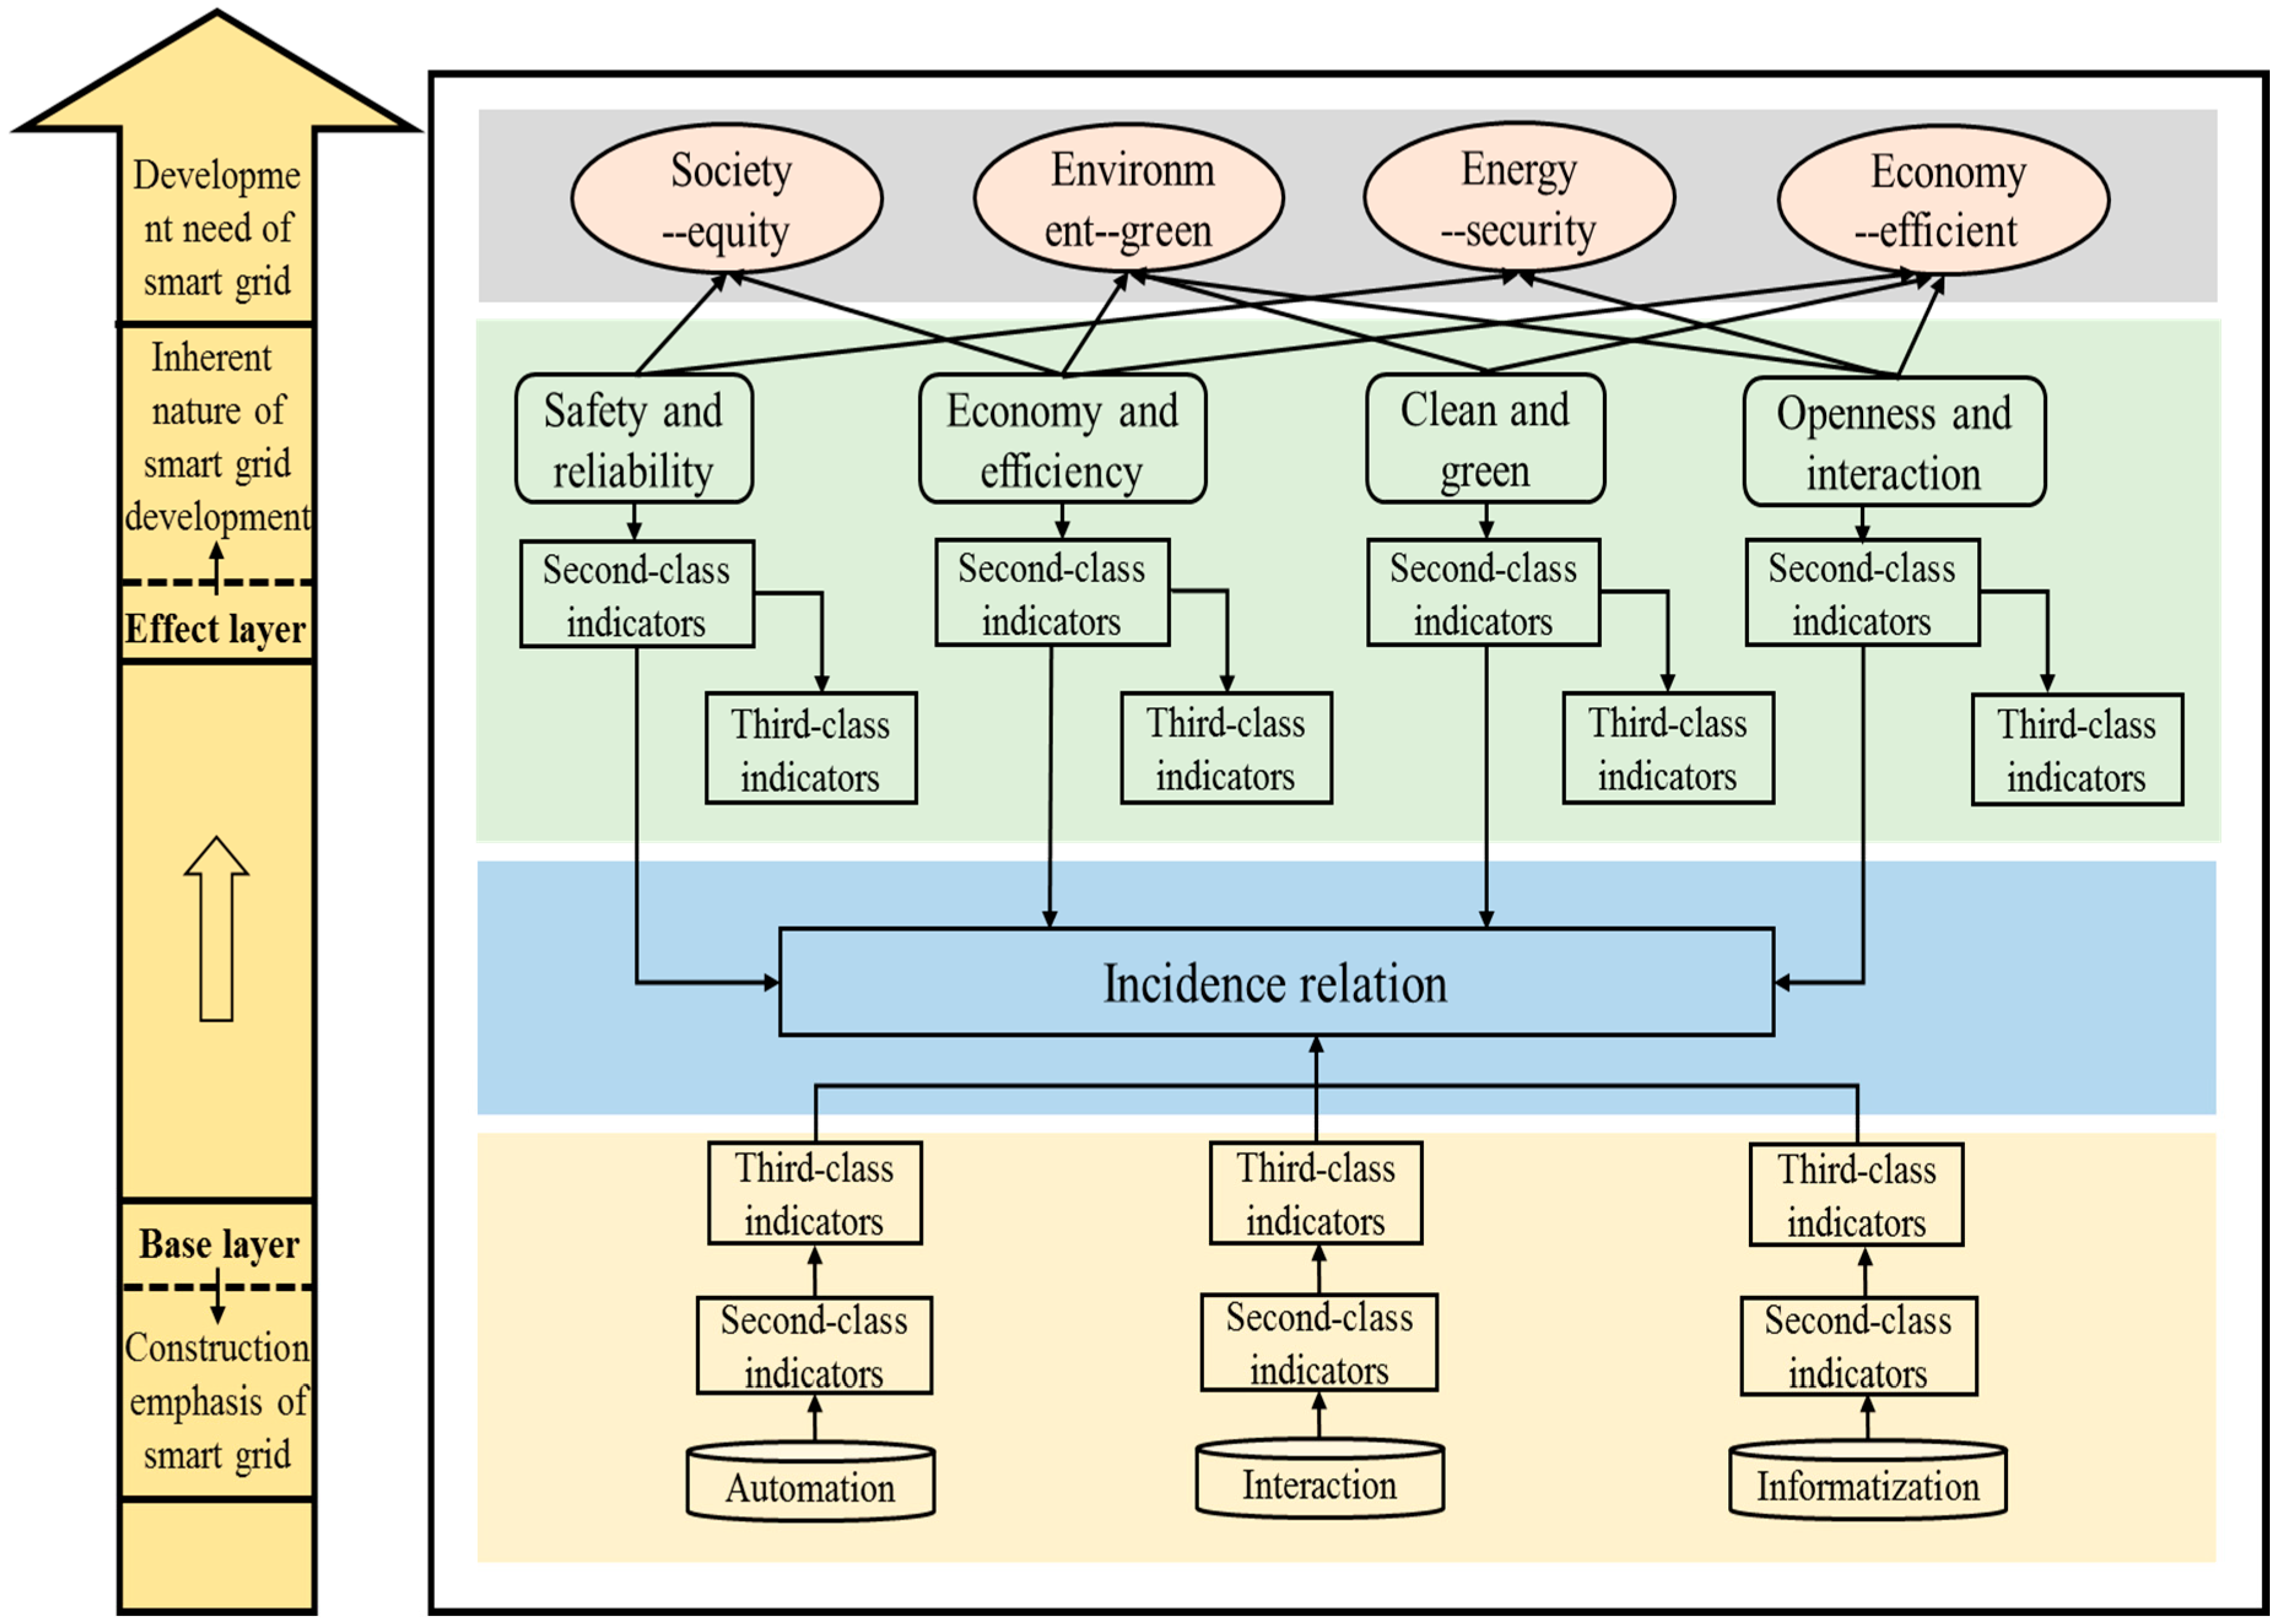
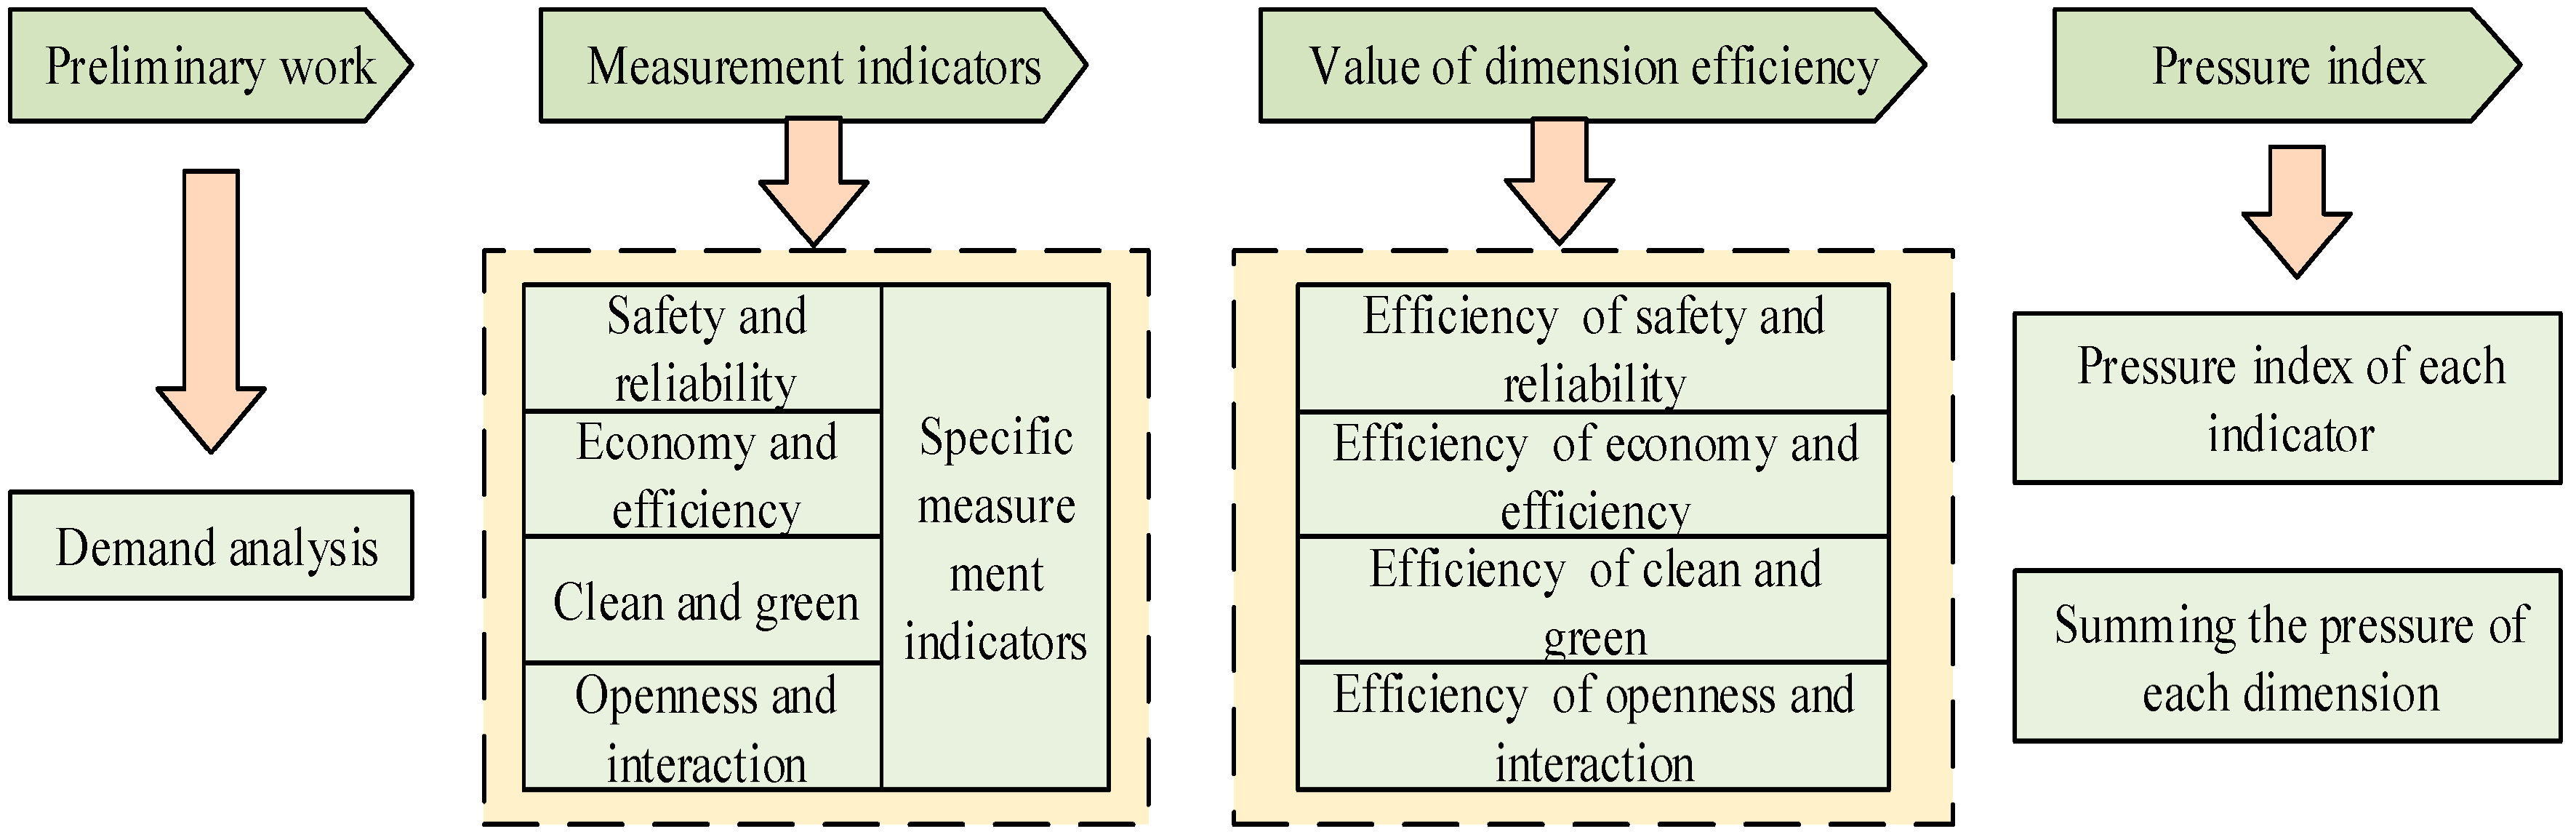
The comprehensive evaluation model of the level of development of the smart grid aims to achieve systematic evaluation of the overall level of the smart grid. Therefore, this paper establishes an index system from the effect layer and the base layer and builds the relationship between the two layers. The effect layer reflects the inherent nature of the development of smart grid and is dedicated to meeting the development needs of smart grid, while the base layer is the focus of smart grid construction. The index system structure of this paper shown in Figure 3.
4. Index System of Effect Layer
4.1. Safety and Reliability
The safe and reliable operation are the key tasks for the future development of power grid. It involves the power supply security and reliability of power quality [35] and the ability to enhance the safety, stability and accident prevention capability of large power grids. The construction of communication information network is an important part of the intelligent construction of China’s power grid, so the safety of communication information is equally worth noting. Therefore, the index system of the safety and reliability of the power grid is mainly established from two aspects: the safety and reliability of power grid and the safety of communication information, as shown in Table 2 [36].
4.2. Economy and Efficiency
Economy and efficiency is to improve the grid operation and transmission efficiency, reduce operating costs and promote the efficient use of energy resources and power assets, so the index system of economics and efficiency of the power grid is mainly established from three aspects: economic benefits, grid efficiency and staff efficiency, as shown in Table 3.
4.3. Clean and Green
Clean and green means to improve the energy structure, improve the level of electrification, realize the large-scale development of clean energy and optimize the configuration of it in a wide range, replace the fossil energy with clean energy, and make the clean energy gradually become the dominant energy in the future. Therefore, the index system of the clean and green of the power grid is mainly established from three aspects: green power generation, green power grid, and green electricity, as shown in Table 4.
4.4. Openness and Interaction
Openness and interaction means that based on the platform of intellectualized service which built by smart grid to adapt to the connection and interaction of various types of power supply and load flexibly to meet the diverse needs of customers. Therefore, the index system of the openness and interaction of the power grids mainly established from four aspects: the transparency of power grid, the openness of power grid, quality service, and interactive effect, as shown in Table 5.
5. Index System of Base Layer
Based on the basic requirements of the construction of smart grid, this paper divides the basis of intelligent grid construction into three aspects: automation, interaction and information, and takes them as first-level index to establish the evaluation index system of the base layer.
5.1. Automation
Power network automation mainly refers to the automated operation of the power system. By running modern communication technology, network technology and automatic control technology, it reaches the automatic detection and control of grid operation, enhances the ability of online monitoring and self-protection operation, and effectively improves the efficiency of grid operation, to ensure reliable and efficient operation of the power grid. Therefore, the index system of power network automation is mainly established from four aspects: transmission automation, substation automation, distribution automation, and dispatching automation, as shown in Table 6.
5.2. Interaction
Interactive technology of the smart grid is a key technology and development direction which can improve the capacity of the grid to carry new energy and ensure the power quality of the grid. It can achieve the multi-directional interaction among the power supply, power grid and users, and allows users to participate more in the process of power balance by changing users’ electricity behavior and developing the access of distributed energy. Therefore, the index system of interaction is mainly established from four aspects: interaction of electricity use, electric vehicles, large-scale access to new energy sources, and distributed power supply, as shown in Table 7.
5.3. Informatization
Grid informatization refers to the process of cultivating and developing new productivity represented by intelligent tools such as computers and network communication technologies in the power grid and improving the operation and management of the power grid. It is reflected in the construction of communication network and information construction index system as shown in Table 8.
6. Evaluation Process of Smart Grid Development Level
6.1. Implementation Path of Evaluation Model
The comprehensive evaluation model of the development level of smart grid is based on the theory of system evaluation and can accurately evaluate the overall development level of smart grid. By decomposing and refining the smart grid, it deepens its understanding of the smart grid, enhances the specificity and representativeness of the evaluation index, and improves the accuracy of the evaluation results. Through the research on the coordinative relationship among the indicators, a dynamic weight calculation method is designed to realize the two-way interaction between the effect layer and base layer.
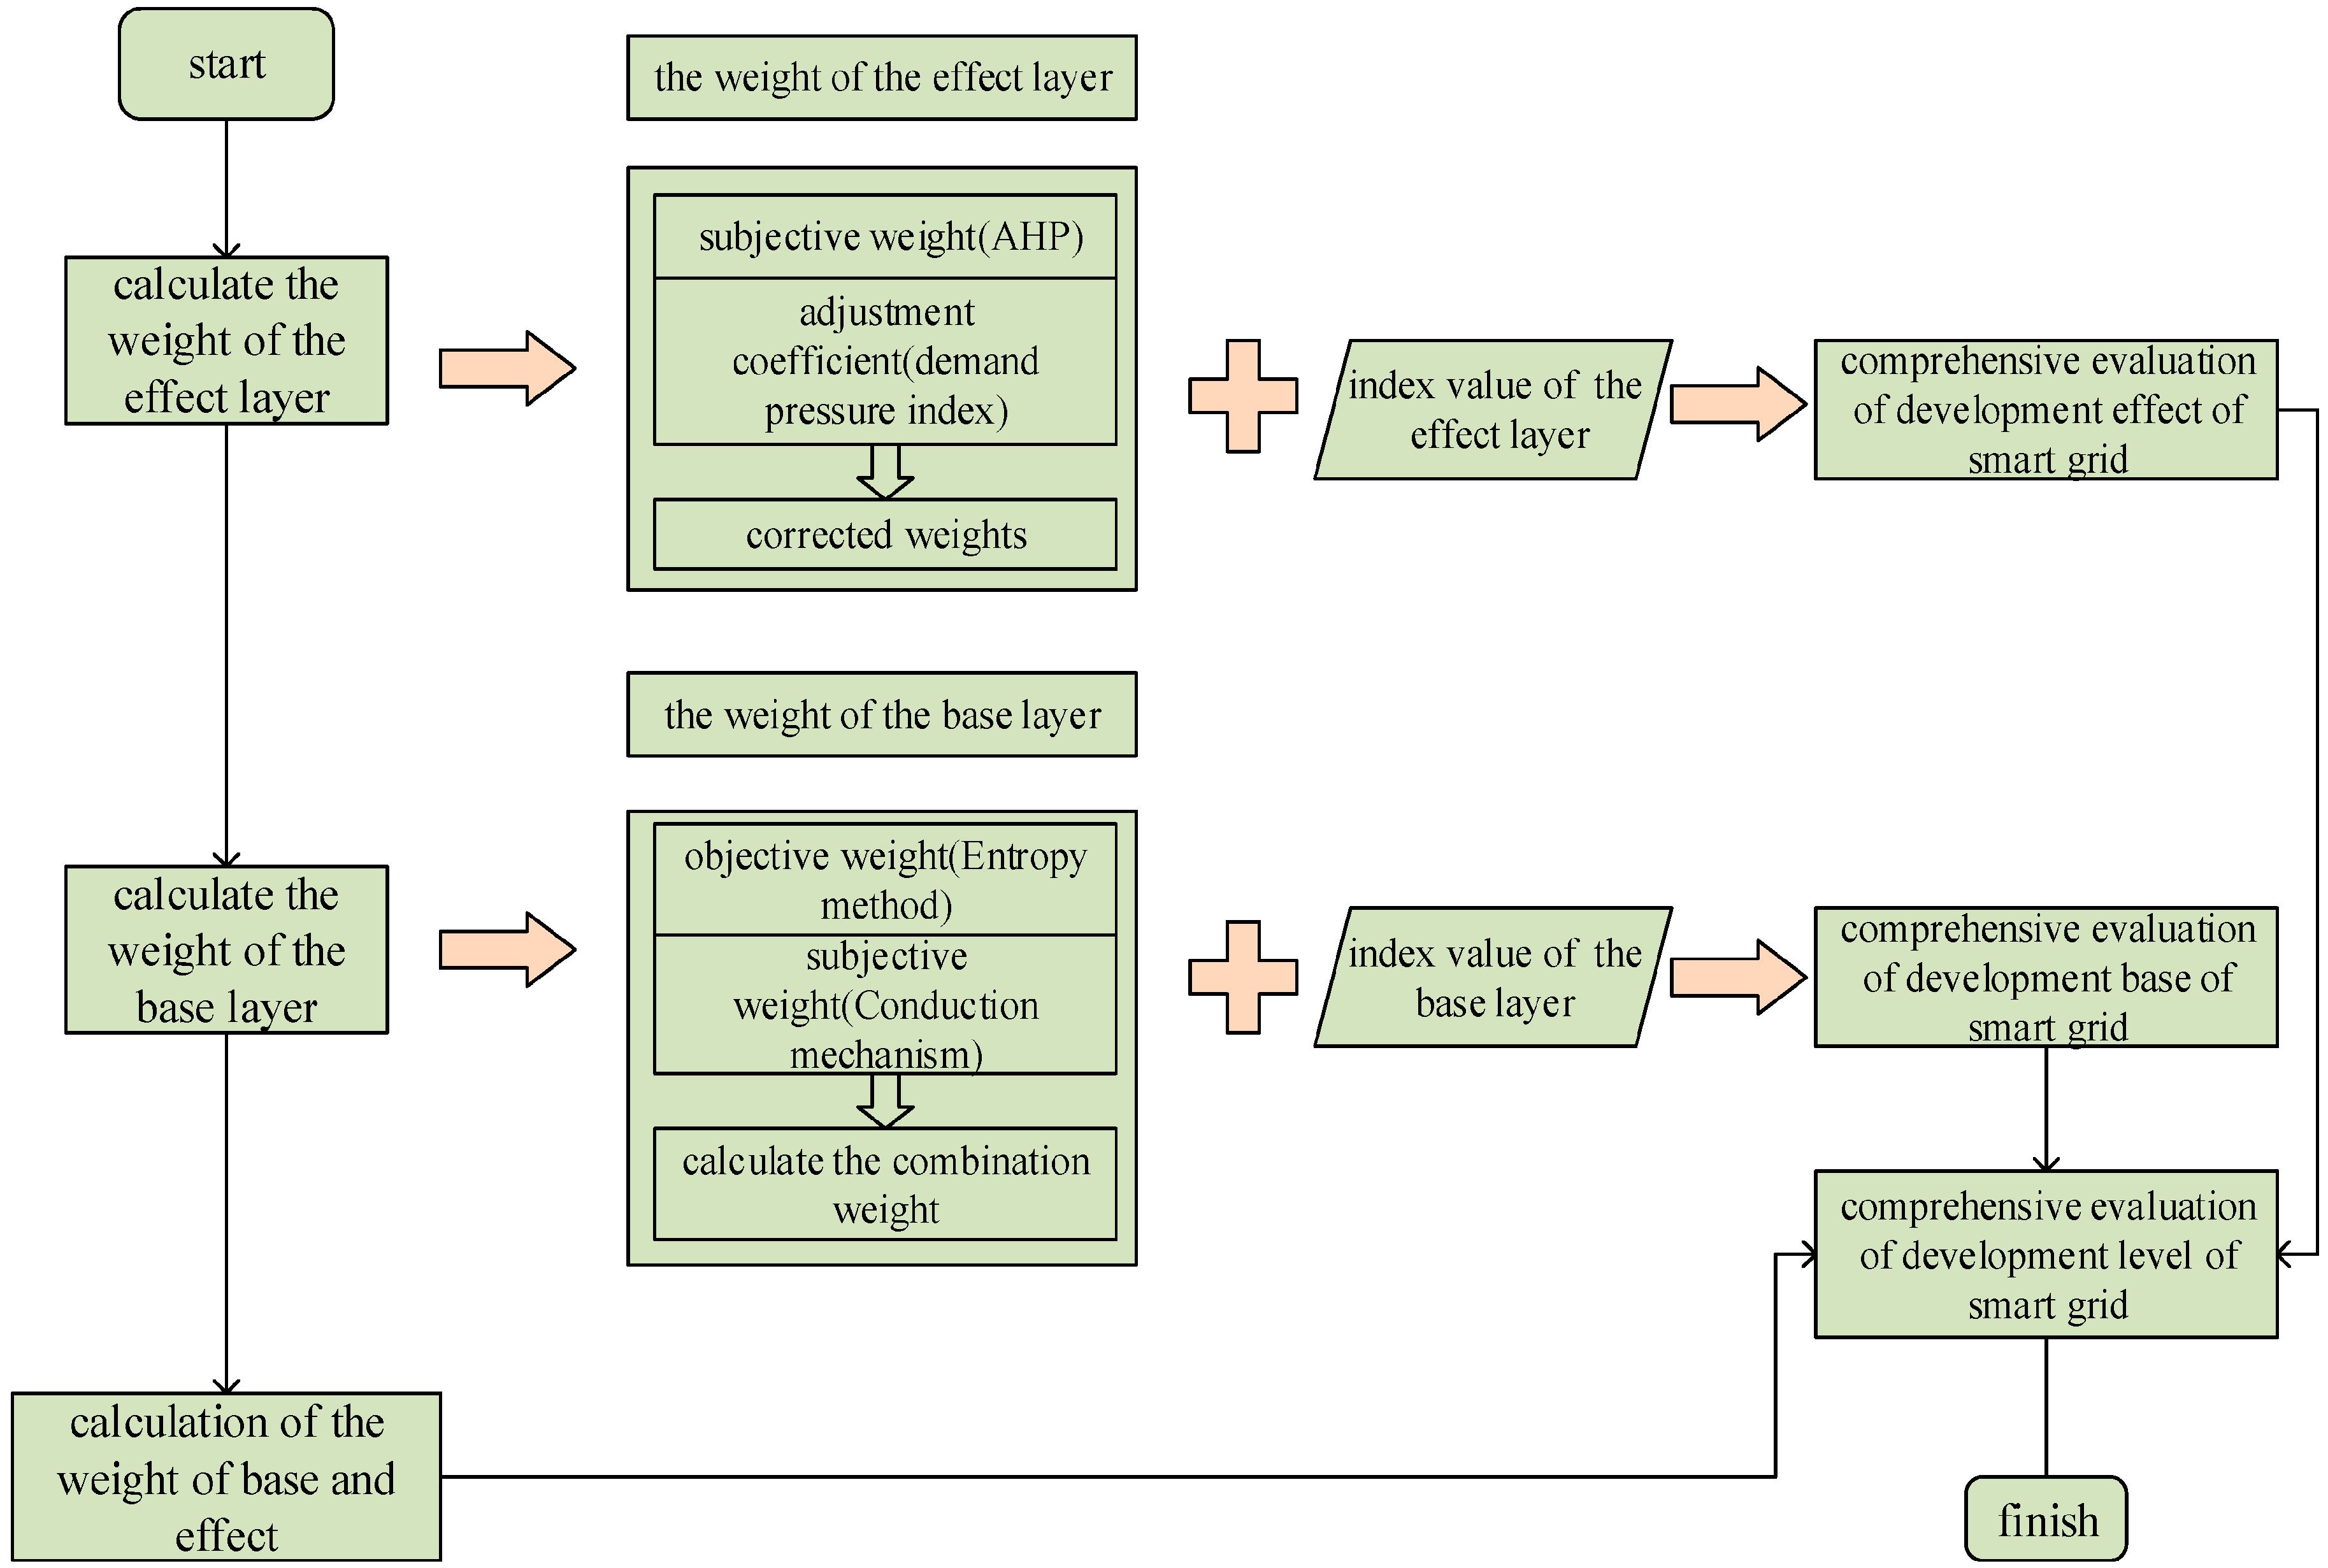
When choosing the evaluation method of smart grid, this paper select the appropriate evaluation method based on the characteristics of each attribute and index, and combine with the application scope of the method, so as to obtain a more accurate and reasonable evaluation result. The evaluation model process of this paper as shown in Figure 4.
6.2. Method of Evaluation Model
6.2.1. Subjective Weights of the Effect Level Indicators by the AHP Method
The Analytic Hierarchy Process (AHP) is a practical multi-objective decision-making method. When AHP is used to analyze the decision-making problem, first of all, we need to rationalize and stratify the issue so as to construct a hierarchical structural model. The basic steps are as follows:
- (1)
- Establish a hierarchical structure.
- (2)
- Construct a judgment matrix.
Hierarchies reflect the relationship between the factors, but the criteria of the criterion layer do not necessarily share the same weight in the target measure. This article uses the numbers 1–9 and their reciprocal as a scale. Table 9 lists the meaning of 1–9 scale:
(3) Hierarchical single arrangement and consistency checking
Hierarchical single arrangement is based on the judgment matrix, calculating the target element in the previous level, and determining the importance (weight) of level and its associated elements. The method of solving the largest eigenvector of the judgment matrix is used to obtain the weight of single arrangement. The formula is:
where λmax and W denote the maximum eigenvalue of the judgment matrix C and the corresponding eigenvector.
CW = λmaxW
In order to avoid the contradictory judgment result in the process of expert judgment, it is necessary to check consistency of hierarchical single arrangement. Check the consistency of the judgment matrix by calculating the CR value:
CR = CI/RI
CI = (λmax − n)/(n − 1) is the dimension of the judgment matrix, RI is the corresponding random value, as shown in Table 10.
If CR < 0.1, then the judgment matrix can be regarded as satisfactory consistency. The judgment matrix can be used as a hierarchical analysis. If CR ≥ 0.1, the judgment matrix is not satisfactory, and the judgment matrix needs to be adjusted and corrected.
(4) Hierarchical total ordering and consistency checking
Through the above steps, a set of weight vectors can be obtained. Ultimately, we should obtain the weight of sorting the goals in each element, especially in the lowest level, so as to make a choice of solutions. The total sequencing weight will synthesize the weights of the single criteria from top to bottom.
Suppose that the upper level (level A) contains m factors A1, …, Am, and the total weight of their levels is a1, …, am. The next level (B level) contains n factors B1, …, Bn, whose rank ordering weights for Aj are respectively b1j, …, bnj (bij = 0 when Bi is unassociated with Aj). We now ask for the weight of each factor in the B-layer about the total goal, that is, find the total weight b1, …, bn of the hierarchy of each factor in the B-tier. The calculation is performed in the following way:
The hierarchical total ordering also needs to be checked for consistency. The test is still performed from the high level to the low level layer by layer like the total level of the hierarchy. The pairwise comparison judgment matrix of factors related to Aj in layer B is checked for consistency in a single ranking, and the single-order consistency index is obtained as CI(j), (j = 1,…,m), and the corresponding average When the random consistency index is RI(j) (CI(j) and RI(j) have been obtained when the levels are single-ordered), the proportion of random coherence of the total order of the B-level is:
when CR < 0.10, it is considered that the hierarchical total ordering results have a satisfactory consistency and accept the analysis result.
6.2.2. Correcting the Weight of the Effect Layer in the Direction of Development Demand
Based on the basic cluster analysis of the development of the provincial power grids in the country, the provincial power grids can be divided into three categories. Provincial power grids A, B, and C are selected from each of them, their development demand index values separately calculated, the development demand index values of the provinces where they are located as the target value averaged, and the demand pressure index calculated separately. The first-level indicators at the effect level are revised to meet the demand-oriented goal. The specific process is as follows in Figure 5.
(1) The measurement index of smart grid development demand
Based on the availability of the current indicator data, the measurement indicators of smart grid development demand are shown in Table 11.
The demand pressure index formula is shown in Equation (5).
Demand pressure index of safety and reliability (D1)
=DC1 + DC2 + DC3 + DC4 + DC5
Demand pressure index of economy and efficiency (D2)
=DC6 + DC7 + DC8 + DC9 + DC10
Demand pressure index of clean and green (D3)
=DC11 + DC12 + DC13 + DC14 + DC15
Demand pressure index of openness and interaction (D4)
=DC16 + DC17 + DC18 + DC19 + DC20
(2) After the normalization process as the requirement four-dimensional weight value
The above calculation results and the AHP method are used to correct the weight of the first-level indicators of the effect layer. The two mean values are taken as the final weight of the indicator, and the second-level and third-level indicators’ weights of the effect layer are corrected in order.
6.2.3. Determination of Objective Weights of Base Layer Indicators
In this paper, the Entropy Method [43] is used to calculate the objective weights of the base layer indicators. It is a method to determine the weights based on the amount of information provided by the observations of each index. It is an objective method of empowerment that embodies the size of the evaluation of indicators in objective information. The basic implementation steps are as follows:
(1) Evaluation index membership degree matrix standardization
The n object to be evaluated corresponds to the index values of the m evaluation indices and constitutes a membership evaluation standard R.
In this evaluation index system, there are differences in the dimension, content, merits and demerits of each indicator, etc. Therefore, it is necessary to standardize the value of each indicator. There are two kinds of standardized processing methods: The larger the indicator data is, the better, that is, the positive indicator. The standard formula is:
when the indicator data is smaller, the better, that is, the inverse indicator, the standard formula is:
(2) Normalize each indicator value and calculate the proportion of the indicator value of the ith evaluation object under the jth indicator:
(3) Calculate the entropy of the jth indicator:
Among them:
and assume that:
(4) Calculate the difference coefficient of the jth indicator:
(5) Calculate the weight of the jth indicator:
6.2.4. Relationship among the Effect Layer and the Base Layer Indicators
Until now, the smart grid construction period is not long, and there are few index data, the correlation analysis based on the index data may have errors. Therefore, this paper first uses the expert scoring method to judge the correlation degree between two-level indicators of effect layer and the key indicators of the basic layer. The specific process is as follows in Figure 6.
The association table between effect layer and base layer indicators is showed in Table 12.
There are two factors that affect the subjective weights of the basic layer indicators: one is the weight of the related effect level indicators, and the other is the size of the correlation between them. Therefore, this article uses the multiplication of these two as the subjective weights of the base layer indicators.
The subjective weights and objective weights of the basic layer are arithmetically averaged to obtain the comprehensive weight of the basic layer evaluation indicators.
Through the correlation analysis of qualitative and quantitative analysis between the second-level indicators of the effect layer and the third-level indicators of the base layer, the subjective weights of the effect layer are transmitted to the third-level indicators of the basic level, and the guiding effect of the effect on the foundation is achieved.
7. Case Study
Using the above-mentioned index system and evaluation method, three provincial power grids are selected, and scores are assigned to each aspect of smart grid development in combination with the weights and index values, thereby assessing the development level of smart grids. The results are as follows.
7.1. Province A
The relevant data (for example, the reliability of power supply, overall labor productivity, the proportion of renewable energy power generation, the evaluation index of quality service) that can reflect the first-level indicators of the effect layer in A province is used as a reference. Ten experts are hired to score the importance level of the first-level indicators in the effect layer, and the weights of the first-level indicators are calculated by the judgment matrix given by the experts. Finally, the weight result obtained by the AHP method is the average value of the calculation results of the ten expert judgment matrix, and then the weight is corrected by the indices of development demand to obtain the final weight of the first-level index, and so on, and the weights of the indicators at all levels are calculated.
The weights calculated using the judgment matrix given by one of the experts is showed in Table 13, and has passed the consistency test.
Therefore, the average value calculated by the judgment experts is given by the ten experts and then corrected to the final weight of the effect layer index. The weight of the first-level index of the base layer is calculated by the entropy weight method. The final result is shown in Table 14.
The second-level indicator “Green Power Generation”, and its associated indicators, are analyzed and the correlations are shown in Table 15.
According to the above introduction, the subjective weights of base layer and objective weights of base layer which obtained by using the entropy method are arithmetically averaged to obtain the comprehensive weight of the corresponding base layer evaluation indicators. The results are shown in Table 16.
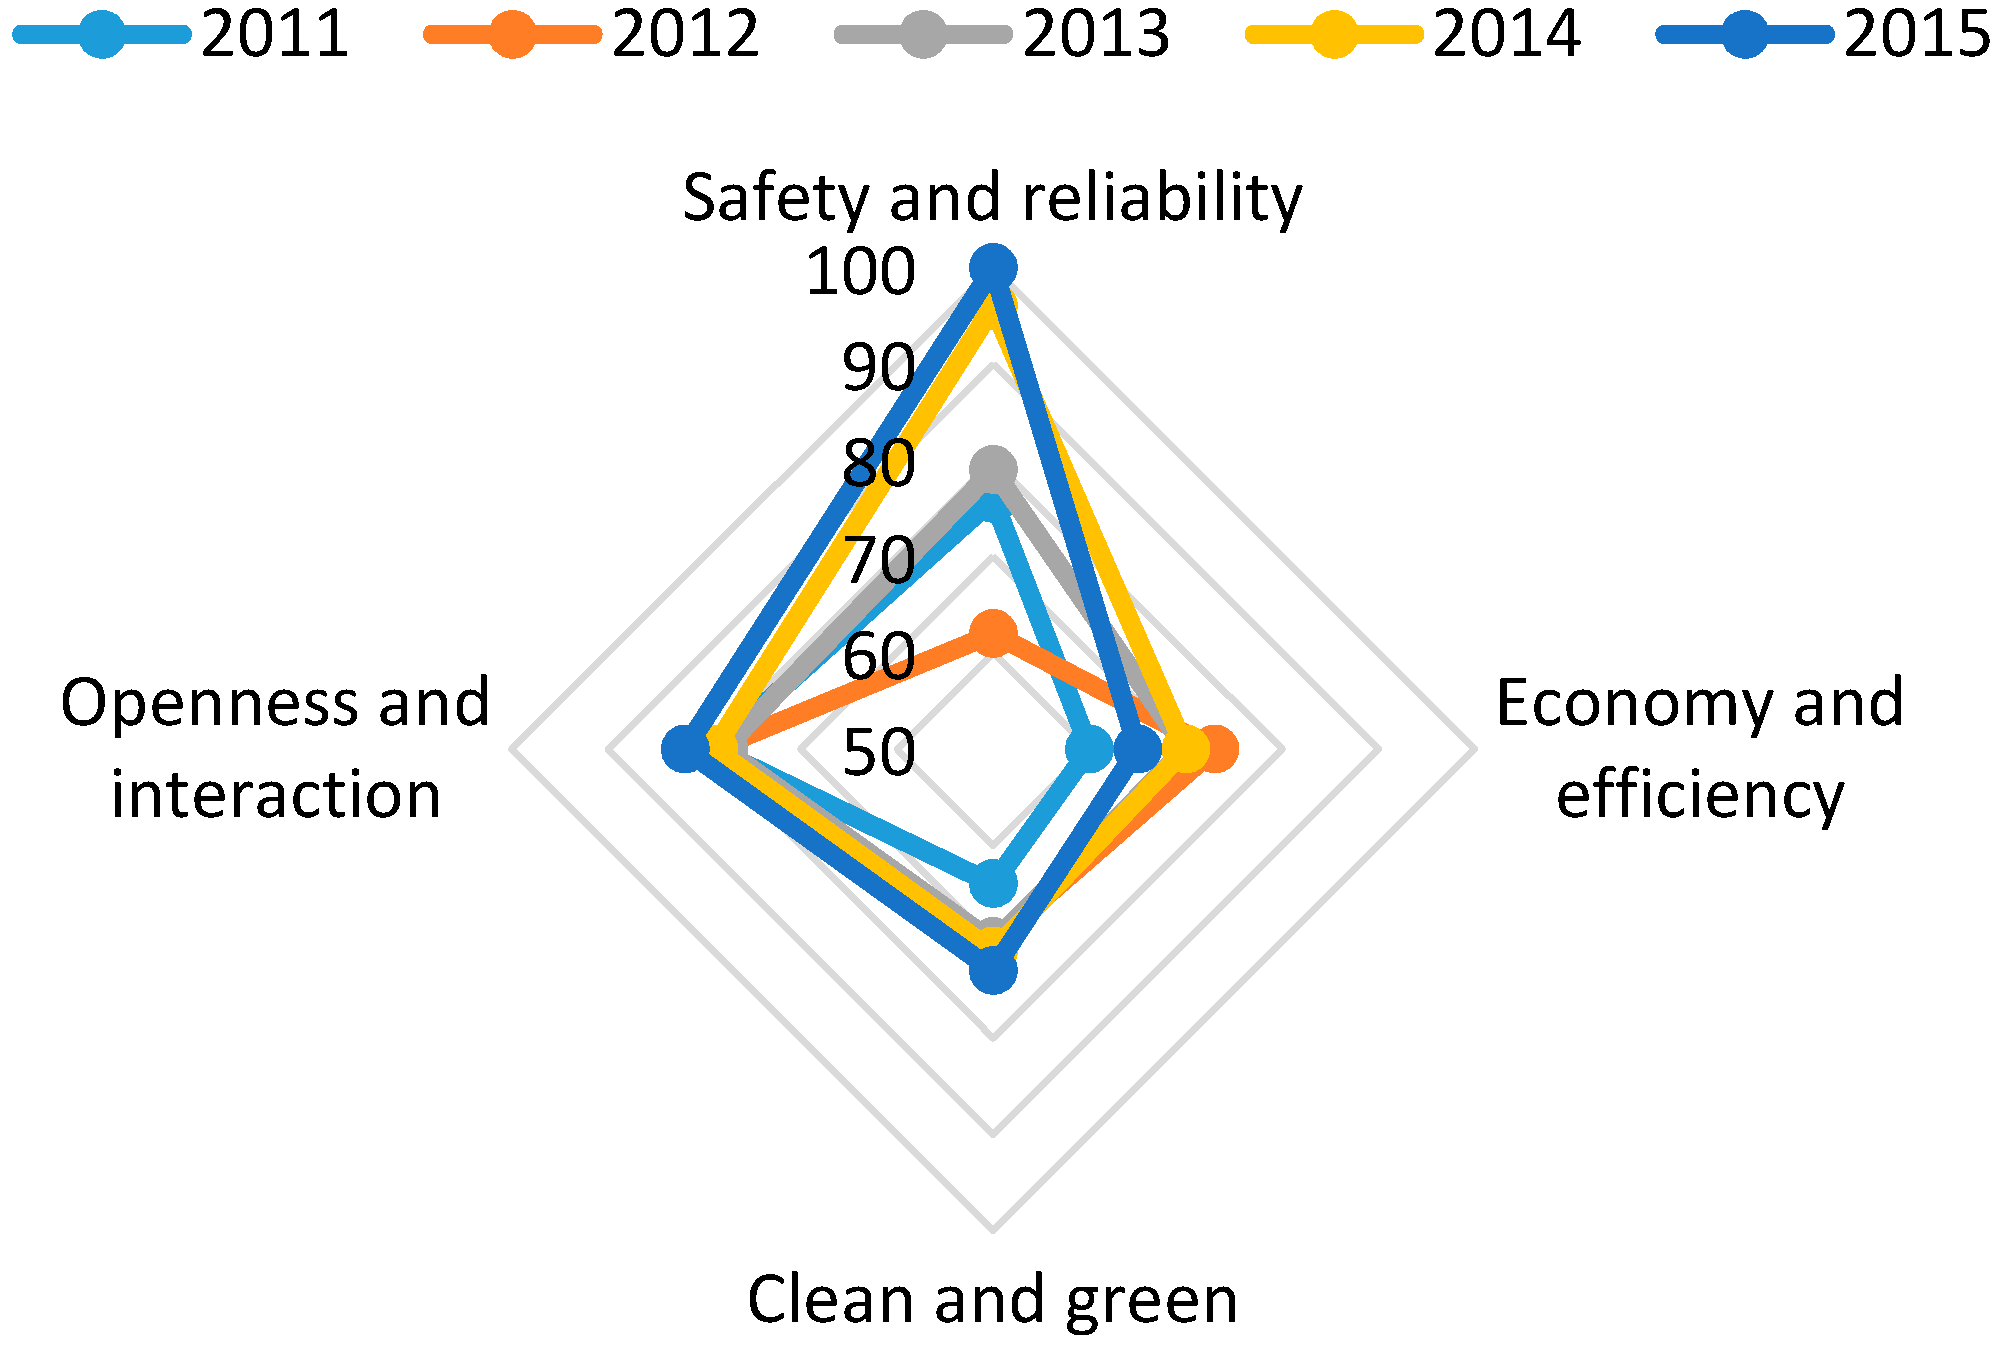
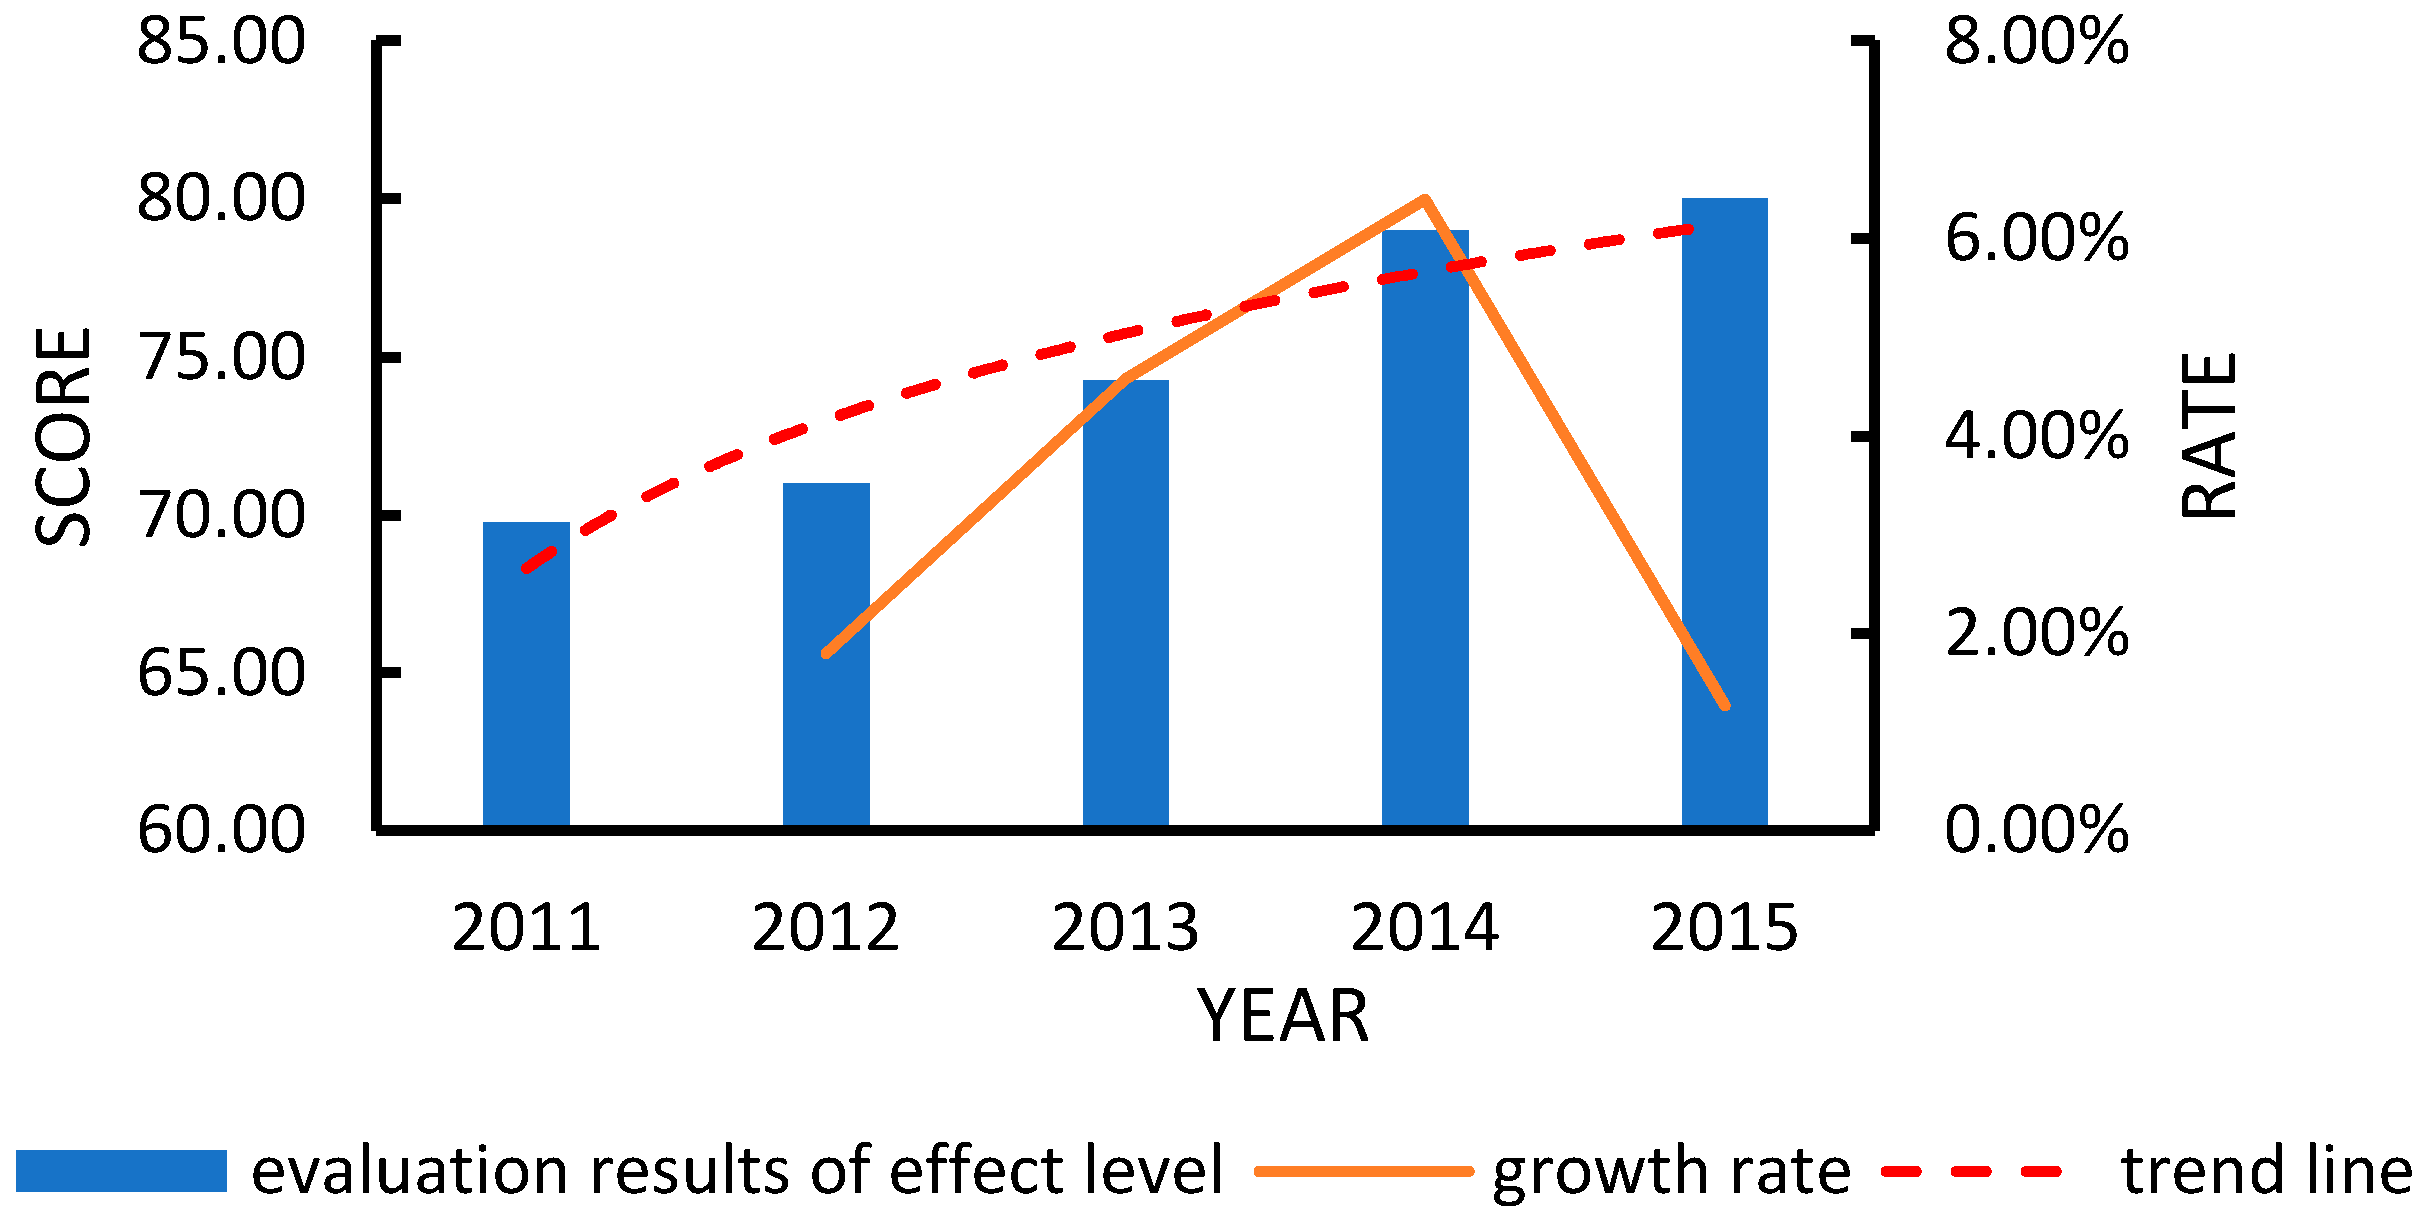
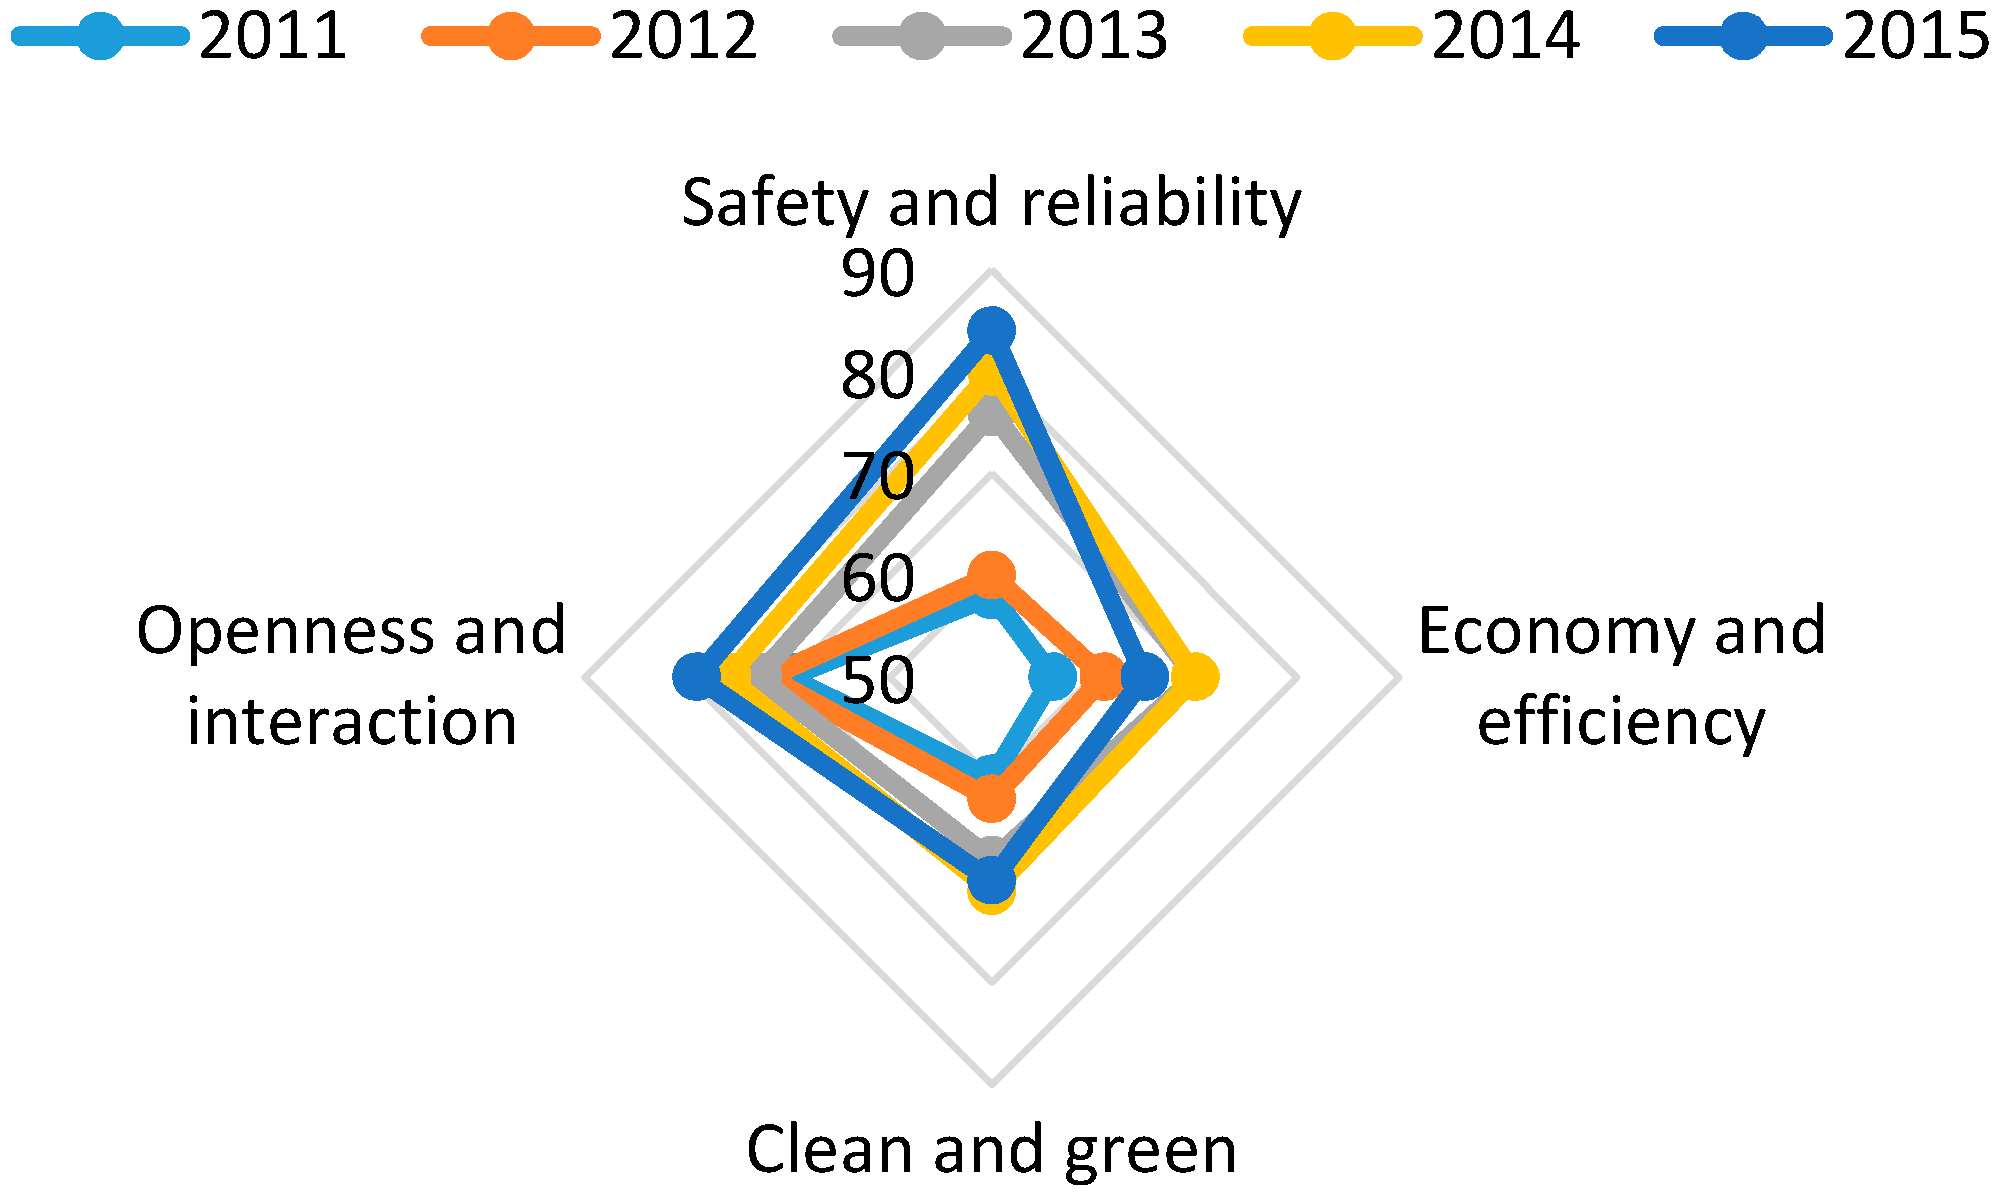
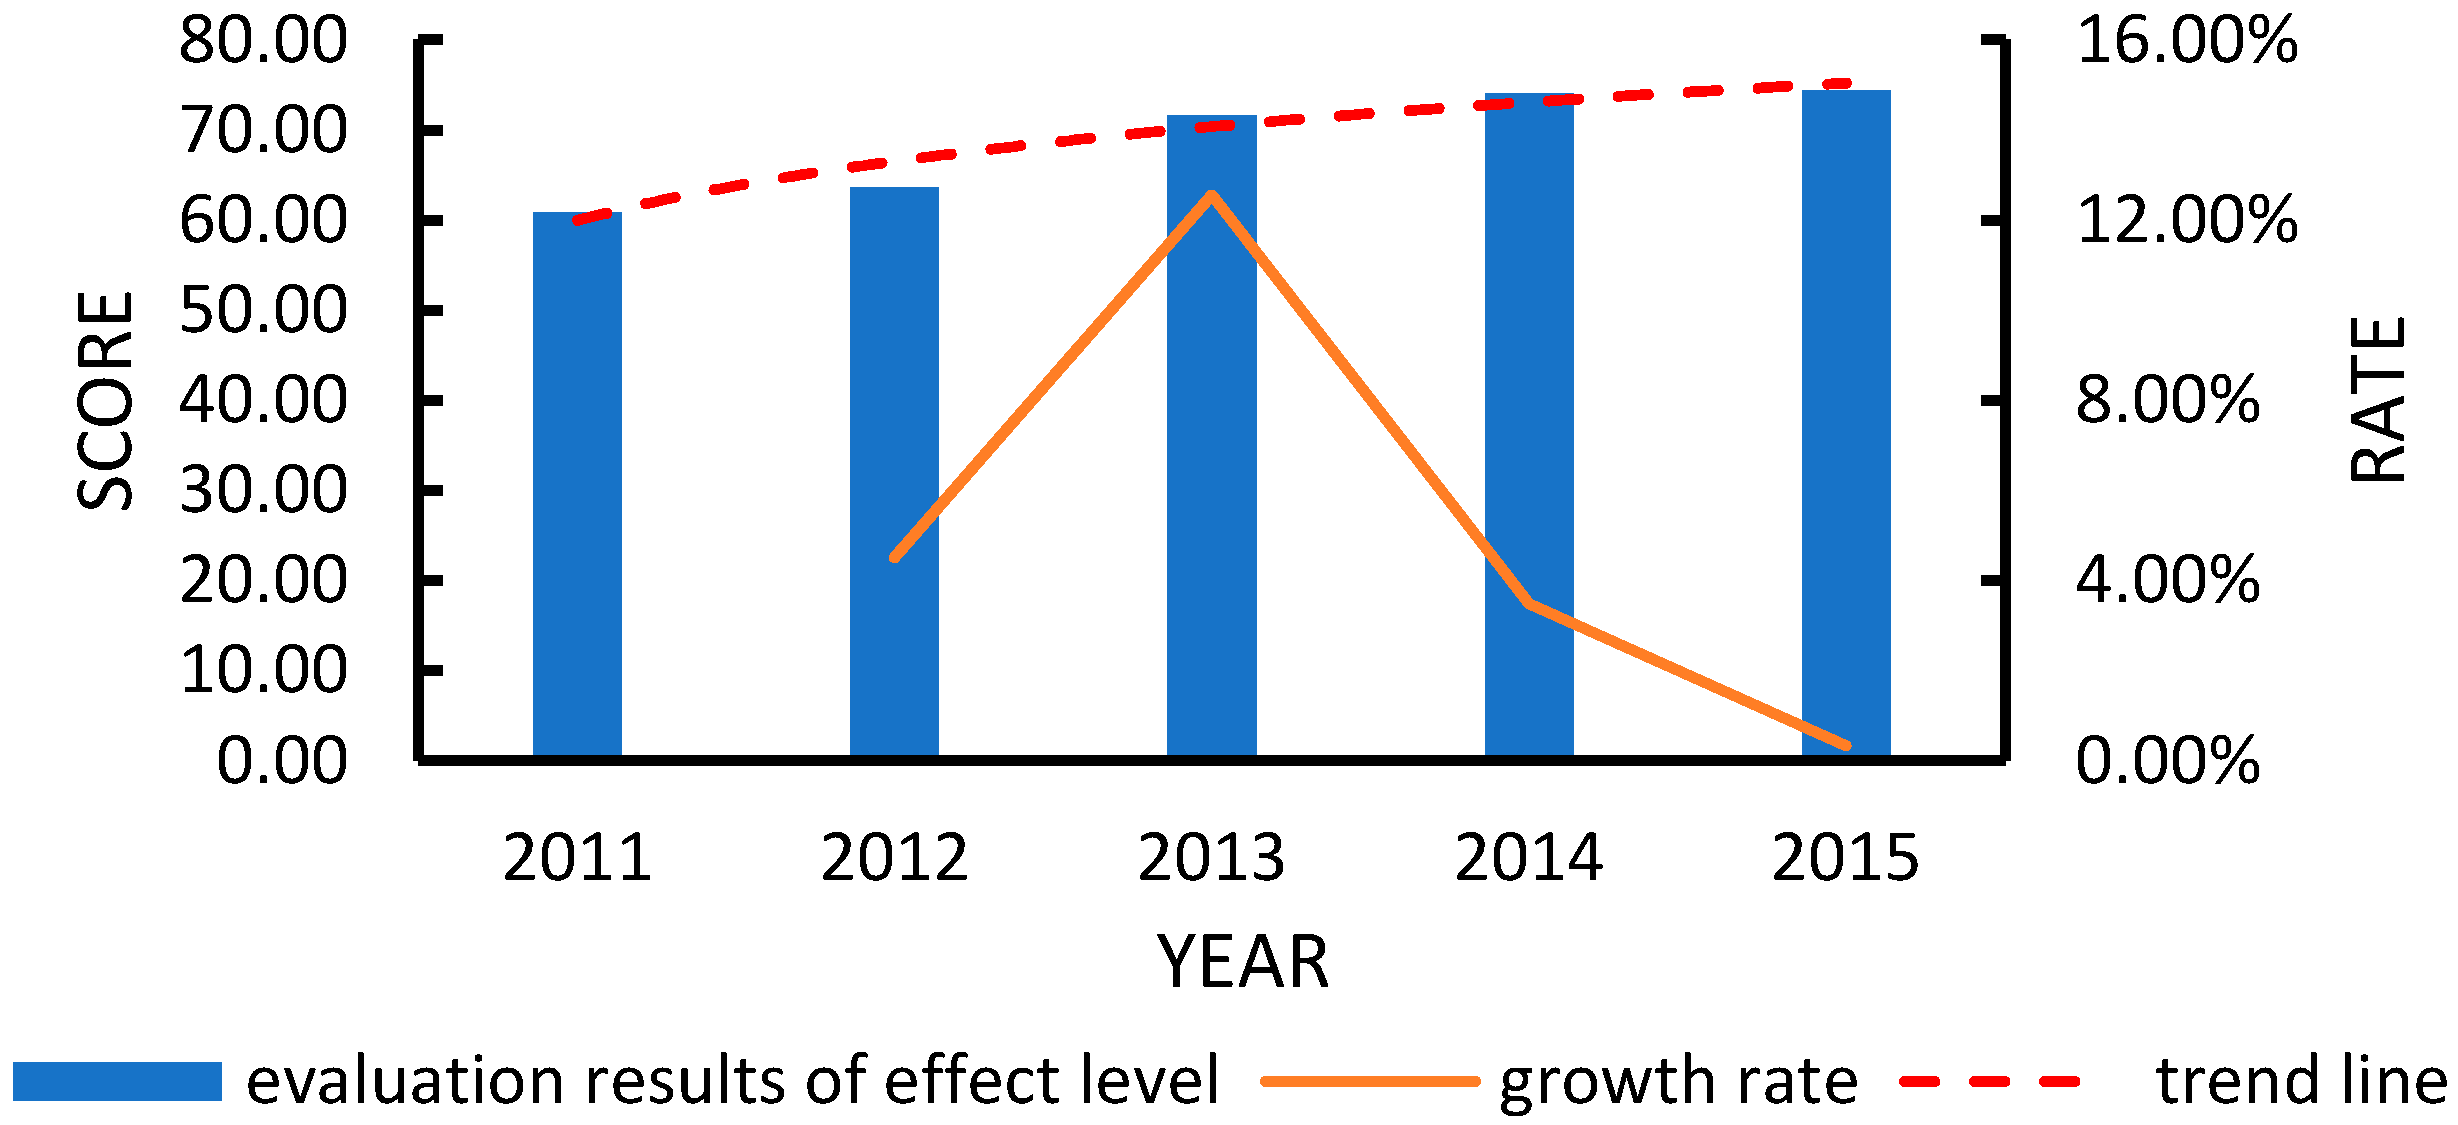
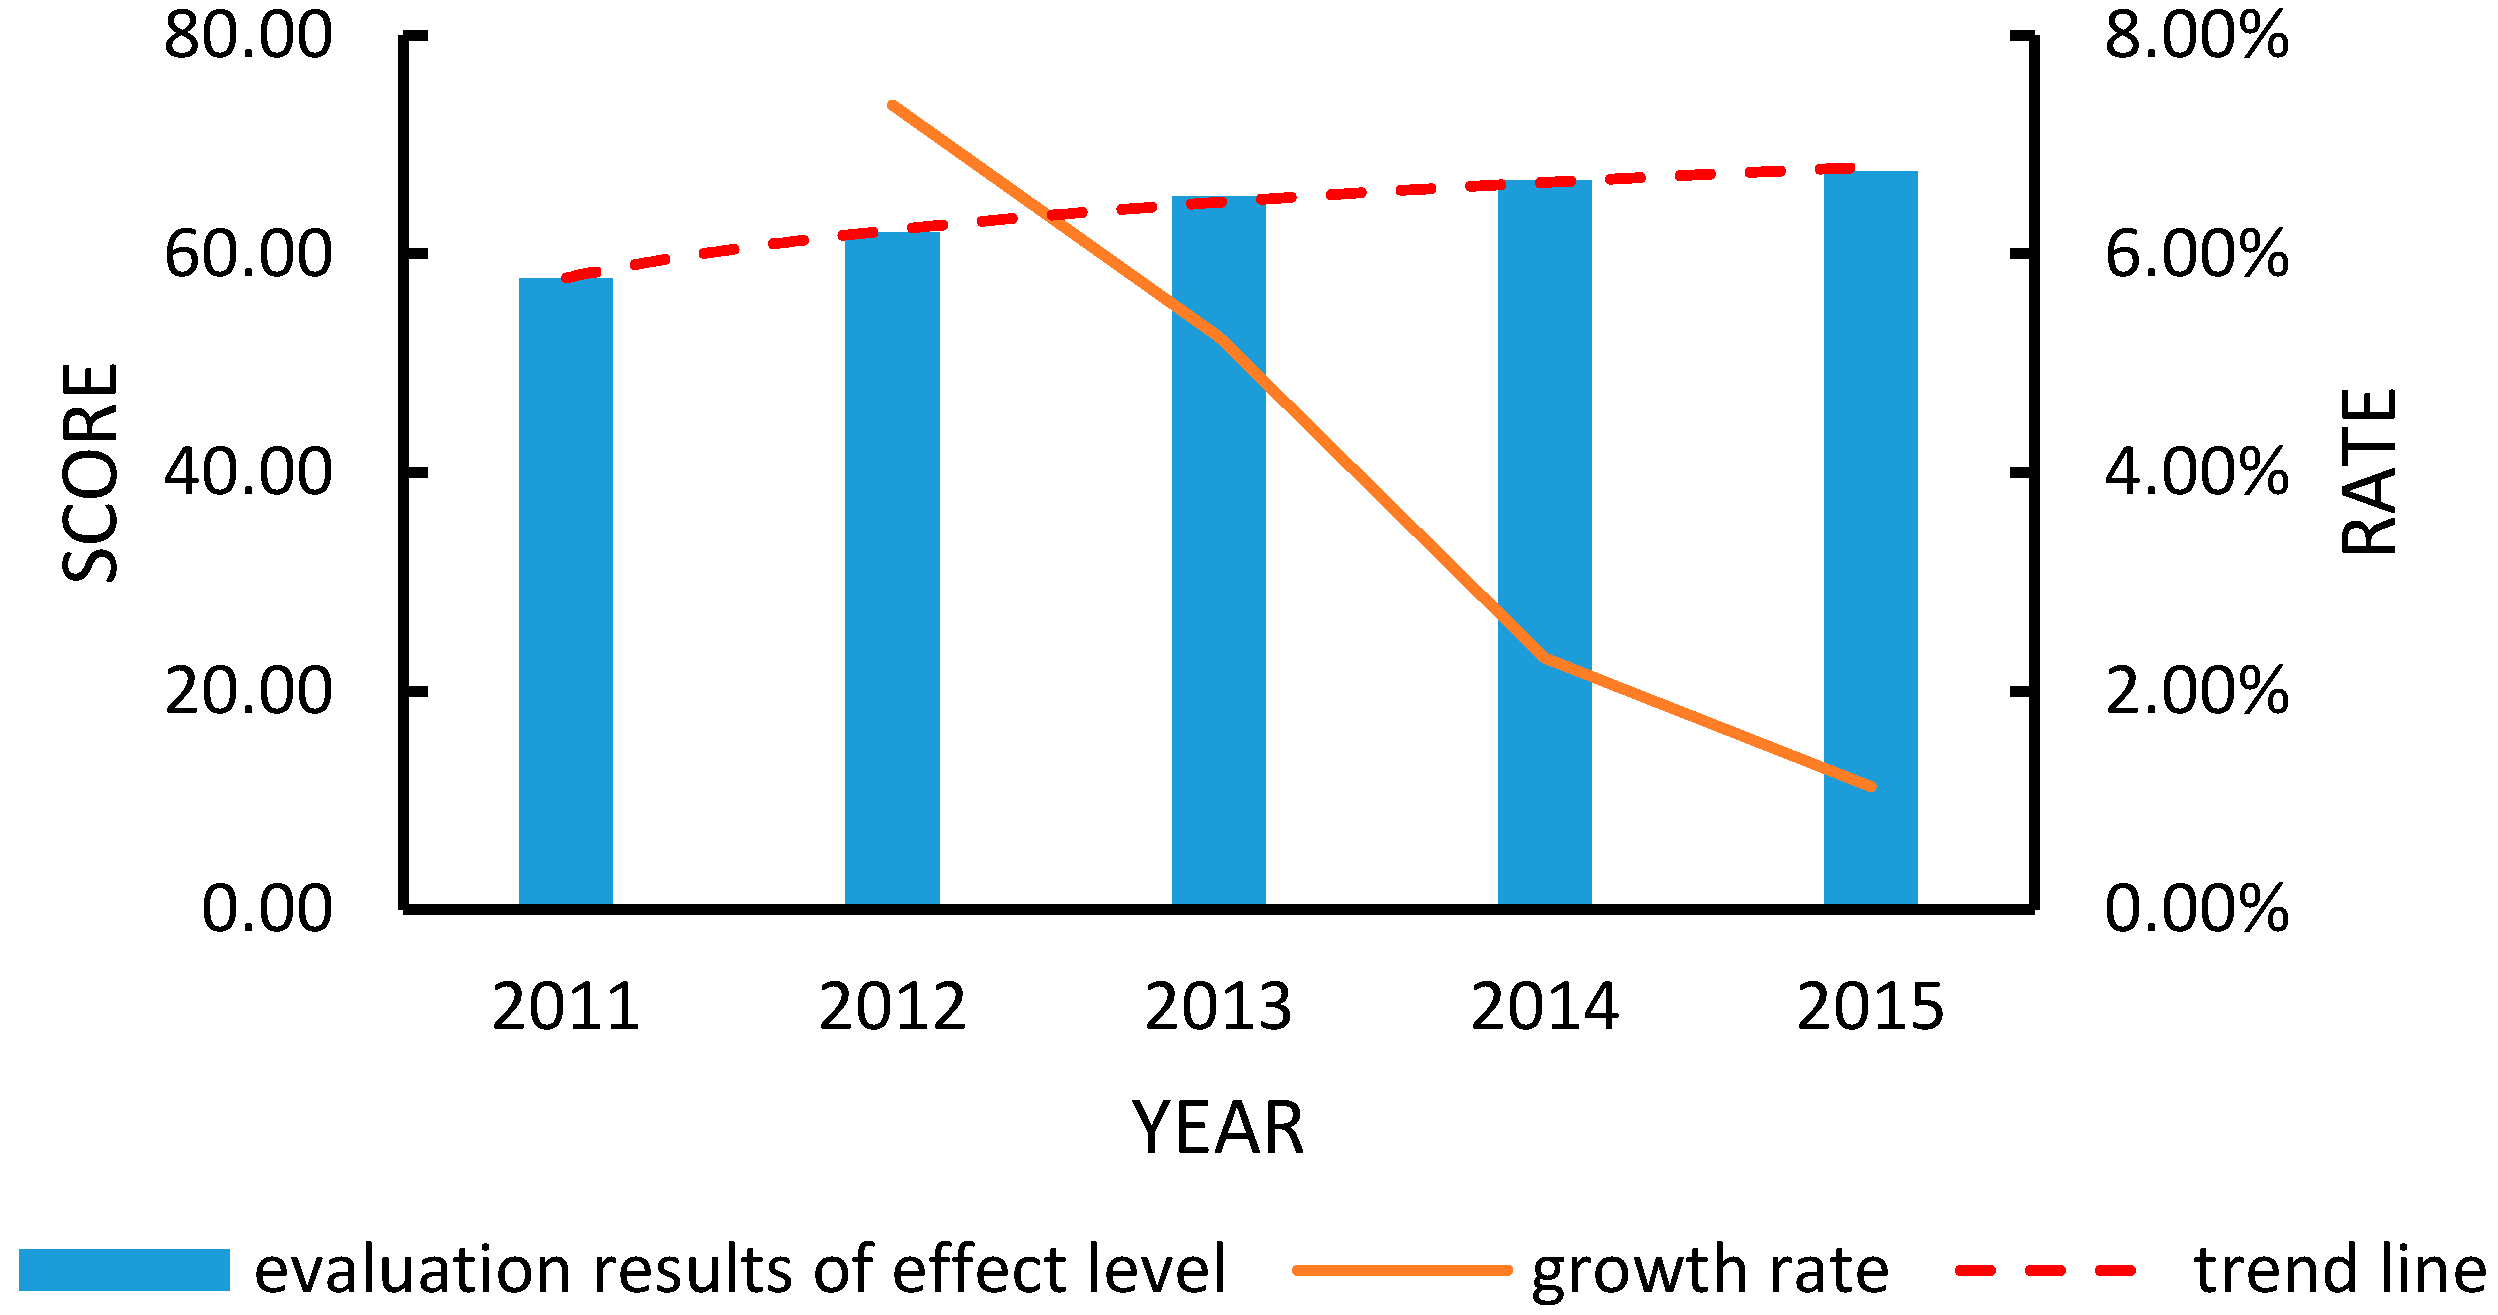
(1) Evaluation results of effect level
As can be seen from the above figure, the radar area is increasing year by year, and the score of the effect level development over the years is also gradually increasing, but the growth rate has a certain fluctuation.
In terms of safety and reliability, the power grid company of the province A actively responded to the call and during the “Twelfth Five-year Plan” period [44], it accelerated the construction of a strong smart grid including the ultra-high voltage (UHV), built a comprehensive demonstration project of the eco-city smart grid and promoted its application, ensuring the province’s reliable supply of power energy and greatly increasing the safety of the power grid. In terms of clean and green, the province is committed to improving the efficiency of thermal power energy use and promoting energy conservation and emission reduction, therefore, the level of it has been improved to some extent. On the whole, the development level of smart grid effect level of province A should be fully promoted through the two main lines of technological progress and management improvement.
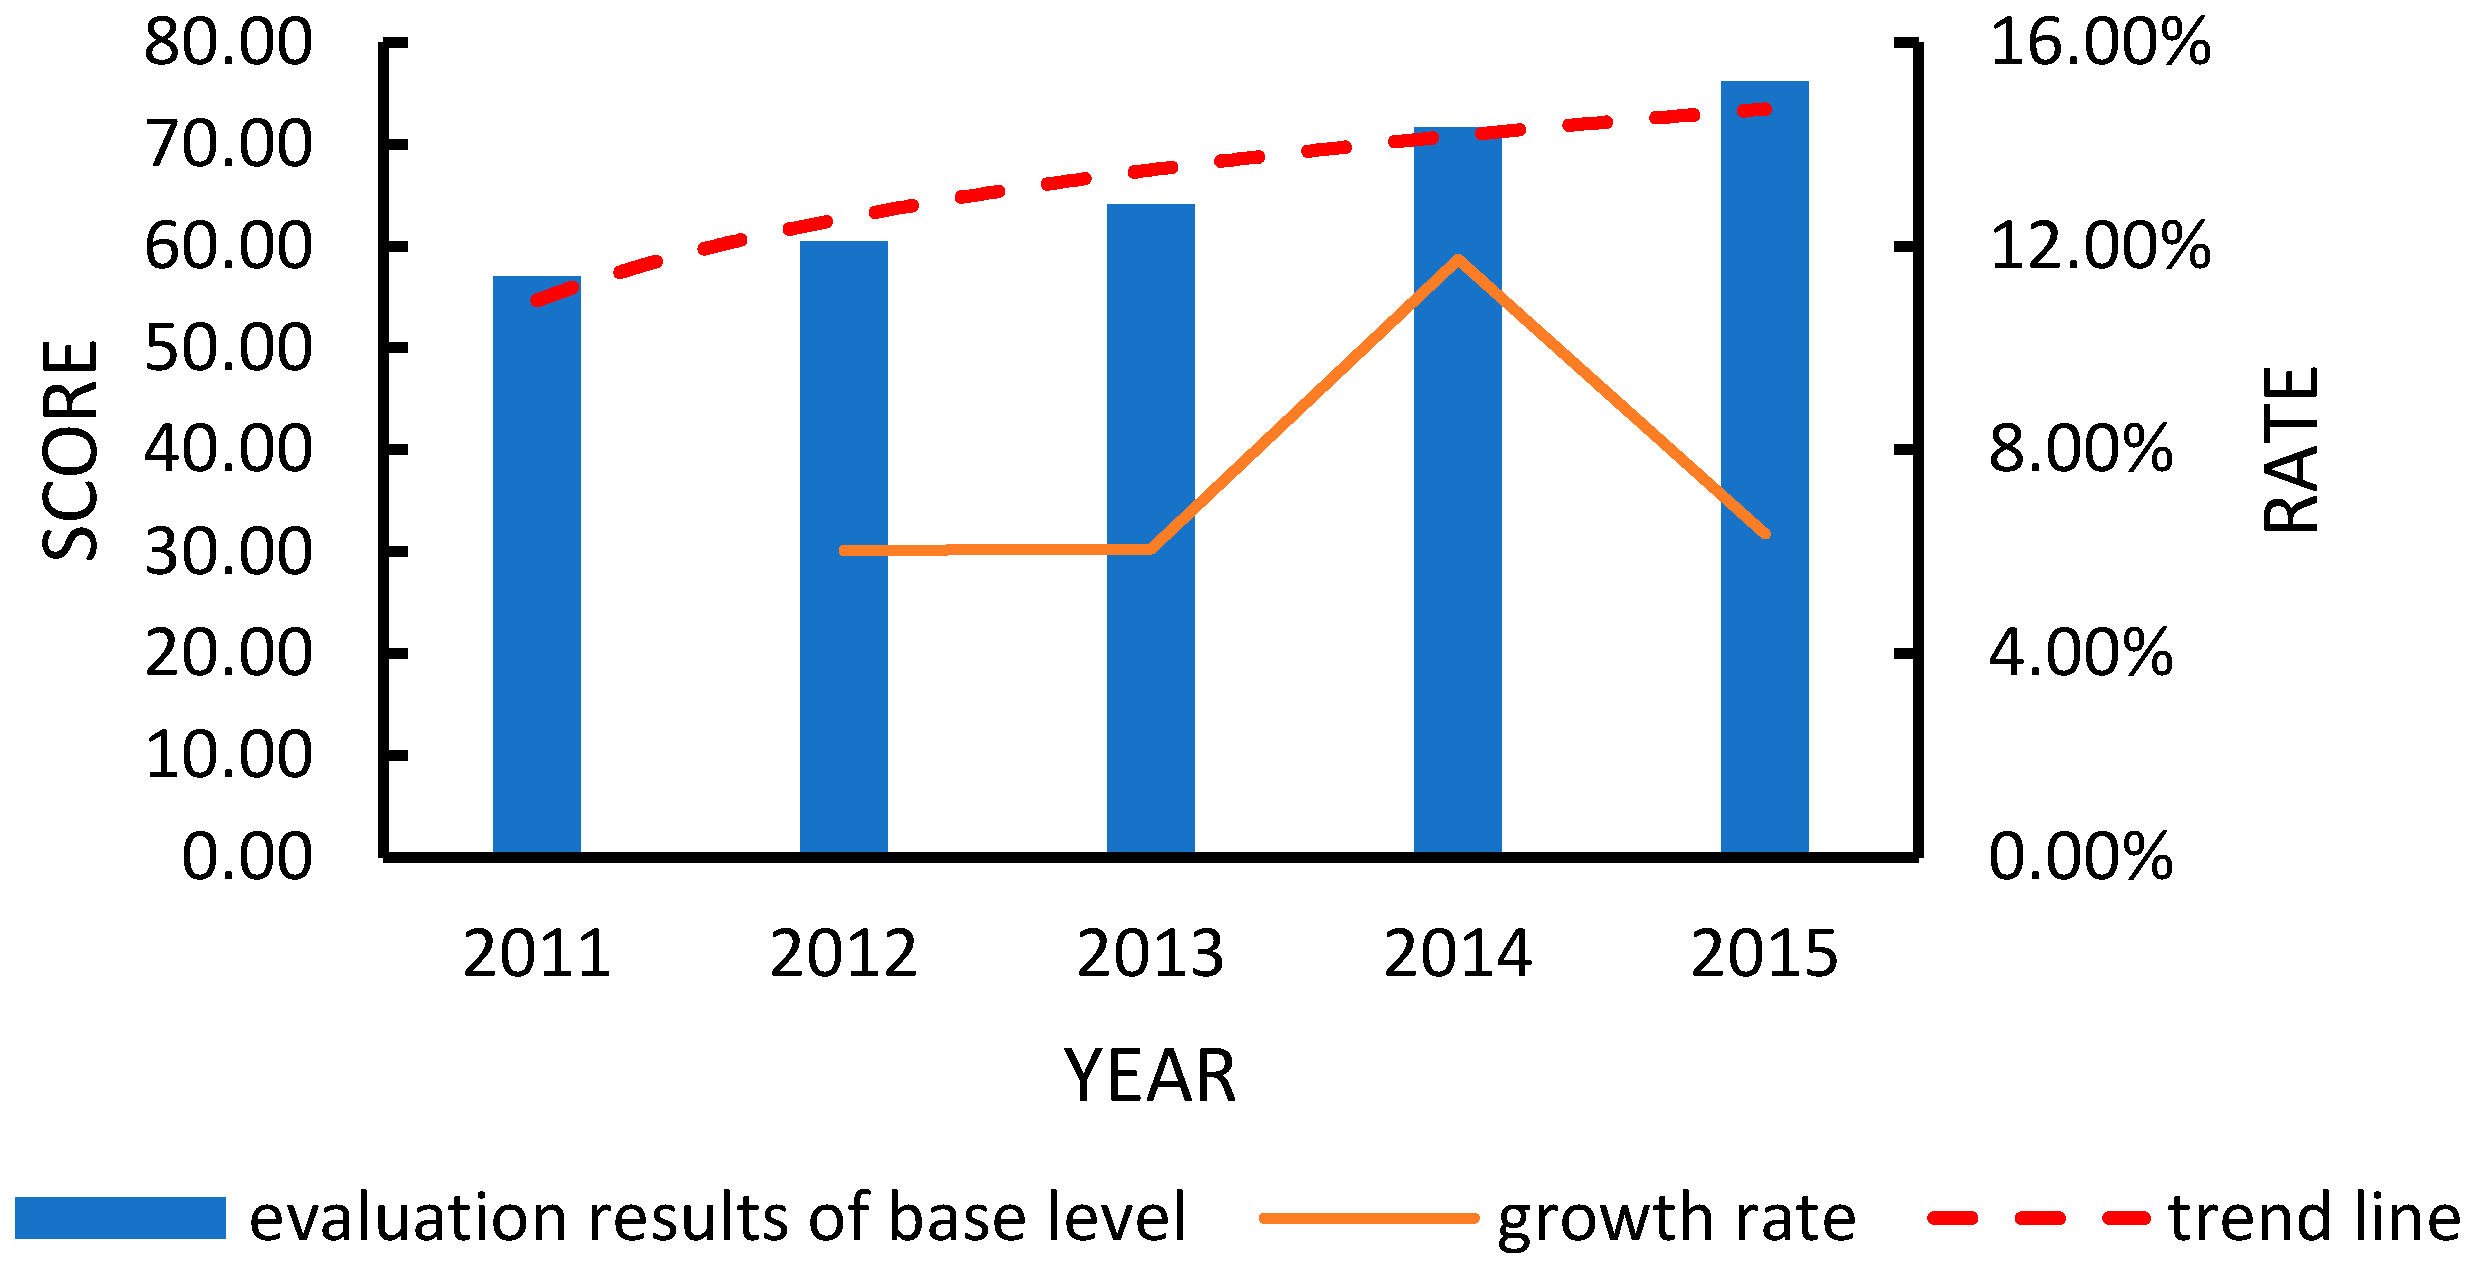
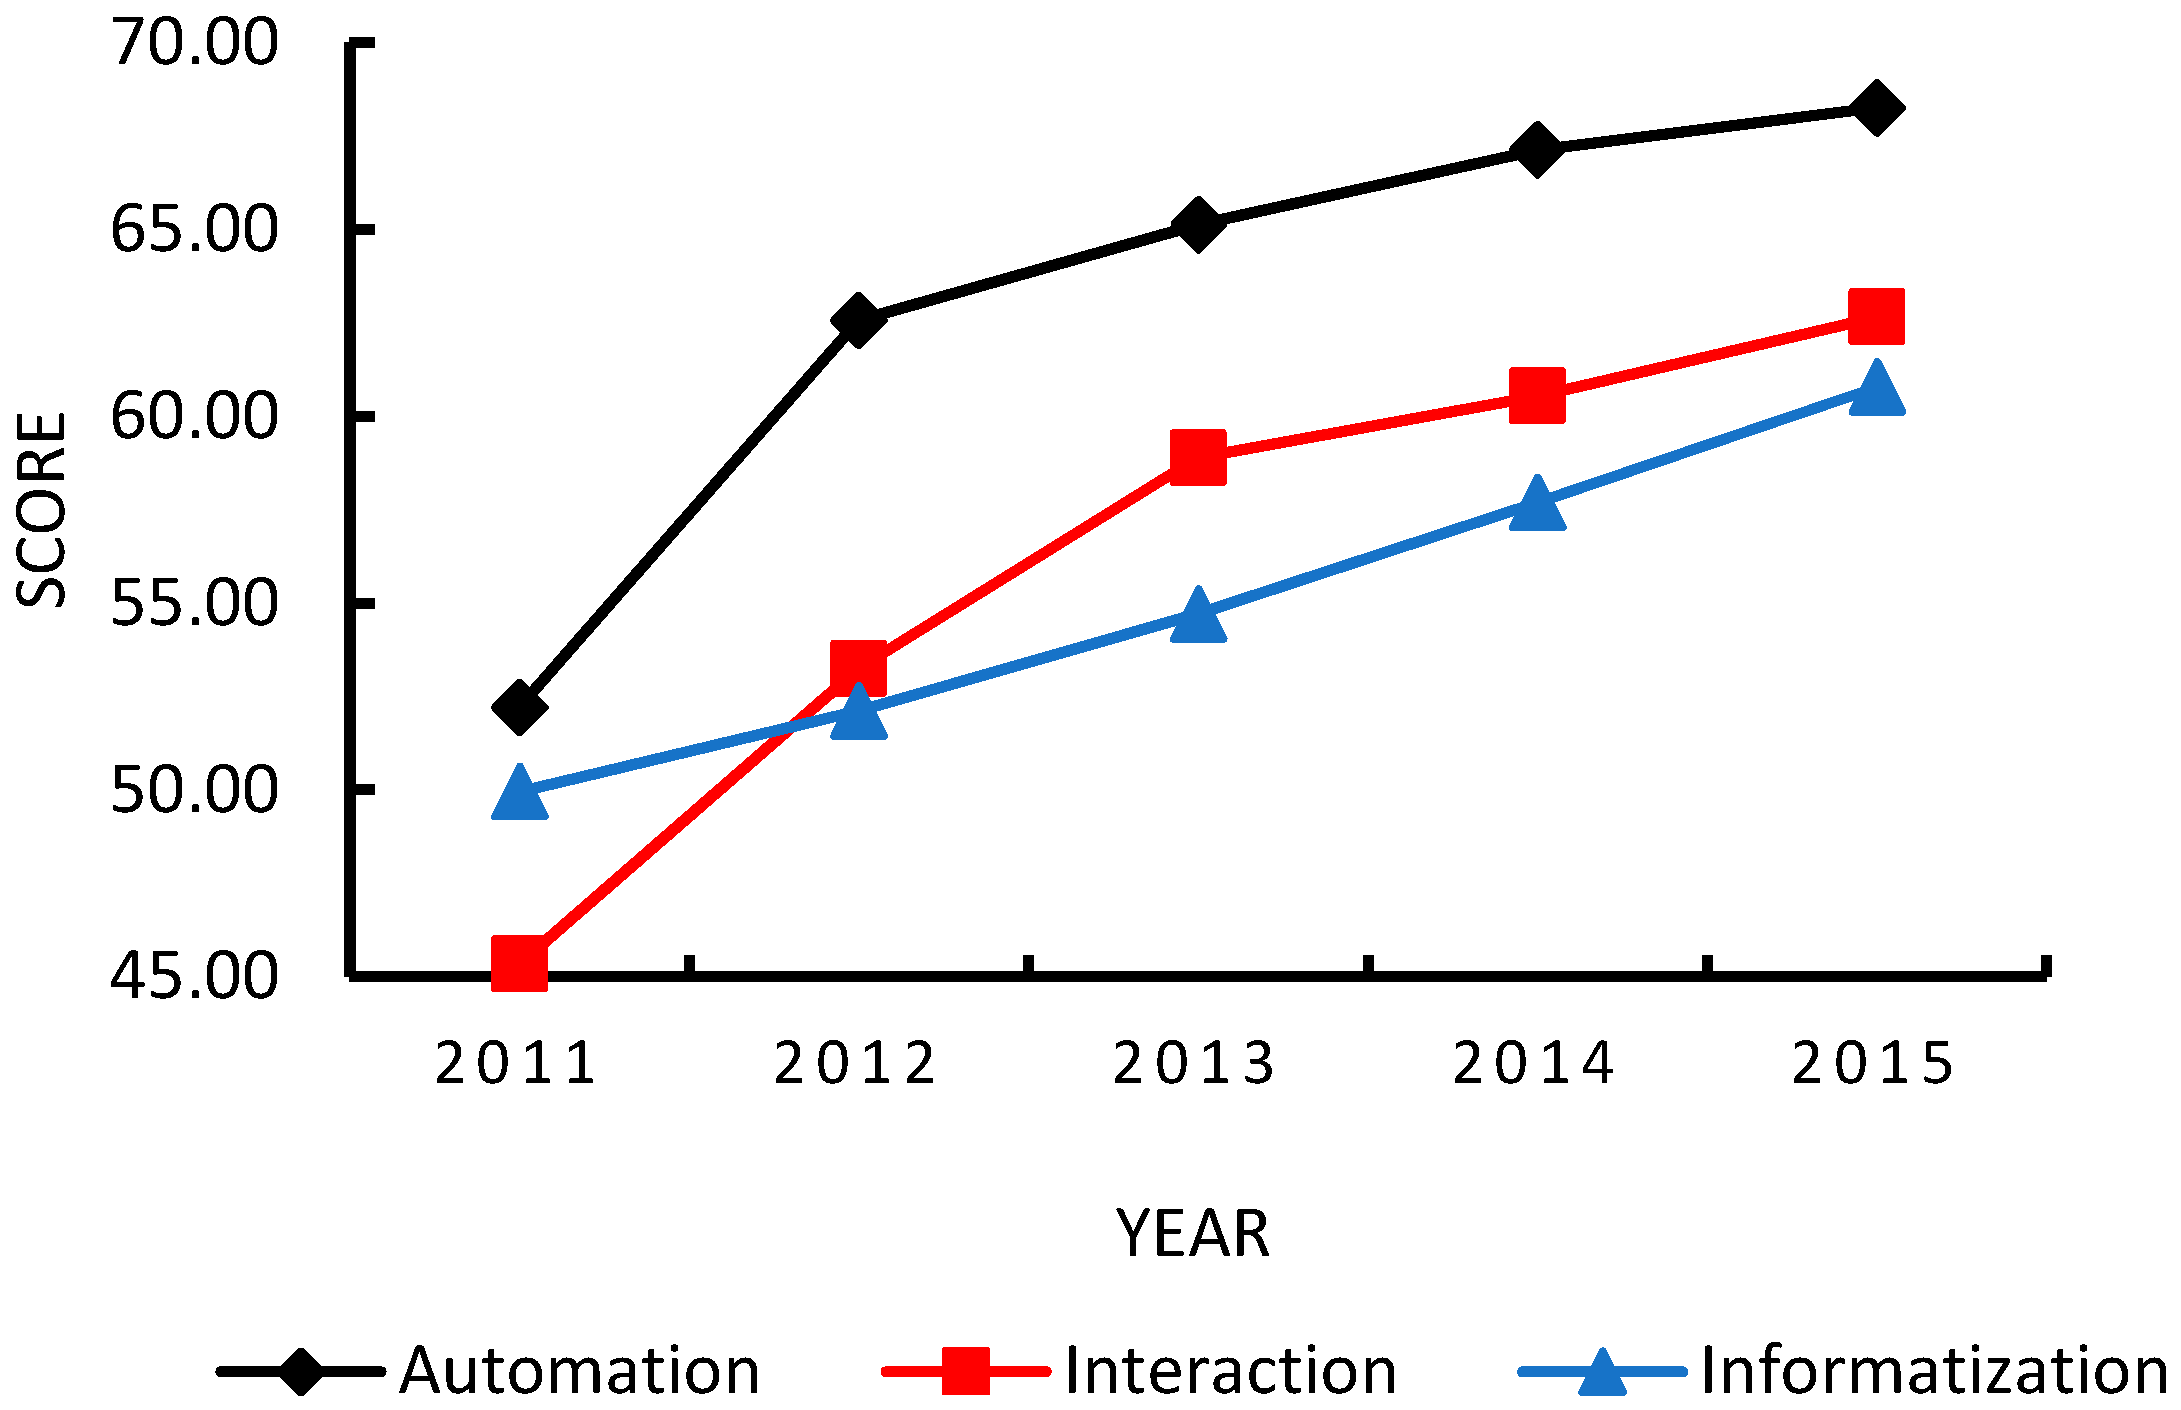
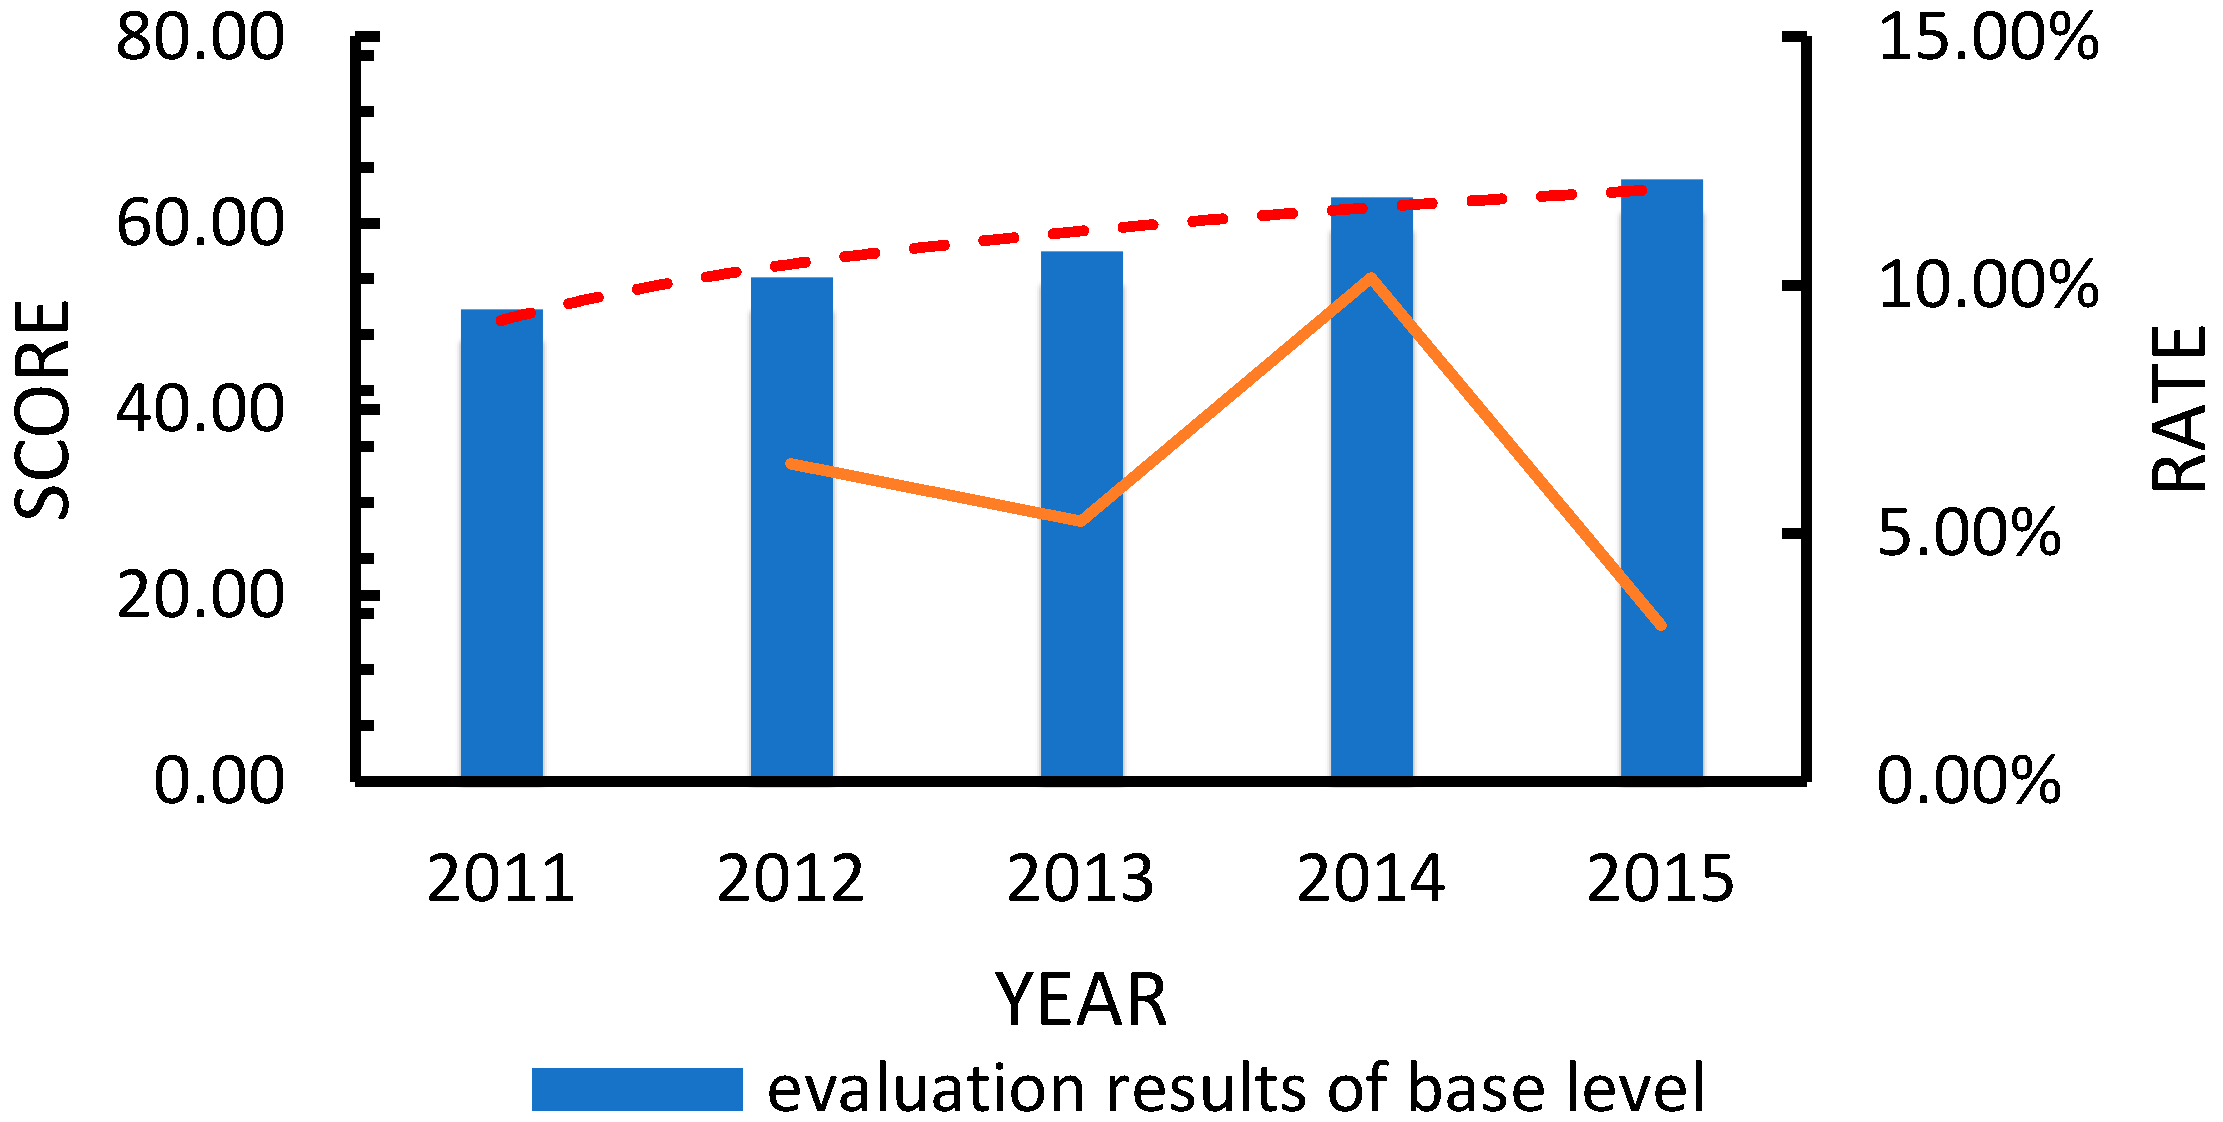
(2) Evaluation results of base level
The level of automation, interaction, and informatization of the smart grid in the province has been gradually improved, so the overall level of its base layer is on the rise. The provincial power company’s smart grid construction plan was completed in 2010 and entered the full-scale construction phase of the smart grid in 2011. During the “Twelfth Five-Year Plan” period, the provincial electric power company increased its investment in the construction of a smart grid, and extensively adopted modern technology and automation equipment. As a result, the level of the base level of power grid has been comprehensively improved.
7.2. Province B
As mentioned above, the weights of corresponding indicators of province B are showed in Table 17, Table 18 and Table 19.
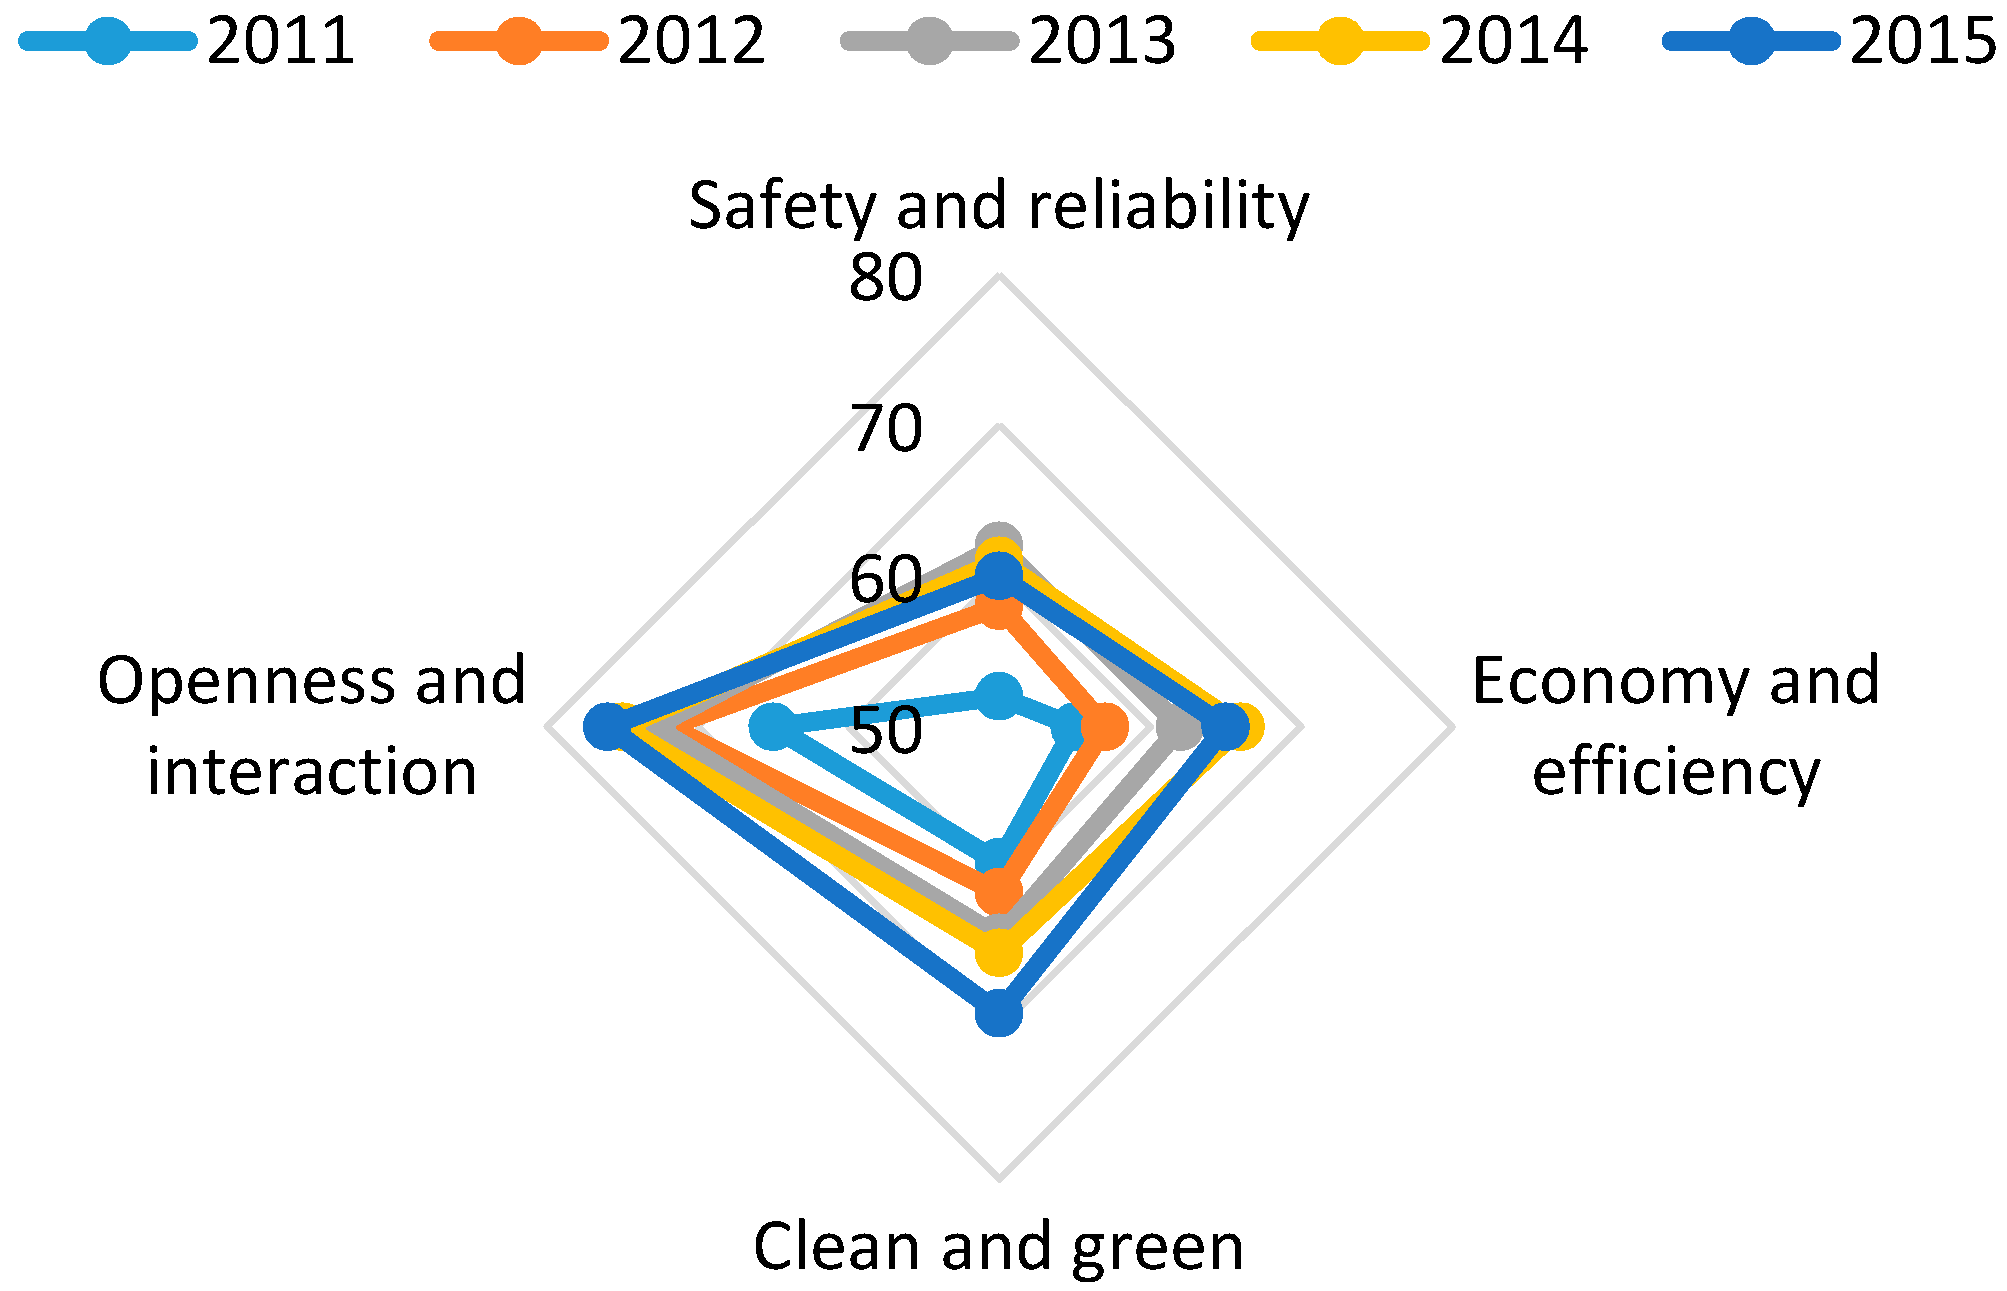
7.2.1. Evaluation Results of Effect Level
As can be seen from the radar map, the radar area is increasing year by year, and the improvement of the intelligent effect tends to be flat. Among them, the progress of safety and reliability is relatively fast, indicating that the Province B’s smart grid construction has a good effect on the construction of power grids and power supplies. In terms of economy and interaction, it may not perform well because related projects are mostly piloted or promoted. From the above figure, it can also be seen that the level of the power grid effect of the province is slowly growing, and the growth rate is fluctuating.
In the aspect of safety and reliability, it is indicated that the construction of the power grid is under the background of UHV AC and DC landing in the Central Plains, and priority is given to ensuring a wide range of optimal allocation of energy resources. In terms of cleanness and green and openness and interaction, the company is a power grid based on thermal power, and marketing and interactive services are starting. In terms of economic and efficiency, due to the large number of historical problems in the grid, the overall weak distribution network and low operating efficiency have not yet been fundamentally reversed.
7.2.2. Evaluation Results of Base Level
The scores of various indicators have increased year by year, indicating that the basic level of Province B’s power grid has become better year by year, among them, the progress of automation and interaction has been greater, indicating that the company’s smart grid construction has achieved significant improvement in technology.
In terms of automation, based on the status of the company’s balanced power grid, the company’s grid security and resource allocation capabilities have been significantly improved through strong cooperation with UHV AC/DC interconnected power grid construction in such areas as power generation, transmission, and dispatch. In terms of informatization and interaction, it can be seen from the above figure that its level is increasing year by year. This is because of the development of related technologies such as measurement, communications, information, and control.
7.3. Province C
As mentioned above, the weights of corresponding indicators of province C are showed in Table 20, Table 21 and Table 22.
7.3.1. Evaluation Results of Effect Level
As can be seen from the above figure, the overall level of the effect layer is increased year by year, but the growth rate fluctuates.
Due to the abundance of wind resources in the province C, ten million kilowatts of wind power bases were built during the period of the Twelfth Five-Year Plan. Some wind power bases are centralized renewable energy generation (CRG) in terms of access methods. After the CRG is connected to the power grid, it has an important and positive effect on energy conservation, emission reduction and energy structure optimization, but it has affected the security and stable operation of the power grid to some extent. At the same time, clean energy alternative projects have been carried out in some areas of the province, which has made great progress in cleaning and environmental protection.
7.3.2. Evaluation Results of Base Level
From the above figure, we can see that the level of automation, interaction and informatization of the smart grid in the province has been increasing year by year, but the growth rate is different.
In terms of automation and informatization, the growth rate accelerated in 2013. This is because in 2013, the provincial power grid company carried out all-round power grid geographic information system collection work. As of June 2015, with the province’s total 35 kV, 110 The GIS data collection work of the KV transmission line was fully completed. The power company of the province realized visualization, space, and automation management of the power grid through the power grid GIS “big data”, thus greatly improving the automation and informatization level of the entire power grid. As for interaction, its growth rate has been relatively stable.
7.4. Comparison
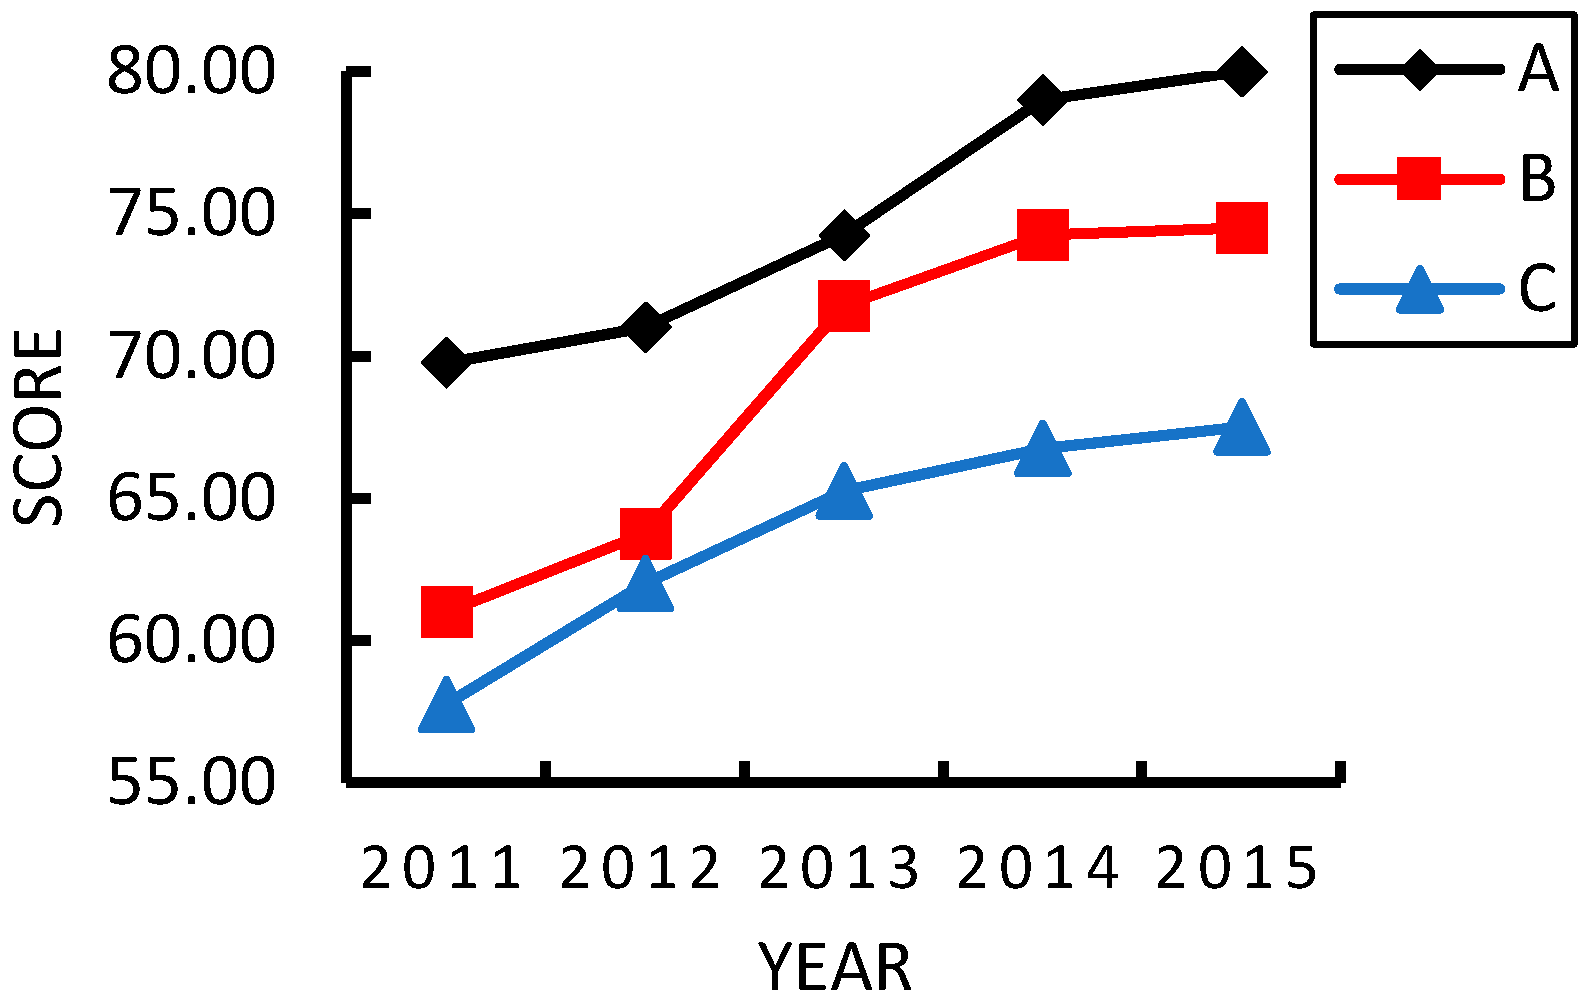
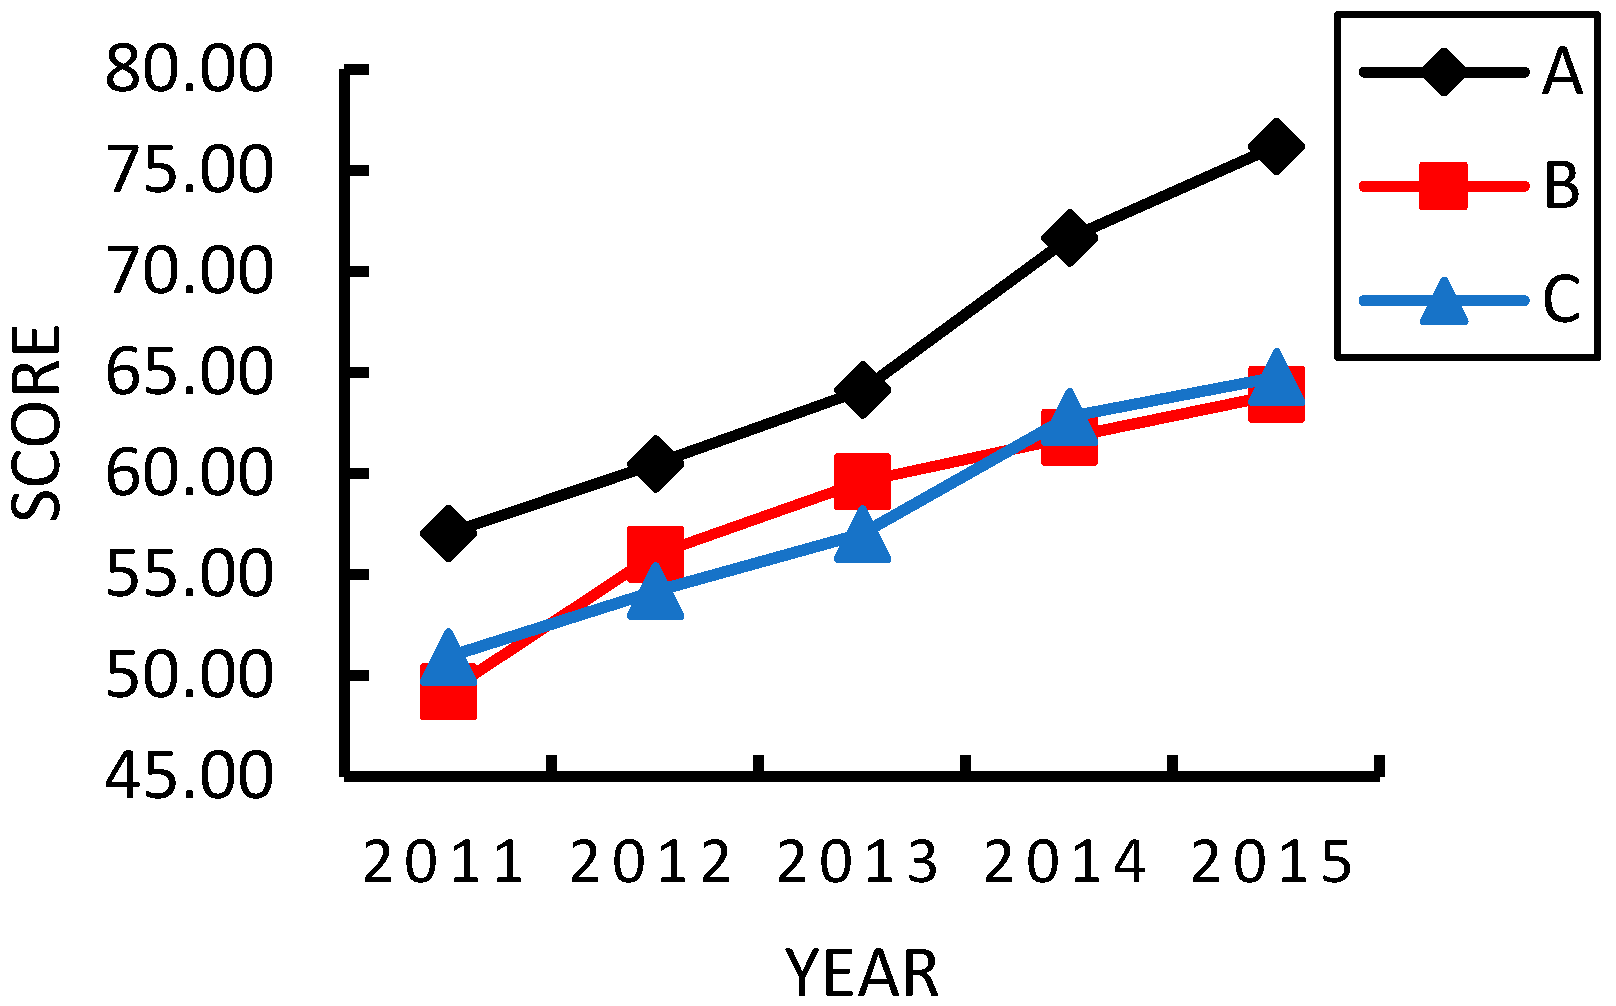
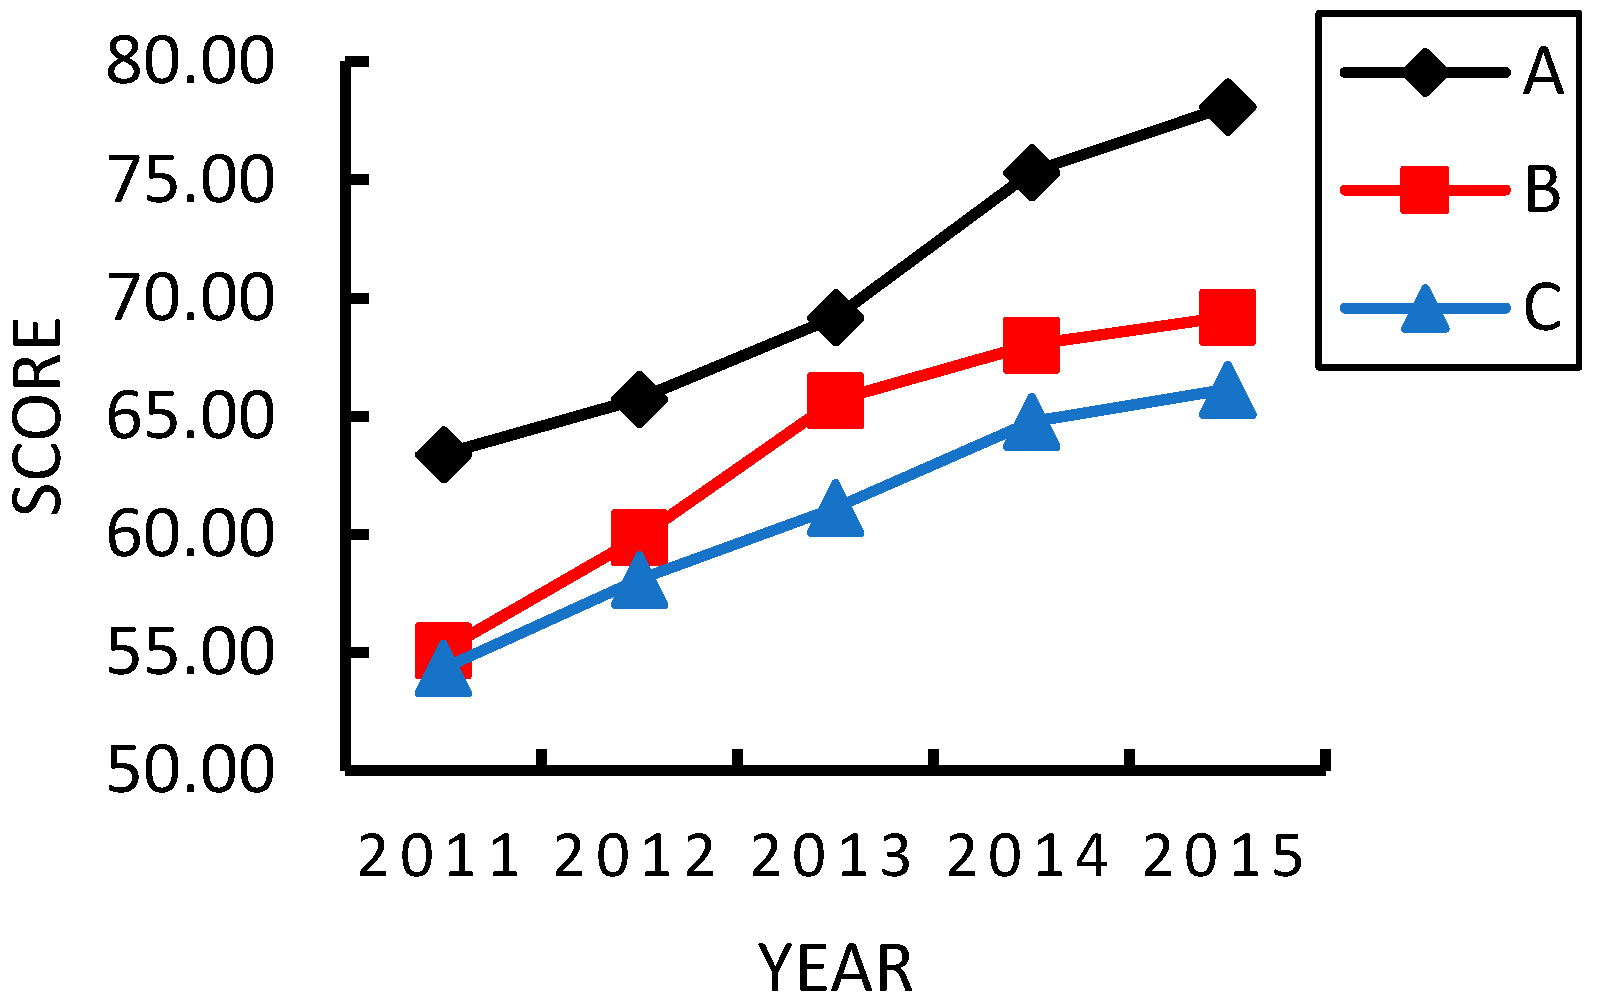
The above method can be used to compare the development level of smart grids in the three provinces. The results are shown in the Figure 19, Figure 20 and Figure 21.
As can be seen from above figures, in the early stage of smart grid construction in 2011, although the scores of the base layer were low, the construction achievements were remarkable, and the scores in the effect layer were relatively high. With the promotion and construction of the smart grid, although the levels of intelligence of the grid infrastructure keep growing at a certain rate, the speed of the improvement of the effect layer has decreased year by year and tends to be flat; by 2014–2015, although the score of the base layer continues to increase, the score of the effect layer has grown little, which fully reflects the development rule that the smart grid has been in an all-round construction phase.
The final comprehensive evaluation results show that Province A is better than Province B in the overall level of smart grid development, and Province B is better than Province C. Therefore, the power companies in Province B and Province C need to further strengthen the construction and operation management of the smart grid.
8. Conclusions
Based on the difference of demand for the development of smart grid, this paper first establishes its own index system. Subsequently, this paper proposes the implementation path of the evaluation model. Finally, three typical provinces were selected to evaluate and compare the level of smart grid development.
We know that as the smart grid is written into the “Twelfth Five-Year Plan”, its status in the country’s strategic emerging industries gradually emerged, and the nation’s smart grid construction was fully launched. The year 2011 is the first year for the smart grid to enter the comprehensive construction phase. It is also the starting point for the smart grid to achieve leapfrogging from pilot construction to comprehensive construction. By 2015, a strong smart grid operation control and two-way interactive service system has been formed to basically achieve friendly access and coordinated control of renewable energy such as wind power and solar power generation.
Based on this background, this paper proposes to evaluate the development level of smart grid using weight modification, transmission mechanisms, and evaluation methods combining subjective and objective weights, and selects three typical provinces for case demonstration.
For Province A, its development goal in the Twelfth Five-Year Plan is to build a strong, self-reliant, economical, compatible, flexible, and integrated urban power grid that matches the orientation of urban development and is characterized by information, automation, and interaction. Therefore, the government has increased investment, promoted energy-saving construction, and adopted modern technology and automation equipment. As a result, the level of the effect layer and base layer of smart grid is relatively high, and its overall level is also relatively high compared to other provinces. For provinces B and C, due to historical issues and different stages of development, the overall level of smart grid development is relatively low compared to province A.
Through the analysis of relevant examples, it can be proved that the evaluation model can make an association analysis between the construction foundation and the construction effect, and make a comprehensive and deep evaluation of the development level of the smart grid in our country, which is of guiding significance to the future intelligent construction of the power grid.
When using this evaluation method to calculate the weight, the general indicators such as the number of transmission and transformation accidents, overall labor productivity, the proportion of renewable energy power generation, the rate of electricity market transaction power growth, the ratio of intelligent substation, the coverage of smart electric meter, and so on, can be directly applied to different regions and countries, but it should be noted that because different metrics are used around the world, such as assessing the reliability of power systems, there are different indicators, such as SAIDI/SAIFI, and the indicators proposed in this paper are not all versatile, therefore, when applying this method, some substitutions can be made appropriately without affecting the content embodied in the indicator.
Author Contributions
J.L. contributed to the conception and design. T.L. contributed to the computation and English editing. L.H. contributed to the analysis of calculation results and English checking. All of the authors drafted and revised the manuscript together and approved its final publication.
Funding
This work has been supported by “Ministry of Education, Humanities and Social Science Fund, Nos. 15YJC630058”, “Beijing Social Science Fund, Nos. 18GLB023”, “the Fundamental Research Funds for the Central Universities, Ns. 2017MS083”, and “the Science and Technology Project of SGCC”.
Acknowledgments
The authors thank the reviewers and editors whose comments improved the quality of this paper.
Conflicts of Interest
The authors declare no conflict of interest.
References
- Ringenson, T.; Eriksson, E.; Wangel, J. The Limits of the Smart Sustainable City; The Workshop on Computing within Limits; ACM: New York, NY, USA, 2017; pp. 3–9. [Google Scholar]
- Chen, S.Y.; Song, S.F.; Li, L.X.; Shen, J. Summary of Smart Grid Technology. Power Syst. Technol. 2009, 33, 1–7. [Google Scholar]
- Chen, S.Y.; Song, S.F.; Li, L.X.; Shen, J. Research on Intelligent Grid Evaluation Index System. Power Syst. Technol. 2009, 33, 14–18. [Google Scholar]
- Yu, Y.; Luan, W. Review of Smart Grid. Proc. CSEE 2009, 29, 1–8. [Google Scholar]
- Ni, J.; He, G.; Shen, C.; Deng, Y.; Deng, Z.; Huang, W. A review of assessment of smart grid in America. Autom. Electr. Power Syst. 2010, 34, 9–13. [Google Scholar]
- Smart Grid Method and Model; IBM Corporation: Beijing, China, 2010.
- European Smart Grids Technology Platform. Strategic Deployment Document for Europe’s Electricity Networks of the Future; European Commission: Brussels, Belgium, 2008. [Google Scholar]
- Yu, H.; Jia, Q.; Wang, N.; Dong, H. A Data-Driven Modeling Strategy for Smart Grid Power Quality Coupling Assessment Based on Time Series Pattern Matching. Math. Probl. Eng. 2018, 2018, 1–12. [Google Scholar] [CrossRef] [Green Version]
- Park, S.; Kang, B.; Choi, M.I.; Jeon, S.; Park, S. A micro-distributed ESS-based smart LED streetlight system for intelligent demand management of the micro grid. Sustain. Cities Soc. 2018, 39, 801–813. [Google Scholar] [CrossRef]
- Jesus, O.D.; Antunes, C.H. Economic valuation of smart grid investments on electricity markets. Sustain. Energy Grids Netw. 2018, 16, 70–90. [Google Scholar] [CrossRef]
- Peng, H.; Kan, Z.; Zhao, D.; Han, J.; Lu, J.; Hu, Z. Reliability analysis in interdependent smart grid systems. Phys. A Stat. Mech. Its Appl. 2018, 500, 50–59. [Google Scholar] [CrossRef]
- Leszczyna, R. Standards on cyber security assessment of smart grid. Int. J. Crit. Infrastruct. Prot. 2018, 22, 70–89. [Google Scholar] [CrossRef]
- Cacciatore, G.; Fiandrino, C.; Kliazovich, D.; Granelli, F.; Bouvry, P. Cost analysis of smart lighting solutions for smart cities. In Proceedings of the IEEE International Conference on Communications, Paris, France, 21–25 May 2017. [Google Scholar]
- Hashemi-Dezaki, H.; Askarian-Abyaneh, H.; Shams-Ansari, A.; DehghaniSanij, M.; Hejazi, M.A. Direct cyber-power interdependencies-based reliability evaluation of smart grids including wind/solar/diesel/distributed generation and plug-in hybrid electrical vehicles. Int. J. Electr. Power Energy Syst. 2017, 93, 1–14. [Google Scholar] [CrossRef]
- Munshi, A.A.; Mohamed AR, I. Big data framework for analytics in smart grids. Electr. Power Syst. Res. 2017, 151, 369–380. [Google Scholar] [CrossRef]
- Woo, P.S.; Kim, B.H. Methodology of Cyber Security Assessment in the Smart Grid. J. Electr. Eng. Technol. 2017, 12, 495–501. [Google Scholar] [CrossRef] [Green Version]
- Lloret-Gallego, P.; Aragüés-Peñalba, M.; Van Schepdael, L.; Bullich-Massagué, E.; Olivella-Rosell, P.; Sumper, A. Methodology for the Evaluation of Resilience of ICT Systems for Smart Distribution Grids. Energies 2017, 10, 1287. [Google Scholar] [CrossRef]
- Vazquez, R.; Amaris, H.; Alonso, M.; Lopez, G.; Moreno, J.I.; Olmeda, D.; Coca, J. Assessment of an Adaptive Load Forecasting Methodology in a Smart Grid Demonstration Project. Energies 2017, 10, 190. [Google Scholar] [CrossRef]
- Rossebø, J.E.; Wolthuis, R.; Fransen, F.; Björkman, G.; Medeiros, N. An Enhanced Risk-Assessment Methodology for Smart Grids. Computer 2017, 50, 62–71. [Google Scholar] [CrossRef]
- Coppo, M.; Pelacchi, P.; Pilo, F.; Pisano, G.; Soma, G.G.; Turri, R. The Italian smart grid pilot projects: Selection and assessment of the test beds for the regulation of smart electricity distribution. Electr. Power Syst. Res. 2015, 120, 136–149. [Google Scholar] [CrossRef]
- Xenias, D.; Axon, C.J.; Whitmarsh, L.; Connor, P.M.; Balta-Ozkan, N.; Spence, A. UK smart grid development: An expert assessment of the benefits pitfalls functions. Renew. Energy 2015, 81, 89–102. [Google Scholar] [CrossRef]
- Liu, X.; Liu, X.; Li, Z. Cyber Risk Assessment of Transmission Lines in Smart Grids. Energies 2015, 8, 13796–13810. [Google Scholar] [CrossRef] [Green Version]
- Personal, E.; Guerrero, J.I.; Garcia, A.; Peña, M.; Leon, C. Key performance indicators: A useful tool to assess Smart Grid goals. Energy 2014, 76, 976–988. [Google Scholar] [CrossRef]
- Dong, H.; Zheng, Y. Measuring Technological Progress of Smart Grid Based on Production Function Approach. Math. Probl. Eng. 2014, 2014, 861820. [Google Scholar] [CrossRef]
- Hu, D.G.; Zheng, J.; Zhang, Y.H.; Xu, H.L.; Zhou, H.M.; Yang, J.K.; Pu, T.J. Study on Technological Evaluation Modeling of Smart Grid. Appl. Mech. Mater. 2014, 494–495, 1747–1752. [Google Scholar] [CrossRef]
- Xu, Q.; Li, Y.; Yang, X. Comprehensive assessment system and method of smart distribution grid. Power Syst. Technol. 2014, 860–863, 1901–1908. [Google Scholar]
- Song, G.; Chen, H.; Guo, B.A. Layered fault tree model for reliability evaluation of smart grids. Energies 2014, 7, 4835–4857. [Google Scholar] [CrossRef]
- Bracco, S.; Delfino, F.; Pampararo, F.; Robba, M.; Rossi, M.A. Mathematical model for the optimal operation of the University of Genoa Smart Polygeneration Microgrid: Evaluation of technical economic environmental performance indicators. Energy 2014, 64, 912–922. [Google Scholar] [CrossRef]
- Wang, Q.R. Performance evaluation of smart grid based on optimal fuzzy algorithm method. Appl. Mech. Mater. 2013, 482, 346–349. [Google Scholar] [CrossRef]
- Niu, D.X.; Liu, J.P.; Liu, T.; Guo, H.C. Comprehensive evaluation of regional grid development level of China under the smart grid construction. Appl. Mech. Mater 2013, 300–301, 640–644. [Google Scholar] [CrossRef]
- Li, L.; Liu, L.; Yang, C.; Li, Z. The comprehensive evaluation of smart distribution grid based on cloud model. Energy Procedia 2012, 17, 96–102. [Google Scholar] [CrossRef]
- Bilgin, B.E.; Gungor, V.C. Performance evaluations of ZigBee in different smart grid environments. Comput Netw. 2012, 56, 2196–2205. [Google Scholar] [CrossRef]
- Xie, C.; Dong, D.; Hua, S.; Xu, X.; Chen, Y. Safety evaluation of smart grid based on AHP-entropy method. Syst. Eng. Procedia 2012, 4, 203–209. [Google Scholar]
- Sun, Q.; Ge, X.; Liu, L.; Xu, X.; Zhang, Y.; Niu, R.; Zeng, Y. Review of smart grid comprehensive assessment systems. Proc. Chin. Soc. Univ. Electr. Power Syst. Its Autom. 2011, 12, 219–229. [Google Scholar] [CrossRef]
- Caciotta, M.; Leccese, F.; Trifiro, A. From power quality to perceived power quality. In Proceedings of the IASTED International Conference on Energy and Power Systems, Rhodes, Greece, 26–28 June 2006; pp. 94–102. [Google Scholar]
- Song, Y.; Yang, X.; Sun, J. Low carbon, efficient, safe and reliable smart grid. Energy China 2009, 31, 23–27. [Google Scholar]
- Li, T.; Xu, B. Self-healing and its benchmarking of smart distribution grid. Power Syst. Prot. Control 2010, 38, 105–108. [Google Scholar]
- Wang, Z.; Su, H. Cost-benefit analysis model for reliability of distribution network automaton system. Power Syst. Prot. Control 2014, 42, 98–103. [Google Scholar]
- Wang, C.; Xu, Y.; Wei, Q.; Zhao, D.; Liu, D. Analysis of intelligent community business model and operation mode. Power Syst. Prot. Control 2015, 43, 147–154. [Google Scholar]
- Han, L.; Zhuang, B.; Wang, Z.; Zhang, L. The research about power grid efficiency indexes. East China Electr. Power 2011, 39, 850–854. [Google Scholar]
- Cheng, Y.; Zhai, N. Evaluation of TOU price oriented to smart grid. Power Syst. Prot. Control 2010, 38, 196–201. [Google Scholar]
- Xin, Y.; Shi, J.; Zhou, J.; Gao, Z.H.; Tao, H.Z.; Shang, X.W.; Zhai, M.Y.; Guo, J.C.; Yang, S.C.; Nan, G.L.; et al. Technology development trends of smart grid dispatching and control system. Autom. Electr. Power Syst. 2015, 39, 2–8. [Google Scholar]
- Feng, Y.; Li, X.; Li, X. Comprehensive evaluation of railway safety based on entropy weight method and grey relational analysis. J. Saf. Environ. 2014, 14, 73–79. [Google Scholar]
- Xinhua Net. Outline of the Twelfth Five-Year Plan for National Economic and Social Development of the People’s Republic of China. Available online: http://www.china.com.cn/policy/txt/2011-03/16/content_22156007.htm (accessed on 5 November 2018). (In Chinese).
Figure 1.
Smart grid investment in top ten countries.

Figure 2.
Investment status of China at each stage.

Figure 3.
The structure of index system.

Figure 4.
Technical path of comprehensive evaluation model.

Figure 5.
Process of weight modification.

Figure 6.
Process of correlation analysis.

Figure 7.
Radar map of construction effect evaluation of Province A.

Figure 8.
Evaluation results of effect level of Province A.

Figure 9.
Line chart of construction base evaluation of Province A.

Figure 10.
Evaluation results of base level of Province A.

Figure 11.
Radar map of construction effect evaluation of Province B.

Figure 12.
Evaluation results of effect level of Province B.

Figure 13.
Line chart of construction base evaluation of Province B.

Figure 14.
Evaluation results of base level of Province B.

Figure 15.
Radar map of construction effect evaluation of Province C.

Figure 16.
Evaluation results of effect level of Province C.

Figure 17.
Line chart of construction base evaluation of Province C.

Figure 18.
Evaluation results of base level of Province C.

Figure 19.
Evaluation results of effect level.

Figure 20.
Evaluation results of base level.

Figure 21.
Comprehensive evaluation results.


Table 1.
Research on smart grid evaluation.
| Author | Evaluation Content | Indices/Dimensions | Method/Model |
|---|---|---|---|
| Yu et al. (2018) [8] | Power quality (PQ) coupling of smart grid | Pattern construction, pattern representation, and time series pattern matching | Time series pattern |
| Park et al. (2018) [9] | Intelligent demand management of the micro grid | High-Power LED, System, Demand Resource Management, Micro-Distributed ESS | A micro-distributed ESS-based smart LED streetlight system |
| Jesus et al. (2018) [10] | Investments of smart grid | Definitions and Assumptions, parameter specification, economics of the smart grid, statement of the optimization problem and solution approach. | Multi-level optimization model |
| Peng et al. (2018) [11] | Reliability and cascading risk of a smart grid system | Theoretical analysis, Numerical simulations | Model based on complex network theory |
| Leszczyna (2018) [12] | Cyber security of smart grid | Reviews, Vulnerability identification, Vulnerability analysis | Systematic analysis |
| Cacciatore et al. (2017) [13] | Cost Analysis of Smart Lighting for Smart Cities | Delay-based (DEL), Encounter-based (ENC), Dimming (DIM) | Heuristics for smart lighting based on the peculiar characteristics of the employed technology |
| Hashemi-Dezaki et al. (2017) [14] | Reliability of smart grids | The uncertainties of power systems, the stochastic output generation of renewable resources, the behaviors of PHEV owners, availability of physical elements, cyber elements | A new reliability evaluation method simultaneously considering the DCPIs, DGs, and PHEVs |
| Munshi et al. (2017) [15] | Smart grids | Data acquisition, data storing and processing, data querying, data analytics components | A comprehensive big data framework |
| Woo et al. (2017) [16] | Cyber Security of smart grid | Information systems, Power Systems | Optimal power flow (OPF), power flow tracing, Analytic hierarchy process |
| Lloret-Gallego et al. (2017) [17] | Resilience of ICT platforms in Smart distribution grids. | Reliability, Adaptation Capacity, Elasticity, Plasticity, Evolvability | EMPOWER Resilience Evaluation Framework |
| Vazquez et al. (2017) [18] | Smart Grid Demonstration Project | Mean Absolute Error (MAE), Mean, Absolute Percentage Error, (MAPE) | Adaptive load forecasting methodology |
| Rossebø et al. (2017) [19] | Risk assessment of Smart | Impact assessment, Threat and vulnerability, Assessment, Risk estimation and prioritization, Risk treatment, Risk acceptance | SEGRID Risk Management Methodology (SRMM) |
| Coppo et al. (2015) [20] | The Italian smart grid pilot projects | System average interruption frequency index, system average interruption duration index, customer average interruption duration index, customer average interruption frequency index, customers experiencing multiple interruptions | Numerical simulations |
| Xenias et al. (2015) [21] | UK smart grid | Standards, Technical issues, Data handling, Market structure, Regulation, Co-ordination, Customer engagement, Investment | Policy Delphi |
| Liu et al. (2015) [22] | Risk of transmission lines in smart grid | Primary Filtering Technique, Secondary Filtering Technique | Bi-level model |
| Personal et al. (2014) [23] | The degree of goal achievement of Smart Grid | Improve of Energy Efficiency, Increase of Renewable Energy Use, Reduction of Emissions, Secondary Objectives | Hierarchical metric/a set of KPIs |
| Dong et al. (2014) [24] | Technological Progress of Smart Grid | Investment, labor inputs, technology | Production function theory, DEA, RRA |
| Hu et al. (2014) [25] | Technology maturity of Smart Grid | Time, production processes and technical features | A model include Time Production Processes, Time Technical Features and Processes Technical Features |
| Song et al. (2014) [26] | Smart Distribution Grid | Strong degree of the network, facilities intelligence, supply reliability, power quality, operational efficiency, grid interactivity, development coordination | Hierarchical optimization model and DEMATEL-ANP-counter entropy method |
| Song et al. (2014) [27] | Reliability of Smart Grids | Information subsystem failure, Communication subsystem failure, Intelligent substation failure, Protection subsystem failure, Power supply failure, Failures of other devices depending on the architecture | Layered Fault Tree Model |
| Bracco et al. (2014) [28] | SG (Smart Grid)/Smart Microgrid | Technical, economic and environmental performance indicators | A mathematical model that the minimize the SPM daily operational costs |
| Wang et al. (2013) [29] | Operation performance of smart grid | Economic operation, supply quality and services (distribution line length, substation capacity, net assets, loss rate, electricity quantity, supply area). | Optimal fuzzy, algorithm and data envelopment analysis |
| Niu et al. (2013) [30] | Regional Grid | Safety, Economy, Quality, Efficiency | Hierarchical optimized combination evaluation |
| Li et al. (2012) [31] | Smart Distribution Grid | The model of two-level index synthesized cloud and remarks cloud | Cloud model |
| Bilgin et al. (2012) [32] | Performance of ZigBee in smart grid environments | Network throughput, End-to-end delay, Delivery ratio, Energy consumption | Wireless sensor network-based smart grid applications |
| Xie et al. (2012) [33] | Safety of Smart Grid | Structural safety of transmission network, structural safety of distribution network, high-efficient system and equipment support, operational safety and stability, adequacy and resilience | AHP-Entropy combined, Method |
| Sun et al. (2011) [34] | Smart grid | IBM smart grid maturity model, The DOE smart grid development evaluation system, the EPRI smart grid construction assessment indicators, The EU smart grid benefits assessment system | Comparative analysis |
Table 2.
Index system of safety and reliability.
| Second-Level Indicators | Third-Level Indicators | Code |
|---|---|---|
| The safety and reliability of power grid | The number of power transmission accident | E1 |
| The number of power transformation accident | E2 | |
| The self-healing speed of the distribution network [37] | E3 | |
| The self-healing rate of the distribution network | E4 | |
| The reliability of power supply(urban user) [38] | E5 | |
| The reliability of power supply (rural user) | E6 | |
| The safety of communication information | The index of the safe operation of information and communication system | E7 |
| The number of information events | E8 |
Table 3.
Index system of economics and efficiency.
| Second-Level Indicators | Third-Level Indicators | Code |
|---|---|---|
| Economic benefits | The revenue of value-added services [39] | E9 |
| The recovery of electricity | E10 | |
| The fair coefficient of electricity consumption | E11 | |
| Grid efficiency [40] | The annual maximum load utilization | E12 |
| The maximum load rate of power lines | E13 | |
| The annual average equivalent load rate of line operation | E14 | |
| The annual maximum load rate of main transformer | E15 | |
| The annual average equivalent load rate of main transformer operation | E16 | |
| Staff efficiency | The efficiency of transmission staff | E17 |
| The efficiency of transformation staff | E18 | |
| The efficiency of urban distribution network staff | E19 | |
| Overall labor productivity | E20 |
Table 4.
Index system of cleanliness and green.
| Second-Level Indicators | Third-Level Indicators | Code |
|---|---|---|
| Green power generation | The proportion of renewable energy power generation | E21 |
| The realization ratio of annual utilization hours of renewable energy | E22 | |
| Abandoned wind ratio | E23 | |
| Distributed power energy permeability | E24 | |
| Green power grid | The land disturbance area of unit quantity of electricity | E25 |
| The floor area saved by smart substation | E26 | |
| Comprehensive line loss rate | E27 | |
| Green electricity | The electricity saved by demand-side management | E28 |
| The proportion of electricity in the terminal energy consumption | E29 | |
| Power replacement ratio | E30 |
Table 5.
Index system of openness and interaction.
| Second-Level Indicators | Third-Level Indicators | Code |
|---|---|---|
| The transparency of power grid | The depth of information disclosure | E31 |
| The speed of information update | E32 | |
| The convenience of getting information | E33 | |
| The openness of power grid | the growth rate of electric quantity in electric power market transaction | E34 |
| The investment in the open area of the grid business | E35 | |
| The scale and proportion of the direct power-purchase for the large user | E36 | |
| The completeness that all kinds of users access the standard system | E37 | |
| Quality service | The evaluation index of quality service | E38 |
| Interactive effect | The year-on-year growth rate of the grid’s annual maximum load utilization | E39 |
| The proportion of electricity of implementing peak and valley time price [41] | E40 | |
| The power saved by demand-side management | E41 | |
| The capability of load monitoring and control | E42 | |
| The utilization rate of electric vehicles | E43 |
Table 6.
Index system of automation.
| Second-Level Indicators | Third-Level Indicators | Code |
|---|---|---|
| Transmission automation | The total capacity of flexible AC transmission device | B1 |
| The proportion of energy-saving wire | B2 | |
| The application of disaster prevention and reduction technology | B3 | |
| The proportion of the lines applying condition monitoring technology | B4 | |
| The proportion of the lines applying intelligent inspection technology | B5 | |
| Substation automation | The proportion of smart substation | B6 |
| The coverage of the patrol robot of substation | B7 | |
| The coverage of condition monitoring of transformer equipment | B8 | |
| Distribution automation | The coverage of distribution automation | B9 |
| The coverage of feeder automation | B10 | |
| Coverage of the command platform of power distribution repairs in a rush | B11 | |
| Coverage of distribution power automation terminal | B12 | |
| Dispatching automation [42] | The coverage of provincial/prefecture (county) level smart grid dispatching control system | B13 |
| The coverage of provincial/prefecture (county) level standby scheduling | B14 | |
| The coverage of dual access of dispatch data net | B15 | |
| The access rate of station terminal dispatch data network | B16 | |
| the coverage of secondary security system | B17 |
Table 7.
Index system of interaction.
| Second-Level Indicators | Third-Level Indicators | Code |
|---|---|---|
| Interaction of electricity use | The coverage of electricity information collection system | B18 |
| The coverage of intelligent ammeter | B19 | |
| The coverage of power service management platform | B20 | |
| The method of demand-side response to electricity prices | B21 | |
| The area density of the interactive business hall | B22 | |
| Electric vehicles | The area density of city charge (change) power station | B23 |
| The linear density of highway filling (change) power station | B24 | |
| The matching degree of electric vehicle and charger | B25 | |
| Large-scale access to new energy sources | The coverage of new energy power forecasting system | B26 |
| The completion rate of wind and PV power grid detection | B27 | |
| The proportion of new energy installed capacity | B28 | |
| Distributed power supply | The proportion of distributed power installed capacity | B29 |
| The realization rate of distributed generation forecast | B30 |
Table 8.
Index system of informatization.
| Second-Level Indicators | Third-Level Indicators | Code |
|---|---|---|
| Construction of communication network | The optical fiber coverage of substations(35 kV and above) | B31 |
| The cable coverage of backbone communication network | B32 | |
| The bandwidth capacity of communication transmission network platform | B33 | |
| The fiber coverage of 10 kV communication access network | B34 | |
| The rate of PFTTH | B35 | |
| Information construction | The coverage of SG-ERP system | B36 |
| The automatic monitoring rate of information communication equipment | B37 | |
| The availability rate of information network | B38 | |
| The availability rate of business systems | B39 |
Table 9.
The judgment basis of scale value and related description.
| Scale Value | Description |
|---|---|
| 1 | Indicates that elements i and j are of equal importance |
| 3 | Representing the elements i and j, the former is slightly more important than the latter |
| 5 | Representing the elements i and j, the former is significantly more important than the latter |
| 7 | Representing the elements i and j, the former is awfully more important than the latter |
| 9 | Representing the elements i and j, the former is perfectly more important than the latter |
| 2, 4, 6, 8 | The importance is between the above two |
| Reciprocal | Representing the importance of elements i and j in contrast to the above |
Table 10.
RI value that correspond to n.
| N | 1 | 2 | 3 | 4 | 5 | 6 | 7 | 8 | 9 |
| RI | 0 | 0 | 0.58 | 0.9 | 1.12 | 1.24 | 1.32 | 1.41 | 1.45 |
Table 11.
The measurement indicators of smart grid development demand.
| Dimensions of Demand | Quantitative Measurement Indicators | Code of Demand Pressure Indicators |
|---|---|---|
| Safety and reliability (D1) | The proportion of a type of load | DC1 |
| The proportion of secondary industry production GDP | DC2 | |
| Load density | DC3 | |
| Capacity-load ratio | DC4 | |
| Urbanization rate | DC5 | |
| Economy and efficiency (D2) | Return on assets | DC6 |
| Overall labor productivity | DC7 | |
| Electricity sale of unit assets | DC8 | |
| Energy intensity | DC9 | |
| Ratio of power generation and electricity | DC10 | |
| Clean and green (D3) | The proportion of clean energy production | DC11 |
| Air-quality index | DC12 | |
| Carbon dioxide emissions per unit area | DC13 | |
| Carbon intensity | DC14 | |
| The proportion of electrical energy in terminal energy consumption | DC15 | |
| Openness and interaction (D4) | Reasonable degree of utilization hours of power generation equipment | DC16 |
| Ratio of urban-rural power supply reliability | DC17 | |
| Quality service evaluation index | DC18 | |
| Per capita electricity consumption | DC19 | |
| The proportion of tertiary industry production GDP | DC20 |
Table 12.
Relationship between effect layer and base layer indicators.
| Second-Level Indicators of Effect Level | Third-Level Indicators of Base Level Which Associated with It |
|---|---|
| The safety and reliability of power grid | B1, B3~B14, B26, B27, B30 |
| The safety of communication information | B15~B17, B31~B34, B37~B39 |
| Economic benefits | B18~B21, B23~B25, B35 |
| Grid efficiency | B1, B13, B21 |
| Staff efficiency | B5~B9, B11~B13, B36 |
| Green power generation | B13, B26~B28 |
| Green power grid | B2, B6 |
| Green electricity | B20, B21, B23~B25 |
| Transparent grid | B21, B22 |
| Open grid | B23~B25, B29 |
| Quality service | B11, B20, B22 |
| Interactive effect | B18, B21~B25 |
Table 13.
The judgment matrix.
| Safety and Reliability | Economy and Efficiency | Clean and Green | Openness and Interaction | Weight | |
|---|---|---|---|---|---|
| Safety and reliability | 1 | 2 | 3 | 4 | 0.4285 |
| Economy and efficiency | 1/2 | 1 | 5 | 6 | 0.3810 |
| Clean and green | 1/3 | 1/5 | 1 | 2 | 0.1170 |
| Openness and interaction | ¼ | 1/6 | ½ | 1 | 0.0735 |
Table 14.
The weight of the first-level indices.
| Index | Weight |
|---|---|
| Safety and reliability | 0.3707 |
| Economy and efficiency | 0.2444 |
| Clean and green | 0.2517 |
| Openness and interaction | 0.1332 |
| Automation | 0.5039 |
| Interaction | 0.2811 |
| Informatization | 0.2150 |
Table 15.
The relevance of the “green power generation” indicators.
| Relevance of the “Green Power Generation” Indicators | ||||
|---|---|---|---|---|
| Associated indicators | B13 | B26 | B27 | B28 |
| Degree of association | 0.4555 | 0.1289 | 0.8795 | 0.4537 |
Table 16.
The weight of the corresponding base layer index.
| Index of Base Layer | Subjective Weight | Objective Weight | Comprehensive Weight |
|---|---|---|---|
| B13 | 0.3175 | 0.0298 | 0.1737 |
| B26 | 0.2030 | 0.0322 | 0.1176 |
| B27 | 0.1322 | 0.0298 | 0.0810 |
| B28 | 0.1184 | 0.0236 | 0.0710 |
Table 17.
The weight of the first-level indicators.
| Layer | Indicators | Weight |
|---|---|---|
| Effect layer | Safety and reliability | 0.3961 |
| Economy and efficiency | 0.2352 | |
| Clean and green | 0.2367 | |
| Openness and interaction | 0.1319 | |
| Base layer | Automation | 0.5039 |
| Interaction | 0.2811 | |
| Informatization | 0.2150 |
Table 18.
The relevance of the “green power generation” indicators.
| Relevance of the “Green Power Generation” Indicators | ||||
|---|---|---|---|---|
| Associated indicators | B13 | B26 | B27 | B28 |
| Degree of association | 0.7212 | 0.3892 | 0.4712 | 0.4807 |
Table 19.
The weight of the corresponding base layer indicators.
| Indicators of Base Layer | Subjective Weight | Objective Weight | Comprehensive Weight |
|---|---|---|---|
| B13 | 0.0464 | 0.0298 | 0.0381 |
| B26 | 0.0179 | 0.0322 | 0.0250 |
| B27 | 0.0107 | 0.0298 | 0.0202 |
| B28 | 0.0135 | 0.0236 | 0.0186 |
Table 20.
The weights of the first-level indicators.
| Layer | Indicators | Weight |
|---|---|---|
| Effect layer | Safety and reliability | 0.2580 |
| Economy and efficiency | 0.2699 | |
| Clean and green | 0.2845 | |
| Openness and interaction | 0.1876 | |
| Base layer | Automation | 0.5039 |
| Interaction | 0.2811 | |
| Informatization | 0.2150 |
Table 21.
The relevance of the “green power generation” indicators.
| Relevance of the “Green Power Generation” Indicators | ||||
|---|---|---|---|---|
| Associated indicators | B13 | B26 | B27 | B28 |
| Degree of association | 0.3115 | 0.1919 | 0.3038 | 0.5434 |
Table 22.
The weights of the corresponding base layer indicators.
| Indicators of Base Layer | Subjective Weight | Objective Weight | Comprehensive Weight |
|---|---|---|---|
| B13 | 0.0152 | 0.0298 | 0.0225 |
| B26 | 0.0030 | 0.0322 | 0.0176 |
| B27 | 0.0742 | 0.0298 | 0.0520 |
| B28 | 0.0762 | 0.0236 | 0.0499 |
© 2018 by the authors. Licensee MDPI, Basel, Switzerland. This article is an open access article distributed under the terms and conditions of the Creative Commons Attribution (CC BY) license (http://creativecommons.org/licenses/by/4.0/).
Share and Cite
MDPI and ACS Style
Li, J.; Li, T.; Han, L. Research on the Evaluation Model of a Smart Grid Development Level Based on Differentiation of Development Demand. Sustainability 2018, 10, 4047. https://doi.org/10.3390/su10114047
AMA Style
Li J, Li T, Han L. Research on the Evaluation Model of a Smart Grid Development Level Based on Differentiation of Development Demand. Sustainability. 2018; 10(11):4047. https://doi.org/10.3390/su10114047
Chicago/Turabian StyleLi, Jinchao, Tianzhi Li, and Liu Han. 2018. "Research on the Evaluation Model of a Smart Grid Development Level Based on Differentiation of Development Demand" Sustainability 10, no. 11: 4047. https://doi.org/10.3390/su10114047
Note that from the first issue of 2016, this journal uses article numbers instead of page numbers. See further details here.