Spatio-Temporal Changes of Oases in the Hexi Corridor over the Past 30 Years


1
School of Earth and Environment Science, Lanzhou University, Lanzhou 730000, China
2
The Key Laboratory of Western China’s Environmental Systems, Ministry of Education, Lanzhou 730000, China
*
Author to whom correspondence should be addressed.
Sustainability 2018, 10(12), 4489; https://doi.org/10.3390/su10124489
Submission received: 29 August 2018
/
Revised: 20 November 2018
/
Accepted: 25 November 2018
/
Published: 29 November 2018
(This article belongs to the Special Issue Human Nature Interactions)
Abstract
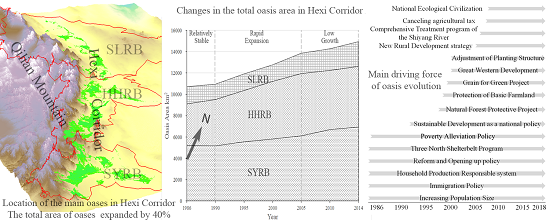
:In recent decades, the oases in the Hexi Corridor have gone through a tremendous transformation, which has caused a series of social and environmental problems. We aim to explore quantitatively the characteristics of the oasis expansion and their dynamic mechanism(s) in the Hexi Corridor, and their implications and impact on current and future policies. The spatial distribution pattern and dynamic changes experienced by the oases are examined using Landsat imagery. Their spatio-temporal changes are analyzed using the grid-transformed model and the dynamic-degree model. The model drivers are analyzed based on data from statistics yearbooks and field surveys. The total area of oases in the Hexi Corridor has expanded tremendously during the last 30 years from 10,709 km2 to 14,950 km2, almost 40% of the original value. Oasis evolution patterns of ‘unchanged’, ‘expanding’, ‘shrinking’, and ‘oscillating’ are observed at different periods in the three basins. In terms of area, almost half of the oases experienced some change, where most of the changes took place in the ecotone between oases and deserts, and the interior of oases due to the reclamation of abandoned land. Oasis expansion is mainly determined by the human instincts for survival and well-being, which are generally governed by population growth, agricultural policies and economic development. These changes reflect the need to find a balance in the relationship between ecological protection and increasing the well-being of local residents, because unreasonable or excessive development and utilization will cause damage to the local ecological environment.

1. Introduction
Human-induced land use and land cover (LULC) change is a sentinel of research on socioeconomic development and global environment change [1]. LULC change influences natural landscapes via a combination of physical, ecological, and sociometric factors [2,3,4,5,6], and this issue has received worldwide attention since the mid-1990s [1]. Arid and semi-arid regions cover more than 30% of the land on the Earth’s surface [7], and 22% of the land in China [8]. The Oxford English Dictionary defines “oasis” as “any fertile spot in a desert, where water can be found”. Oases are unique landscapes in the context of the desert environment that occur in dry climates and supported natural or artificial rivers. Oases, which have greater productivity than the surrounding deserts, are a land type that is adequate for human settlements because of the availability of fertile soil, fresh groundwater and surface runoff from nearby mountains [9]. The oases in China are concentrated in the arid regions west of the Helan Mountain–Wushaoling line, and they are connected with other oases in central Asia. Although the oases take up approximately 5% of the total arid and semi-arid area, more than 90% of the population and 95% of the social wealth are concentrated within these oases [10,11]. These oases not only provide precious fertile soil and living space for human beings in the barren desert, but they also regulate the regional climate via the vegetation and water resources within them [12,13,14]. Therefore, oasis change has been a key issue with regards to sustainable development in recent decades.
The Hexi Corridor, which is an important sector of the Silk Road Economic Belt and New Eurasian Continental Bridge, is composed of three major inner river basins named Shiyang River Basin (SYRB), Heihe River Basin (HHRB), and Shule River Basin (SLRB) [15]. The oases in the Hexi Corridor have experienced dramatic socioeconomic development in terms of more commodity grain in the Commodity Economy Period (1980–1992), more benefits in the market-oriented Economy Period (2002–2012), and more green ecology in the Chinese New Era (2012–present) [16]. However, disorganized, ineffective exploitation in the past has caused serious ecological problems including the desertification of land, salinization of soil, a decline in groundwater, and the degeneration of natural vegetation [15,17,18,19]. Water scarcity is a major and growing problem, and water consumption is unbalanced in different parts of the river basin. Water consumption increased in the middle reaches, which caused the water table to drop, and rivers and terminal lakes gradually dried up [9]. Therefore, examining the changes in oases, and discerning the driving forces behind them can provide basic data for regulating oasis exploitation and data for policy makers to use towards optimizing oasis development. The normalized difference vegetation index (NDVI) and normalized difference water index (NDWI) derived from remote sensing images were used to outline the vegetation and waterbodies, since they gave an efficient and accurate performance in extracting vegetation [20] and water body areas [21,22].
In recent years, some arid and semi-arid countries and regions have been the subjects of research of the scale, speed, and pattern of typical oasis expansion, and the relationships between oasification and climate change, demographic change and economic development. From 1986 to 2014, the positive changes of oases in Dunhuang in SLRB dominated the overall change trend, where the observed changes were mainly distributed at the periphery of artificial oases located outside the reserve [19]. The total area of oases in HHRB dramatically expanded by 60% from 1963 to 2013 [9]. In the oases in SYRB, farmland occupied the largest percentage of land area, which increased from 36.4% in 1987 to 43% in 2001. Moreover, the net utilization of surface water decreased by 50%, and the exploitation of groundwater increased remarkably. Finally, the temporal and spatial changes of cropland in the arid and semi-arid regions of north-west China from 1980 to 2010 have been analyzed, and the major drivers were discussed [18]. However, these previous studies focused on the evolution of specific oases in these three major river basins, and they did not consider the whole Hexi Corridor [9,23,24]. Therefore, a contrastive analysis on the evolution of oases in the three major river basins in the Hexi Corridor with smaller time intervals and more accurate extraction is necessary.
In this work, we have three specific research objectives: (1) to reconstruct the evolution of the oases in the Hexi Corridor from 1986 to 2014 using seven periods of remote-sensing images, with five-year intervals; (2) to contrastively analyze the changes of oases in the three different river basins; and (3) to evaluate the driving forces of oasis change over the past 30 years.
2. Study Area, Data, and Method
2.1. Study Area
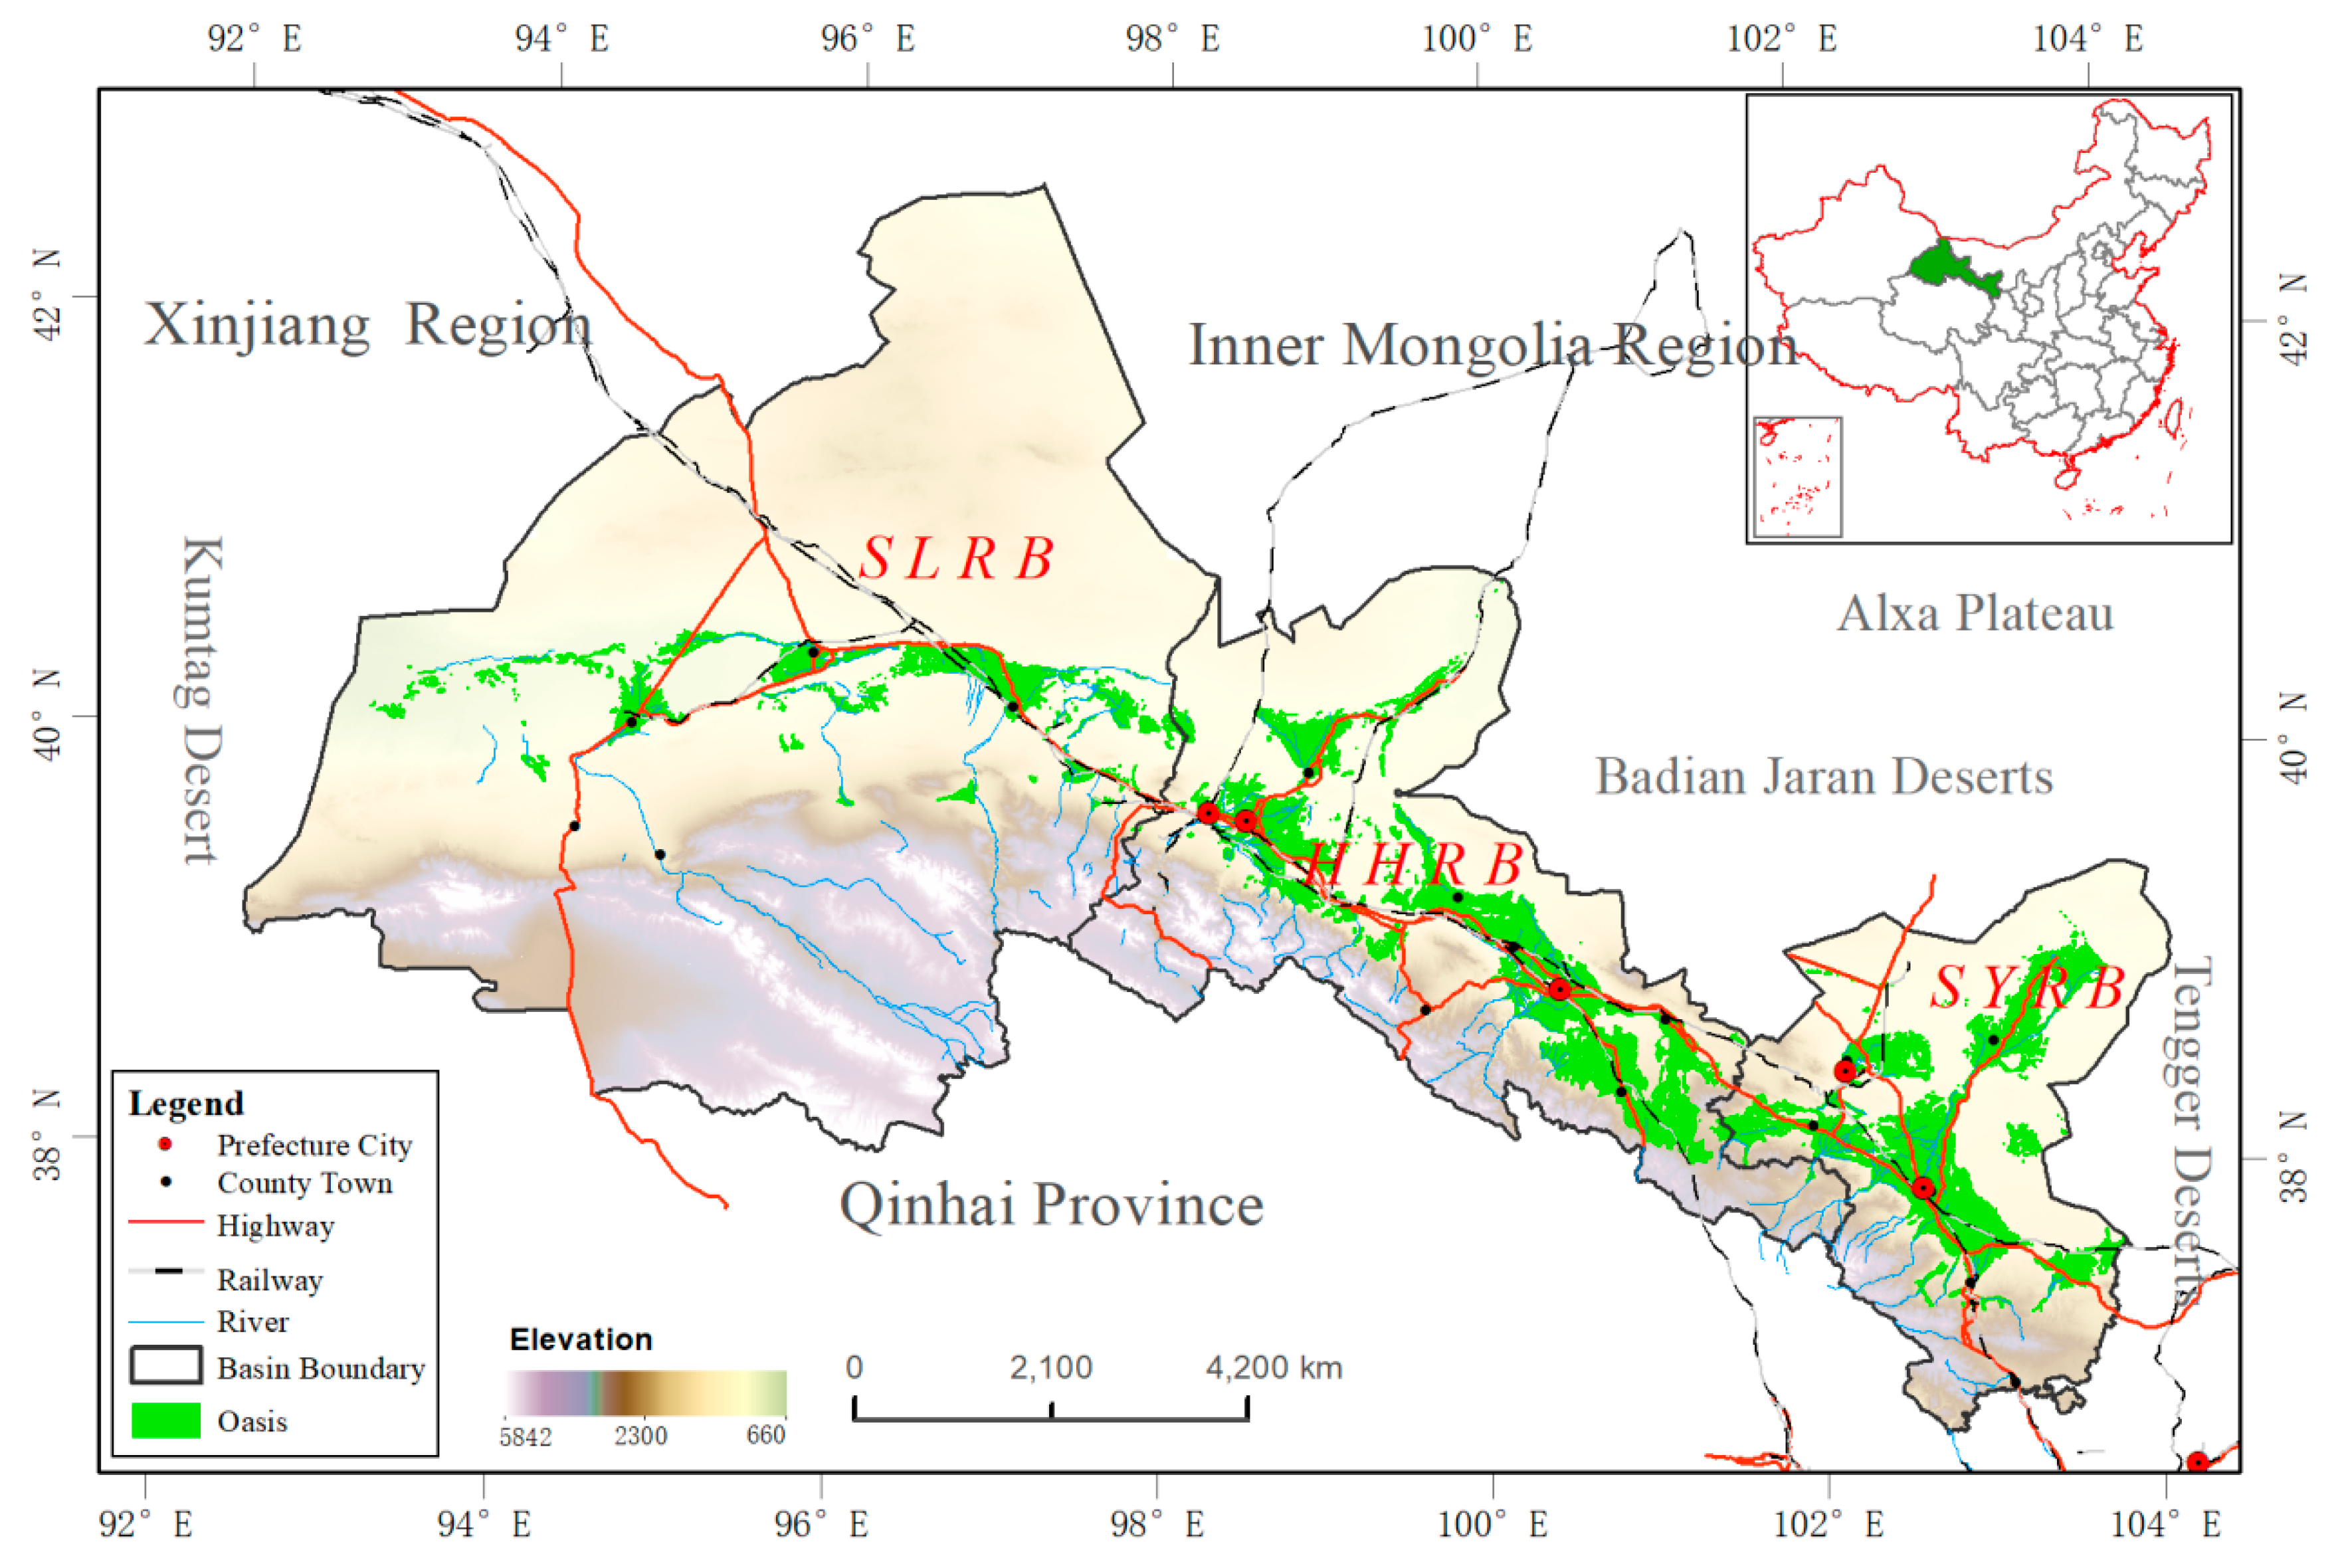
The Hexi Corridor, located in north-western China, is surrounded by the Qilian Mountains to the south, by the Mazong, Heli and Longshou Mountains and the Badain Jaran and Tengger Deserts to the north, by the Wushaoling Mountains to the east, and by the Kumtagh Desert to the west [25]. It is a long and narrow passage, covering a width of 40–100 km and stretching for 1120 km from the east to the west, with an area of 27.6 × 10⁴ km2. The Hexi Corridor had a population of 4.92 million spread over 19 counties in 2014.
The Hexi Corridor is in a convergence zone of monsoon and continental climates, which is characterized by its distinct cold and arid landscapes, the latter of which contain glaciers, alpine meadows, forests, crops, and deserts. The altitude of the Hexi Corridor decreases from the southern mountains over 4000 m towards the northern convergence zone, from 2500 to 1300 m. Along the altitude gradient, the precipitation decreases, and the air temperature increases from the southern alp to the northern plain. The region has an arid continental climate with an annual rainfall reaching no more than 200 mm that mainly occurs in summer; whereas the annual potential evaporation is between 1500 and 3200 mm [15].
There are three independent landlocked river basins in the Hexi Corridor: SYRB in the east, HHRB in the middle, and SLRB in the west, as illustrated in Figure 1. Strips of oases in these three river basins play a vital ecological role in north-west China. In recent decades, tremendous changes in the oases have triggered a great deal of ecological and environmental problems.
2.2. Data Source
To map and quantify the oasis changes in Hexi Corridor, remote-sensing images were used to extract oasis boundaries, including Landsat TM\ETM\OLI L1T images obtained in 1986, 1990, 1995, 2000, 2005, 2010, and 2014. The images used in this study and their thresholds for vegetation extraction are listed in Table 1. These data were selected in vegetation flourishing season as it is the best time to represent oases [26]. Eleven Landsat images were retrieved which covered the whole study area. Based on a topographic map (1:100,000) of the study area, we used a cubic polynomial model for geometric correction, and errors were kept within one pixel. The precipitation and temperature data from 1986 to 2014 in Hexi Corridor and its surrounding areas were collected from the China Meteorological Data Service Center (CMDC, http://data.cma.cn/). The socio-economic data including population, income, grain yield, and labor were collected from local statistic departments in Gansu Province. In addition, we interviewed about 200 local residents about the LULC changes in their area, and captured the land transformation information provided by the local government to understand the factors responsible for triggering LULC changes.
2.3. Oasis Extraction Method and Accuracy Assessment
The land use and land cover in the Hexi Corridor was divided into two significantly different categories: oases and deserts. Oases include the LULC relevant vegetation (the vegetation coverage bigger than 15%), water areas, residential areas and industrial and mining land, while deserts constitute the remaining LULC types [27,28]. Vegetation can be easily extracted on account of a discrepant NDVI from the environment background; therefore, they were exacted first. The threshold was determined using maximum between-cluster variance algorithm (known as OTSU threshold method) [29,30], which is shown in Table 1. then vegetation information were extracted from the background of the Landsat images based on the maximum variance between the objective and the background [31]. In the same way, water areas were depicted using the NDWI derived from the green band and near infrared band of TM\ETM\OLI images. Owing to the spectral similarity between settlements and desert in the remote-sensing images, residential areas and industrial areas and mining land, especially those located in junction zones, are not easily detected. These features were, therefore, manually added. Geographically adjacent patches were merged, and scattered patches with an area of less than 4 pixels were deleted because they were too small to constitute an oasis unit. To revise and improve the distribution of historical oases in the maps, missing and false areas were processed via a visual interpretation after initial classification. Data gathered from interviews with local residents and the images on Google Earth with high spatial resolution were introduced for validation [32,33]. There were totally about 320 samples used for accuracy assessment for each period, with resampling procedures of stratification by class, and about 80 samples for each class (vegetation, water bodies, residential areas and industrial areas and mining land (RAIM, for short) processed as one class in accuracy assessment, and desert).
2.4. Oasis Evolution Analysis Methods
2.4.1. Oasis Changes over Time
Changes in oases over time are characterized by the rate of change between the start and end times [34,35]. LULC change models, such as the single dynamic degree (SDD) model and the bidirectional dynamic degree (BDD) model, are widely used to analyze changes in oases [2,9,34]. The SDD model describes the rate of net change, but it neglects the increasing and decreasing components during the evolution. Whereas, the BDD model incorporates both the increasing and decreasing rates of change into a composite metric. The SDD model is used to depict the annual net rate of change of the oasis for a certain period, which is calculated as:
OA is the area of an oasis, and T1 and T2 are the beginning and the end years in the considered period, respectively.
The BDD metric considers the both the increased and decreased parts of an oasis, which is calculated as:
UOA is the unchanged oasis area, obtained from the overlapped part of oases at different times. DR is the annual rate of decrease, IR is the annual rate of increase, and BDD is the annual bidirectional rate of change. The SDD and BDD values of oasis change in the Hexi Corridor, relative to changes in the desert, were calculated using Equations (1) and (2), respectively.
2.4.2. Oasis Changes in Space
The SDD and BDD models are temporal models, and they cannot account for any spatial variations in the considered oasis. The over-layer analysis method, which can detect changing patterns by superimposing multiple phases of data in a specific geographical region, can be applied to detect any spatial changes between adjacent years. Unchanged oasis areas can be detected by overlapping the oasis distribution ranges of the final year and the beginning year in a single period. Meanwhile, the increased and decreased oasis areas can be ascertained by excluding the unchanged part from the data of the final year and beginning year, respectively. The grid-analysis method was adopted to quantify the spatial changes, where the values of the grid cells represented the rate of change. The grid size was 90 × 90 m2, and the grid-analysis model is expressed as:
CR is the spatial ratio of change, OR is the oasis ratio in a specific grid, OA is the oasis area in a grid, and AGRID is the area of the grid. If CR approaches 1 or −1, the oasis in the grid is characterized by expansion or shrinkage, respectively, whereas if CR is close to zero, the oasis is stable.
2.4.3. Oasis Evolution Intensity and Pattern Analysis
The grid-analysis model and the CR index were used to depict spatial change of the oasis between adjacent year. Moreover, the sum of the absolute CR (SACR) and the sum of original (SOCR) (CR is calculated from Section 2.4.2) were used to depict the oasis evolution of the oasis. The evolution intensity reflects the degree of oasis variation, and the pattern shows the way in which oasis develop and transform over the whole period. To revel the oasis evolution intensity and pattern in all periods over the total years, multiple phases of data of the same geographical region were superimposed. The SACR and SOCR were used to represent the oasis evolution pattern as:
N is the number of periods, and CRi is the change of rate of the oasis in the ith period. SACR is the sum of the absolute rate of change rate over the entire study period, which ranges from 0 to N − 1, and a high value of SACR indicates drastic changes in a back and forth manner. According to the SACR value, the evolution intensity was divided into stable grids with SACR equal to 0 and changed grids with SARC bigger than 0. The changed grids were then divided into three types: relatively stable, relatively unstable, and unstable (see Table 2).
According to the above results and the SOCR, the evolution patterns were divided into four categories: (1) “unchanged”, where no changes in the boundaries of the regions occurred during the research time; (2) “expanding”, where an oasis expanded without subsequent shrinkage; (2) “shrinking”, where an oasis reduced in size without subsequent expansion; and (4) “oscillating”, where an oasis underwent intermittent transformation between expansion and shrinkage. The specific classification criteria are shown in Table 2.
3. Results and Discussion
3.1. Accuracy Assessment of Oases Extraction
Our estimated accuracies, represented by producer accuracy, user accuracy, overall accuracy, and Kappa coefficients were shown in Table 3. All of the overall accuracy values (kappa values) are above 0.84 (0.79), meanwhile both the user’s accuracies and the producer’s accuracies of vegetation is greater than 0.8. The accuracies of vegetation extraction are high, mainly due to the OTSU threshold method has a stable performance with the images obtained over the whole flouring periods [29,30]. Therefore, the classification results are reliable and suitable for oasis change analysis.
3.2. Change in Oasis Areas
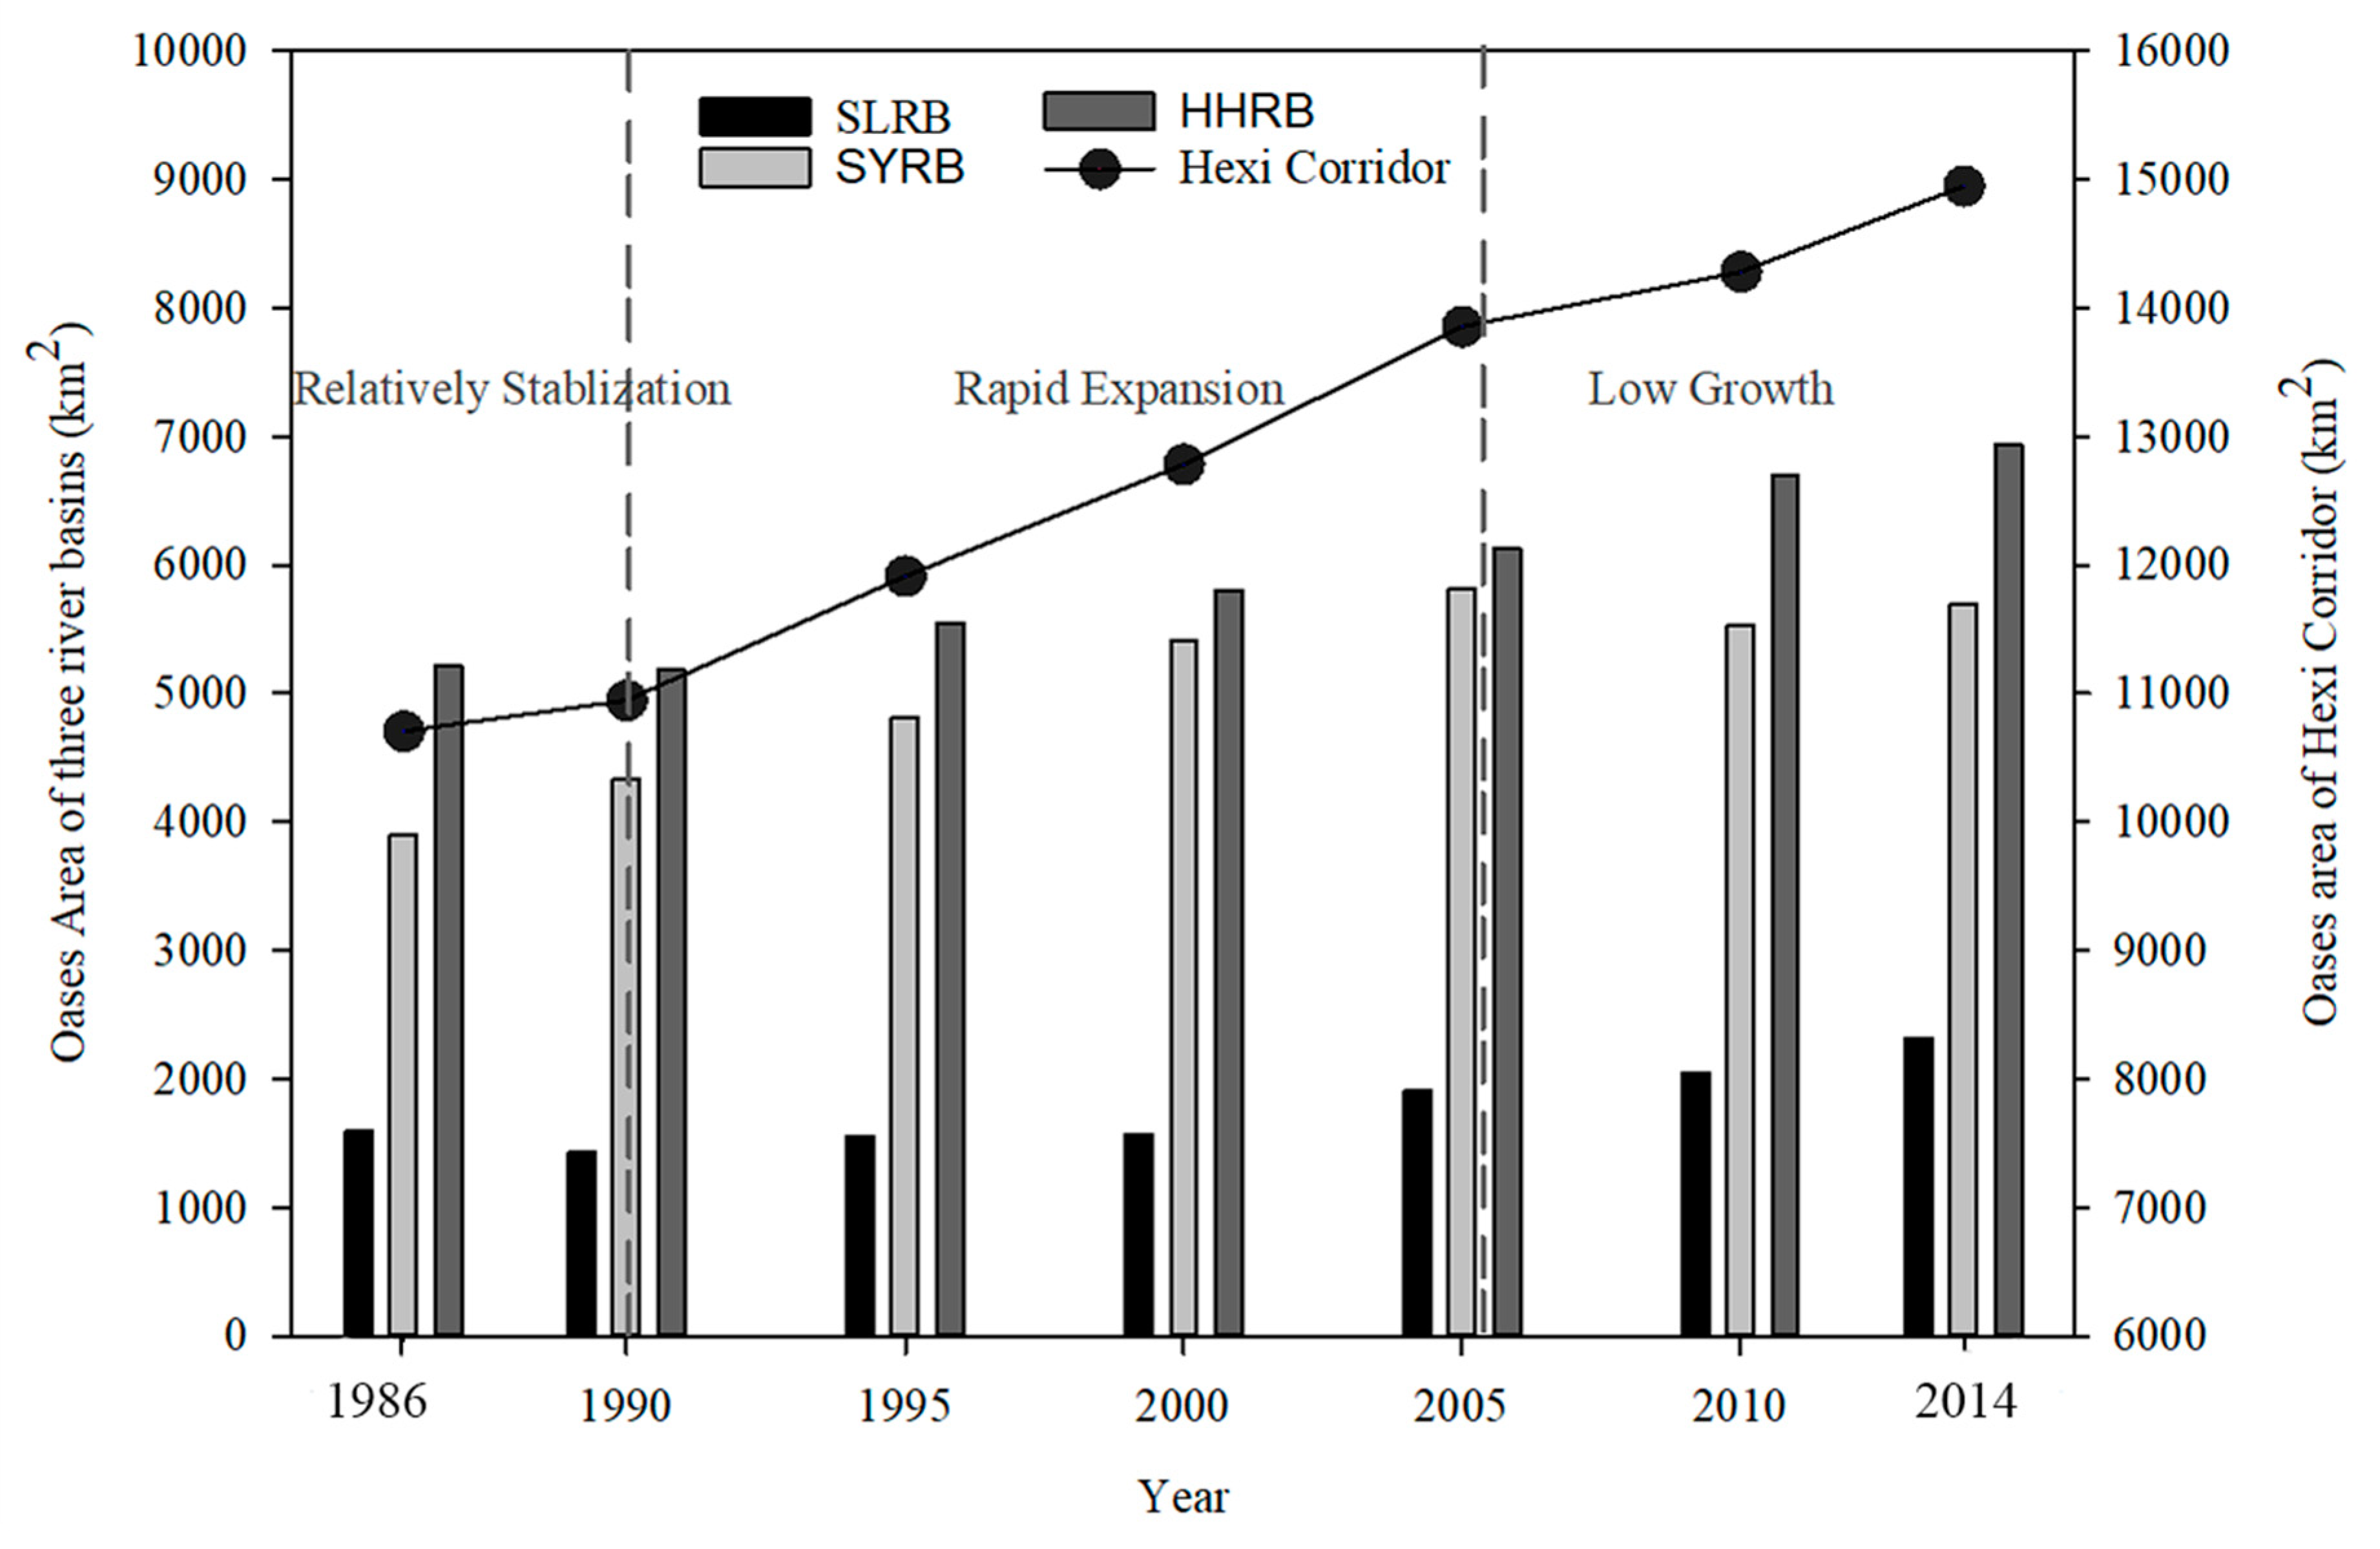
The total exacted oasis area in Hexi Corridor, shown in Figure 2, demonstrates overall growth during the past 30 years, which increased from 10,709.3 km2 in 1986 to 14,950.1 km2 in 2014. This represents an increase of a factor of 1.4 from the start to the end years, with an average annual increase of 140 km2. Although the area changes in the Hexi Corridor fluctuated over time, the increased rate varied in different periods. This changing trend has three phases (Figure 2): (1) A relatively stable stage, with a growth rate of 59.9 km2 (0.56%) each year during the period 1986–1990; (2) a rapid expansion stage, with a growth rate of 193.8 km2 (1.64%) each year during the period 1990–2005; and (3) a low growth stage, with a growth rate of 109.6 km2 (0.79%) each year during the period 2005–2014.
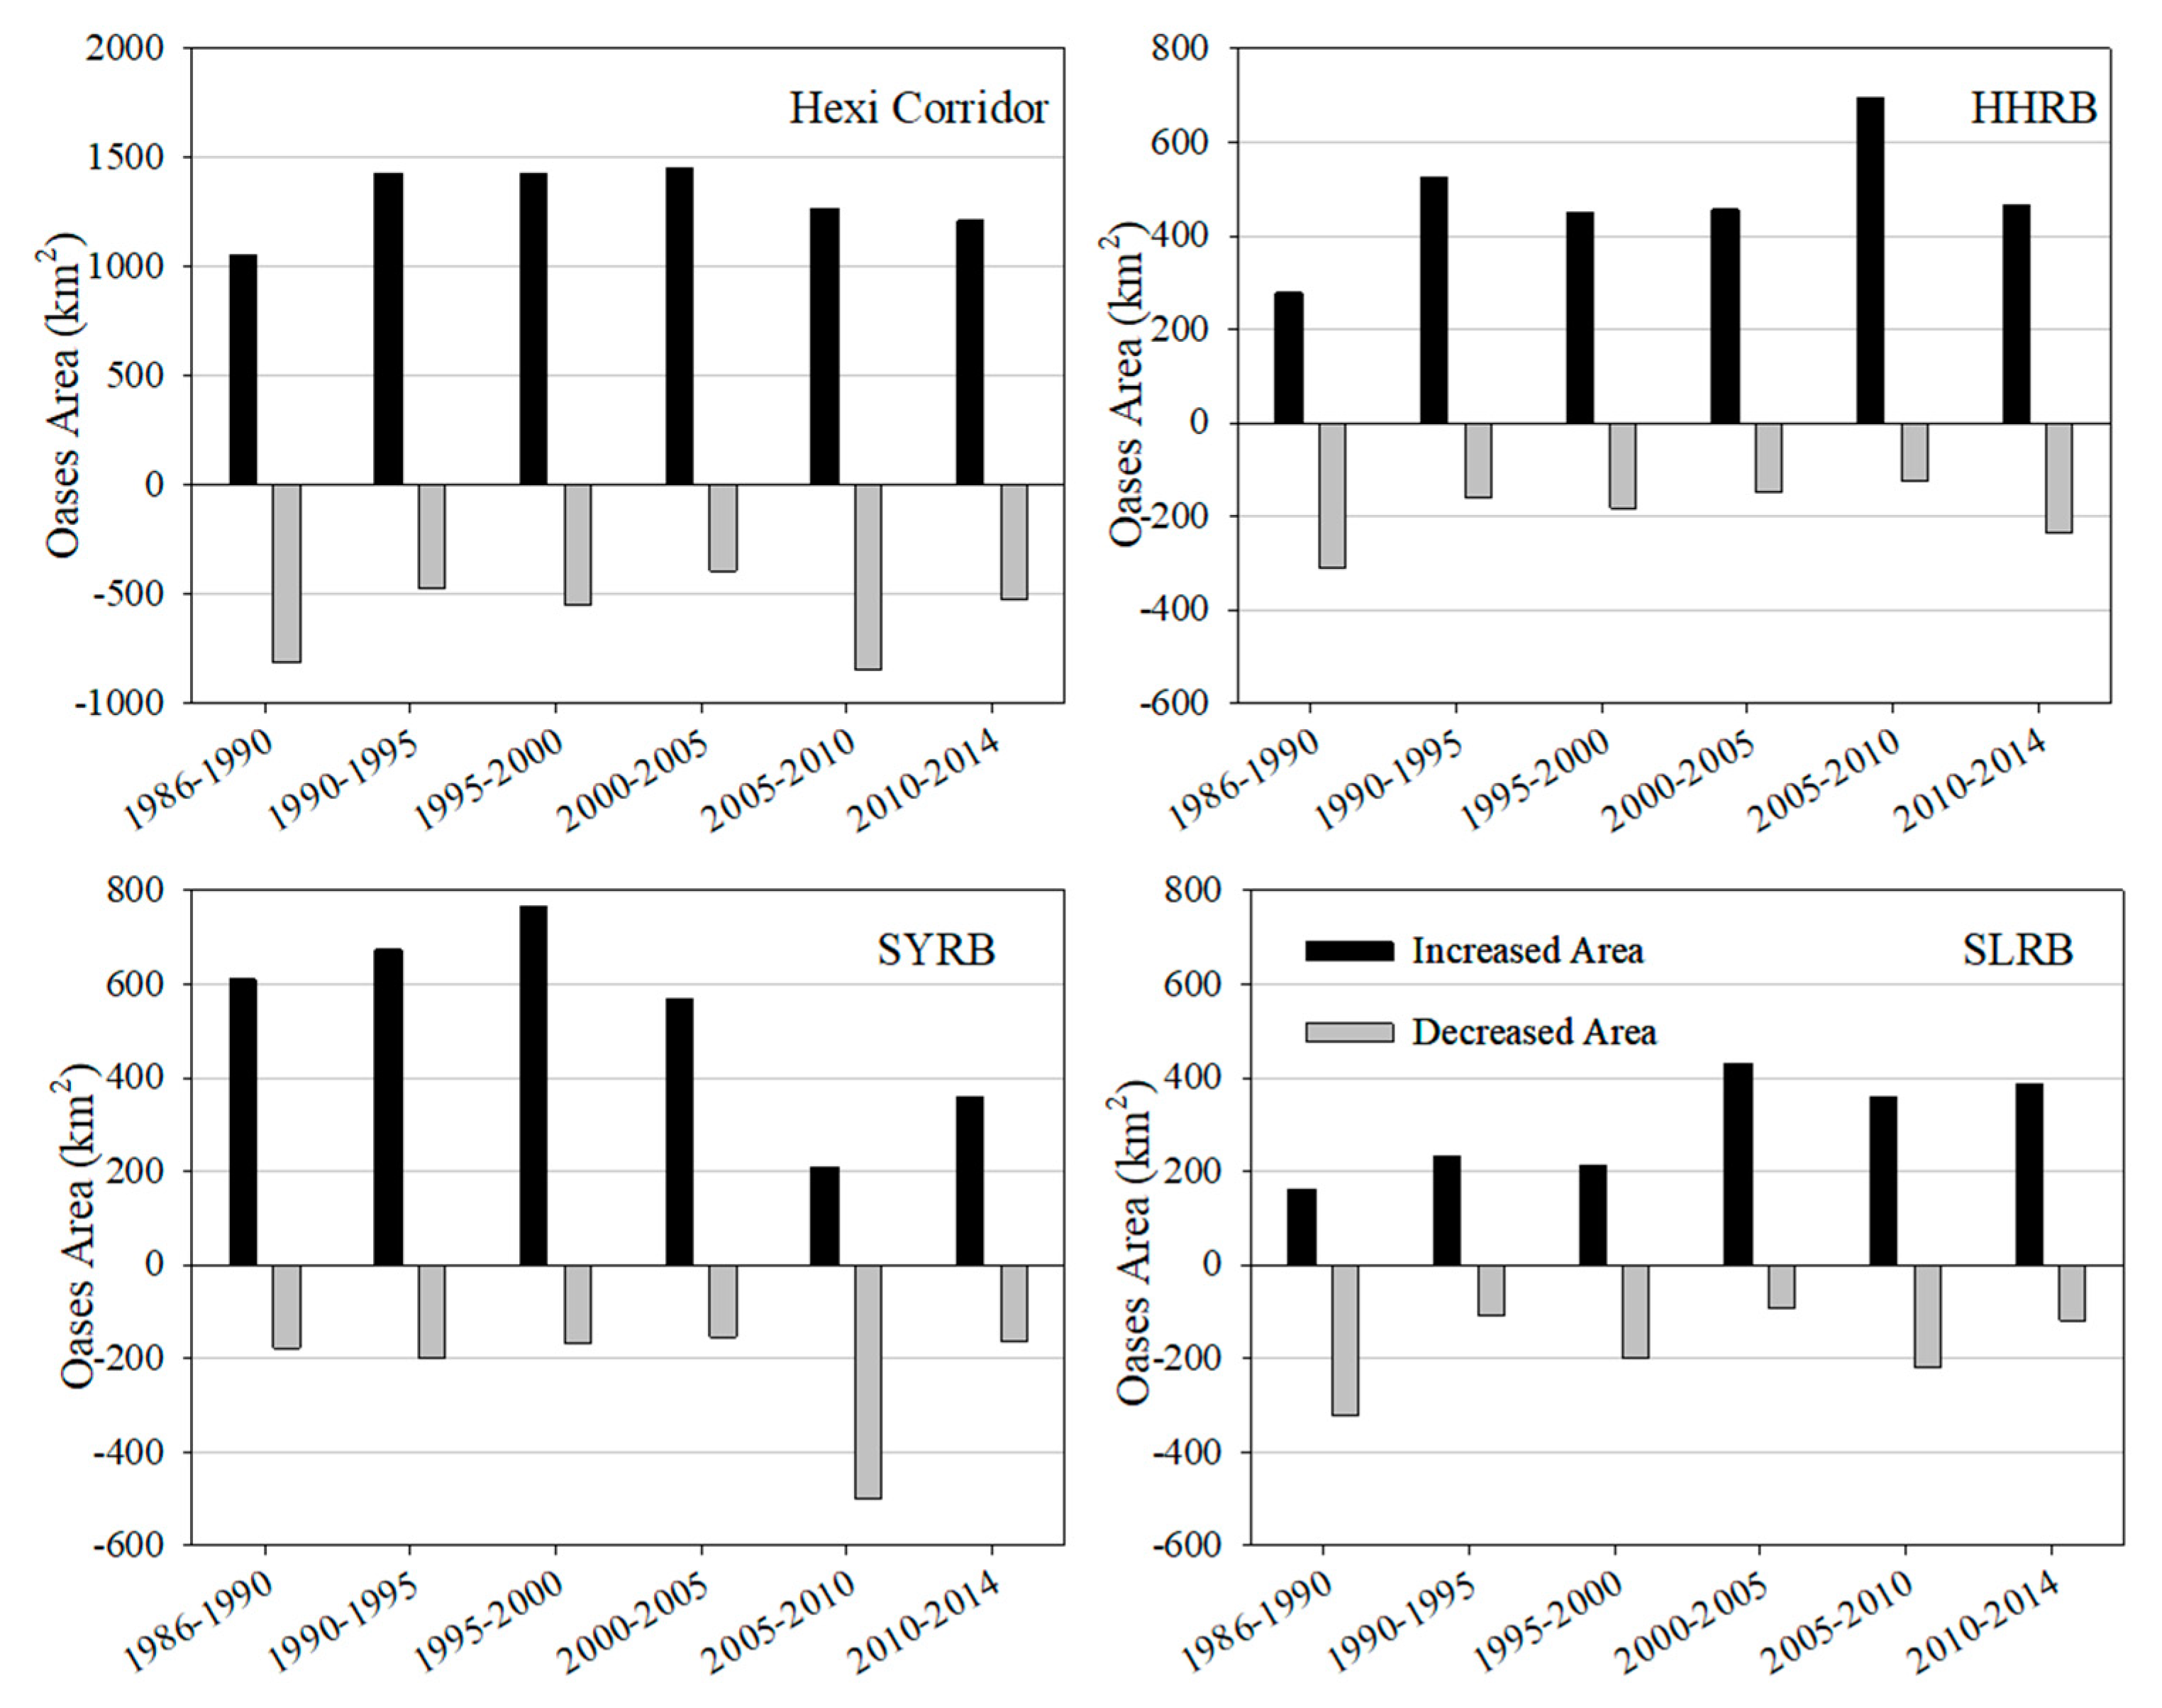
In terms of the distribution of oases in the three major river basins, the oasis area in HHRB is the largest, followed by SYRB and SLRB, which account for 47%, 40%, and 13% of the whole Hexi Corridor, respectively. As shown in Figure 3, compared with the decrease in oasis area, the increase of the oasis area has obvious trends. This indicates that oasis change types in the Hexi Corridor over the last 30 years are mainly ‘expansion’. The oases in HHRB and SLRB were in an ‘expanding’ state over past 30 years except for the period between 1986 and 1990. The oases had a rapid expansion phase in SYRB during 1986–2005. In the other periods, the expansion intensity was stable, and the total oasis area increased more in HHRB than in SLRB. In terms of scale of expansion, SYRB has the largest scale of expansion, from 3902 km2 in 1986 to 5697 km2 in 2014, which represents an increase of 46%. Secondly, oases in the HHRB increased by 1717 km2, which represents an increase of 33%, while the oasis area in SLRB had the smallest expansion of only 730 km2, which represents an increase of 45%.
3.3. Trends of Oasis Change
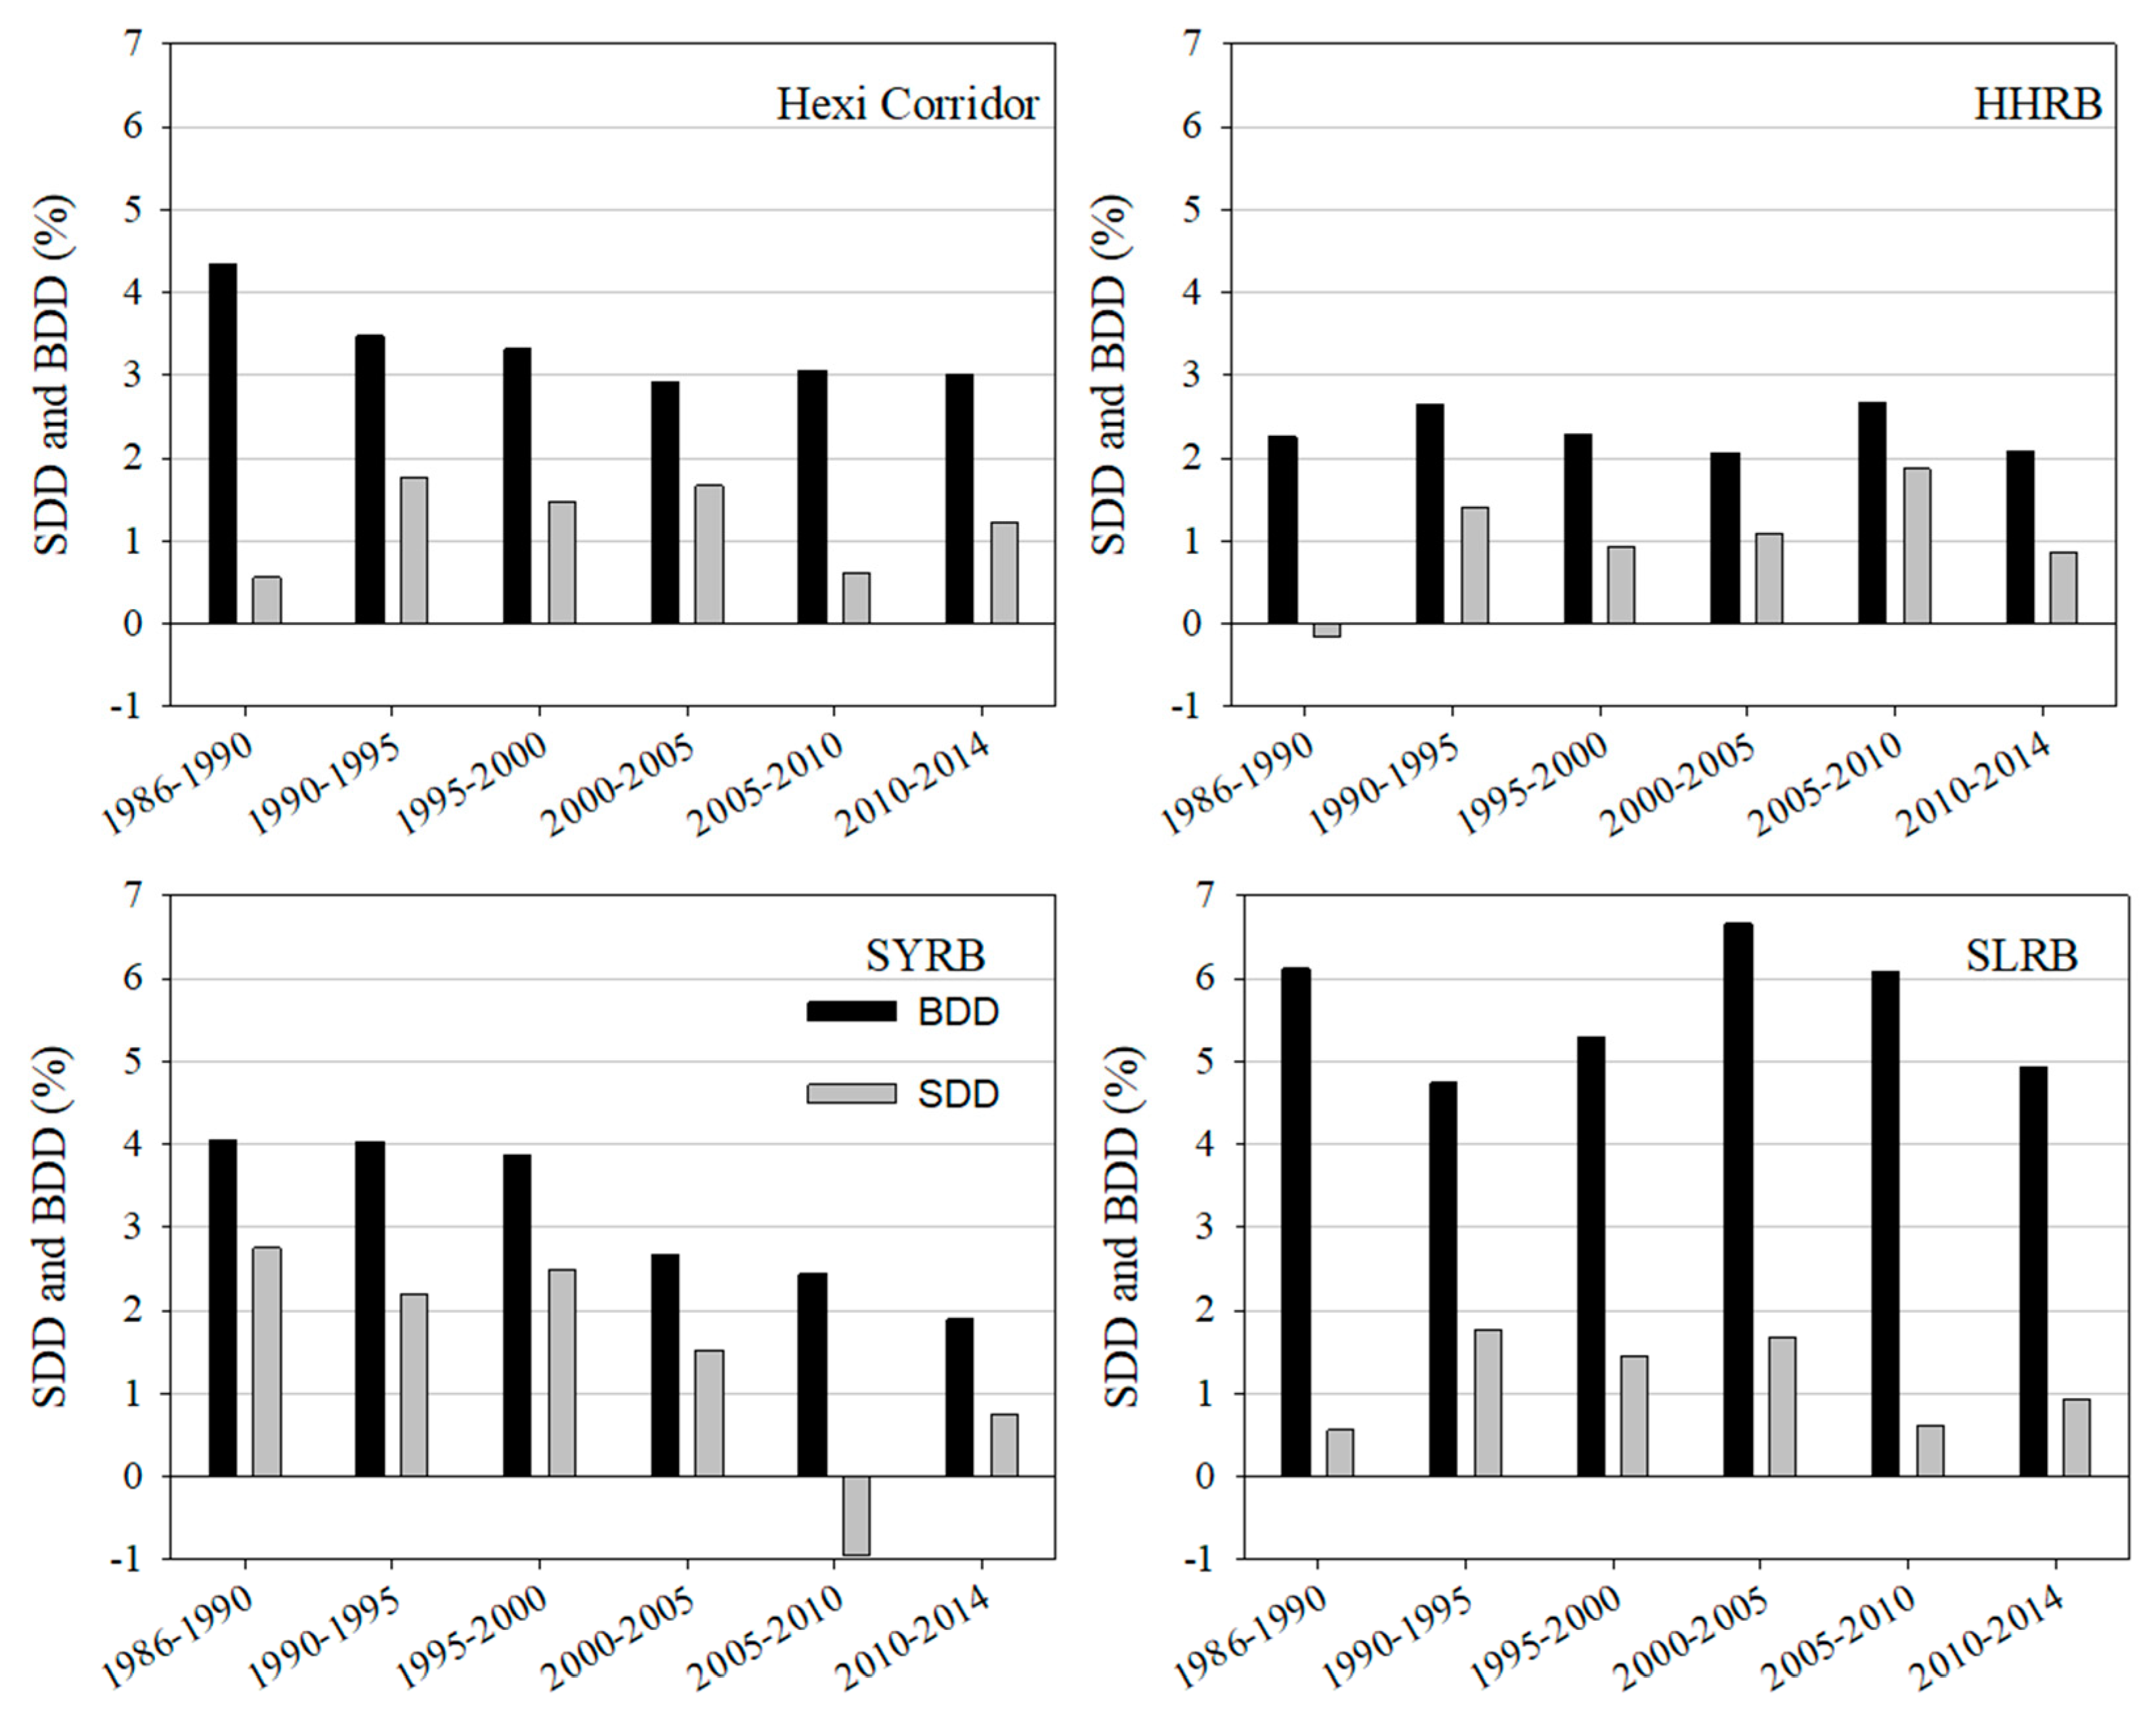
Figure 4 is the changes of SDD and BDD values in the Hexi Corridor and three river basins. From the figure we can see that the BDD values are higher than the SDD values in all periods, and they present a declining trend, indicating that the transformation between oasis and desert was severe and frequent. The speed of oasification was larger than that of the desertification process in the whole period. From 1986–1990, the highest value of BDD indicates that the oases transformed sharply, meanwhile, the lowest value of SDD indicates that the total oasis area increased slightly during the fluctuation. During 1990–2000, oasis changes were characterized as ‘stably and highly increasing’, where the SDD values were all larger than 1.5. Since then, the transition between oasis and desert moderated, and the oasis area increased slower than that during the previous period. The values of BDD in the Hexi Corridor varied hugely on account of the scale effect. The BDD value of SLRB is the biggest, followed by SYRB and HHRB, which average 5.6, 3.1, and 2.3. In contrast, the oasis area in HHRB is the largest, followed by SYRB and SLRB.
3.4. The Patterns of Oasis Evolution
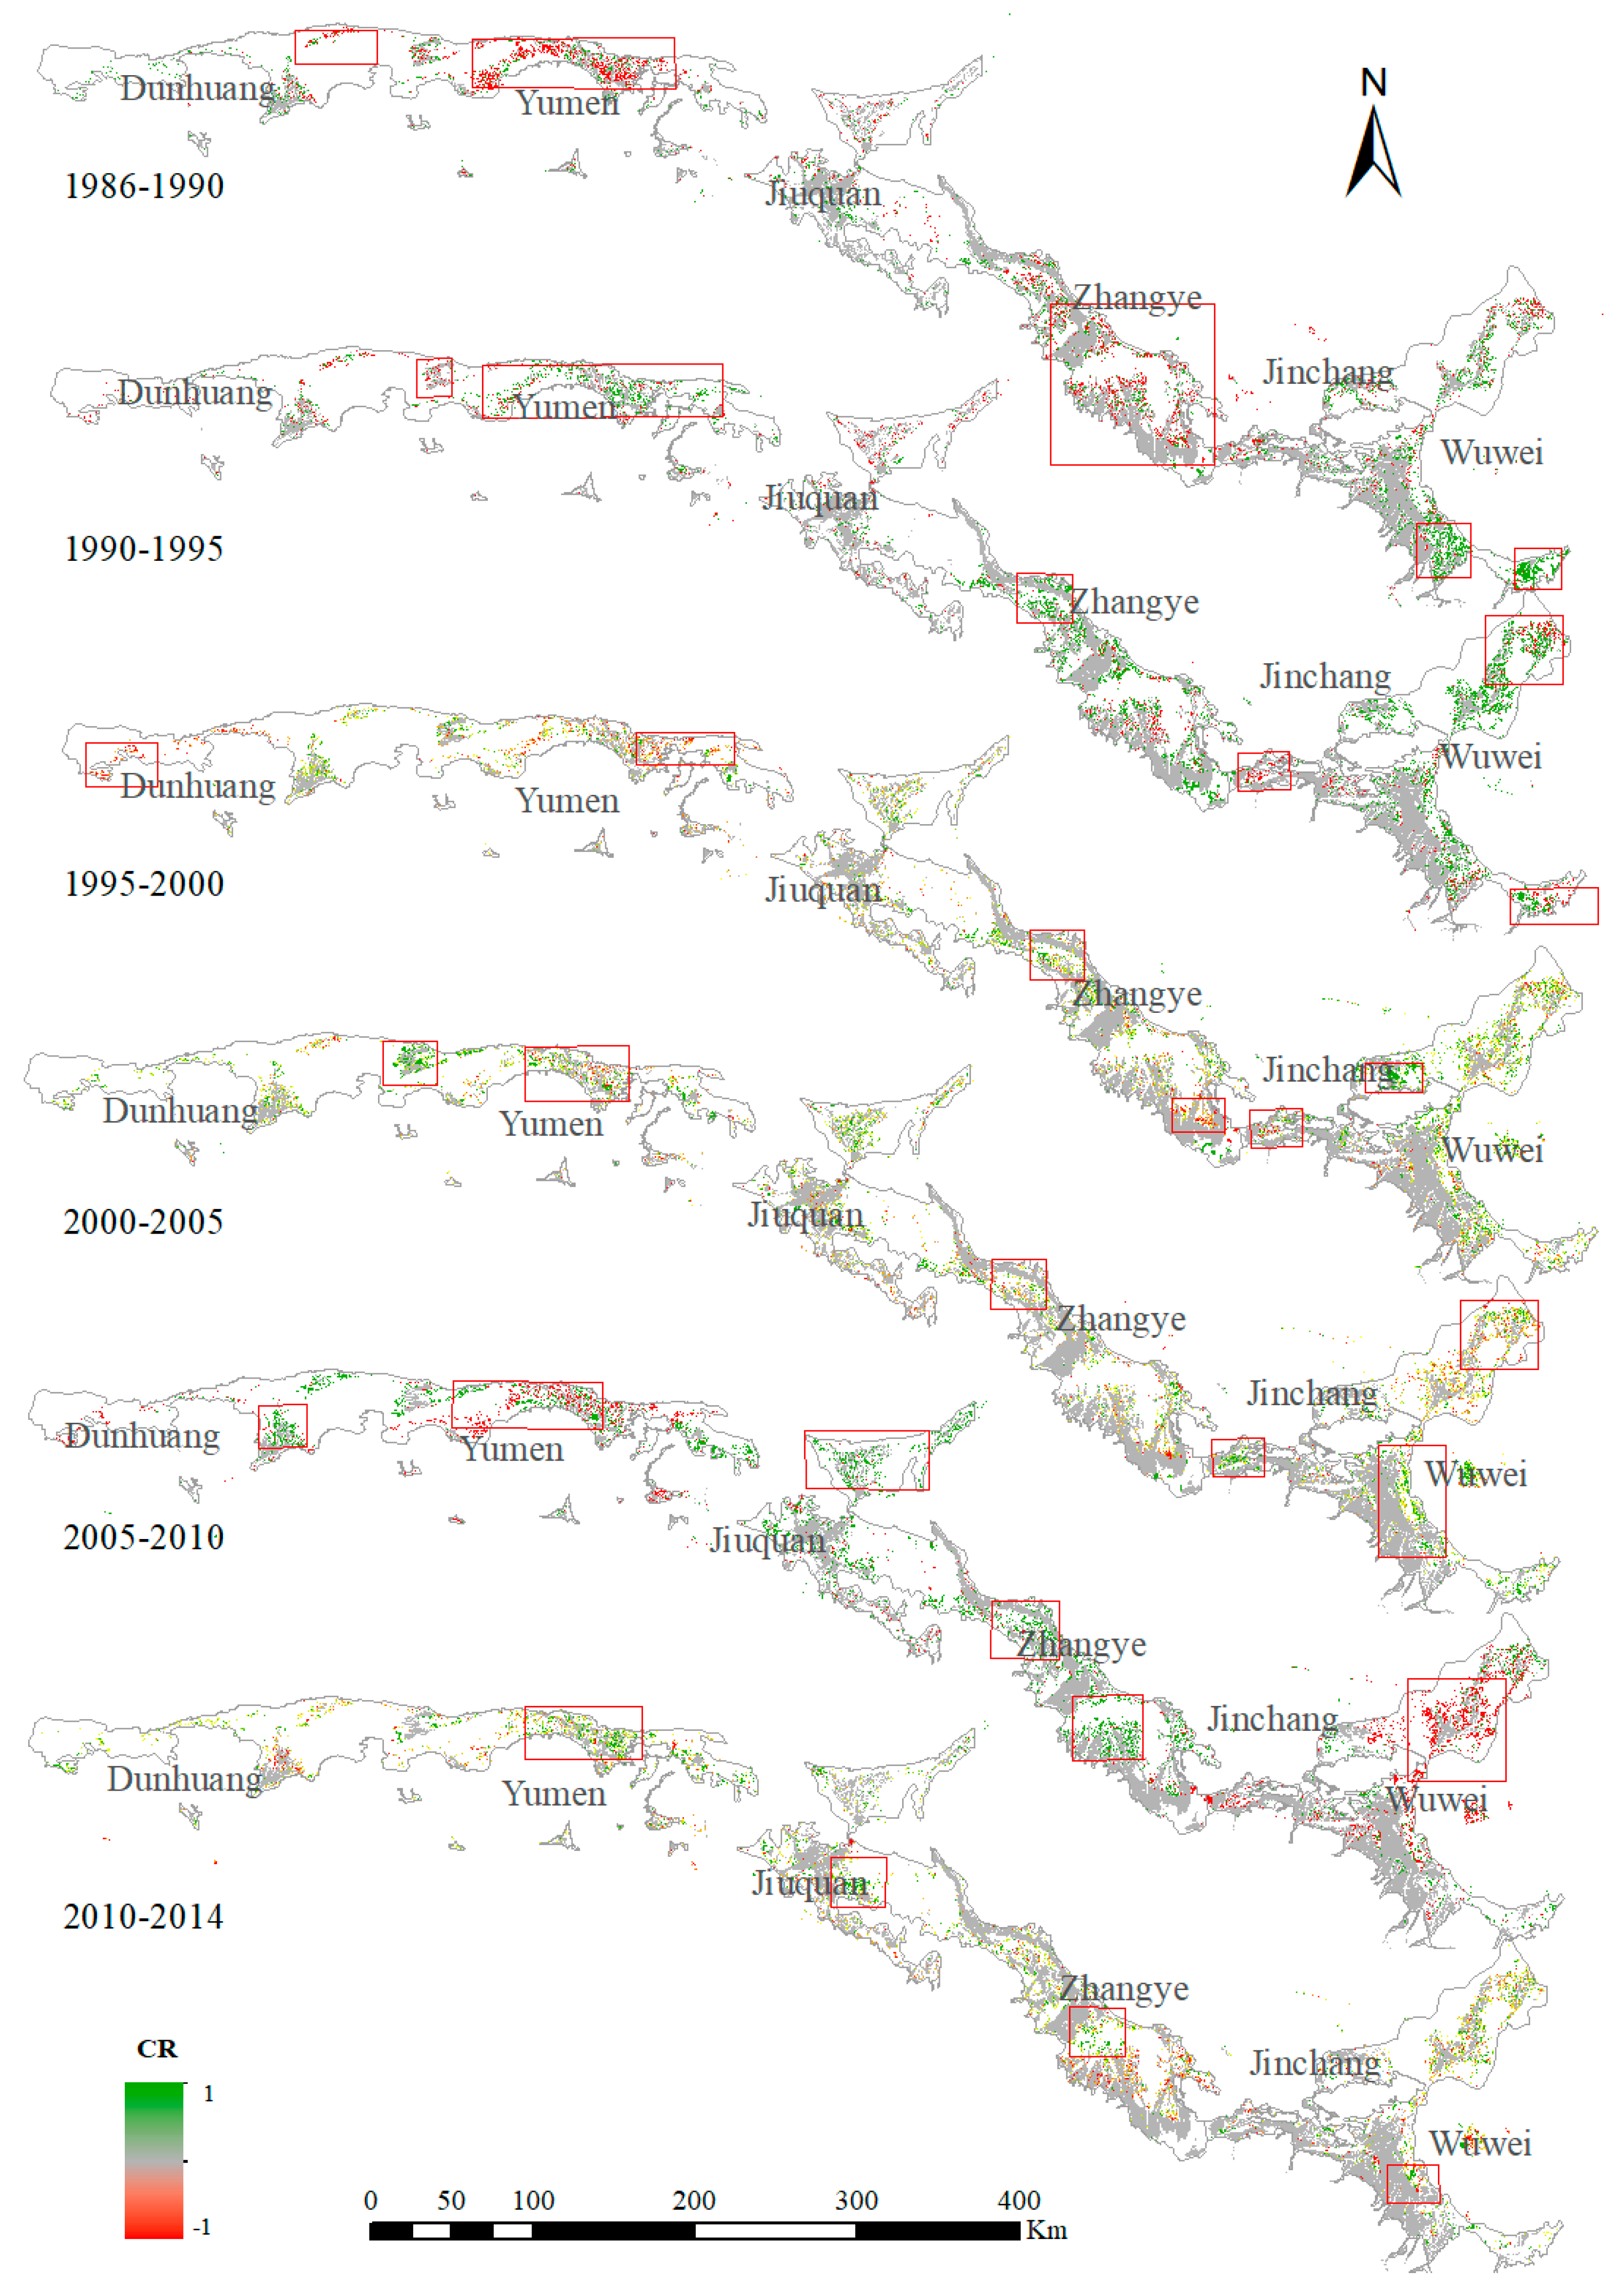
On the basis of gridding the oasis distribution data, we gained the CR of six periods and summed the original CR and the absolute CR of the whole period using Equations (3) and (4), respectively. As shown in Figure 5, six periods’ 5-year change maps were shown to demonstrate the evolution patterns in the Hexi Corridor. Among them, three periods (1986–1990, 1990–1995, and 2005–2010) presented rapid change.
In SLRB, during the period 1986–1990, the oases shrank heavily with an increased area of 163.21 km2 and a larger decreased area of 322.95 km2, where most of the lost area was concentrated on alluvial–proluvial plains such as the oases in Guazhou County and Yumen City. It can be seen, via inspection of the remote-sensing images, that the large-scale retreat in this region was caused by a degradation of natural vegetation (not shown). Since 1990, the oases in SLRB expanded steadily, mainly from reclaimed land, which were characterized by large, patchy areas and a concentrated distribution. In HHRB and SYRB, the oases expansion dominated during the whole study period, although oasification and desertification occurred simultaneously.
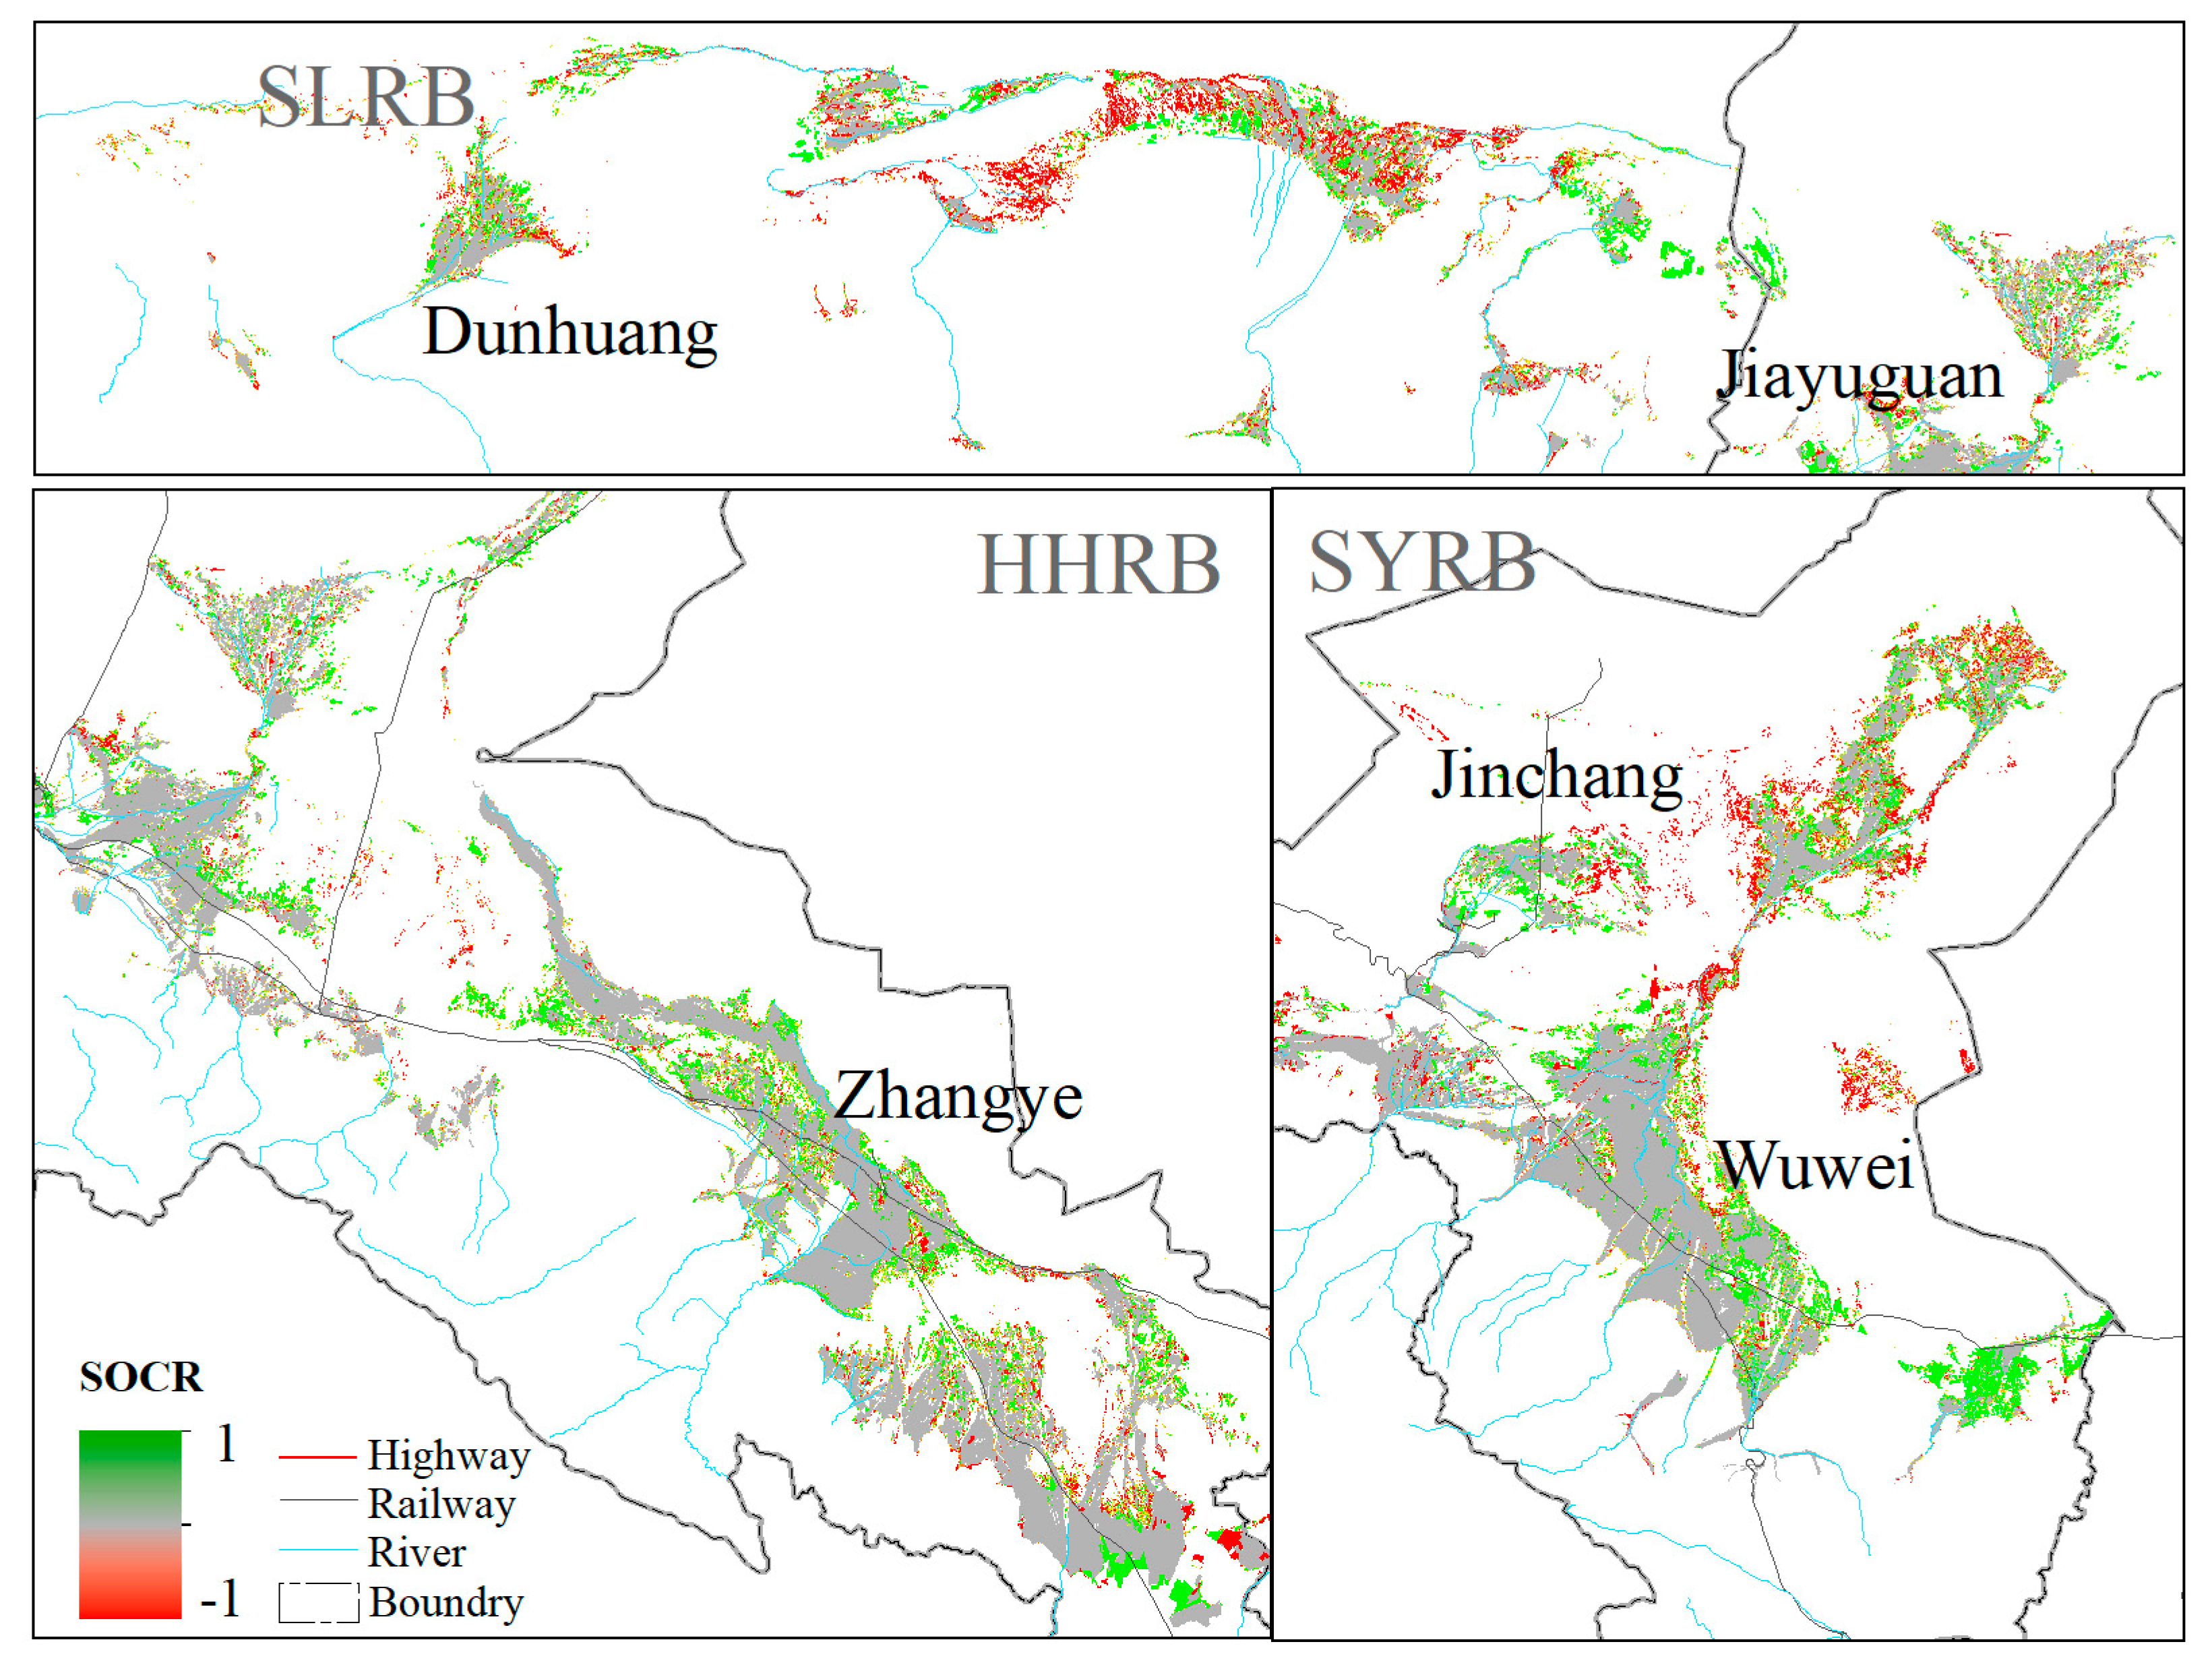
The oasis evolutions were divided into four types (stable, shrinking, expansive, and oscillating) according to the SOCR value, and the criteria given in Table 2. Over the past 30 years, stable oasis areas accounted for 50% of total area of oases in the study area. Those oases with stable patterns were distributed in alluvial–proluvial piedmont fans, the river plains of the Basin’s middle reaches, and the triangular alluvial fans in the lower reaches (Figure 6). Oases with “oscillating” patterns constituted 11% of the total area of oases, which means that almost one in 10 oases experienced bidirectional change. These areas are located at the edges of the alluvial–proluvial fans, in low-lying areas next to rivers and ditches, and in the transitional zones between oases and deserts. Oases with patterns of “expansion” accounted for 27% of the total area of oases. They were distributed beyond and within the main oasis regions, particularly in the middle reaches of HHRB and SYRB, and certain oases were diffused in the lower reaches. Most of these expanded oases were located alongside river terminations and in deserts where irrigation is available. Oases exhibiting a “shrinkage” pattern predominately along the lower river courses, which constituted 12% of the total oasis area.
Through interviews with loacal residents, we know that most of the growing oases were due to the reclamation of arable land, while shrinking oases, predominately distributed along the lower river courses, arise mostly due to the degradation of natural oases or the abandonment of cultivated land.
3.5. Evolution Intensity of Oasis Change
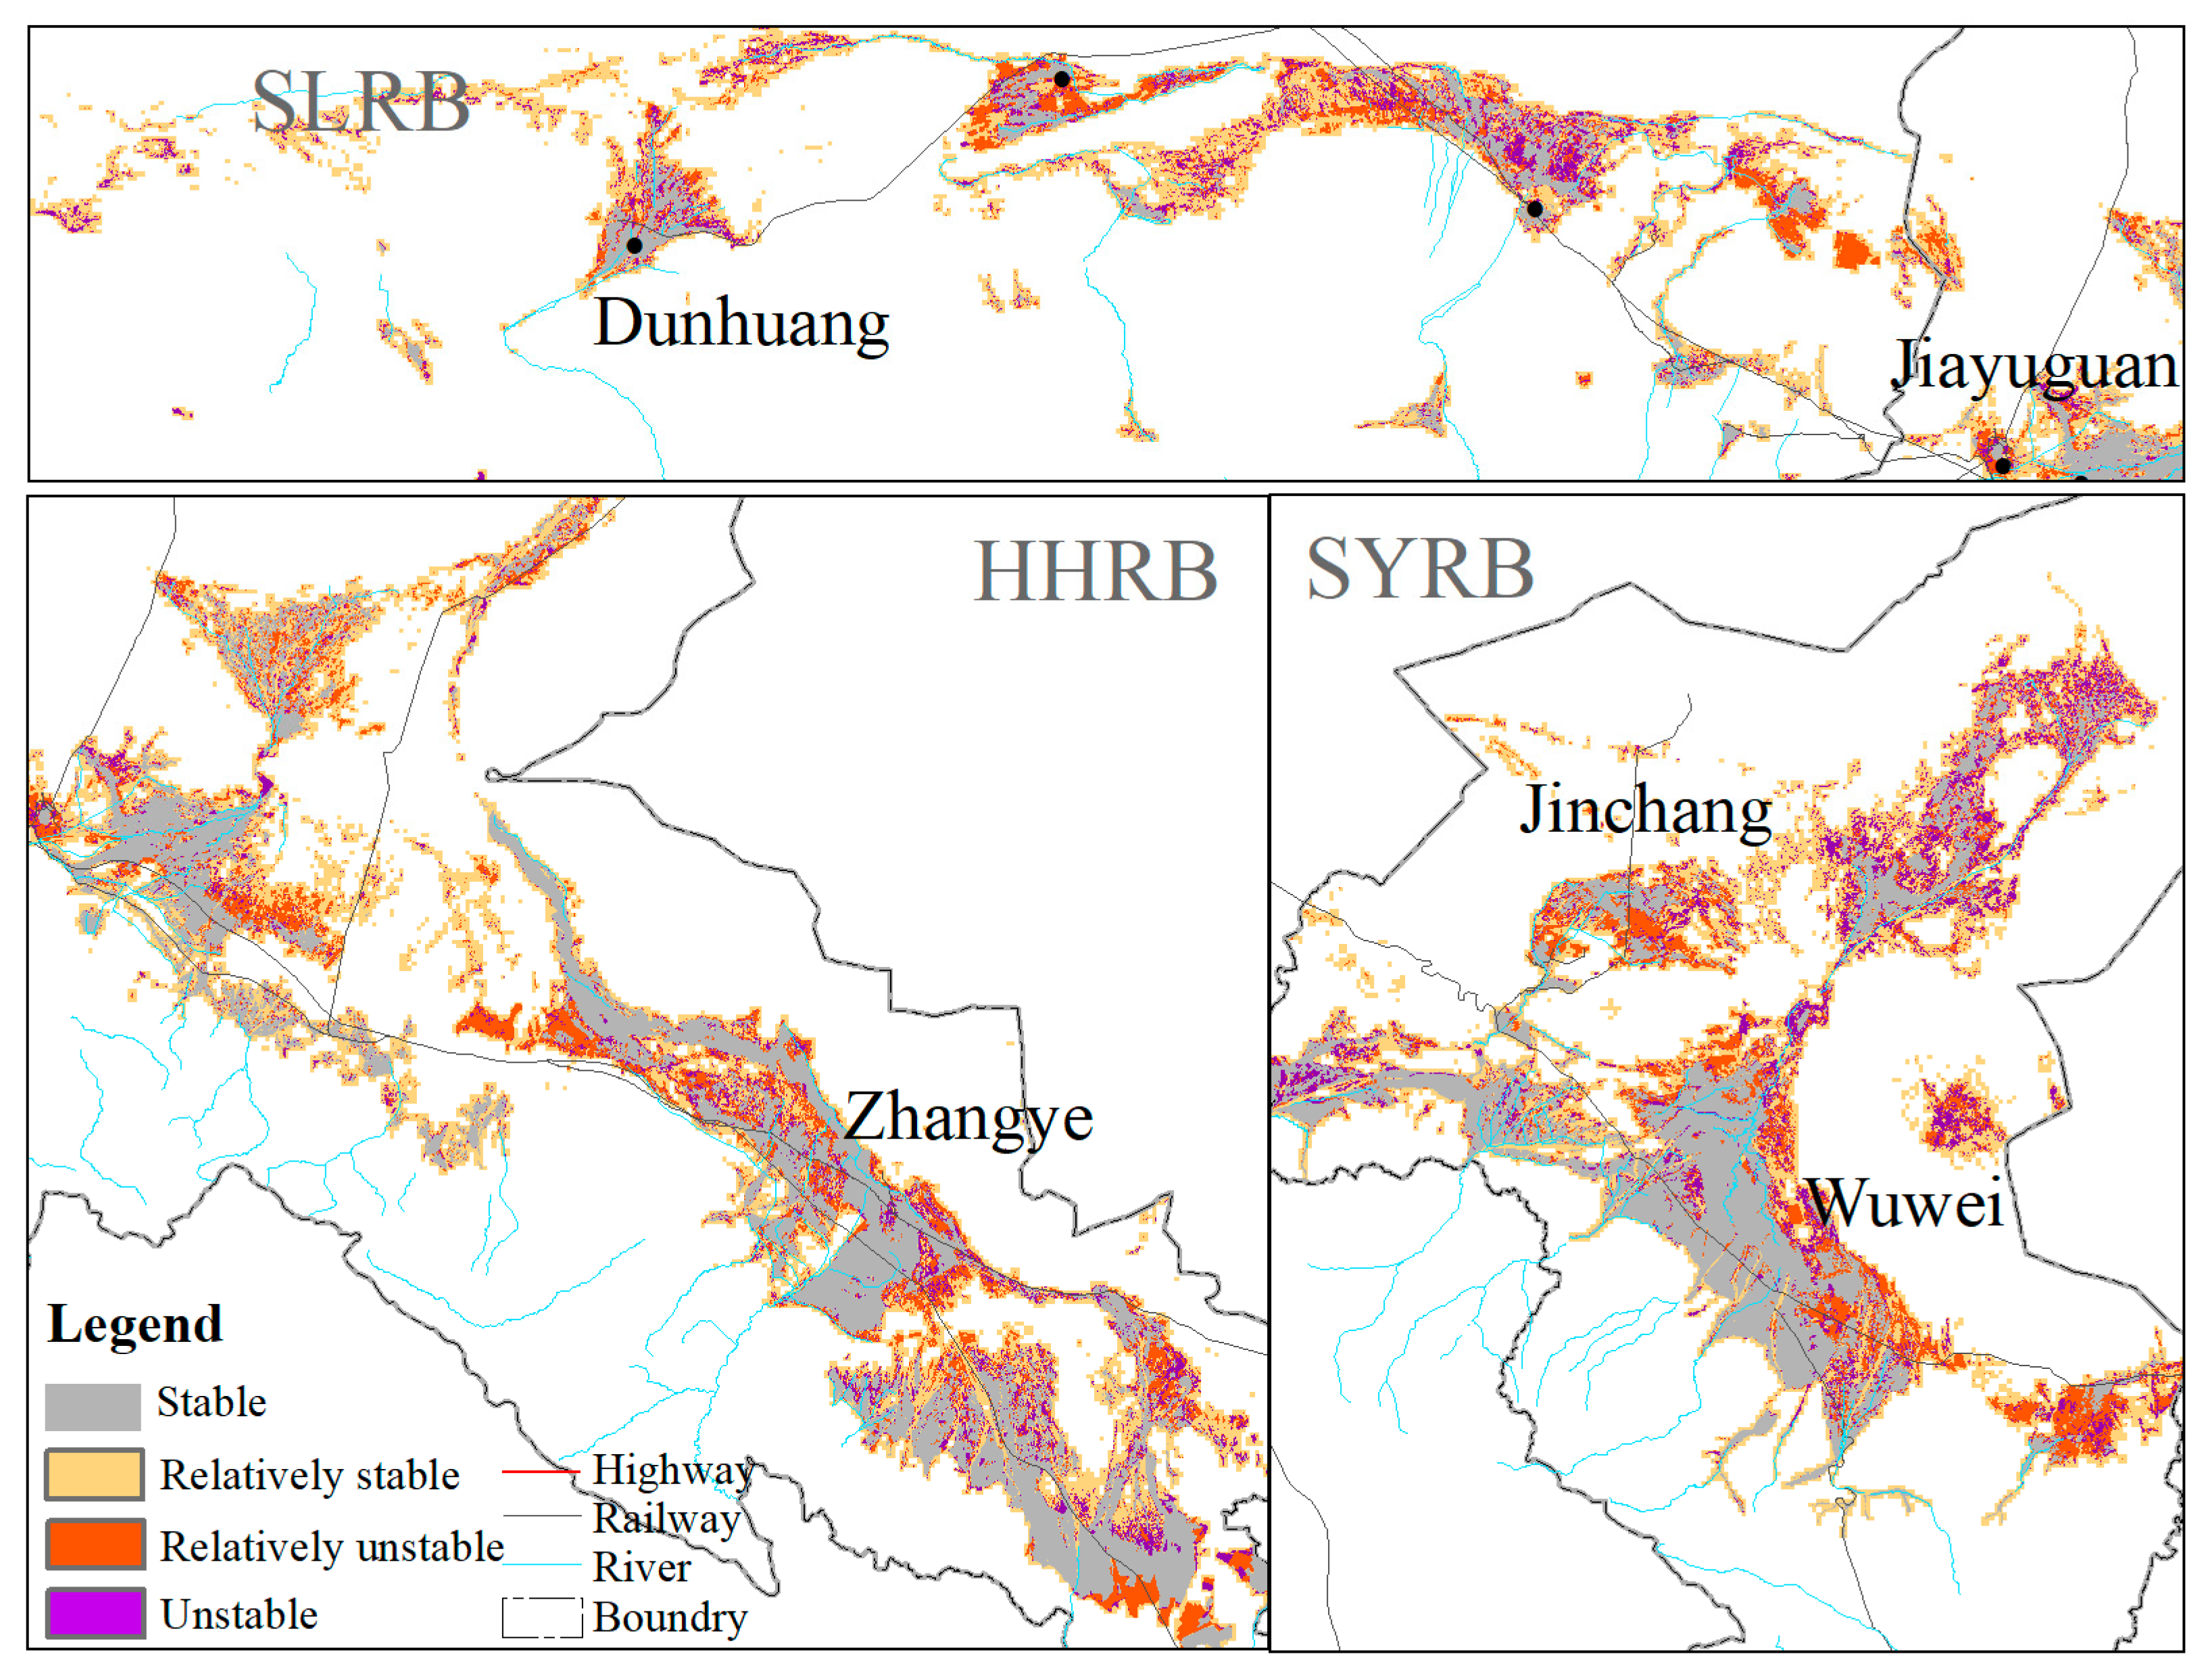
The gridded SACR values over the whole period, which were computed using Equation (4), indicate the overall change of intensity of the oases in a long time series. According to the SARC values and the criteria listed in Table 2, the evolution intensity was classified into four types (stable, relatively stable, relatively unstable, and unstable parts), where the results are shown in Figure 7. Before 1986, “stable” oasis areas accounted for 48% of the total oasis area, and were mainly distributed along both sides of the main canal, lateral canals and rivers in irrigation areas, such as the Shiyang River, the Heihe River, and the Shule River and their tributaries. In contrast to the stable area, “unstable” oases accounted for 16% of all oases, which were mainly distributed along the periphery of stable oases. The “relatively stable” and “relatively unstable” oases accounted for 12% and 24% of the total oases, respectively.
Based on the spatial and temporal analyses of the oasis variations in the three river basins of the Hexi Corridor, it can be found that there are some common characteristics. The total area of oases in the three major basins showed an increasing trend from 1986 to 2014. Oases were mainly distributed in areas with sufficient water resources and convenient transportation, while changing oases were mainly distributed along the periphery of main oasis bodies and isolated small-scale oases. Meanwhile, the oases in the different basins had their own evolution features that depended on their location, topographic, climatic conditions and anthropic factors.
In SLRB, “stable” oasis patches were distributed in a dispersed way due to the severe natural environment. The “unstable oases”, which underwent dramatic changes, were mainly located in the middle and to the east of the alluvial fan area that borders Guazhou county and Yumen city, as well as the river beaches on both sides of the rivers. Most of these were natural oases, which changed on account of a variety of natural factors, such as precipitation and changes in river runoff and vegetation. The “relatively unstable” oases were mainly distributed in Guazhou county, the migration area of Yumen district and nearby artificial channels.
In HHRB, the “stable oases” were distributed in strips along the Heihe River, and some in a triangular shape in front of the alluvial plain. The oases located in the lower reaches of the basin were fragmented and had poor connectivity. The “relatively unstable” oases were mainly distributed along highways and railways, and at the front of the alluvial plain area of the basin. These areas are mainly reclaimed cultivated land, which shows that human activities are the main reason for the large-scale changes.
In SYRB, the “stable oases” had the largest distribution and good connectivity in the middle reaches. Most of “unstable oases” were distributed in Minqin County in the lower reaches of the Shiyang River. The Minqin oasis, which is surrounded by the Badain Jaran Desert and the Tengger Desert, is a typical desert oasis that is severely affected by human activities. The oasis has gone through many cycles of reclamation and abandonment due to policies and natural factors, such as the Water Conservancy Project, the Household Production Responsibility System, the Comprehensive Treatment Program of the Shiyang River Basin, Poverty Alleviation Policy, and so on.
3.6. Application and Uncertainty Analysis of Multi-Temporal Images on Oasis Change
Multi-temporal satellite images were a good source of historical data [36], and provided a practical way for mapping and quantifying the oasis changes in an arid area [20,37]. Due to a complete time series of images produced in the same time for each period being rarely available for a large spatial scale and a long duration, the use of archive documents was imperative and the general trends were undeniable [24]. In this study, the Landsat scenes used for oasis extraction were selected in the local vegetation flourishing season from June to September. As shown in Table 3, All of the overall accuracy values (kappa values) for each period are above 0.84 (0.79). There are three factors that contribute to a high accuracy of extraction results. Firstly, vegetation in arid areas of Central Asia flourished from June to September, and its NDVI reached its maximum [26], which is conducive to distinguish vegetation from the background. Secondly, the spectral characteristics of water body and oasis vegetation, whether natural vegetation or crops, are greatly different from their desert background [38]. For RAIM, whose spectral characteristics are similar to desert, artificial visual discrimination was employed. Third, OTSU threshold method has strong robustness, especially for each scene’s image for using different thresholds to extract vegetation [29,30]. Therefore, the classification results are applicative for oasis change analysis.
However, the oases-change trends analysis is based on comparison of classification results in different years, and is sensitive to errors in the classification results, which causes either omission or commission errors in changes. Therefore, the uncertainty of multi-temporal remote-sensing imagery in oasis change should be raised [39]. The low classification accuracies among desert, lower-cover vegetation, and RAIM can be explained by their similar reflectance characteristics. In this study, the accuracies of vegetation and desert are lowest, followed by RAIM. The waterbody has the highest accuracy due to its distinct reflectance characteristic. The difference of vegetation phenology derived from the remote-sensing images obtained in different time also increased uncertainty [40]. For example, part of the vegetation on these images obtained at the beginning or end of the vegetation flourishing season may not be extracted, especially for the lower-cover vegetation. Since the study area in this research covered 11 scenes of Landsat images, and the monitoring spanned almost 30 years. It is difficult to guarantee every image being acquired was in the midsummer season, due to the sensor’s long revisiting cycle and the cloud’s contamination [39]. In addition, due to the difficulty of collecting simultaneous ground-truthing data, uncertainty was also introduced in the process of classification accuracy assessment [39,41].
A variety of factors influence the accuracy of land cover change products using the popular post-classification comparison methods; the basic issues are the accuracies of the component classifications as well as issues associated with the sensors and data preprocessing methods used [39]. Errors in the individual classifications may also be accumulated in mapping land cover change [42]. As a consequence of these and other issues, the estimation of the accuracy of a change product is a substantially more difficult and challenging task than the assessment of the accuracy of a single image classification [39]. It has been popular to adapt the standard confusion matrix to yield a change detection confusion matrix, which also has many limitations (large dimensions of matrix to deal with, difficulty in obtaining the sample of data to use in construction of the change detection confusion matrix, and low applicability to classification methods) [39,42,43].
Regardless, change detection from multi-temporal remotely sensed images has been used in many researches, such as LULC change [44,45,46], urban growth [47,48], and vegetation dynamics [37], since many types of changes have been extracted at local, regional, and global scale. Accuracy assessment with different sources of information to strengthen the credibility of the trends in oasis change is needed, for example by combining high-resolution remote sensing images and field observations [39,49]. In recent year, the images from the newly launched satellites, such as Landsat 8, Sentinel, and their combination production [50], have a strong capability in study on land cover change [51], crop monitoring [50], water resources [52], and vegetation phenology [51] with high temporal and spatial resolution, which will greatly facilitate oasis change research.
4. Major Driving Forces of the Oasis Spatio-Temporal Change
This study showed that the total oasis area increased in the Hexi Corridor over the past 30 years. This result is consistent with the results reported in HHRB [9], in SYRB [35] and in SLRB [53]. The trend was similar in other arid areas such as the Sangong River basin and the Hotan oasis [54] of Xinjiang in north-west china [55]. The oases in the Manas River valley and Sangong River basin had an expansion pattern described by ‘outward extension and inward filling’. The stages of oasis change were consistent with the occurrence of economic growth and reform in China, and changes in oases in China were mainly related to social development.
4.1. Natural Driving Forces of Oasis Evolution
Natural factors related to oasis evolution are mainly climatic, which are related to precipitation and air temperature, and hydrological factors such as runoff. Over the past 30 years, all three exhibited an upward tendency. The increasing rate of precipitation was 0.76 mm year−1 [13,56]; The increasing rate of air temperature was 0.29 °C year−1, which may have led to an increase in runoff from mountainous regions, because of the glacial melt water increasing caused by temperature rise; The increasing rate of runoff from mountain-passes was 0.42 × 10⁷ m3 year−1, increased by 9.43% compared with average runoff during 1957–1989 [14]. The increased runoff led to an increase in available water resources in the oasis, which to some extent can support oasis expansion.
Furthermore, the geological and topographical conditions, formed in the geological history period, played a decisive and sustainable role in the differentiation of water, soil and plant resources in the whole basin. Different topographical features have different impacts on the use of land, among which the slope of ground mainly affects the distribution of production and living land. Oases in the Hexi Corridor are mainly distributed in the plains along rivers and irrigation canal systems whose slopes are less than 15°. The upper and middle reaches of SYRB and HHRB are mountainous and have piedmont alluvial plains with slopes steeper than 25°, which results in a relative abundance of piedmont water resources. The SLRB lacks a stable water supply due to it being far away from mountains, which could explain the fragmented oasis distribution [15].
4.2. Population Growth, Market Economy and Policy Factors
Population growth had been considered to be a major factor related to oasis land cover change. Indeed, oasis expansion is often correlated to an increase in human population [57,58]. During the past 30 years, the population of the Hexi Corridor increased from 1.06 to 5.07 million (378% increase), while the oasis area increased from 10,709 to 14,950 km2 (39.6% increase). There is a strong positive relationship between population growth and the increase of the oasis area. The increase of population will inevitably lead to an increase in the demand for agricultural and animal products for human survival. In the case of limited improvement of land productivity, it can only increase the area of cultivated land to meet the demand, thus effectively promoting the expansion of oasis.
Policies, such as the ‘Reform and Opening up’ policy, agricultural policies, population policies, tax policies, market economy policies, and conservation policies, played an important role in the oasis evolution in the Hexi Corridor. Although there are many policies that have been carried out by the national and local governments, the policies listed below have had the most significant impact on oasis evolution. The ‘Household Production Responsibility System’ and ‘Construction of Commodity Grain Base’ were developed to improve crop production [59]. With high and stable inflow of the base, the irrigation infrastructure, including reservoirs, irrigation canals, water supply wells and dams, was either repaired or constructed. The ‘immigration policy’ facilitated migration from Dingxi (a poor region of Gansu province) to the Hexi Corridor in 1983 to improve standards of living. Hence, more land was needed to support the livelihood of the population, and the oasis was therefore expanded to satisfy the demands of a growing population. Uninhabited lands along the edges of western Gaotai and north-eastern Jinta (located in the middle of Hexi Corridor) were cultivated to support the immigrants, and the oases steadily expanded. With the marked oriented economy booming, the ‘adjustment of planting structure’ was adopted by local residents to pursue economic development and to increase income. Enormous areas of land were reclaimed to enable greater crop production and to obtain additional benefits, as evidenced by the marked economic improvement since 2002. In 2006, the ‘Comprehensive Treatment Program of the Shiyang River Basin’ was implemented to restore the groundwater table in the Minqin oasis, which primarily involved increasing the surface water supply, controlling excessive groundwater mining, the installation of water-saving technologies, and the formation of water-user associations. As a result, this program played a certain positive role with regards to groundwater resource recovery [17]. In order to protect ecological balance and to realize sustainable development, conservation policies, such as the ‘Three North Shelterbelt’, the ‘Grain for Green’ project, the ‘natural forest protection project’ and the ‘comprehensive management plan for the ecological protection and construction’ of the Qianlian mountains proposed in recent years, have been and will continue to have a profound impact on the sustainability of oases [9,23,24,35,57,60]. After 2000, the ‘Great Western Development strategy’, the ‘Canceling Agricultural Tax’, the ‘New Rural Development strategy’, and the ‘National Ecological Civilization’ construction have had a profound impact on the regional economy and sustainability of oases in the Hexi Corridor.
The improvement of the environment was not significant, however, even though numerous policies were concocted to alleviate a shortage of water resources and to protect the environment. The government should pay more attention to the fragility of the environment and enhance environmental compensation in response to oasis changes. Efforts to improve land use efficiency, to encourage water conservation, to improve irrigation practices, to optimize planting structures, and to increase crop yields should, therefore, be implemented urgently. Furthermore, increased levels of research and monitoring of environmental conditions in oases are warranted.
5. Conclusions
The oases in the Hexi corridor have gone through a tremendous transformation in recent decades. We aim to explore the characteristics of oasis change using Landsat imagery and their dynamic mechanism(s) quantitatively based on data from statistics yearbooks and field surveys.
During the study period from 1986 to 2014, the total area of oases in the Hexi Corridor expanded by 40%, where oases in the three major river basins expanded at different rates. The mutual transformation between oasis and desert is very intense, especially in transition zones between oases and deserts. Changing oases are mainly distributed along the periphery of large groups of oases or in small isolated oases in the desert. In addition, four spatial change patterns of “unchanged, expanding, shrinking, and oscillating” were identified with regards to oasis development, where oases with oscillating patterns were dominant, whose area accounted for over 50% of the total area occupied by oases. The rapid population growth (378% increase) is a main reason for enormous oases expansion (40% increase) and intense mutual transformation (11% oscillate), while the polices carried out by the state and local governments also play an important role.
In conclusion, oasis change is a complex and gradual process in arid China. Understanding oasis change and its landscape effect on a catchment can form the basis of sustainable management and development of oasis landscape in arid areas. These results can provide basic data for regulating oasis exploitation and for the government to use when making strategies for optimizing oasis development and minimizing environmental impact.
Author Contributions
Conceptualization, Y.X.; Funding acquisition, Y.X.; Methodology, Q.B., H.L. and L.H.; Visualization, Q.B. and H.L.; Writing–original draft, Q.B.; Writing–review and editing, Y.X.
Funding
This research was funded by the National Natural Science Foundation of China (No. 41471163, 41530752 and 41601064), the Technology Basic Resource Investigation Program of China (NO. 2017FY101003), the Strategic Priority Research Program of Chinese Academy of Sciences, Pan-Third Pole Environment Study for a Green Silk Road (Pan-TPE) (NO. XDA2009000001), and the Fundamental Research Funds for Central Universities (No. lzujbky-2015-212, lzujbky2018-it80, and lzujbky-2018-139).
Conflicts of Interest
The authors declare no conflict of interest. The funders had no role in the design of the study; in the collection, analyses, or interpretation of data; in the writing of the manuscript, or in the decision to publish the results.
References
- Turner, B.L. The sustainability principle in global agendas: Implications for understanding land-use/cover change. Geogr. J. 1997, 163, 133–140. [Google Scholar]
- Zhang, B.L.; Yin, L.; Zhang, S.; Feng, C. Assessment on characteristics of LUCC process based on complex network in Modern Yellow River Delta, Shandong Province of China. Earth Sci. Inform. 2016, 9, 83–93. [Google Scholar] [CrossRef]
- Chen, H.; Liang, X.Y.; Li, R. Based on a Multi-Agent System for Multi-Scale Simulation and Application of Household’s LUCC: A Case Study for Mengcha Village, Mizhi County, Shaanxi Province. In Springerplus; Springer: New York, NY, USA, 2013; Volume 2. [Google Scholar]
- Ruelland, D.; Tribotte, A.; Puech, C.; Dieulin, C. Comparison of methods for LUCC monitoring over 50 years from aerial photographs and satellite images in a Sahelian catchment. Int. J. Remote Sens. 2011, 32, 1747–1777. [Google Scholar] [CrossRef]
- Deng, Y.H.; Wang, S.; Bai, X.; Tian, Y.; Wu, L.; Xiao, J.; Chen, F.; Qian, Q. Relationship among land surface temperature and LUCC, NDVI in typical karst area. Sci. Rep. 2018, 8, 641. [Google Scholar] [CrossRef] [PubMed] [Green Version]
- Hasselmann, F.; Csaplovics, E.; Falconer, I.; Bürgi, M.; Hersperger, A.M. Technological driving forces of LUCC: Conceptualization, quantification, and the example of urban power distribution networks. Land Use Policy 2010, 27, 628–637. [Google Scholar] [CrossRef]
- Okin, G.S.; Gillette, D.A.; Herrick, J.E. Multi-scale controls on and consequences of aeolian processes in landscape change in arid and semi-arid environments. J. Arid Environ. 2006, 65, 253–275. [Google Scholar] [CrossRef]
- Bai, J.; Chen, X.; Li, L.; Luo, G.; Yu, Q. Quantifying the contributions of agricultural oasis expansion, management practices and climate change to net primary production and evapotranspiration in croplands in arid northwest China. J. Arid Environ. 2014, 100, 31–41. [Google Scholar] [CrossRef]
- Xie, Y.; Zhao, H.; Wang, G. Spatio-temporal changes in oases in the Heihe River Basin of China: 1963–2013. Écoscience 2015, 22, 33–46. [Google Scholar] [CrossRef]
- Zhang, Z.C.; Dong, Z.B. Grain size characteristics in the Hexi Corridor Desert. Aeolian Res. 2015, 18, 55–67. [Google Scholar] [CrossRef]
- Wang, T.; Xue, X.; Zhou, L.; Guo, J. Combating Aeolian Desertification in Northern China. Land Degrad. Dev. 2015, 26, 118–132. [Google Scholar] [CrossRef]
- Zhang, M.; Luo, G.; De Maeyer, P.; Cai, P.; Kurban, A. Improved Atmospheric Modelling of the Oasis-Desert System in Central Asia Using WRF with Actual Satellite Products. Remote Sens. 2017, 9, 1273. [Google Scholar] [CrossRef]
- Li, B.F.; Chen, Y.N.; Chen, Z.S.; Li, W.H. Trends in runoff versus climate change in typical rivers in the arid region of northwest China. Quat. Int. 2012, 282, 87–95. [Google Scholar] [CrossRef]
- Kang, E.S.; Cheng, G.D.; Lan, Y.C.; Jin, H.J. A model for simulating the response of runoff from the mountainous watersheds of inland river basins in the arid area of northwest China to climatic changes. Sci. China Ser. D 1999, 42, 52–63. [Google Scholar] [CrossRef]
- Huang, S.; Feng, Q.; Lu, Z.X.; Wen, X.H.; Deo, R.C. Trend Analysis of Water Poverty Index for Assessment of Water Stress and Water Management Polices: A Case Study in the Hexi Corridor, China. Sustainability 2017, 9, 756. [Google Scholar] [CrossRef]
- Gong, X.; Cortese, C. A socialist market economy with Chinese characteristics: The accounting annual report of China Mobile. Account. Forum 2017, 41, 206–220. [Google Scholar] [CrossRef]
- Hao, Y.; Xie, Y.; Ma, J.; Zhang, W. The critical role of local policy effects in arid watershed groundwater resources sustainability: A case study in the Minqin oasis, China. Sci. Total Environ. 2017, 601–602, 1084–1096. [Google Scholar] [CrossRef] [PubMed]
- Zuo, L.; Zhang, Z.; Zhao, X.; Wang, X.; Wu, W.; Yi, L.; Liu, F. Multitemporal analysis of cropland transition in a climate-sensitive area: A case study of the arid and semiarid region of northwest China. Reg. Environ. Chang. 2014, 14, 75–89. [Google Scholar] [CrossRef]
- Zhang, X.X.; Xie, Y.W. Detecting Historical Vegetation Changes in the Dunhuang Oasis Protected Area Using Landsat Images. Sustainability 2017, 9, 1780. [Google Scholar] [CrossRef]
- Gamo, M.; Shinoda, M.; Maeda, T. Classification of arid lands, including soil degradation and irrigated areas, based on vegetation and aridity indices. Int. J. Remote Sens. 2013, 34, 6701–6722. [Google Scholar] [CrossRef] [Green Version]
- Gao, B.C. NDWI—A normalized difference water index for remote sensing of vegetation liquid water from space. Remote Sens. Environ. 1996, 58, 257–266. [Google Scholar] [CrossRef]
- McFeeters, S.K. The use of the Normalized Difference Water Index (NDWI) in the delineation of open water features. Int. J. Remote Sens. 1996, 17, 1425–1432. [Google Scholar] [CrossRef]
- Song, W.; Zhang, Y. Expansion of agricultural oasis in the Heihe River Basin of China: Patterns, reasons and policy implications. Phys. Chem. Earth Parts A/B/C 2015, 89–90, 46–55. [Google Scholar] [CrossRef]
- Xie, Y.; Gong, J.; Sun, P.; Gou, X. Oasis dynamics change and its influence on landscape pattern on Jinta oasis in arid China from 1963a to 2010a: Integration of multi-source satellite images. Int. J. Appl. Earth Obs. Geoinf. 2014, 33, 181–191. [Google Scholar] [CrossRef]
- Zhang, Z.; Dong, Z.; Li, J.; Qian, G.; Jiang, C. Implications of surface properties for dust emission from gravel deserts (gobis) in the Hexi Corridor. Geoderma 2016, 268, 69–77. [Google Scholar] [CrossRef]
- Geng, L.Y.; Ma, M.G.; Wang, H.B. An Effective Compound Algorithm for Reconstructing MODIS NDVI Time Series Data and Its Validation Based on Ground Measurements. IEEE J. Sel. Top. Appl. Earth Obs. Remote Sens. 2016, 9, 3588–3597. [Google Scholar] [CrossRef]
- Cheng, W.M.; Zhou, C.H.; Liu, H.J.; Zhang, Y.; Jiang, Y.; Zhang, Y.C.; Yao, Y.H. The oasis expansion and eco-environment change over the last 50 years in Manas River Valley, Xinjiang. Sci. China Ser. D 2006, 49, 163–175. [Google Scholar] [CrossRef]
- Potchter, O.; Goldman, D.; Kadish, D.; Iluz, D. The oasis effect in an extremely hot and arid climate: The case of southern Israel. J. Arid Environ. 2008, 72, 1721–1733. [Google Scholar] [CrossRef]
- Kurita, T.; Otsu, N.; Abdelmalek, N. Maximum likelihood thresholding based on population mixture models. Pattern Recognit. 1992, 25, 1231–1240. [Google Scholar] [CrossRef]
- Otsu, N. A Threshold Selection Method from Gray-Level Histograms. IEEE Trans. Syst. Man Cybern. 2007, 9, 62–66. [Google Scholar] [CrossRef]
- Xie, Y.; Li, L.; Wang, H.; Zhao, X. The application of threshold methods for image segmentation in oasis vegetation extraction. In Proceedings of the 8th International Conference on Geoinformatics, Beijing, China, 18–20 June 2010; pp. 1–4. [Google Scholar]
- Liu, X.P.; Hu, G.H.; Chen, Y.M.; Li, X.; Xu, X.C.; Li, S.Y.; Pei, F.S.; Wang, S.J. High-resolution multi-temporal mapping of global urban land using Landsat images based on the Google Earth Engine Platform. Remote Sens. Environ. 2018, 209, 227–239. [Google Scholar] [CrossRef]
- Li, H.X.; Xiao, P.F.; Feng, X.Z.; Yang, Y.K.; Wang, L.X.; Zhang, W.B.; Wang, X.H.; Feng, W.D.; Chang, X. Using Land Long-Term Data Records to Map Land Cover Changes in China Over 1981-2010. IEEE J. Sel. Top. Appl. Earth Obs. Remote Sens. 2017, 10, 1372–1389. [Google Scholar] [CrossRef]
- Zhou, D.C.; Luo, G.P.; Lei, L.U. Processes and trends of the land use change in Aksu watershed in the central Asia from 1960 to 2008. J. Arid Land 2010, 2, 157–166. [Google Scholar]
- Li, X.Y.; Xiao, D.N.; He, X.Y.; Chen, W.; Song, D.M. Evaluation of landscape changes and ecological degradation by GIS in arid regions: A case study of the terminal oasis of the Shiyang River, northwest China. Environ. Geol. 2007, 52, 947–956. [Google Scholar] [CrossRef]
- Zhao, Y.; Feng, D.; Yu, L.; Wang, X.; Chen, Y.; Bai, Y.; Hernández, H.J.; Galleguillos, M.; Estades, C.; Biging, G.S.; et al. Detailed dynamic land cover mapping of Chile: Accuracy improvement by integrating multi-temporal data. Remote Sens. Environ. 2016, 183, 170–185. [Google Scholar] [CrossRef]
- Aly, A.A.; Al-Omran, A.M.; Sallam, A.S.; Al-Wabel, M.I.; Al-Shayaa, M.S. Vegetation cover change detection and assessment in arid environment using multi-temporal remote sensing images and ecosystem management approach. Solid Earth 2016, 7, 713–725. [Google Scholar] [CrossRef]
- Zhang, Z.; Wang, X.; Zhao, X.; Liu, B.; Yi, L.; Zuo, L.; Wen, Q.; Liu, F.; Xu, J.; Hu, S. A 2010 update of National Land Use/Cover Database of China at 1:100000 scale using medium spatial resolution satellite images. Remote Sens. Environ. 2014, 149, 142–154. [Google Scholar] [CrossRef]
- Foody, G.M. Status of land cover classification accuracy assessment. Remote Sens. Environ. 2002, 80, 185–201. [Google Scholar] [CrossRef]
- Wang, J.; Zhou, T.; Peng, P. Phenology Response to Climatic Dynamic across China’s Grasslands from 1985 to 2010. ISPRS Int. J.Geo-Inf. 2018, 7, 290. [Google Scholar] [CrossRef]
- Comber, A.; Fisher, P.; Brunsdon, C.; Khmag, A. Spatial analysis of remote sensing image classification accuracy. Remote Sens. Environ. 2012, 127, 237–246. [Google Scholar] [CrossRef] [Green Version]
- Roy, D.P. The impact of misregistration upon composited wide field of view satellite data and implications for change detection. IEEE Trans. Geosci. Remote Sens. 2000, 38, 2017–2032. [Google Scholar] [CrossRef]
- Foody, G. Assessing the Accuracy of Remotely Sensed Data: Principles and Practices. Photogramm. Rec. 2010, 25, 204–205. [Google Scholar] [CrossRef]
- Lin, Y.; Liu, B.; Lu, Y.; Xie, F. Correlating Analysis on Spatio-temporal Variation of LUCC and Water Resources Based on Remote Sensing Data. In Proceedings of the Remote Sensing of the Environment: 18th National Symposium on Remote Sensing of China, Wuhan, China, 14 May 2014; Volume 9158. [Google Scholar]
- Liu, J.Y.; Deng, X.Z. Progress of the research methodologies on the temporal and spatial process of LUCC. Chin. Sci. Bull. 2010, 55, 1354–1362. [Google Scholar] [CrossRef]
- Gao, Z.Q.; Deng, X.Z. Analysis on Spatial Features of Lucc Based on Remote Sensing and Gis in China. Chin. Geogr. Sci. 2002, 12, 107–113. [Google Scholar] [CrossRef]
- Yi, K.; Zeng, Y.; Wu, B. Mapping and evaluation the process, pattern and potential of urban growth in China. Appl. Geogr. 2016, 71, 44–55. [Google Scholar] [CrossRef]
- Alqurashi, A.; Kumar, L.; Sinha, P. Urban Land Cover Change Modelling Using Time-Series Satellite Images: A Case Study of Urban Growth in Five Cities of Saudi Arabia. Remote Sens. 2016, 8, 838. [Google Scholar] [CrossRef]
- Kalkhan, M.A.; Reich, R.M.; Stohlgren, T.J. Technical note Assessing the accuracy of Landsat Thematic Mapper classification using double sampling. Int. J. Remote Sens. 1998, 19, 2049–2060. [Google Scholar] [CrossRef]
- Claverie, M.; Ju, J.; Masek, J.G.; Dungan, J.L.; Vermote, E.F.; Roger, J.-C.; Skakun, S.V.; Justice, C. The Harmonized Landsat and Sentinel-2 surface reflectance data set. Remote Sens. Environ. 2018, 219, 145–161. [Google Scholar] [CrossRef]
- Zhang, H.K.; Roy, D.P.; Yan, L.; Li, Z.; Huang, H.; Vermote, E.; Skakun, S.; Roger, J.-C. Characterization of Sentinel-2A and Landsat-8 top of atmosphere, surface, and nadir BRDF adjusted reflectance and NDVI differences. Remote Sens. Environ. 2018, 215, 482–494. [Google Scholar] [CrossRef]
- Pahlevan, N.; Chittimalli, S.K.; Balasubramanian, S.V.; Vellucci, V. Sentinel-2/Landsat-8 product consistency and implications for monitoring aquatic systems. Remote Sens. Environ. 2019, 220, 19–29. [Google Scholar] [CrossRef]
- Li, m.; Yongjian, D.; Jianping, Y.; Chunping, T.; Yuan, Y. The impact of runoff on oasis area, agro-output value and ecological benefits in Shule river basin. J. Desert Res. 2015, 514–520. [Google Scholar]
- Amuti, T.; Luo, G. Analysis of land cover change and its driving forces in a desert oasis landscape of Xinjiang, northwest China. Solid Earth 2014, 5, 1071–1085. [Google Scholar] [CrossRef] [Green Version]
- Zhang, Q.; Luo, G.; Li, L.; Zhang, M.; Lv, N.; Wang, X. An analysis of oasis evolution based on land use and land cover change: A case study in the Sangong River Basin on the northern slope of the Tianshan Mountains. J. Geogr. Sci. 2017, 27, 223–239. [Google Scholar] [CrossRef]
- Cheng, A.F.; Feng, Q.; Fu, G.B.; Zhang, J.K.; Li, Z.X.; Hu, M.; Wang, G. Recent Changes in Precipitation Extremes in the Heihe River basin, Northwest China. Adv. Atmos. Sci. 2015, 32, 1391–1406. [Google Scholar] [CrossRef]
- Liu, H.; Shi, P.; Tong, H.; Zhu, G.; Liu, H.; Zhang, X.; Wei, W.; Wang, X. Characteristics and driving forces of spatial expansion of oasis cities and towns in Hexi Corridor, Gansu Province, China. Chin. Geogr. Sci. 2014, 25, 250–262. [Google Scholar] [CrossRef]
- Zhou, D.; Wang, X.; Shi, M. Human Driving Forces of Oasis Expansion in Northwestern China During the Last Decade-A Case Study of the Heihe River Basin. Land Degrad. Dev. 2017, 28, 412–420. [Google Scholar] [CrossRef]
- Lin, J.Y. Rural Reforms and Agricultural Growth in China. Am. Econ. Rev. 1992, 82, 34–51. [Google Scholar]
- Xue, X.; Liao, J.; Hsing, Y.; Huang, C.; Liu, F. Policies, land use, and water resource management in an arid oasis ecosystem. Environ. Manag. 2015, 55, 1036–1051. [Google Scholar] [CrossRef] [PubMed]
Figure 1.
Locations of the main oases in the Hexi Corridor.

Figure 2.
Variation of oases area in the Hexi Corridor.

Figure 3.
Changes in oasis area every five years in the Hexi Corridor.

Figure 4.
The SDD and BDD values of oasis change in Hexi Corridor (left upper), SYRB (left lower), HHRB (right upper), and SLRB (right lower). Note: SDD describes the rate of net change, but it neglects the increasing and decreasing components. BDD incorporates both increasing and decreasing rates of change into a composite metric.

Figure 5.
The spatial ratio of change (CR) values of six periods in Hexi Corridor. Note: The CR value is the rate of oases change between adjacent years. If CR approaches 1 or –1, the oasis in the grid is characterized by expansion or shrinkage, respectively; whereas if CR is close to zero, the oasis is stable. The areas in the green and red boxes are the places where the oasis experienced dramatic change, either shrinking or expansion, respectively.

Figure 6.
The SORC values in Hexi Corridor, and magnified areas showing oasification or desertification. Note: The SORC is the cumulative sum of CR of the six time periods.
Figure 6.
The SORC values in Hexi Corridor, and magnified areas showing oasification or desertification. Note: The SORC is the cumulative sum of CR of the six time periods.

Figure 7.
The four types of evolution intensities in the Hexi Corridor. Note: The four types of oasis evolution intensities (stable, relatively stable, relatively unstable, and unstable status) were distinguished according to their SACR values.
Figure 7.
The four types of evolution intensities in the Hexi Corridor. Note: The four types of oasis evolution intensities (stable, relatively stable, relatively unstable, and unstable status) were distinguished according to their SACR values.


Table 1.
The Landsat satellite images used in this study and its thresholds for vegetation extraction.
Table 1.
The Landsat satellite images used in this study and its thresholds for vegetation extraction.
| Path/Row | 1986 | 1990 | 1995 | 2000 | 2005 | 2010 | 2014 |
|---|---|---|---|---|---|---|---|
| 131033 | 16 June 1988 | 25 June 1991 | 6 July 1995 | 19 July 2000 | 2 August 2005 | 18 July 2011 | 10 July 2014 |
| 0.29 | 0.29 | 0.27 | 0.24 | 0.28 | 0.34 | 0.34 | |
| 131034 | 16 June 1988 | 29 July 1992 | 6 July 1995 | 19 July 2000 | 5 August 2006 | 13 August 2009 | 10 July 2014 |
| 0.28 | 0.3 | 0.31 | 0.35 | 0.31 | 0.28 | 0.44 | |
| 132033 | 9 September 1987 | 16 June 1991 | 11 June 1995 | 11 August 2000 | 24 July 2005 | 4 June 2010 | 17 July 2014 |
| 0.31 | 0.4 | 0.36 | 0.32 | 0.34 | 0.38 | 0.41 | |
| 132034 | 9 September 1987 | 2 June 1992 | 11 June 1995 | 11 August 2000 | 6 June 2005 | 17 June 2009 | 17 July 2014 |
| 0.3 | 0.3 | 0.36 | 0.3 | 0.42 | 0.43 | 0.38 | |
| 133033 | 15 August 1987 | 20 June 1990 | 21 August 1995 | 18 August 2000 | 15 July 2005 | 14 August 2010 | 9 August 2014 |
| 0.3 | 0.38 | 0.33 | 0.3 | 0.33 | 0.38 | 0.38 | |
| 134032 | 18 July 1986 | 30 August 1990 | 8 July 1994 | 8 July 2000 | 22 July 2005 | 5 August 2010 | 15 July 2014 |
| 0.31 | 0.25 | 0.35 | 0.35 | 0.4 | 0.38 | 0.37 | |
| 134033 | 7 July 1987 | 20 August 1990 | 8 July 1994 | 24 July 2000 | 7 August 2005 | 5 August 2010 | 15 July 2014 |
| 0.32 | 0.25 | 0.38 | 0.38 | 0.33 | 0.36 | 0.38 | |
| 135032 | 25 July 1986 | 21 August 1990 | 19 August 1995 | 19 August 2000 | 13 July 2007 | 9 June 2010 | 20 June 2014 |
| 0.27 | 0.28 | 0.25 | 0.25 | 0.33 | 0.3 | 0.38 | |
| 136032 | 30 June 1986 | 16 September 1991 | 23 August 1994 | 20 June 2000 | 5 August 2005 | 16 June 2010 | 13 July 2014 |
| 0.3 | 0.26 | 0.3 | 0.25 | 0.33 | 0.3 | 0.38 | |
| 137032 | 23 July 1986 | 19 August 1990 | 17 August 1995 | 13 Juy 2000 | 9 June 2005 | 25 July 2010 | 2 August 2014 |
| 0.24 | 0.28 | 0.3 | 0.35 | 0.35 | 0.28 | 0.26 | |
| 138032 | 19 September 1987 | 14 September 1991 | 20 July 1994 | 17 May 2000 | 22 August 2006 | 14 June 2010 | 27 July 2014 |
| 0.32 | 0.32 | 0.34 | 0.35 | 0.35 | 0.35 | 0.26 |
Note: the upper number for each image is the acquired date, and the lower one is the threshold for vegetation extraction.
Table 2.
Specific classification criteria of oasis evolution intensity and patterns.
| Intensity | Value | Evolution | Value | Patterns |
|---|---|---|---|---|
| Stable | SACR = 0 | Stable | SOCR = 0 and SACR = 0 | Stable |
| Relatively stable | 0 < SACR ≤ 0.5 | Changed | −1 ≤ SACR < 0 | Shrinking |
| Relatively Unstable | 0.5 < SACR ≤ 1 | SORC = 0 | Oscillating | |
| Highly unstable | 1 < SACR | 0 < SACR ≤ 1 | Expansive |
Table 3.
Accuracy assessment of oases classes and desert (Note: PA: producer accuracy; UA: user accuracy OA: overall accuracy).
Table 3.
Accuracy assessment of oases classes and desert (Note: PA: producer accuracy; UA: user accuracy OA: overall accuracy).
| Class | Year | 1986 | 1990 | 1995 | 2000 | 2005 | 2010 | 2014 |
|---|---|---|---|---|---|---|---|---|
| Vegetation | PA | 0.84 | 0.81 | 0.84 | 0.8 | 0.82 | 0.82 | 0.9 |
| UA | 0.88 | 0.81 | 0.89 | 0.86 | 0.87 | 0.81 | 0.9 | |
| waterbody | PA | 0.92 | 0.94 | 0.94 | 0.93 | 91 | 0.97 | 0.98 |
| UA | 0.96 | 0.97 | 0.96 | 1 | 0.95 | 0.97 | 1 | |
| RAIM | PA | 0.96 | 0.83 | 0.84 | 0.86 | 0.82 | 0.85 | 0.86 |
| UA | 0.89 | 0.8 | 0.85 | 0.91 | 0.88 | 0.84 | 0.93 | |
| Desert | PA | 0.94 | 0.89 | 0.9 | 0.88 | 0.86 | 0.79 | 0.9 |
| UA | 0.93 | 0.8 | 0.77 | 0.76 | 0.7 | 0.81 | 0.82 | |
| All types | OA | 0.91 | 0.84 | 0.85 | 0.86 | 0.84 | 0.84 | 0.9 |
| All types | kappa | 0.89 | 0.8 | 0.8 | 0.81 | 0.79 | 0.8 | 0.88 |
© 2018 by the authors. Licensee MDPI, Basel, Switzerland. This article is an open access article distributed under the terms and conditions of the Creative Commons Attribution (CC BY) license (http://creativecommons.org/licenses/by/4.0/).
Share and Cite
MDPI and ACS Style
Xie, Y.; Bie, Q.; Lu, H.; He, L. Spatio-Temporal Changes of Oases in the Hexi Corridor over the Past 30 Years. Sustainability 2018, 10, 4489. https://doi.org/10.3390/su10124489
AMA Style
Xie Y, Bie Q, Lu H, He L. Spatio-Temporal Changes of Oases in the Hexi Corridor over the Past 30 Years. Sustainability. 2018; 10(12):4489. https://doi.org/10.3390/su10124489
Chicago/Turabian StyleXie, Yaowen, Qiang Bie, Hui Lu, and Lei He. 2018. "Spatio-Temporal Changes of Oases in the Hexi Corridor over the Past 30 Years" Sustainability 10, no. 12: 4489. https://doi.org/10.3390/su10124489
Note that from the first issue of 2016, this journal uses article numbers instead of page numbers. See further details here.