Article

Biohydrogen Production from Food Waste: Influence of the Inoculum-To-Substrate Ratio

1
Department of Civil and Environmental Engineering and Architecture, University of Cagliari, P.za D’Armi 1, 09123 Cagliari, Italy
2
Department of Civil and Environmental Engineering, University of Rome “La Sapienza”, Via Eudossiana 18, 00184 Roma, Italy
*
Author to whom correspondence should be addressed.
Sustainability 2018, 10(12), 4506; https://doi.org/10.3390/su10124506
Submission received: 7 November 2018 / Revised: 27 November 2018 / Accepted: 28 November 2018 / Published: 29 November 2018
(This article belongs to the Section Environmental Sustainability and Applications)

Abstract

:
In this study, the influence of the inoculum-to-substrate ratio (ISR) on dark fermentative hydrogen production from food waste (FW) was evaluated. ISR values ranging from 0.05 to 0.25 g VSinoculum/g VSsubstrate were investigated by performing batch tests at T = 39 °C and pH = 6.5, the latter being the optimal value identified based on a previous study. The ISR was found to affect the fermentation process, clearly showing that an adequate ISR is essential in order to optimise the process kinetics and the H2 yield. An ISR of 0.14 proved to optimum, leading to a maximum H2 yield of 88.8 L H2/kg VSFW and a maximum production rate of 10.8 L H2/kg VSFW∙h. The analysis of the fermentation products indicated that the observed highest H2 production mostly derived from the typical acetate/butyrate-type fermentation.

1. Introduction

The sustainable production of hydrogen gas (H2) has been deemed to contribute significantly to meeting the environmental standards aimed to reduce global greenhouse gas emissions, as well as to reduce the consumption of natural resources. To this aim, using renewable sources and green processes will foster the environmental benefits of replacing conventional fossil fuels with H2. In this respect, biological processes using residual substrates as the feedstock for H2 production are believed to have the potential to play a significant role in the near future. Among these, a promising option is represented by dark fermentation (DF), which is the conversion of a biodegradable substrate mainly into volatile fatty acids (VFAs), alcohols, carbon dioxide, and hydrogen under anaerobic conditions and without the presence of light. The required technology is already well known and available on a full scale [1,2,3]. However, H2 recovery through DF of organic substrates is not yet considered reliable nor commercially attractive due to some important unresolved issues, including, among others, process instability, low H2 yields, and low gas purity, as well as competitive biochemical pathways [4], whilst the full-scale implementation of the process would require significant and stable generation yields.
The wide range of variation in H2 production documented in the literature on fermentative H2 generation from complex substrates may be explained considering the process sensitivity to numerous interrelated physical, chemical, and biological factors. They include, for example, substrate composition and the presence of co-substrates, the type of inoculum and applied pre-treatment, reactor type, mode of reactor operation (batch, semi-continuous, or continuous), and operating variables such as temperature, hydraulic retention time (HRT), inoculum-to-substrate ratio (ISR), organic loading rate (OLR), and pH. These are all known to strongly affect the fermentative pathways, the H2 generation yield, and the start-up phase [5,6]. Predicting the influence of each of them is a main challenge, in particular when complex substrates (for which the metabolic reactions are not fully known in advance) are concerned.
To better understand the influence of such factors, recent studies on fermentative H2 production from food waste (FW) have explored a broad range of different operating conditions, but further efforts are still required to get a comprehensive systematic interpretation of the different processes occurring during DF and to identify the most appropriate strategies for their optimisation in order to overcome the scientific and technological bottlenecks that nowadays still limit the full-scale development and implementation of fermentative H2 production.
In this framework, few studies are available on the effect of the addition of an inoculum, expressed as the inoculum-to-substrate ratio (ISR) or as its inverse (referred to as the food-to microorganisms (F/M) ratio), on dark fermentation. Inadequate substrate availability may cause anabolic and catabolic reactions to be unbalanced with an associated energy spilling [7], thereby influencing substrate conversion into metabolites [8,9,10,11,12,13,14]; on the other hand, at high values of the ISR, most of the carbon source could be exploited for biomass production, affecting the hydrogen yield [15] and resulting in excessive sludge production [7].
Several authors have stated that, theoretically, the biogas yield should be independent of the ISR, which should affect the metabolic and kinetic issues [14,16,17]; however, some experimental data seem to suggest that the adopted ISR may influence the extent of the specific biogas production as well. Boulanger et al. [18] studied the effects of the ISR on batch anaerobic digestion (AD) of municipal solid waste using anaerobic sludge as the inoculum. The results indicated that the maximum rate of fermentation, expressed by the dissolved organic carbon (DOC) accumulation, was reached at ISR = 0.12 g VSinoculum/g VSsubstrate, whilst the hydrolysis process was limited by the lack of active biomass when lower ISR values were adopted. Chen et al. [14] evaluated the effect of the ISR on the H2 production yield from FW in batch reactors inoculated with anaerobic digested sludge, without pH control; a maximum H2 yield of 56.5 mL/g VS, attained under mesophilic conditions and by adopting an optimal ISR of 0.23 g VSinoculum/g VSsubstrate, was reported. The same H2 yield was observed by Pan et al. [19] at a lower optimal ISR (0.14 g VSinoculum/g VSsubstrate), under batch thermophilic conditions and using an anaerobic sludge collected from a pilot-scale reactor, while using anaerobic sludge collected from a treatment plant and mesophilic temperature required a slightly higher ISR (0.17 g VSinoculum/g VSsubstrate) to achieve a maximum H2 yield of 39 mL/g VS. Nathao et al. [13] compared hydrogen production from FW at different F/M ratios, observing the highest yield of 55 mL H2/g VS for F/M = 7.5 (ISR ≈ 0.13 g VSinoculum/g VSsubstrate). Ghimire et al. [10] optimised the operating parameters in thermophilic batch DF tests on FW performed using heat shock-treated (HST) thermophilic anaerobic digested sludge as the inoculum; in particular, F/M ratios of 0.5, 1, and 1.5 (corresponding to an ISR of 2, 1, and 0.67 g VSinoculum/g VSsubstrate, respectively) were investigated, and a maximum H2 yield of 60.6 mL/g VS was observed at ISR = 2 g VSinoculum/g VSsubstrate.
The abovementioned studies suggest that the efficiency of biological H2 production may also be affected by the adopted ISR value. On the other hand, the scarcely available experimental data and the sometimes contradictory results attained show that the effect of the ISR on both the evolution of the fermentative metabolic pathways and the H2 production yield has been overlooked thus far in the literature. Therefore, systematic investigation is required, in particular where complex substrates are concerned; the optimal balance between the biomass and substrate availability should be specifically assessed according to the substrate composition, type of inoculum, and process conditions (i.e., temperature, pH, etc.).
Optimising the ISR and studying its effects on H2 production is accomplished through batch experiments and is believed to provide useful information in view of process scale-up, helping to predict the production potential of the investigated substrate and the amount of biomass to be maintained in full-scale systems, as well as the start-up protocol of continuous fermentation reactors [10,13,14,19]. In this respect, it is worth outlining how the correct evaluation of the biochemical hydrogen potential (BHP) from different residues will assume paramount importance, especially for complex substrates such as FW. The results of some studies have shown how the variability of the composition of the substrate is reflected on the BHP even more than is the case for the biochemical methane potential (BMP) [20].
With the present study, an attempt was made to fill in some of the current gaps in the knowledge of the effect of the ISR on batch fermentative H2 production from FW under mesophilic conditions, downstream of optimisation of the operating pH. The research was conducted in the framework of the activities of the “Waste Biorefinery” Task Group, which is part of the International Waste Working Group (IWWG).

2. Materials and Methods

2.1. Substrate and Inoculum

Due to the recognised heterogeneity of FW, a standardised substrate was used in the present study to allow repeatable and directly comparable experiments. The waste samples were prepared to represent the typical composition of Italian FW by mixing (on a wet weight basis) a combination of 10% meat, 65% fruit and vegetables, 10% bread, and 15% cooked pasta. Due to their tendency of rapid degradation, the FW samples were purposely prepared for each experiment by mixing the individual components and shredding the obtained mixture with a blender (RETSCH Knife Mill Grindomix GM200) to a final particle size of below 2 cm. This particle size range was adopted in order to be compatible with the pumping and mixing systems of the bench-scale reactor.
Activated sludge (AS) from the aerobic unit of a municipal wastewater treatment plant was used as the inoculum without performing any specific treatment to inhibit methanogens.
The main characteristics of FW, AS, and the resulting mixtures fed to the fermentation reactor were analysed before each experiment and are shown in Table 1.

2.2. Experimental Set-Up

Triplicate DF tests were conducted in a batch mode at 39 ± 1 °C, using a 5-L glass reactor (DIAFERM-Diachrom SA; Dia-Net software; 4.5 L working volume) equipped with mechanical stirring (150 rpm) and automatic pH control through the addition of NaOH. As suggested by previous results [21], an operating set-point pH of 6.5 was adopted as the optimal value in order to maximise the fermentative H2 production from the investigated substrate.
Gas production was measured using the volume displacement principle. The measured gas volume was converted to standard temperature and pressure conditions (T = 273.15 K, p = 105 Pa). The reactor was covered with black plastic film to prevent photofermentative reactions and initially flushed with N2 gas to drive off air from the headspace.
The tests were performed by varying the ISR, expressed as the ratio between the volatile solid contents of the inoculum and FW (gVSAS/gVSFW). Moreover, 4 different ISR values, ranging from 0.05 to 0.25 gVSAS/gVSFW were investigated, as shown in Table 1, corresponding to a FW/AS spanning from 15%:85% to 45%:55% on a wet weight basis. The concentration of FW in the reactors ranged from 26 to 82 gVSFW/L.

2.3. Analytical Methods

The total solids (TS) and volatile solids (VS) contents were measured according to the Standard Methods for the Examination of Water and Wastewater [22]. The total organic carbon (TOC) concentration and its dissolved (on 0.45-µm filtered samples) fraction (DOC) were measured using a Shimadzu TOC analyser equipped with modules for the analysis of both liquid and solid samples (TOC-VCSN and SSM-5000 module, Shimadzu, Kyoto, Japan). The total nitrogen (TN) content was measured with a CHN analyser (model CHN-1000, LECO, St. Joseph, MI, USA) at a combustion temperature of 950 °C. Soluble carbohydrates (sCarb, on 0.45-µm filtered samples) were analysed using the colorimetric phenol-sulphuric acid method, using glucose as the standard [23].
The concentrations of VFAs (acetic [HAc], propionic [HPr], butyric + iso-butyric [HBu], valeric + iso-valeric [HVa], hexanoic + iso-hexanoic [HHEx], heptanoic [HHep]) and ethanol (EtOH) were determined using a gas chromatograph with flame-ionisation detection (Model 7890B, Agilent Technology, Lake Forest, CA, USA), equipped with an HP-FFAP capillary column (30 m, inner diameter 0.53 mm, Agilent Technology). The samples were filtered using a 0.45-µm cellulose acetate filter and then acidified with concentrated H3PO4 (pH < 3); the injection volume was 0.6 µL, and the temperatures of the injector and the detector were 250 and 300 °C, respectively. The oven temperature was initially set to 60 °C (3-min holding time), followed by a ramp up of 20 °C/min up to 160 °C (3-min holding time). He (1.6 mL/min, split ratio 20:1) was used as the carrier gas.
The gas was sampled periodically from the reactor with a 1-mL gastight syringe and injected through a valve in a gas chromatograph (Model 7890B, Agilent Technology) equipped with a thermal conductivity detector and two stainless columns packed with HayeSep N (80/100 mesh) and Shincarbon ST (50/80 mesh) connected in series. The operating temperatures of the valve and the TCD were 90 and 200 °C, respectively, and He was the carrier gas at a constant pressure of 8 psi in the HayeSep N column and 25 psi in the Shincarbon ST column (at 70 °C). The oven temperature was set initially to 70 °C (3-min holding time), followed by a ramp up in 10 °C/min increments up to 160 °C (3-min holding time).
All the analyses were conducted in triplicate, and the results are presented as average values of the replicates with the associated standard deviation.

2.4. Calculations

The acidification yield (%) was calculated as a function of time as expressed by Equation (1) [24]:
acidification   yield   ( % )   =   100 VFAs / DOC
where VFAs is the total net concentration (the difference between the final and the initial contents) of the measured VFAs (see Section 2.3) at different times, expressed as g C/L.
The specific hydrogen production (SHP) was calculated per unit of initial mass of volatile solids (VS) from the FW added to the reactor (L H2/kg VSFW).
In order to derive information about the metabolic pathways taking place during the fermentation process, the theoretical H2 production (THEOH2) was derived from stoichiometric considerations and calculated assuming a generation of 2 mol H2/mol acetate and butyrate produced and a consumption of 1 mol H2/mol propionate produced [3,25,26]. The theoretical yield was then compared with the observed H2 production (OBSH2).
The conversion efficiency of the FW into H2, expressed as mol H2/mol hexose, was calculated from the initial TOC concentration of the feed mixtures, which was converted into hexose equivalents, assuming that organic carbon was solely present in the form of six-C-atoms monosaccharides.
In order to infer the fate of the organic matter during the process, the percent fraction of DOC accounted for in the analytical determinations was calculated as the sum of the analysed metabolites (VFAs and EtOH) and the residual soluble carbohydrates (sCarb) divided by the DOC concentration at the end of the fermentation tests (see Equation (2)):
accounted   DOC   ( % )   =   100 ( VFAs + EtOH + sCarb ) / DOC

2.5. Kinetic Model

A modified Gompertz equation was used to analyse and describe the kinetics of H2 production, according to Equation (3) [27,28]:
SHP ( t )   =   SHP max   exp { exp [ R max · e SHP max ( λ t ) + 1 ] }
where SHPmax is the maximum SHP (L H2/kg VSFW), Rmax is the maximum H2 production rate (L H2/kg VSFW∙h), λ is the lag phase duration (h), and “e” is the Neperian number. The time required to attain 95% of the maximum H2 yield, namely t95, was derived from the Gompertz equation as follows (Equation (4)):
t 95   =   SHP max R max · e ( 1 ln ( ln 0.95 ) ) + λ
The experimental data were fitted with the Gompertz equation and SHPmax, Rmax, λ and t95 were estimated using TableCurve 2D (v. 5.01, Systat Software Inc., Richmond, CA, USA) software. The coefficient of determination R2 was calculated to evaluate the quality of data fitting for each experimental dataset.

2.6. Statistical Analysis

A one-way analysis of variance test (ANOVA-software Statgraphics Centurion XVI, version 16.1.02, Statgraphics Technologies, Inc., The Plains, VA, USA) at a 95% confidence level (p < 0.05) was used to analyse the statistical significance of the results in terms of H2 yield.

3. Results

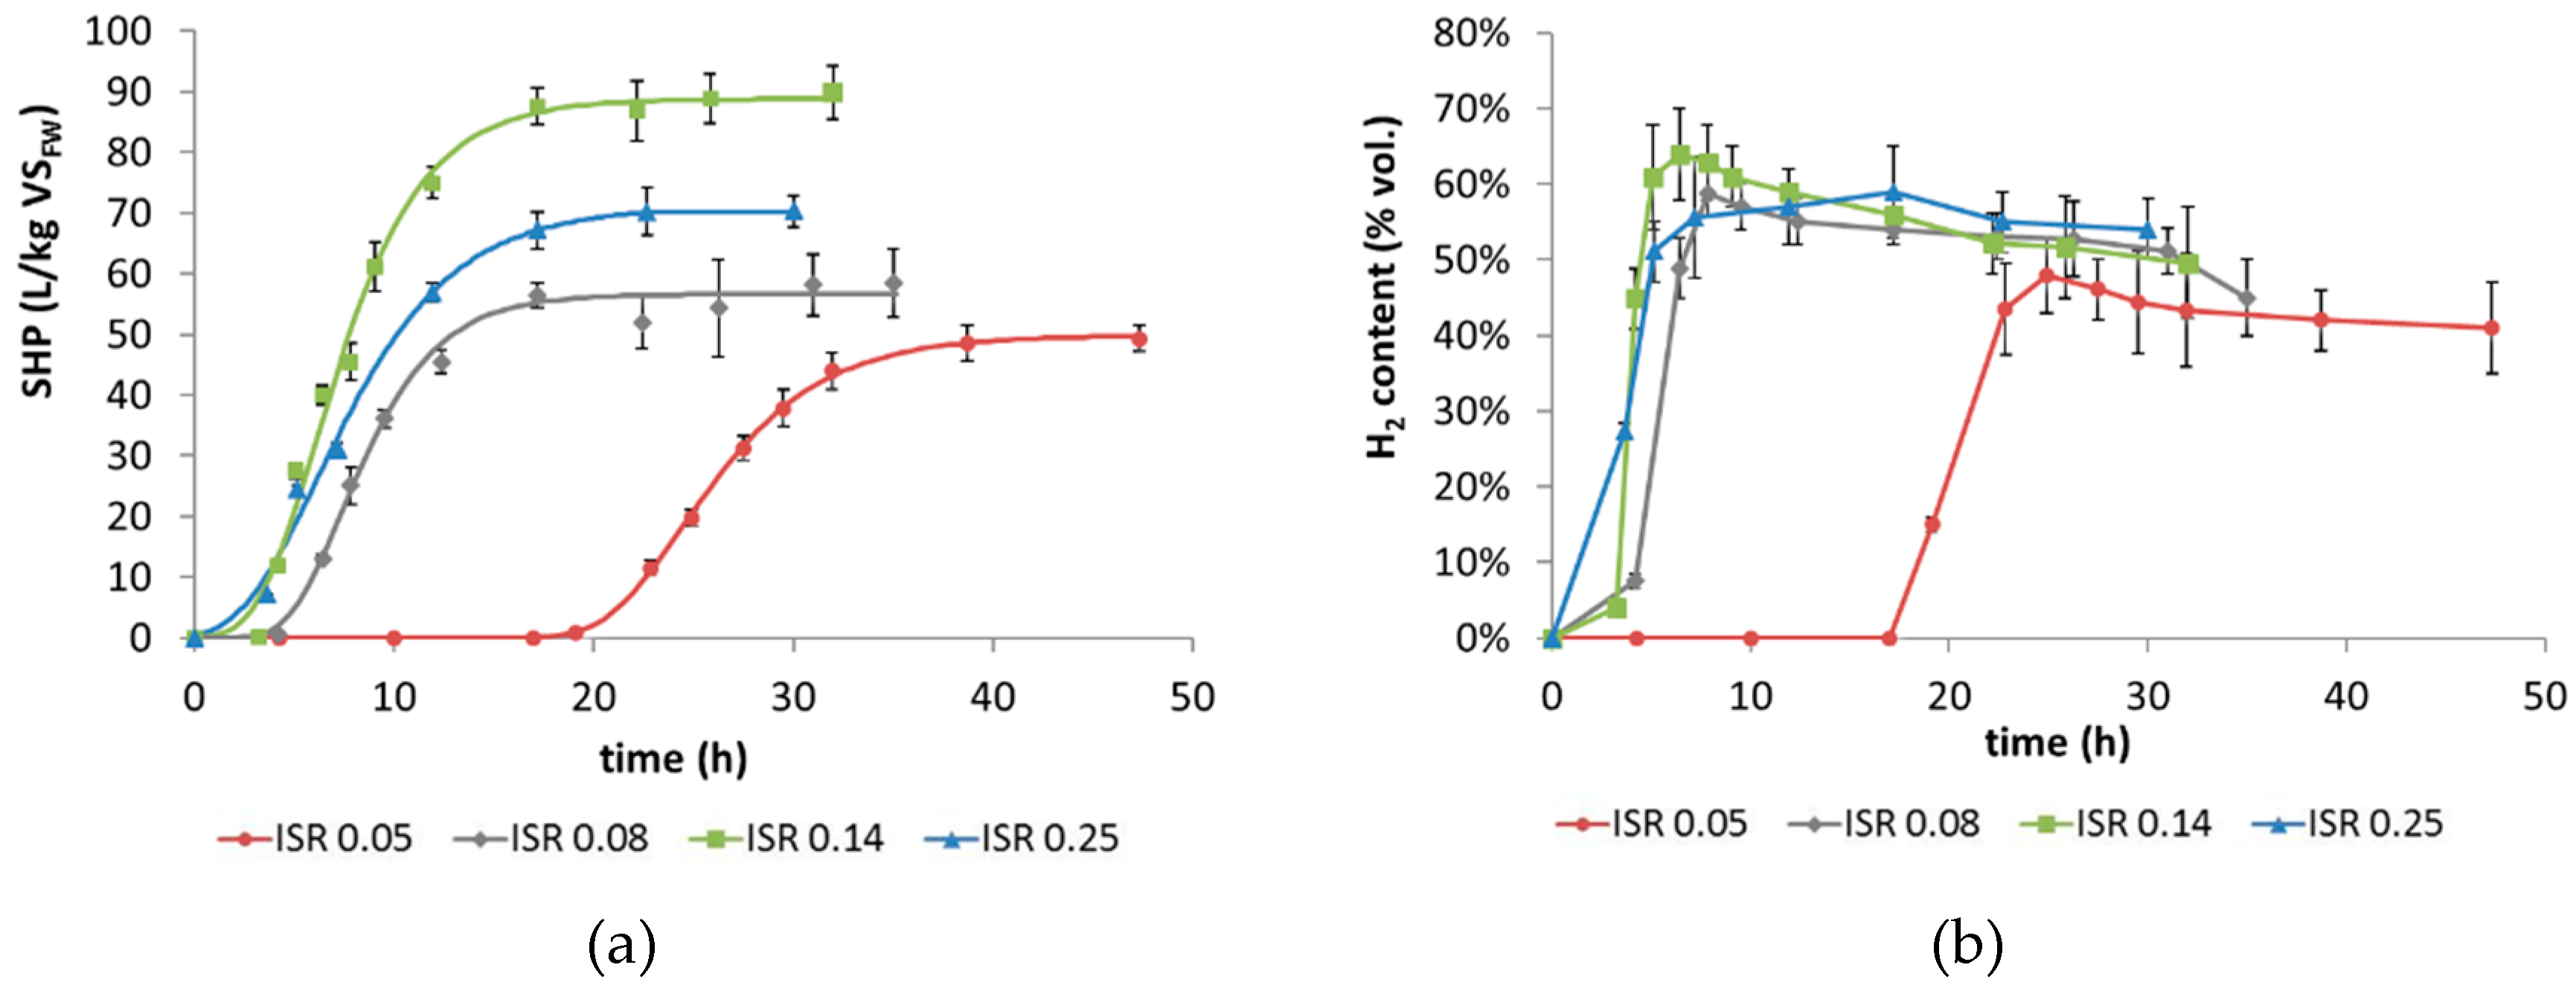
3.1. Hydrogen Production

Figure 1 shows the specific cumulative H2 production curve (a) and the evolution over time of the H2 content in the gas (b) produced during the batch fermentation tests at the different ISR values investigated in this study.
In general, increasing the ISR led to higher values of the SHP; for ISR = 0.14, the SHP (89.8 ± 4.4 L H2/kg VSFW) was almost twice as high as for ISR = 0.05 (49.3 ± 2.1 L H2/kg VSFW). However, a further increase in the ISR from 0.14 to 0.25 reduced the H2 yield by 22% (70.3 ± 3.8 L H2/kg VSFW). The effect of the adopted ISR on the SHP was found to be statistically significant (p < 0.05) and the abovementioned findings show that the ISR is an important factor influencing the H2 yield.
On the other hand, as shown in Figure 1b, the ISR exerted a less notable effect on the H2 content of the produced gas. For ISR = 0.14, the H2 content peaked at 64 vol.% during the first 6.4 h; a H2 maximum content of 59 vol.% was observed within the first 7.8 h by decreasing the ISR to 0.08 and for the highest ISR (0.25), though at later times (17.2 h). The lowest ISR (0.05) yielded the lowest peak in the H2 content (48 vol.%) and the longest time to achieve it (24.9 h). The decrease in the H2 content observed for all the tests at the later stages of the process was believed to be associated with biological consumption. In this regard, the fact that methane was never detected during the tests may imply that the H2 consumption was caused by the onset of either propionic fermentation [29] or homoacetogenesis [30,31].
The main experimental conditions adopted and the maximum SHP obtained in the present study are summarised in Table 2 and compared with the previous literature on FW. It is noted that the direct comparison of the results from the different sources is often complicated by the wide variety of operating conditions, the individual parameter(s) selected for optimisation, the type of inoculum and its possible pre-treatment, the variability in the substrate composition and characteristics [32], and other issues.
The data reported in Table 2 suggest that the SHP value attained in the present study for the optimal ISR (0.14) was rather remarkable, on account of the fact that neither a dedicated biomass addition nor specific pre-treatment of the substrate were performed. In fact, the measured SHP was higher compared with other studies that adopted the same ISR and, in some cases, presumably more favourable conditions (i.e., thermophilic temperatures or HST inoculum [13,19]). This can be explained by the fact that in the present study, the identification of the optimal ISR was preceded by a substrate-specific optimisation of the operating pH. Conversely, in the study performed by Nathao et al. [13], the good quality of the synthetic FW used as the substrate, with 65% carbohydrate content, as well as the HST of the inoculum, may have been offset by the absence of pH control. As observed by Pan et al. [19], who found a pH decrease of 1.5 units at the end of a thermophilic fermentation test at an ISR of 0.14 (with a final pH = 4.8), the accumulation of VFAs resulting from the fermentation process may lead to a pH drop in the system if no pH control is performed. This may in turn negatively affect the biochemical activity of the biomass and lead to a decrease in the process yield.

3.2. Hydrogen Production Kinetics

The effects of the ISR on the process kinetics are well described by the values estimated using the modified Gompertz function (Equation (3)), which fitted the experimental data with an R2 > 0.99. The calculated kinetic parameters are shown in Table 3.
The best process performance was estimated for an ISR of 0.14: SHPmax = 88.8 L H2/kg VSFW, Rmax = 10.8 L H2/kg VSFW∙h, and t95 = 11.1 h. It is interesting to note that the optimal ISR condition in terms of SHP also corresponded to faster process kinetics, with a higher hydrogen production rate and a decreased value of t95, while the lag-phase duration was comparable to that observed at ISR = 0.25. A reduction in the inoculum addition to ISR = 0.05 adversely affected the process kinetics, increasing t95 and λ by 2.6 and 4.4 times, respectively, compared with the test at ISR = 0.08. In general, DF is a two-stage process, consisting of hydrolysis and acid/alcoholic fermentation; hydrolysis is a surface process requiring contact between the bioactive agents (either hydrolytic microorganisms or enzymes) and the substrate surface. The kinetics of fermentative H2 production are thus also affected by the extent and evolution over time of the hydrolysis. A low biomass availability with respect to the optimal ISR (i.e., during the tests performed at ISR = 0.05 and 0.08) could have limited the hydrolysis and entailed significant effects in terms of both yield and kinetics, as observed also by Boulanger et al. [18] and confirmed by a similar study performed on a different substrate [33]. Equally negative effects could be ascribed to the presence of the biomass in excess (ISR = 0.25) with respect to the optimal ISR value, because these conditions either affect first-order kinetics or address substrate consumption to bacterial growth and maintenance.

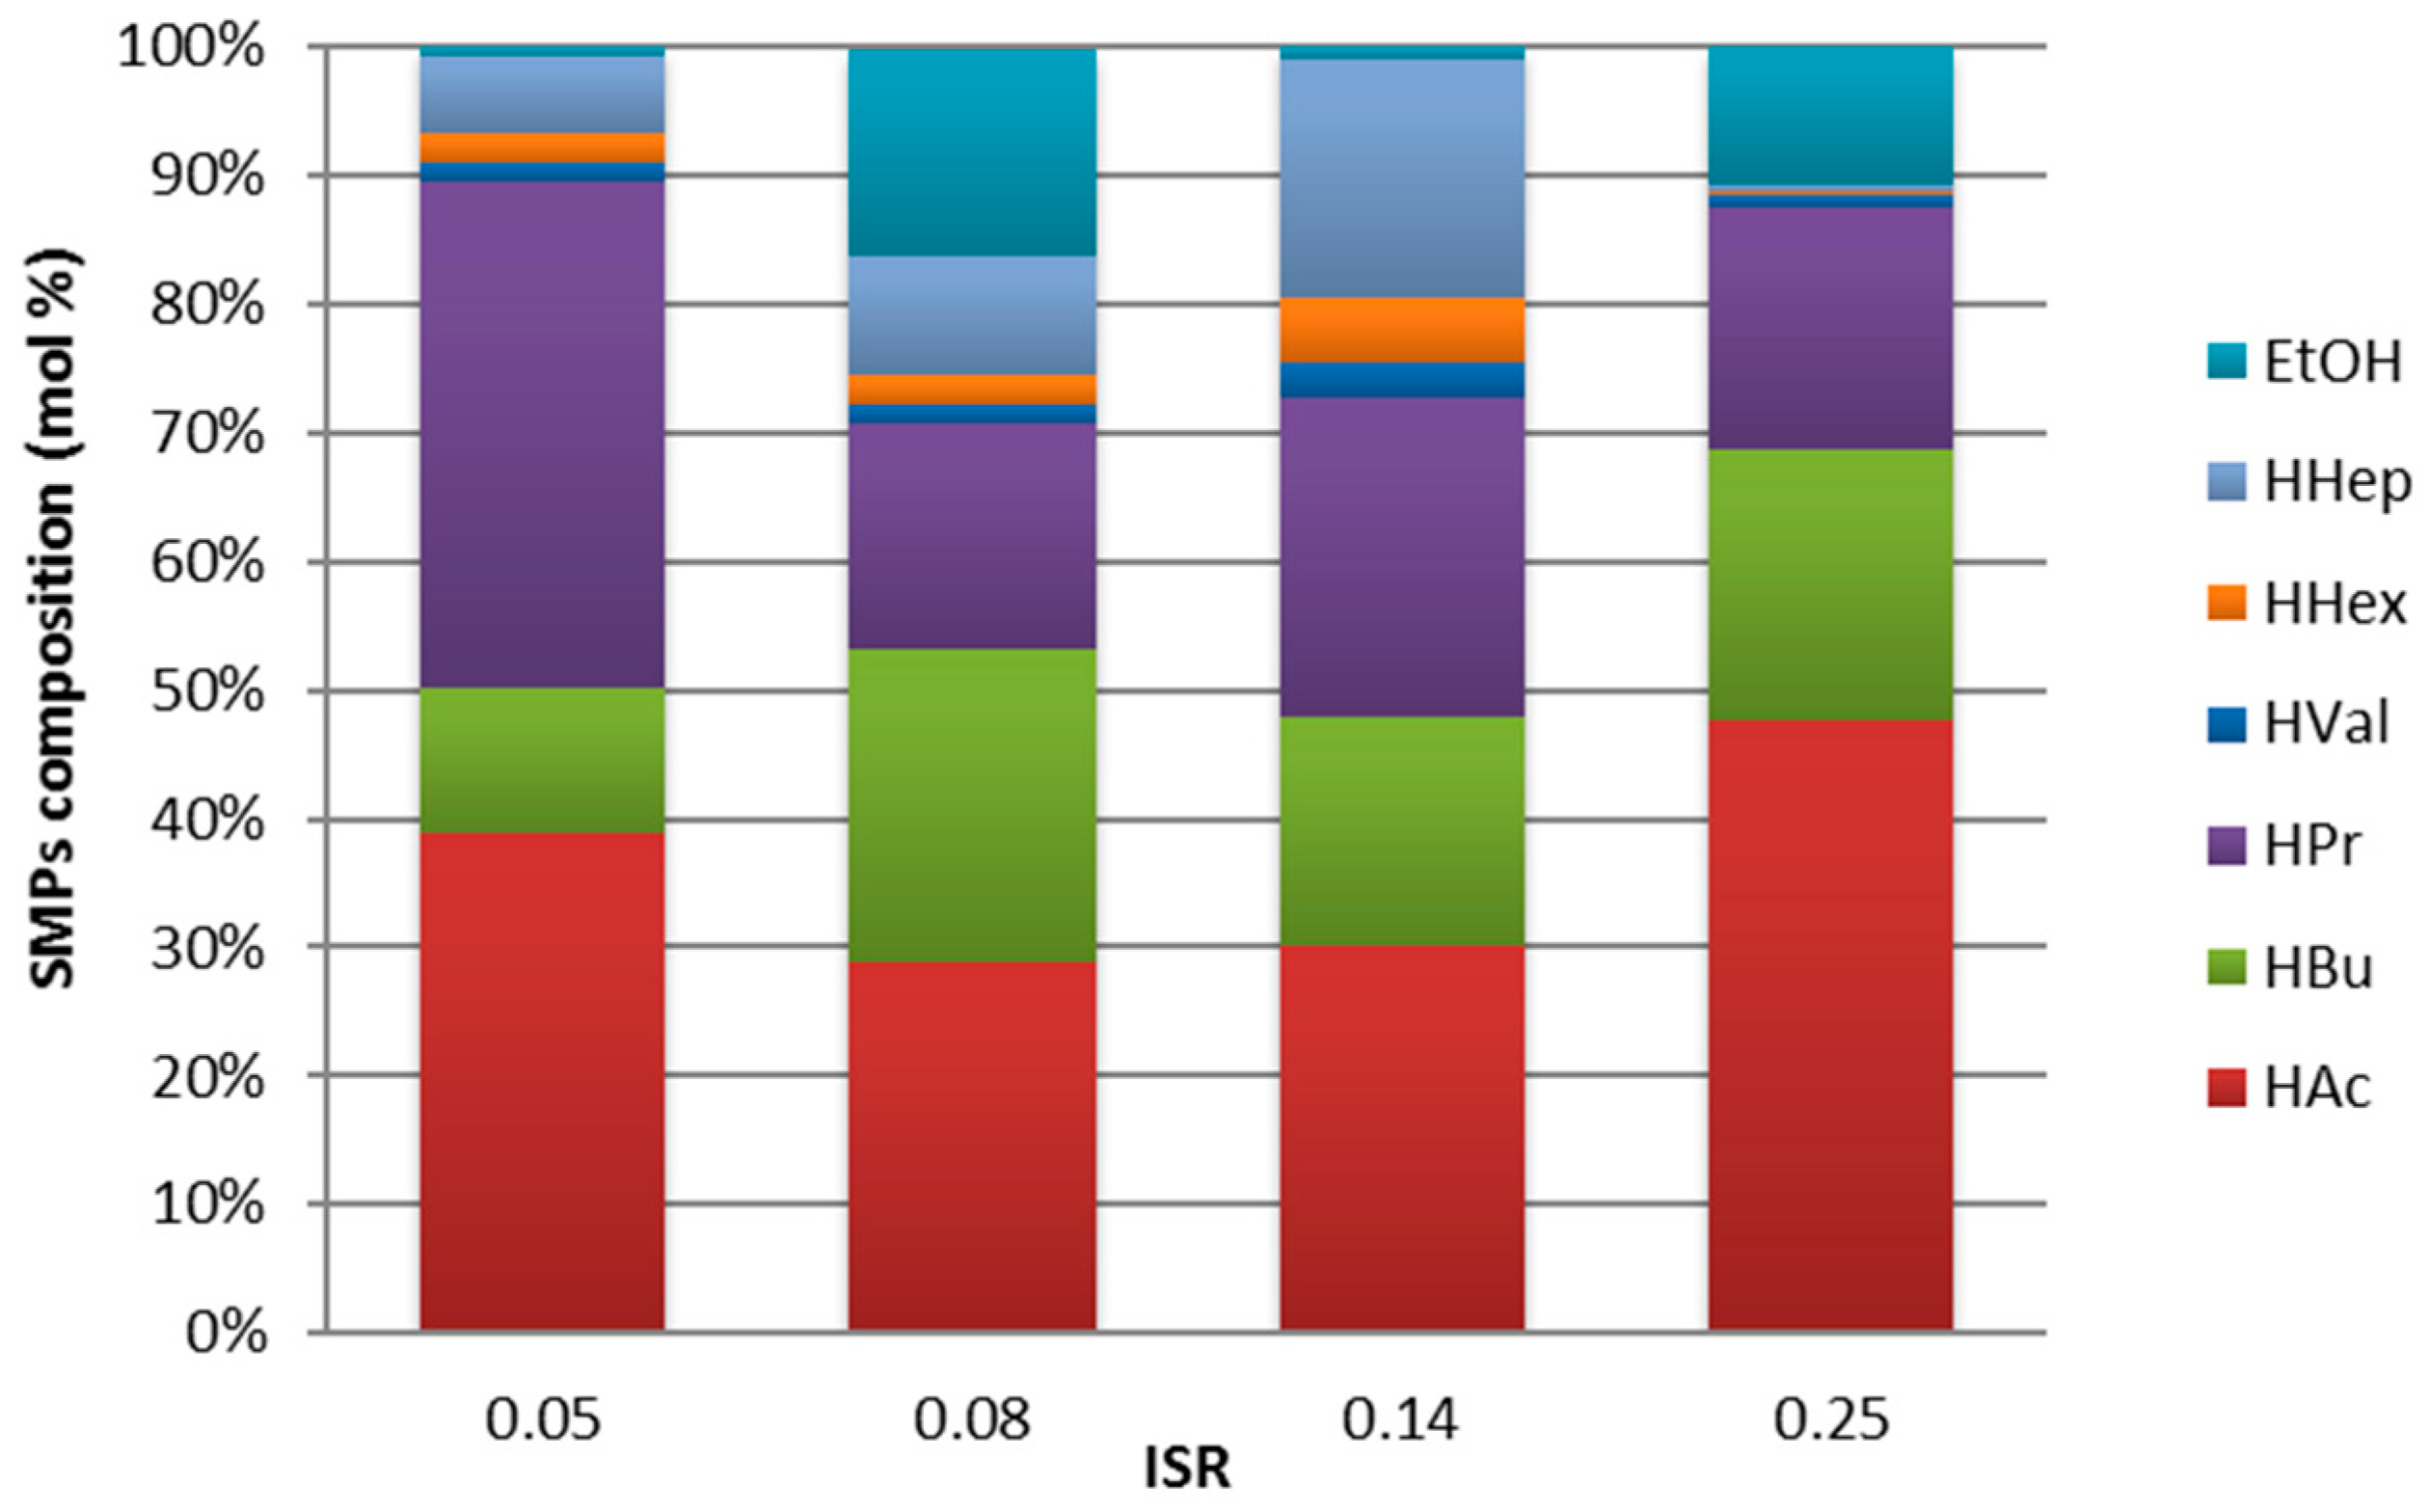
3.3. Fermentation Products and Substrate Conversion

The onset of the fermentation pathways and, in turn, the presence and relative proportions of soluble metabolic products (SMPs) are functions of the specific substrate under concern and the operating conditions. Therefore, monitoring the SMPs provides useful information on the process evolution and can be helpful to explain the observed H2 generation yields.
Clostridial fermentation is the most favourable fermentation process for producing bio-hydrogen under mesophilic conditions: spore-forming bacteria of the Clostridium genus convert the substrate into acetic acid, butyric acid, H2, and CO2 during the acidogenic stage, which usually occurs during the bacterial exponential growth phase.
Equations (5) and (6) summarise the stoichiometric relationships between the fermentable sugars (glucose) generated from carbohydrates by hydrolytic bacteria and the fermentation products generated by H2-producing acidogens.
C 6 H 12 O 6 + 2   H 2 O   4   H 2 + 2   CO 2 + 2   CH 3 COOH .
C 6 H 12 O 6 2   H 2 + 2   CO 2 + CH 3 CH 2 CH 2 COOH .
The substrate characteristics and operating conditions can also give rise to H2-consuming fermentation pathways, such as propionic acid fermentation (Equation (7)) and homoacetogenesis (Equation (8)).
C 6 H 12 O 6 + 2   H 2 2   CH 3 CH 2 COOH + 2   H 2 O .
4   H 2 + 2   CO 2   CH 3 COOH + 2   H 2 O .
Table 4 shows the concentrations of the main metabolic products at the end of the fermentation tests, expressed per unit of initial mass of volatile solids (VS) from the FW added, while the molar fraction of total SMPs is reported in Figure 2. The results highlight that the process was governed by several fermentation pathways, whose single contribution is not easy to outline. In general, the presence of acetate, butyrate, and propionate was always significant, whilst the optimal ISR value (0.14) yielded a significantly higher hexanoic, heptanoic, and valeric acid production; ethanol was detected at different levels depending on the adopted ISR value. As reported by Akhlaghi et al. [33], providing a univocal interpretation of all the mechanisms involved is a challenging task.
According to Equations (5) and (6), which represent the most favourable fermentation pathways, a higher generation of acetic and butyric acids would be expected to lead to higher H2 production yields. This, however, was not the case in the present study; in fact, as shown in Table 4, based on the analytical results, the highest acetate production was associated with the tests performed at the ISR values of 0.05 (38.8 mol.% of the total SMPs, see Figure 2) and, more appreciably, 0.25 (47.6 mol.% of the total SMPs, see Figure 2) and not with ISR = 0.14 which, as previously underlined, led to the maximum H2 yield. This could be explained considering that the fermentation process is governed by several competing metabolic pathways, which may reduce the H2 production yield, as mentioned above. Similarly, the highest butyrate production was associated with the tests performed at ISR = 0.08 and 0.25. In addition, the optimal value of the ISR was not characterised by the lowest propionic acid production. Nevertheless, it is worth underlining that the highest final concentration of propionic acid observed at ISR = 0.05 was, according to Equation (7), consistent with the lowest H2 production attained; some propionate-producing bacteria, precisely those which consumed H2 as an electron donor (i.e., Clostridium propionicum), may have dominated during stress conditions possibly caused by the relatively high organic load [31].
As a matter of fact, neither H2 consumption nor H2 production deriving exclusively from, respectively, propionic fermentation and butyric and acetic acid production via Clostridial fermentation can exhaustively explain the H2 yields obtained at the different values of the ISR.
Therefore, given the difficulty explaining the multiple concomitant metabolic pathways occurring in a fermentation system, a further effort to recognise the role of the prevailing metabolic pathways was made by comparing the theoretical SHP (calculated by considering the Clostridial and propionic fermentation as the only ongoing reactions), with the OBSH2 production yield. A good agreement (OBSH2/THEOH2 = 94%) was obtained at ISR = 0.14 only, suggesting that under optimised ISR conditions, H2 production should be largely ascribed to the net effect of the Clostridial acetic/butyric fermentation and the propionic one, whilst only a minor role should be played by homoacetogenesis (according to Equation (8)) or other H2-consuming pathways. Conversely, for the other ISR values, OBSH2 turned out to be only 37–56% of THEOH2, indicating that additional metabolic pathways played some significant role during the fermentation process, and part of the degraded substrate was in fact utilised by non-hydrogenogenic pathways having several metabolites in common with clostridial fermentation. Indeed, this is to be expected when mixed cultures are used in the perspective of a process, which must be feasible, practical, and economical on a large scale. Under these conditions, a wide variety of H2-consuming bacteria other than the propionate producers may be active during the process, including homoacetogens, hydrogenotrophic methanogens, sulphate- and nitrate-reducing bacteria, and valerate- and caproate-producing bacteria [31,34]. Moreover, even alcohol-producing bacteria may consume reducing equivalents during mixed-culture dark fermentation [35].
The lowest OBSH2/THEOH2 = 37% was associated with the test performed at ISR = 0.25, despite the fact that, as mentioned before, the highest acetate generation yield was observed. The limited substrate availability could have triggered homoacetogenic fermentation with an associated H2 consumption. In a similar study performed on a different substrate, Akhlaghi et al. [33] found a negative correlation between the OBSH2/THEOH2 ratio and the acetate production, supporting the hypothesis that acetate production derived not only from Clostridial fermentation, but mainly from other non-hydrogenogenic pathways.
Similarly, homoacetogenesis may also explain the final value of 56% for the OBSH2/THEOH2 ratio in the test at ISR = 0.05; in fact, during stress conditions caused by the relatively high organic load, homoacetogens would shift their metabolism from heterotrophic to autotrophic growth on H2/CO2 to relieve the effect of inhibition due to, for example, the accumulation of VFAs. Although the effects of homoacetogenesis on DF may be remarkable, it is still a big unresolved challenge for dark fermentative H2 production; in particular, it is still unclear whether homoacetogenic H2 consumption occurs during the entire fermentation process along with concomitant hydrogenogenic pathways, or during stress conditions (high organic load (i.e., ISR = 0.05), high hydrogen partial pressure, or substrate depletion (i.e., ISR = 0.25)), which forces the biomass to switch to different metabolic pathways [31].
A low OBSH2/THEOH2 ratio (47%) was also calculated for the test at ISR = 0.08. In this case, an important cause could lie in the significant concentration of ethanol detected. The onset of EtOH production may have contributed, coherently, with a possible shift towards solventogenesis that followed the accumulation of VFAs [31,36,37] to decrease the availability of the reducing equivalents by scavenging them and, in turn, affecting the production of H2. However, the commonly recognised knowledge that solventogenesis is favoured under acidic conditions was not confirmed by the present experimental results, as is also reported by Akhlaghi et al. [33].
These aspects confirm how complex and intricate the fermentative H2 production process is; in addition, the production of metabolites not directly generated by hydrogenogenic pathways indicates that the H2 generation potential of the substrate is only partially exploited. A measure of the process efficiency could be evaluated considering that the theoretical H2 production for the Clostridial fermentation falls within the range of 2–4 mol H2/mol hexose as a function of the relative proportions between the acetic and butyric acids produced (Equations (5) and (6)).
Hydrogen is generally acknowledged to be preferentially produced from carbohydrate degradation (see e.g., [1,20,38,39,40,41,42,43]); other fractions, including proteins, lipids (e.g., meat, fish), and lignocellulosic materials (e.g., fruit and vegetable fractions), which are expected to be found in FW, are less suited to biohydrogen production (see e.g., [20,44]). In the present study, the observed conversion efficiencies of the substrate into H2 (see Table 5) were rather far from the theoretical yield, with a maximum of 0.59 mol H2/mol hexose for the test at the optimal ISR. However, it should be emphasised that, as mentioned by Dong et al. [44], the type of carbohydrates also exerts a considerable influence on the fermentation process. Another—and probably more important—explanation may be found in the assumption that hexose is the only constituent of the original TOC, which is obviously an over-simplification in the case of FW.
The calculated acidification yield is reported in Table 5; it was in the range of 76–99%, and the highest value was attained at the optimal ISR value. The fact that the sum of VFAs, ethanol, and residual carbohydrate concentrations at the end of the test largely explains the DOC suggests that other metabolic end products potentially being formed during the process accounted for a negligible fraction of soluble carbon. This seems to confirm that homoacetogenesis may be claimed for those runs with OBSH2 < THEOH2, though the contribution of the alcohol production also may not have been negligible.

4. Conclusions

  • The ISR exerted a remarkable influence on both the process kinetics and the final H2 production yield.
  • An appropriate ISR proved to enhance the effects of an optimal operating pH, confirming that fermentative H2 production is a process that requires substrate-specific optimisation of a plurality of operating parameters.
  • An ISR of 0.14 proved to be the optimal value for fermentative H2 production from FW, as suggested by the observed performance in terms of SHPmax (88.8 L H2/kg VSFW) and Rmax (10.8 L H2/kg VSFW∙h).
  • The main metabolic products included acetate, butyrate, propionate, and ethanol. Several overlapping and competing fermentation pathways likely governed the process, reducing the observed H2 production.
  • The high correspondence between OBSH2 and THEOH2 for ISR 0.14 suggests that in this test, the H2 production mostly derived from the typical acetate/butyrate-producing Clostridial fermentation, with the net of the H2 consumption related to propionic fermentation.
  • Optimising the ISR provided useful information to support the perspectives for real-scale implementation of fermentative hydrogen production. Among the aspects that would provide the most benefit, the standardisation of tests to estimate the hydrogen production potential from different substrates is of particular importance. The recently published German guideline VDI 4630 (2016) has emphasised the role of the biochemical methane potential test as a reliable approach for the determination of the methane production potential [17,45]; similarly, a biochemical hydrogen potential test could be worth developing as a valuable, simple, and low cost tool to assess the potential, adequacy, and viability of the fermentative hydrogen production process [10,20,46,47].

Author Contributions

Conceptualisation, G.C., G.D.G., A.M., D.S., M.R.B., A.P., R.P., and A.R.; methodology, G.D.G., D.S., A.P., and R.P.; software, G.D.G. and D.S.; validation, G.D.G., A.M., A.P., and R.P.; formal analysis, D.S. and A.R.; investigation, G.D.G. and D.S.; resources, G.C., G.D.G., A.M., and D.S.; data curation, G.D.G., D.S., and A.R.; original draft preparation, G.D.G., A.M., D.S., A.P., R.P., and A.R.; visualisation, D.S.; supervision, A.M. and A.P.; project administration, A.M.; and funding acquisition, G.D.G.

Funding

This research was funded by Sardinia Region (Regional Law 7/2007) in the framework of the research project “Integrated system for the production of H2 and CH4 from municipal solid waste organic fractions”.

Acknowledgments

The present study was performed in the framework of the activities of the “Waste Biorefinery” Task Group (for more information see https://www.tuhh.de/iue/iwwg/task-groups/waste-biorefinery.html), which is part of the International Waste Working Group (IWWG).

Conflicts of Interest

The authors declare no conflicts of interest. The funders had no role in the design of the study; in the collection, analyses, or interpretation of data; in the writing of the manuscript; or in the decision to publish the results.

References

  1. Han, S.-K.; Shin, H.-S. Performance of an innovative two-stage process converting food waste to hydrogen and methane. J. Air Waste Manag. Assoc. 2004, 54, 242–249. [Google Scholar] [CrossRef] [PubMed]
  2. Levin, D.B.; Pitt, L.; Love, M. Biohydrogen production: Prospects and limitations to practical application. Int. J. Hydrog. Energy 2004, 29, 173–185. [Google Scholar] [CrossRef]
  3. Antonopoulou, G.; Gavala, H.N.; Skiadas, I.V.; Angelopoulos, K.; Lyberatos, G. Biofuels generation from sweet sorghum: Fermentative hydrogen production and anaerobic digestion of the remaining biomass. Bioresour. Technol. 2008, 99, 110–119. [Google Scholar] [CrossRef] [PubMed]
  4. De Gioannis, G.; Muntoni, A.; Polettini, A.; Pomi, R.; Spiga, D. Energy recovery from one- and two-stage anaerobic digestion of food waste. Waste Manag. 2017, 68, 595–602. [Google Scholar] [CrossRef] [PubMed]
  5. De Gioannis, G.; Muntoni, A.; Polettini, A.; Pomi, R. A review of dark fermentative hydrogen production from biodegradable municipal waste fractions. Waste Manag. 2013, 33, 1345–1361. [Google Scholar] [CrossRef] [PubMed]
  6. Li, L.; He, Q.; Zhao, X.; Wu, D.; Wang, X.; Peng, X. Anaerobic digestion of food waste: Correlation of kinetic parameters with operational conditions and process performance. Biochem. Eng. J. 2018, 130, 1–9. [Google Scholar] [CrossRef]
  7. Liu, Y. Bioenergenic interpretation on So/Xo ratio in substrate-sufficient batch culture. Water Res. 1996, 30, 2766–2770. [Google Scholar] [CrossRef]
  8. Stanislaus, M.S.; Zhang, N.; Yuan, Y.; Zheng, H.; Zhao, C.; Hu, X.; Zhu, Q.; Yang, Y. Improvement of biohydrogen production by optimization of pretreatment method and substrate to inoculum ratio from microalgal biomass and digested sludge. Renew. Energy 2018, 127, 670–677. [Google Scholar] [CrossRef]
  9. Argun, H.; Dao, S. Bio-hydrogen production from waste peach pulp by dark fermentation: Effect of inoculum addition. Int. J. Hydrog. Energy 2017, 42, 2569–2574. [Google Scholar] [CrossRef]
  10. Ghimire, A.; Sposito, F.; Frunzo, L.; Trably, E.; Escudié, R.; Pirozzi, F.; Lens, P.N.L.; Esposito, G. Effects of operational parameters on dark fermentative hydrogen production from biodegradable complex waste biomass. Waste Manag. 2016, 50, 55–64. [Google Scholar] [CrossRef]
  11. Cappai, G.; De Gioannis, G.; Muntoni, A.; Polettini, A.; Pomi, R.; Spiga, D. Effect of inoculum to substrate ratio (ISR) on hydrogen production through dark fermentation of food waste. In Proceedings of the Atti del “Sardinia 2015 15th International Waste Management and Landfill Symposium”, Cagliari, Italy, 5–9 October 2015. [Google Scholar]
  12. De Gioannis, G.; Friargiu, M.; Gioia, M.; Muntoni, A.; Polettini, A.; Pomi, R. Effect of inoculum to substrate ratio (ISR) and pH on fermentative hydrogen production from cheese whey. In Proceedings of the Atti del “Sardinia 2015 15th International Waste Management and Landfill Symposium", Cagliari, Italy, 5–9 October 2015. [Google Scholar]
  13. Nathao, C.; Sirisukpoka, U.; Pisutpaisal, N. Production of hydrogen and methane by one and two stage fermentation of food waste. Int. J. Hydrog. Energy 2013, 38, 15764–15769. [Google Scholar] [CrossRef]
  14. Chen, W.; Chen, S.; Kumar, S.; Sung, S. Kinetic study of biological hydrogen production by anaerobic fermentation. Int. J. Hydrog. Energy 2006, 31, 2170–2178. [Google Scholar] [CrossRef]
  15. Sangyoka, S.; Reungsang, A.; Lin, C.-Y. Optimization of biohydrogen production from sugarcane bagasse by mixed cultures using a statistical method. Sustain. Environ. Res. 2016, 26, 235–242. [Google Scholar] [CrossRef]
  16. Costa, J.C.; Oliveira, J.V.; Alves, M.M. Response surface design to study the influence of inoculum, particle size and inoculum to substrate ratio on the methane production from Ulex sp. Renew. Energy 2016, 96, 1071–1077. [Google Scholar] [CrossRef] [Green Version]
  17. Raposo, F.; De la Rubia, M.A.; Fernandez-Cegrì, V.; Borja, R. Biochemical methane potential (BMP) of solid organic substrates: Evaluation of anaerobic biodegradability using data from an international interlaboratory study. Renew. Sustain. Energy Rev. 2011, 16, 861–877. [Google Scholar] [CrossRef]
  18. Boulanger, A.; Pinet, E.; Bouix, M.; Bouchez, T.; Mansour, A.A. Effect of inoculum to substrate ratio (I/S) on municipal solid waste anaerobic degradation kinetics and potential. Waste Manag. 2012, 32, 2258–2265. [Google Scholar] [CrossRef] [PubMed]
  19. Pan, J.; Zhang, R.; El-mashad, H.M.; Sun, H.; Ying, Y. Effect of food to microorganism ratio on biohydrogen production from food waste via anaerobic fermentation. Int. J. Hydrog. Energy 2008, 33, 6968–6975. [Google Scholar] [CrossRef]
  20. Alibardi, L.; Cossu, R. Composition variability of the organic fraction of municipal solid waste and effects on hydrogen and methane production potentials. Waste Manag. 2015, 36, 147–155. [Google Scholar] [CrossRef]
  21. Cappai, G.; De Gioannis, G.; Friargiu, M.; Massi, E.; Muntoni, A.; Polettini, A.; Pomi, R.; Spiga, D. An experimental study on fermentative H2 production from food waste as affected by pH. Waste Manag. 2014, 34, 1510–1519. [Google Scholar] [CrossRef]
  22. American Public Health Association and American Water Works Association. Standard Methods for the Examination of Water and Wastewater, 21th ed.; American Public Health Association: Washington, DC, USA, 1998. [Google Scholar]
  23. Dubois, M.; Gilles, K.A.; Hamilton, J.K.; Rebers, P.A.; Smith, F. Colorimetric Method for Determination of Sugars and Related Substances. Anal. Chem. 1956, 28, 350–356. [Google Scholar] [CrossRef]
  24. Voelklein, M.A.; Jacob, A.; O’ Shea, R.; Murphy, J.D. Assessment of increasing loading rate on two-stage digestion of food waste. Bioresour. Technol. 2016, 202, 172–180. [Google Scholar] [CrossRef] [PubMed]
  25. Li, C.; Fang, H.H.P. Fermentative hydrogen production from wastewater and solid wastes by mixed cultures. Crit. Rev. Environ. Sci. Technol. 2007, 37, 1–39. [Google Scholar] [CrossRef]
  26. Jungermann, K.; Thauer, R.K.; Leimenstoll, G.; Decker, K. Function of reduced pyridine nucleotide-ferredoxin oxidoreductases in saccharolytic Clostridia. Biochim. Biophys. Acta–Bioenerg. 1973, 305, 268–280. [Google Scholar] [CrossRef]
  27. Zwietering, M.H.; Jongenburger, I.; Rombouts, F.M.; van ’t Riet, K. Modeling of the bacterial growth curve. Appl. Environ. Microbiol. 1990, 56, 1875–1881. [Google Scholar] [PubMed]
  28. Lay, J.-J.; Lee, Y.-J.; Noike, T. Feasibility of biological hydrogen production from organic fraction of municipal solid waste. Water Res. 1999, 33, 2579–2586. [Google Scholar] [CrossRef]
  29. Dong, L.; Zhenhong, Y.; Yongming, S.; Longlong, M. Anaerobic fermentative co-production of hydrogen and methane from an organic fraction of municipal solid waste. Energy Sources Part A Recover. Util. Environ. Eff. 2011, 33, 575–585. [Google Scholar] [CrossRef]
  30. Siriwongrungson, V.; Zeng, R.J.; Angelidaki, I. Homoacetogenesis as the alternative pathway for H2 sink during thermophilic anaerobic degradation of butyrate under suppressed methanogenesis. Water Res. 2007, 41, 4204–4210. [Google Scholar] [CrossRef]
  31. Saady, N.M.C. Homoacetogenesis during hydrogen production by mixed cultures dark fermentation: Unresolved challenge. Int. J. Hydrog. Energy 2013, 38, 13172–13191. [Google Scholar] [CrossRef]
  32. Zhang, C.; Su, H.; Baeyens, J.; Tan, T. Reviewing the anaerobic digestion of food waste for biogas production. Renew. Sustain. Energy Rev. 2014, 38, 383–392. [Google Scholar] [CrossRef]
  33. Akhlaghi, M.; Boni, M.R.; De Gioannis, G.; Muntoni, A.; Polettini, A.; Rossi, A.; Spiga, D. A parametric response surface study of fermentative hydrogen production from cheese whey. Bioresour. Technol. 2017, 244, 473–483. [Google Scholar] [CrossRef]
  34. Bundhoo, M.A.Z.; Mohee, R. Inhibition of dark fermentative bio-hydrogen production: A review. Int. J. Hydrog. Energy 2016, 41, 6713–6733. [Google Scholar] [CrossRef]
  35. Park, W.S.; Hwang, M.H.; Hyun, S.H.; Kim, I.S. Suppression of hydrogen consuming bacteria in anaerobic hydrogen fermentation. Environ. Eng. Res. 2005, 10, 181–190. [Google Scholar] [CrossRef]
  36. Gottschalk, J.C.; Morris, J.G. The induction of acetone and butanol production in cultures Clostridium acetobutylicum by elevated concentrations of acetate and butyrate. FEMS Microb. Lett. 1981, 12, 385–389. [Google Scholar] [CrossRef]
  37. Terracciano, J.S.; Kashket, E.R. Intracellular conditions required for initiation of solvent production by Clostridium acetobutylicum. Appl. Environ. Microbiol. 1986, 52, 86–91. [Google Scholar] [PubMed]
  38. Argun, H.; Kargi, F.; Kapdan, I.K.; Oztekin, R. Batch dark fermentation of powdered wheat starch to hydrogen gas: Effects of the initial substrate and biomass concentrations. Int. J. Hydrog. Energy 2008, 33, 6109–6115. [Google Scholar] [CrossRef]
  39. Chu, C.-F.; Li, Y.-Y.; Xu, K.-Q.; Ebie, Y.; Inamori, Y.; Kong, H.-N. A pH- and temperature-phased two-stage process for hydrogen and methane production from food waste. Int. J. Hydrog. Energy 2008, 33, 4739–4746. [Google Scholar] [CrossRef]
  40. Lee, Y.-W.; Chung, J. Bioproduction of hydrogen from food waste by pilot-scale combined hydrogen/methane fermentation. Int. J. Hydrog. Energy 2010, 35, 11746–11755. [Google Scholar] [CrossRef]
  41. Lay, J.J.; Fan, K.S.; Chang, I.J.; Ku, C.H. Influence of chemical nature of organic wastes on their conversion to hydrogen by heat-shock digested sludge. Int. J. Hydrog. Energy 2003, 28, 1361–1367. [Google Scholar] [CrossRef]
  42. Kim, S.-H.; Han, S.-K.; Shin, H.-S. Feasibility of biohydrogen production by anaerobic co-digestion of food waste and sewage sludge. Int. J. Hydrog. Energy 2004, 29, 1607–1616. [Google Scholar] [CrossRef]
  43. Kim, D.H.; Kim, S.H.; Kim, H.W.; Kim, M.S.; Shin, H.S. Sewage sludge addition to food waste synergistically enhances hydrogen fermentation performance. Bioresour. Technol. 2011, 102, 8501–8506. [Google Scholar] [CrossRef]
  44. Dong, L.; Zhenhong, Y.; Yongming, S.; Xiaoying, K.; Yu, Z. Hydrogen production characteristics of the organic fraction of municipal solid wastes by anaerobic mixed culture fermentation. Int. J. Hydrog. Energy 2009, 34, 812–820. [Google Scholar] [CrossRef]
  45. Koch, K.; Plabst, M.; Schmidt, A.; Helmreich, B.; Drewes, J.E. Co-digestion of food waste in a municipal wastewater treatment plant: Comparison of batch tests and full-scale experiences. Waste Manag. 2016, 47, 28–33. [Google Scholar] [CrossRef] [PubMed]
  46. Pecorini, I.; Baldi, F.; Albini, E.; Galoppi, G.; Bacchi, D.; Della Valle, A.; Baldi, A.; Bianchini, A.; Figini, A.; Rossi, P.; et al. Hydrogen production from food waste using biochemical hydrogen potential test. Procedia Environ. Sci. Eng. Manag. 2017, 4, 155162. [Google Scholar] [CrossRef]
  47. Keskin, T.; Arslan, K.; Abubackar, H.N.; Vural, C.; Eroglu, D.; Karaalp, D.; Yanik, J.; Ozdemir, G.; Azbar, N. Determining the effect of trace elements on biohydrogen production from fruit and vegetable wastes. Int. J. Hydrog. Energy 2018, 1–12. [Google Scholar] [CrossRef]
Figure 1. (a) Specific hydrogen production (SHP, solid lines indicate Gompertz model curves) and (b) H2 content in the produced gas. The datapoints represent the average of the triplicate tests; the error bars represent the standard deviation of the data (n = 3).
Sustainability 10 04506 g001
Figure 2. Relative distribution (mol.%) of the SMPs at the end of the batch fermentation tests.
Sustainability 10 04506 g002
Table 1. The inoculum-to-substrate ratio (ISR) values adopted and the main characteristics of concern for the food waste (FW), inoculum, and feed mixtures (average value ± standard deviation).
ParameterMeasure UnitFWASTest
ISR 0.05ISR 0.08ISR 0.14ISR 0.25
pH 1---5.5 ± 0.27.1 ± 0.026.4 ± 0.26.5 ± 0.16.7 ± 0.26.9 ± 0.2
TS%18.8 ± 0.50.6 ± 0.098.8 ± 0.027.0 ± 0.055.2 ± 0.073.3 ± 0.08
VS% TS95.6 ± 2.961.7 ± 4.794.3 ± 0.0693.7 ± 0.192.6 ± 0.0690.4 ± 0.05
TOC% TS46.2 ± 0.136.4 ± 0.145.8 ± 0.145.7 ± 0.145.3 ± 0.144.7 ± 0.2
TN% TS2.8 ± 0.16.4 ± 0.22.9 ± 0.43.0 ± 0.33.1 ± 0.33.4 ± 0.1
sCarbg/L 2NDND21.8 ± 1.216.5 ± 0.812.2 ± 0.57.8 ± 0.8
1 initial pH values for the FW, AS, and feed mixtures; the operating pH value was set at 6.5; 2 expressed as hexose; ND: not determined.
Table 2. Comparison of H2 yield from different studies.
Type of SubstrateType of InoculumInoculum Pre-TreatmentISR
(g VSinoculum/g VSFW)
pHT
(°C)
Reactor Operation
Mode
H2 Yield
(mL H2/g VSFW)
Reference
FWActivated sludge-0.146.539Batch89.8Present study
FWAnaerobic sludge-0.23 a5.5 b (n.c.)36Batch56.5[14]
FWAnaerobic sludge-0.176.3 b (n.c.)35Batch39[19]
FWAnaerobic sludge-0.146.6 b (n.c.)50Batch57[19]
FWAnaerobic sludgeHST c0.136.0 b (n.c.)37Batch55[13]
FWAnaerobic sludgeHST24.5 b (n.c.)55Batch60.6[10]
FWAnaerobic sludgeHST15.055Batch60.3[10]
a Expressed as g VSSinoculum/g VSFW (VSS = Volatile Suspended Solids); b starting value; c HST = heat shock treatment; n.c.: no control of operating pH.
Table 3. Kinetic parameters of the Gompertz model.
ParameterMeasure UnitTest
ISR 0.05ISR 0.08ISR 0.14ISR 0.25
SHPmaxL H2/kg VSFW49.856.688.871.0
RmaxL H2/kg VSFW∙h4.77.910.86.8
λh20.64.73.12.3
t95h30.811.811.112.4
R2-0.9990.9970.9900.987
Table 4. Concentrations of soluble metabolic products (SMPs) at the end of the fermentation tests (average value ± standard deviation).
TestHAcHPrHBuHValHHexHHepEtOH
mmol/gVSFW
ISR 0.052.51 ± 0.062.53 ± 0.060.73 ± 0.030.10 ± 0.0040.15 ± 0.010.39 ± 0.010.06 ± 0.004
ISR 0.081.80 ± 0.081.10 ± 0.061.51 ± 0.030.09 ± 0.0040.13 ± 0.010.59 ± 0.021.00 ± 0.06
ISR 0.141.82 ± 0.101.49 ± 0.081.07 ± 0.030.17 ± 0.0060.31 ± 0.021.12 ± 0.030.06 ± 0.002
ISR 0.253.46 ± 0.091.37 ± 0.051.52 ± 0.050.07 ± 0.0030.03 ± 0.0020.03 ± 0.0010.79 ± 0.01
Table 5. Accounted dissolve organic carbon (DOC), acidification yield, and conversion efficiency as observed at the end of each batch fermentation test (average value ± standard deviation).
TestDOCVFAsEtOHsCarbAccounted DOCAcidification YieldConversion Efficiency
g C%%mol H2/mol Hexose
ISR 0.0575.5 ± 2.367.9 ± 3.10.7 ± 0.021.6 ± 0.0493.0 ± 1.289.9 ± 1.40.34 ± 0.004
ISR 0.0855.1 ± 2.141.8 ± 2.44.6 ± 0.11.4 ± 0.186.9 ± 0.876.0 ± 1.50.32 ± 0.01
ISR 0.1444.0 ± 1.843.5 ± 2.30.2 ± 0.011.1 ± 0.04102.0 ± 1.298.9 ± 1.20.59 ± 0.003
ISR 0.2520.5 ± 1.216.9 ± 0.91.5 ± 0.020.5 ± 0.0292.0 ± 0.882.3 ± 0.40.43 ± 0.01

