A Methodological Proposal for Corporate Carbon Footprint and Its Application to a Wine-Producing Company in Galicia, Spain


Abstract
:
1. Introduction: Corporate Sustainability and Ecological Footprint Analysis
2. A Methodological Proposal for CCFP Calculation: the Method Composed of Financial Accounts (MC3)
2.1. The MC3 Foundations
Corporate Land-Use Matrix

| PRODUCT CATEGORY | ANNUAL CONSUMPTION | PRODUCTIVITY | FOOTPRINT BY BPS TYPE | ||||||||||||
| Consumption units [unit/year] | Euros without VAT [Euro/year] | Tons [t/year] | Energy intensity [GJ/t] | GJ [GJ/year] | Natural [t/ha/year] | Energy [GJ/ha/year] | Fossil energy [Ha*EF] | Cultivable land [Ha*EF] | Pastures [Ha*EF] | Forests [Ha*EF] | Built-up land [Ha*EF] | Sea [Ha*EF] | TOTAL CEF [Ha*EF] | COUNTERFOOTPRINT [Ha*EF*FR] | |
| 1. ENERGY | |||||||||||||||
| 1.1 Electricity | |||||||||||||||
| 1.2 Fuels | |||||||||||||||
| 1.3 Materials | |||||||||||||||
| 1.4 Construction materials | |||||||||||||||
| 1.5 Services | |||||||||||||||
| 1.6 Wastes | |||||||||||||||
| 2. LAND USE | |||||||||||||||
| 3. FISHING AND AGRICULTURAL RESOURCES | |||||||||||||||
| 4. FOREST RESOURCES | |||||||||||||||
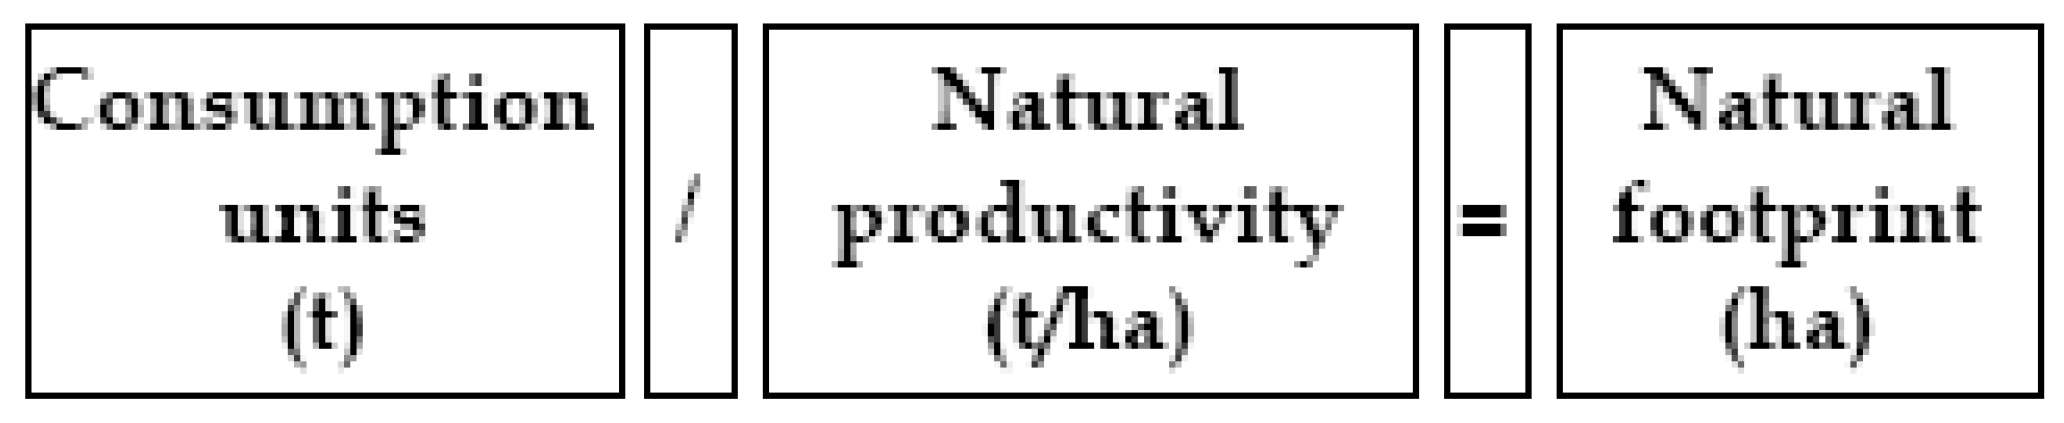
CCFP Calculation


2.2. The MC3 and Other Methodological Approaches for the Estimation of CEF and CCFP
| Concept | BL3 | CBA | MC3 |
|---|---|---|---|
| Calculation method | Input-output analysis/LCA | Component-based approach/LCA | MC3 is based on Compound-Method |
| Activities included in CCFP | All the activities | Relevant activities | All the activities |
| Transformation of financial information into mass unit data | No needed. The method uses monetary input-output coefficients | Needed. No explicit method | Needed.Explicit method |
| Equivalence and yield factors | Yes | No | Yes |
| Is the required software accessible? | No | No | Yes |
- It is a complete method, which collects the footprint from the consumption of all goods and services and wastes generated by a company.
- It is based on Wackernagel and Rees’ “compound-method”, a solid well-known method for researchers in ecological footprint.
- It is a technically feasible method. Its calculation does not require extensive expert staff inputs: everybody working with spreadsheets is able to calculate CCFP.
- It is a transparent method. The spreadsheet and all the data needed for the estimation of CCFP, including energy intensity factors and productivities, are available for researchers at http://www.huellaecologica.com.
- It is a flexible method. The spreadsheet offers the researchers the possibility of adding/changing the factors employed for the estimation, according to the specific needs of their company.
3. CCFP Estimation for a Wine Producer in Galicia, Spain
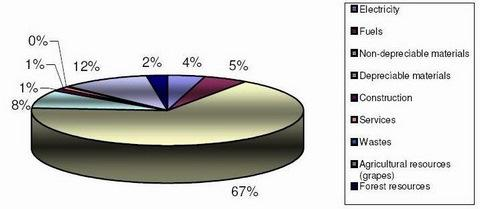
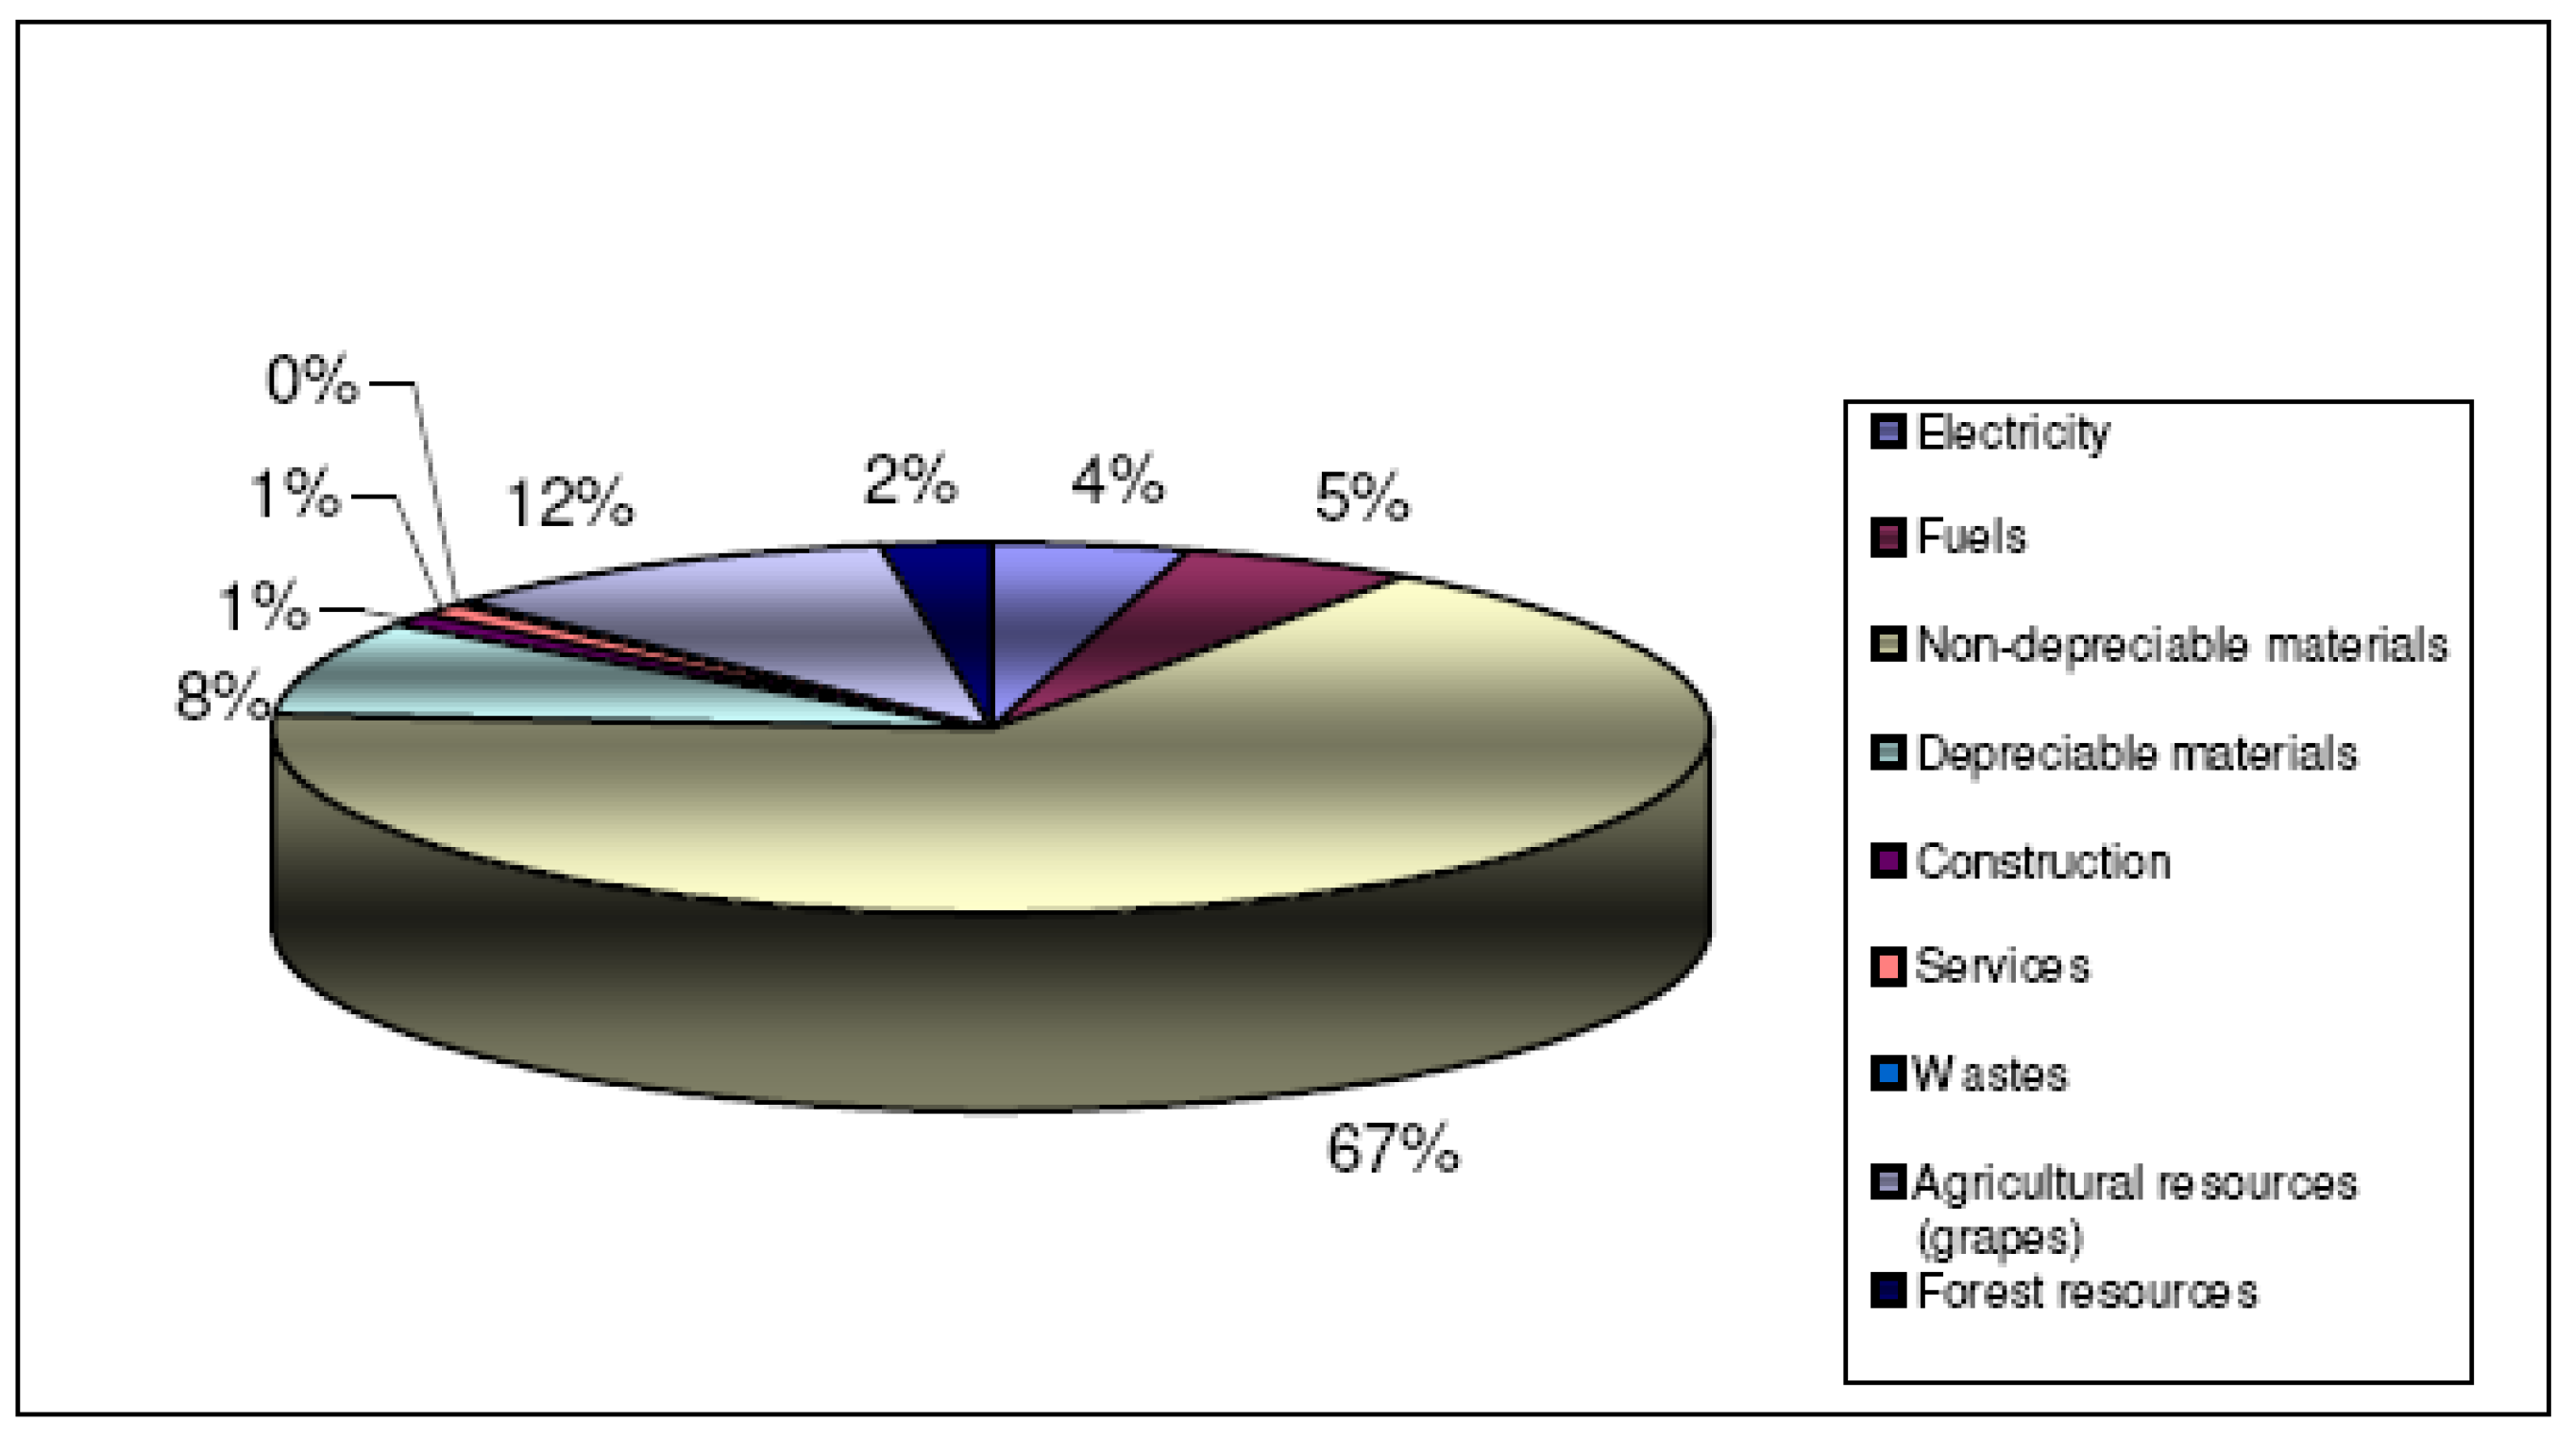
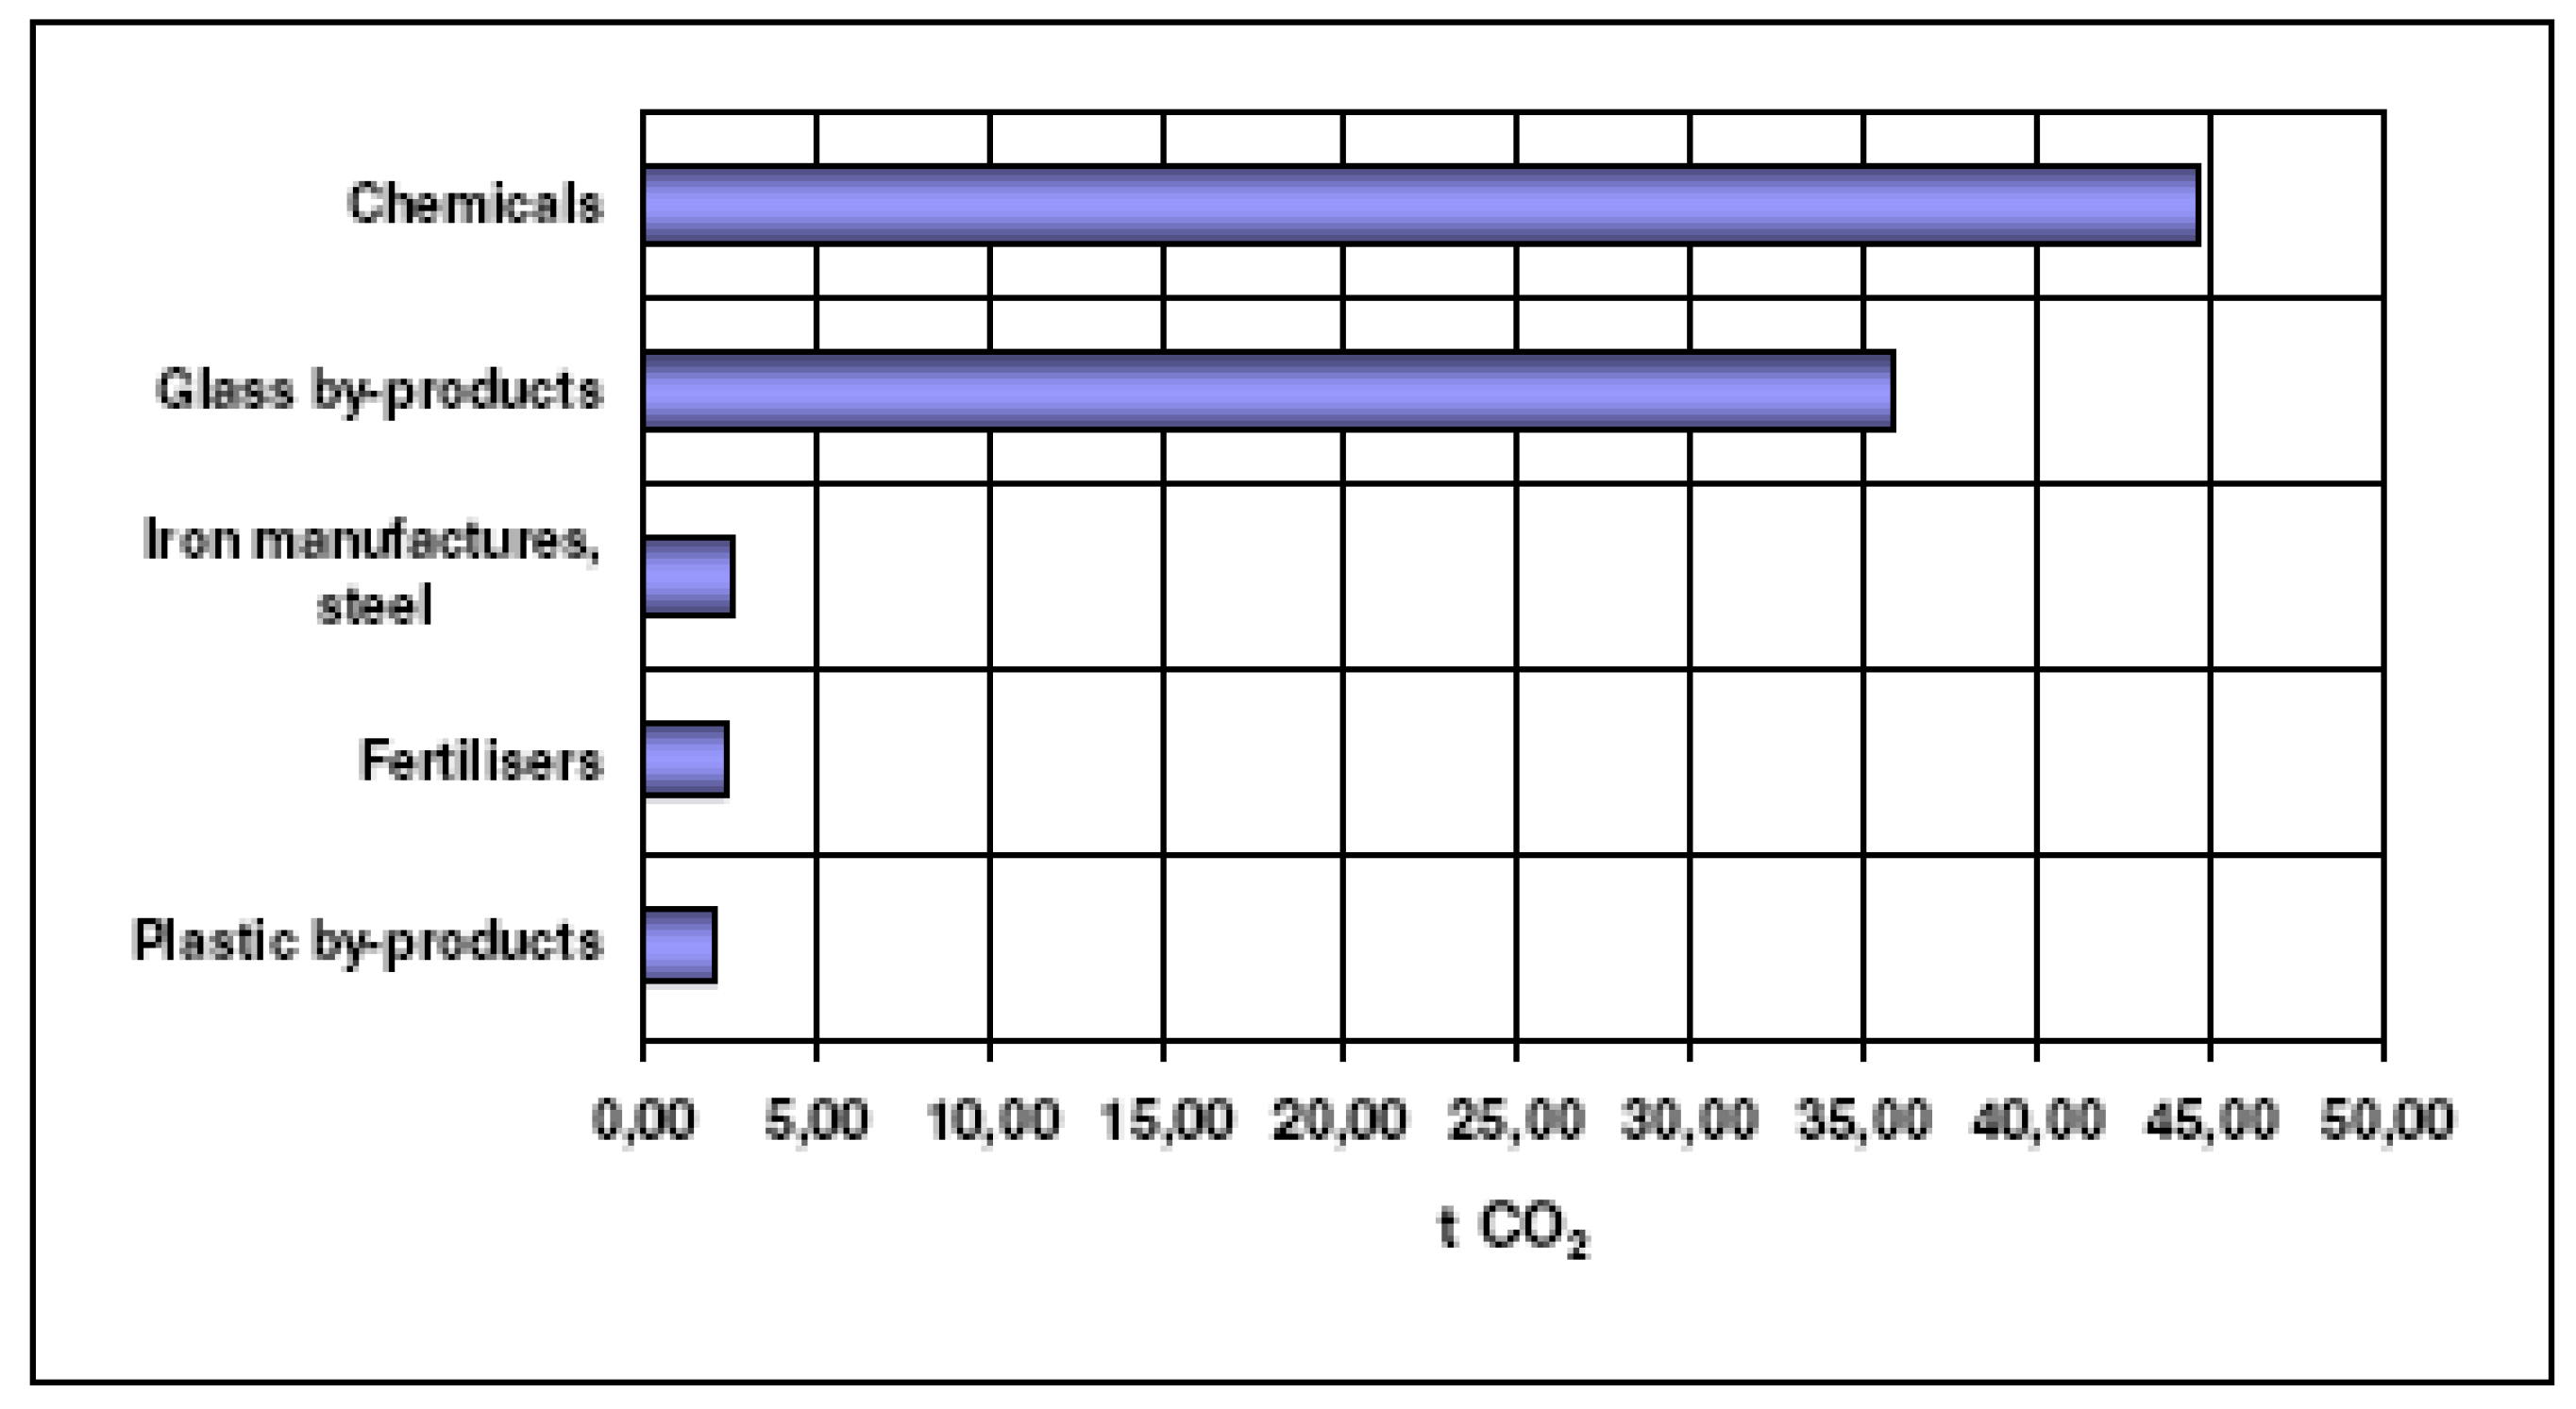
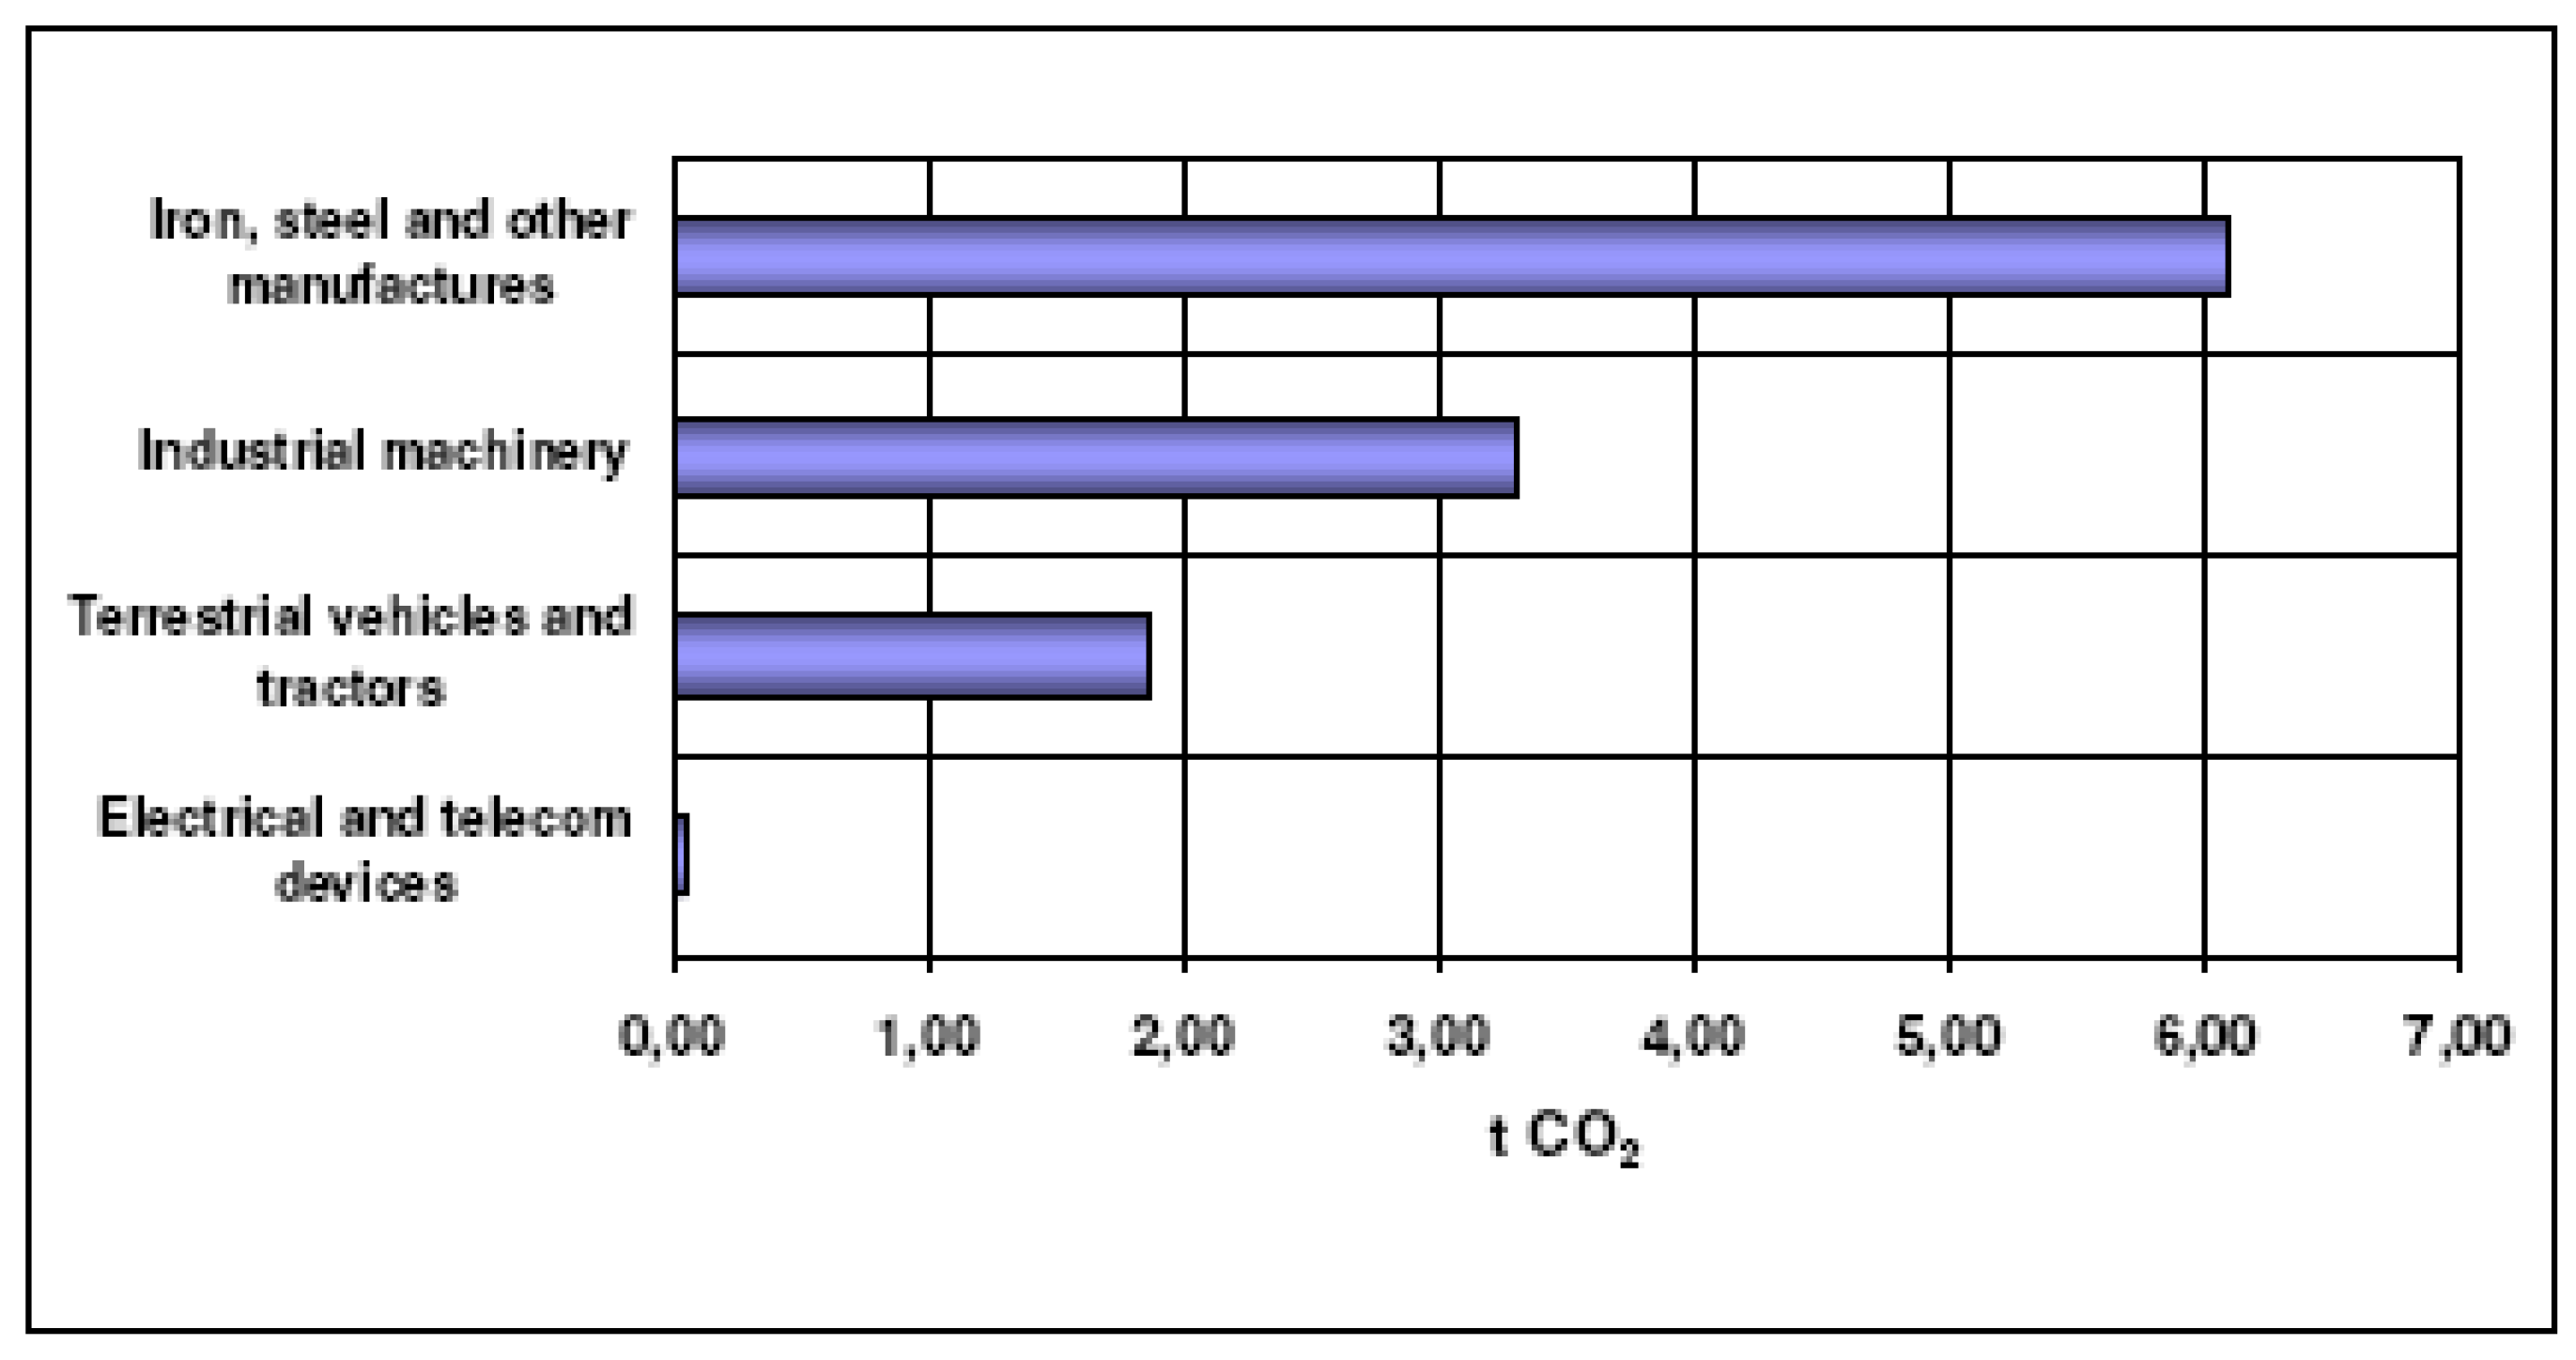
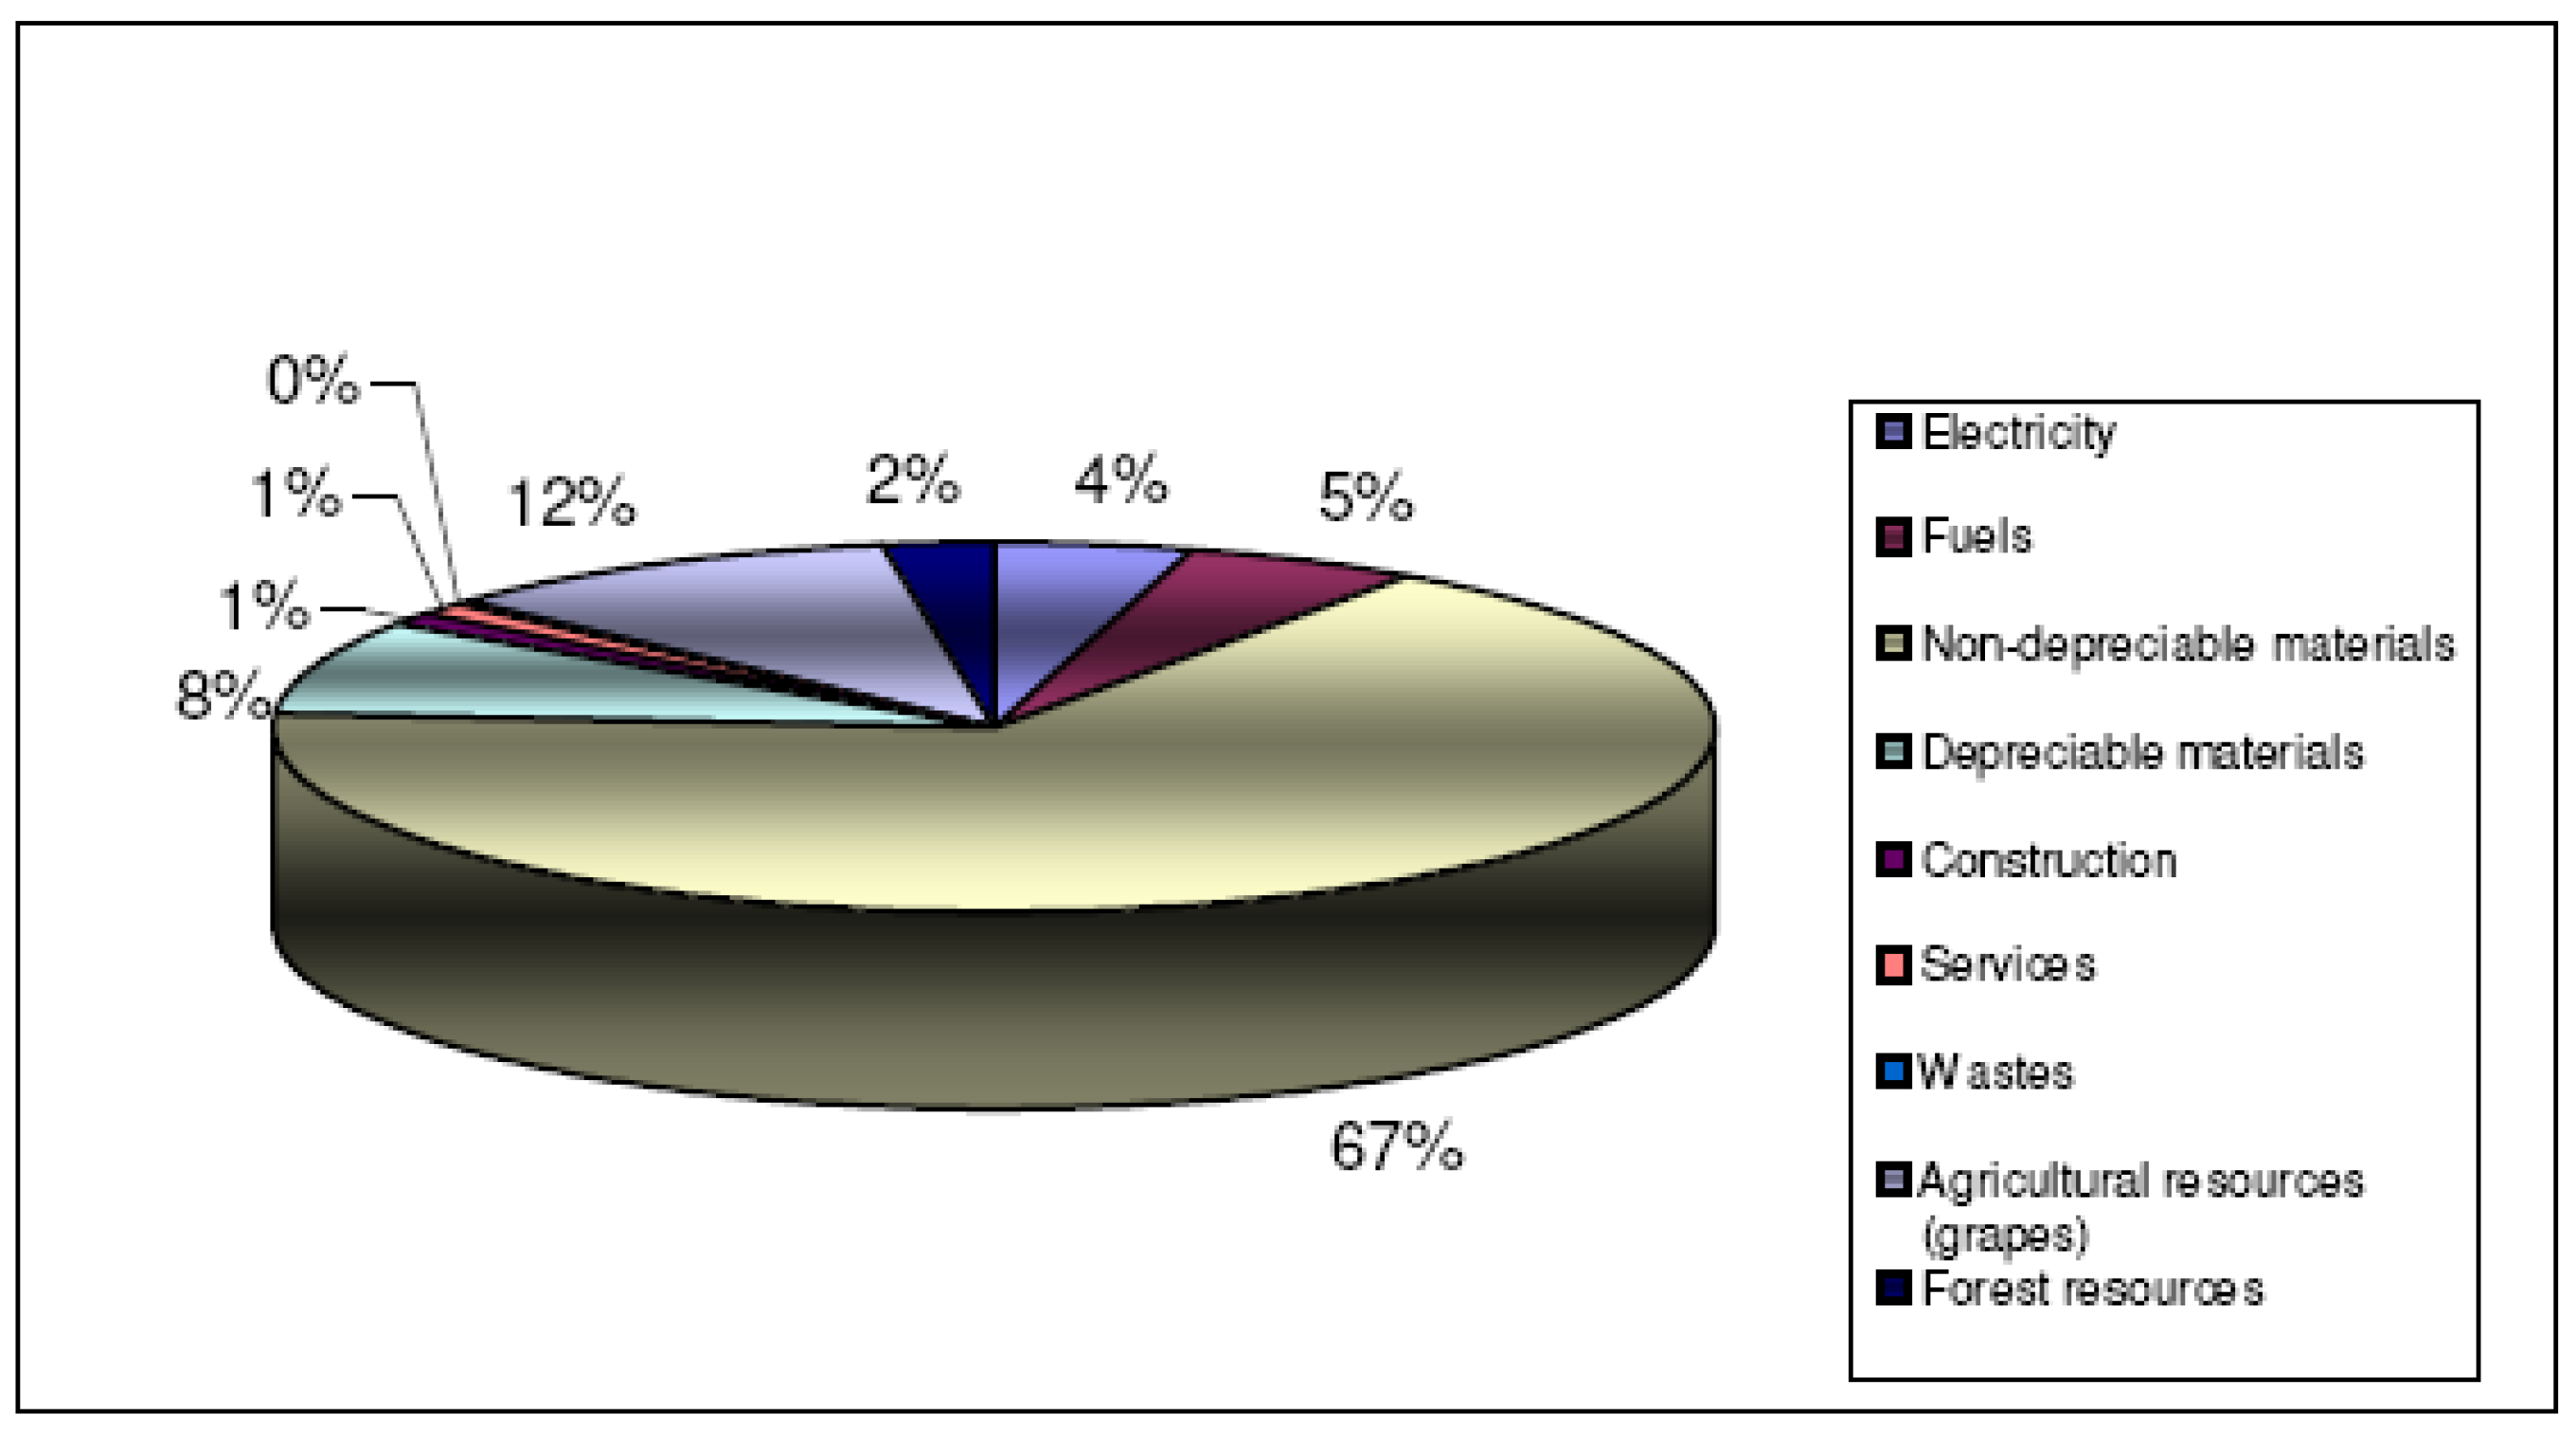
3.1. Results and Discussion
| Concept | Ud. | Gamma |
|---|---|---|
| Gross CO2 emissions | t | 152.7 |
| Net CO2 emissions | t | 152.7 |
| Sold goods | t | 27.9 |
| Net CO2 t/goods tons | t | 5.47 |
| Type of Footprint | t CO2 | % |
|---|---|---|
| Fossil energy | 133.7 | 87.6 |
| Forest | 18.95 | 12.4 |
| Total | 152.7 | 100 |


5. Conclusions
Acknowledgements
Research Grants
References
- An introduction to corporate environmental management: striving for sustainability, 1st ed.; Schaltegger, S.; Burritt, R.; Petersen, H. (Eds.) Greenleaf Publishing: Sheffield, UK, 2003; pp. 1–384.
- GRI (Global Reporting Initiative). Sustainability Reporting Guidelines. Available online: http://www.aeca.es/comisiones/rsc/documentos_fundamentales_rsc/gri/guidelines/gri_guidelines_2002.pdf (accessed October 23, 2006).
- GRI (Global Reporting Initiative). Sustainability Reporting Guidelines. Available online: http://www.globalreporting.org/NR/rdonlyres/ED9E9B36-AB54-4DE1-BFF2-5F735235CA44/0/ G3_GuidelinesENU.pdf (accessed November 23, 2008).
- Holland, L. Can the Principle of the Ecological Footprint be Applied to Measure the Environmental Sustainability of Business? Corp. Soc. Responsibility Environ. Manage. 2003, 10, 224–232. [Google Scholar] [CrossRef]
- Chambers, N.; Lewis, K. Ecological Footprint Análisis: Towards a Sustainability Indicador for Business. ACCA Research Report No. 65, Oxford, UK. 2001. [Google Scholar]
- Lenzen, M.; Lundie, S.; Bransgrove, G.; Charet, L.; Sack, F. Assessing the Ecological Footprint of a Large Metropolitan Water Supplier: Lessons for Water Management and Planning towards Sustainability. J. Environ. Plan. Manage. 2003, 46, 113–141. [Google Scholar] [CrossRef]
- Lenzen, M.; Foran, B.; Dey, C. Sustainability Accounting for Business - A new International Software Based on Input-Output Tables. In Paper presented at the Intermediate Input-Output Meeting Conference, Sendai, Japan, 26-28, July, 2006.
- Wiedmann, T.; Lenzen, M. Sharing Responsibility along Supply Chains - A New Life-Cycle Approach and Software Tool for Triple-Bottom-Line Accounting. In Working paper presented at the Corporate Responsibility Research Conference, Trinity College Dublin, Ireland, 4-5, September, 2006.
- Doménech, J.L. La huella ecológica empresarial: el caso del puerto de Gijón. In Working paper preseted at the VIIth Nacional conference of environment, Madrid, Spain, 22-26, November, 2004.
- Wiedmann, T.; Barret, J.; Lenzen, M. Companies on the Scale: Comparing and Benchmarking the Footprints of Businesses. In Working paper presented at the International Ecological Footprint Conference, Cardiff University, Cardiff, Wales, 8-10, May, 2007.
- Murray, J.; Dey, C. Assessing the Impacts of a Loaf of Bread; ISA Research Report 04-07: Sydney, Australia, 2007; pp. 1–43. [Google Scholar]
- Wackernagel, M.; Monfreda, Ch.; Moran, D.; Wermer, P.; Goldfinger, S.; Deumling, D. Ecological footprint time series of Austria, the Philippines, and South Korea for 1961-1999: comparing the conventional approach to an actual land area’ approach. Land Use Policy 2005, 21, 261–269. [Google Scholar] [CrossRef]
- Rees, W.E. Ecological Footprints and Appropriated Carrying Capacity: What Urban Economists Leaves Out. Environ. Urban. 1992, 4, 121–130. [Google Scholar] [CrossRef]
- Wackernagel, M.; Rees, W.E. Our Ecological Footprint: Reducing Human Impact on the Earth, 2nd ed.; New Society Publishers: Philadelphia, USA, 1996; pp. 1–160. [Google Scholar]
- Wackernagel, M. The Ecological Footprint of Santiago de Chile. Local Environ. 1998, 3, 7–25. [Google Scholar] [CrossRef]
- Wackernagel, M.; Silverstein, J. Big Things First: Focusing on the Scale Imperative with the Ecological Footprint. Ecol. Econ. 2000, 32, 391–394. [Google Scholar] [CrossRef]
- Wackernagel, M.; Schulz, N.; Deumling, D.; Callejas Linares, A.; Jenkins, M.; Kapos, V.; Monfreda, C.; Loh, J.; Myers, N.; Norgaard, R.; Randers, J. Tracking the Ecological Overshoot of the Human Economy. Proc. Nat. Acad. Sci. 2002, 99, 9266–9271. [Google Scholar] [CrossRef]
- Monfreda, Ch.; Wackernagel, M.; Deumling, D. Establishing National Natural Capital Accounts Based on Detailed Ecological Footprint and Biological Capacity Assessment. Land Use Policy 2004, 21, 231–246. [Google Scholar] [CrossRef]
- Kitzes, J.; Peller, A.; Goldfinger, S.; Wackernagel, M. Currents Methods for Calculating National Ecological Footprint Accounts. Sci. Environ. & Sustain. Soc. 2007, 41, 1–9. [Google Scholar]
- Doménech, J.L. Huella ecológica y desarrollo sostenible, 1st ed.; AENOR Ediciones: Madrid, Spain, 2007; pp. 1–398. [Google Scholar]
- GFN (Global Footprint Network). Ecological footprint and biocapacity. Technical notes 2006.
- Wiedmann, T.; Lenzen, M. Unravelling the impacts of supply chains. A new Triple-Bottom-Line Accounting Approach; ISA UK Research Report 07-02: Durham, UK, 2007; pp. 1–26. [Google Scholar]
- Wiedmann, T.; Minx, J. A definition of carbon footprint; ISA UK Research Report 07-01: Durham, UK, 2007; pp. 1–11. [Google Scholar]
- BSI (Bristish Standards Institute). Specification for the assessment of the life cycle greenhouse emissions of goods and services. Available online: http://www.bsigroup.com/en/Standards-and-Publications/Industry-Sectors/Energy/PAS-2050/ (accessed November 10, 2008).
- Wackernagel, M.; Dholakia, R.; Deumling, D.; Richardson, D. Assess your Household's Ecological Footprint 2.0. Available online: http://greatchange.org/ng-footprint-ef_household_evaluation.xls (accessed November 1, 2005).
- Álvarez Díaz, P.D.; Doménech Quesada, J.L.; Perales Vargas-Machuca, J.A. Huella ecológica energética corporativa: Un indicador de la sostenibilidad empresarial. Revista OIDLES 2008, 1, 1–25. [Google Scholar]
- Carballo Penela, A.; García-Negro, M.C.; Doménech Quesada, J.L.; Villasante, C.S.; Rodríguez Rodríguez, G.; García Arenales, M. A pegada ecolóxica corporativa: concepto e aplicación a dúas empresas pesqueiras de Galicia. Revista Galega de Economía 2008, 17, 149–176. [Google Scholar]
- Caselles Moncho, A.; Carrasco Esteve, M.; Martínez Gascón, A.; Coll Ribera, S.; Doménech, J.L.; González Arenales, M. La huella ecológica corporativa de los materiales: aplicación al sector comercial. Revista OIDLES 2008, 1, 1–24. [Google Scholar]
- Coto Millán, P.; Mateo Mantecón, I.; Doménech, J.L.; Quesada, Y.; González-Arenales, M. La Huella Ecológica de las Autoridades Portuarias y los Servicios. Revista OIDLES 2008, 1, 1–27. [Google Scholar]
- Doménech, J.L.; González-Arenales, M. La huella ecológica de las empresas: 4 años de seguimiento en el Puerto de Gijón. Revista OIDLES 2008, 1, 1–23. [Google Scholar]
- Marañon, E.; Iregui, G.; Doménech, J.L.; Fernández-Nava, Y.; González-Arenales, M. Propuesta de índices de conversión para la obtención de la huella de los residuos y los vertidos. Revista OIDLES 2008, 1, 1–22. [Google Scholar]
- IPCC (International Panel on Climate Change). Greenhouse Gas Inventory: workbook. Revised 1996 IPCC Guidelines, Vol 2. Available online: http://www.ipcc-nggip.iges.or.jp/public/gl/ nrgspan.html (accessed October 6, 2008).
- Wackernagel, M. The Ecological Footprint of Italia: Calculation Sheet. Available online: http://www.iclei.org/ICLEI/ef-ita.xls (accessed November 20, 2005).
- Ibañez Etxeburúa, N. La huella ecológica de Donostia-San Sebastián. Available online: http://www.agenda21donostia.com/cas/corporativa/docs/huellaeco.pdf (accessed November 1, 2005).
- Mayor Farguell, X.; Quintana Gozalo, V.; Belmonte Zamora, R. Aproximación a la huella ecológica de Cataluña. Available online: http://www.catsostenible.org/pdf/DdR_7_Huella_ Ecologica.pdf (accessed Novomber 6, 2006).
- Álvarez Díaz, P.D.; Doménech Quesada, J.L.; Perales Vargas-Machuca, J.A. Huella ecológica energética corporativa: Un indicador de la sostenibilidad empresarial. Revista OIDLES 2008, 1, 1–25. [Google Scholar]
- Suh, S.; Lenzen, M.; Treloar, G.J.; Hondo, H.; Horvath, A.; Huppes, G.; Jolliet, O.; Klann, U.; Krewitt, W.; Moriguchi, Y.; Munksgaard, J.; Norris, G. System Boundary Selection in Life-cycle Inventories. Environ. Sci. Technol. 2004, 38, 657–664. [Google Scholar] [CrossRef] [PubMed]
- Aranda, A.; Zabalza, I.; Scarpellini, S. Economic and Environmental Analysis of the Wine Bottle Production in Spain by means of Life Cycle Assessment. International Journal of Agricultural Resources, Governance and Ecology (Special Issue on Life Cycle Assessment in the Terciary Sector). 2005, 4, 178–191. [Google Scholar] [CrossRef]
- Fullana, P.; Gazulla, C.; Clavijo, M.J.; Puerta, M.; Tubilleja, M. Análisis del ciclo de vida del vino de crianza D.O.C. Rioja; Dirección General de Calidad Ambiental, Consejería de Turismo, Medio Ambiente y Política Territorial del Gobierno de La Rioja, 2005. [Google Scholar]
© 2009 by the authors; licensee Molecular Diversity Preservation International, Basel, Switzerland. This article is an open-access article distributed under the terms and conditions of the Creative Commons Attribution license ( http://creativecommons.org/licenses/by/3.0/).
Share and Cite
Penela, A.C.; García-Negro, M.d.C.; Quesada, J.L.D. A Methodological Proposal for Corporate Carbon Footprint and Its Application to a Wine-Producing Company in Galicia, Spain. Sustainability 2009, 1, 302-318. https://doi.org/10.3390/su1020302
Penela AC, García-Negro MdC, Quesada JLD. A Methodological Proposal for Corporate Carbon Footprint and Its Application to a Wine-Producing Company in Galicia, Spain. Sustainability. 2009; 1(2):302-318. https://doi.org/10.3390/su1020302
Chicago/Turabian StylePenela, Adolfo Carballo, María do Carme García-Negro, and Juan Luís Doménech Quesada. 2009. "A Methodological Proposal for Corporate Carbon Footprint and Its Application to a Wine-Producing Company in Galicia, Spain" Sustainability 1, no. 2: 302-318. https://doi.org/10.3390/su1020302