1. Introduction
Physical infrastructure systems, including transportation, water and energy, have a significant impact on the environment, society, and economy from their individual development and operation throughout their lifecycles. Sustainable development, which is a new, multidisciplinary conceptual paradigm in development projects, is attracting a lot of attention throughout the global community [
1]. It is an enhancement of sustainability principles.
Transport infrastructure and services, including ports, roads, railways, and shipping, are essential for global merchandise trade and related supply chains [
2]. Port development is an evolving concept, especially in the modern era [
3]. The United Nations Conference on Trade and Development (as cited in [
2] with reference to UNCTAD, 1994 and 1999) characterizes ports as follows: First generation Cargo Ports, such as container ports for the sole purpose of container handling, developed into Second generation Logistics Ports with broader functionality resulting in transport, commercial and industrial service centres. The Third generation of Supply Chain Management Ports represents a logistic platform for international trade and transport that relies on stakeholder integration and collaboration, and became Globalized E-ports [
4] and world-class Customer-Centric Community Ports representing the next evolutionary steps in the port sector [
5]. Such ports are not only integrated into global information frameworks and standards but are also strongly focused on the requirements of local communities and customers. Hence, acting as social and environmental stakeholders, in addition to economic for the latter. Megatrends of speed, scale, smartness, safety, sustainability and empirical studies of Fifth- and Fourth-generation models by multiple case studies of major ports focusing on container ports [
6] put forth the concept of updated Fifth-Generation Port [
4,
7,
8]. A fifth-generation port should be capable of dealing with community issues in a sustainable and structured way. In other words, sustainability entitles ports to attain a certain level of dynamics to perform beyond the established standards to satisfy the needs of its local community and customers [
5].
The European Sea Ports Organisation (ESPO), the representative body of the port authorities, port associations and port administrations of the seaports of European Union and of Norway, sets forth a general framework for port authorities to respond to their environmental challenges under 5Es; Exemplify, Enable, Encourage, Engage and Enforce [
9]. The incentive behind the framework is to achieve a positive impact through cooperation and mutual understanding, united with the principle of self-regulation. Furthermore, ESPO, together with EcoPorts, the main environmental initiative of the European port sector, monitors the top environmental priorities of European port authorities.
Historically, achieving structural durability and suitable capacity were the objectives in infrastructure development [
1]. Later, the focus shifted to maximizing economic benefit, in addition to previous considerations due to budget constraints [
10]. Nowadays, social and environmental dimensions are recognized as being on par with the economic factor for constructing infrastructure projects. Human society evolves and pursues a higher level of living standard, hence, the concept of sustainable development was introduced as a new approach in modern society.
As defined by former Norwegian Prime Minister, Gro Harlen Brundtland [
11], sustainable development is “meeting the needs of the present generation without compromising the ability of future generations to meet their own needs.”
In Scandinavia, considerable focus is on large, long-term public investment being environmentally-friendly and dealing with economic, social and environmental challenges, while academia aims at constructing a conceptual framework integrating the organizational relationships between supply chain and port stakeholders based on the theoretical background concerning the strategic management and the socially responsible marketing. However, no empirical studies have been conducted of the port development projects in urban areas of Scandinavia for the purpose of applying ex ante sustainability assessment model. This research will follow up this sustainable focus and investigate whether strategic decision-makers at major port infrastructure development projects prioritize, what they prioritize and how they prioritize decisions regarding natural resources used, emission to soil and water, air pollution, construction material quality, land price, infrastructure cost, employment, state revenue etc. that are consolidated into an environmental, economic and social factor.
The lack of proper infrastructure, including ports and terminals, can mean the difference between sustainable progress and persistent under-development [
12]. In 2006, the International Organization for Standardization attempted to establish frameworks seeking sustainable building through indexes, dimensions and sustainability indicators although presenting general standards. The research literature on sustainable development was focused on conceptual development for sustainability and only recently concern has shifted to an empirical level [
1].
A decision-making process demands comprehensive and reliable assessment models. According to Bueno, et al. [
13], current approaches for project assessment can be categorized into three groups:
Traditional decision-making techniques that cover, inter alia, cost-benefit analysis (CBA), multi-criteria decision analysis (MCDA), life-cycle assessment (LCA) and social life-cycle assessment. They alone do not address the scope of sustainability—an environmental, social and economic factor—at the same time and are subjective.
Sustainability rating systems that grade and score infrastructure projects. They are applicable to compare and rank projects, but they are biased towards environmental assessment and the construction stage of the project.
Frameworks, guidelines and models used to perform the sustainability appraisal. In contrast with rating systems and tools, frameworks are not designed to help planners in decision-making process select the most sustainable alternative.
A review of sustainability assessment tools has been conducted (see
Table A1) that have several ways of approaching sustainability [
14]. One of the approaches is “binary view”, when a project or a criterion is either sustainable or not and another approach is to rank sustainability from the highest to the lowest. One sustainability assessment method for master planning projects, infrastructure and buildings is
Building Research Establishment Environmental Assessment Method (
BREEAM), developed by the Building Research Establishment and consultants, was the first assessment and rating system (6 levels from Outstanding to Unsatisfied) implemented and has served as a blueprint for many other systems, such as HK-BEAM in Hong Kong. Aspects of BREEAM also served as a model for the Green Building Council (GBC) framework. A new 6000 m
2. extension to the 15,000 m
2. dockside warehouse facility was constructed at the Port of Southampton, UK, under BREAM New Construction certification.
Leadership in Energy and Environmental Design (
LEED) is a framework used in building development and a globally recognized certification of sustainability [
15] with four Performance Score and Certification Levels (Certified, Silver, Gold and Platinum). LEED for new constructions has been used in the Port of Long Beach. Norwegian
EcoProfile, French
ESCALE, Swedish
EcoEffect are systems for commercial buildings assessment.
Green Star was developed to accommodate the functional needs of buildings in hot climates where cooling systems and solar shading are vital.
Civil Engineering Environmental Quality Assessment and Award Scheme (
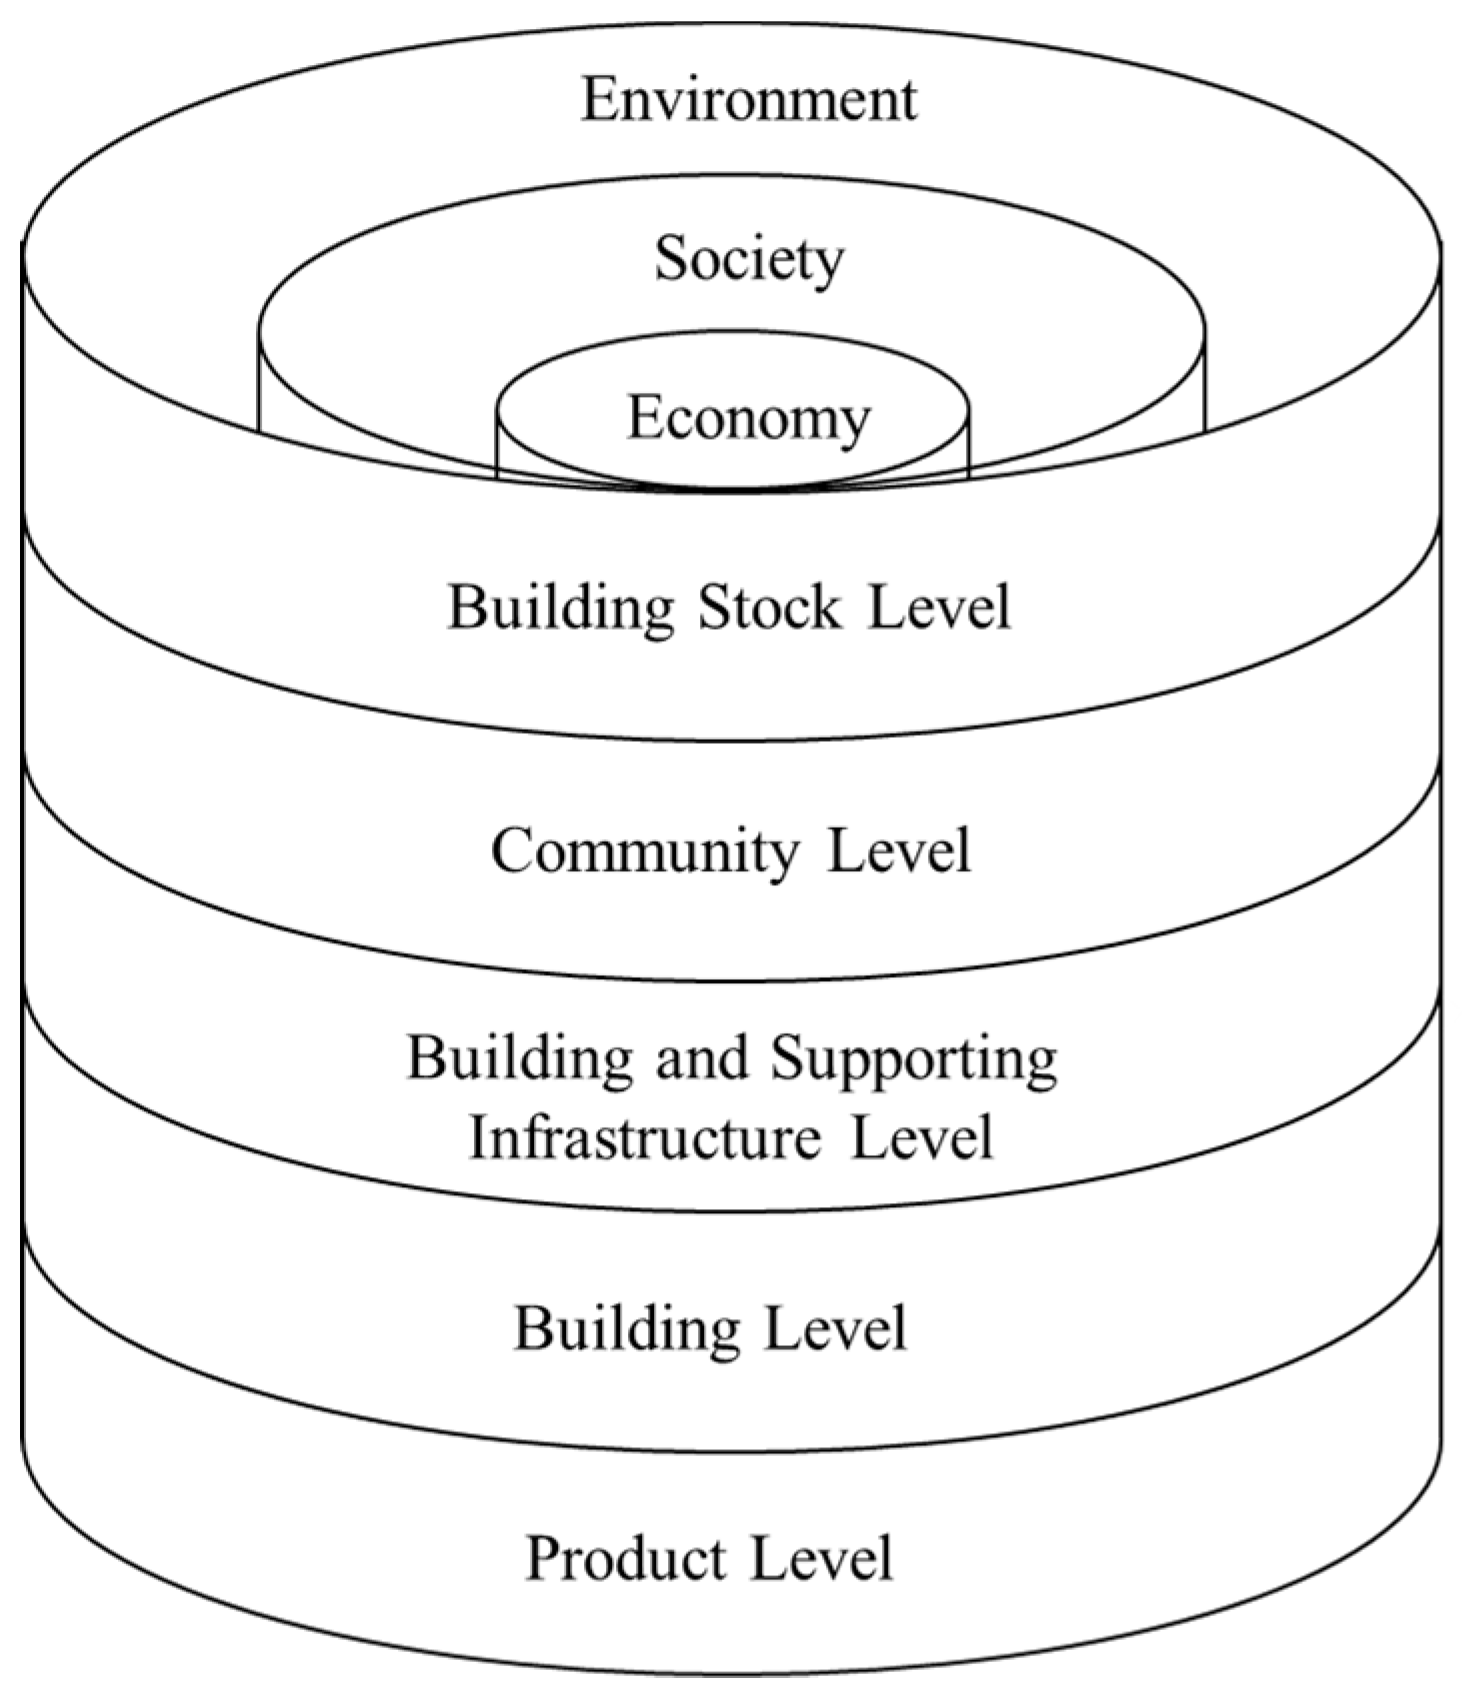
CEEQUAL) is an assessment and awards scheme for civil engineering projects (design and construction) evaluating areas of environmental and social concerns qualitatively with checklists. Current systems address the product (material) and/or building level. There is hardly any consideration of the building and supporting infrastructure, community, or building stock levels (see
Figure 1) as defined by International Energy Agency (IEA) in Todd, et al. [
16].
Whereas the Sustainability Assessment Model for physical infrastructure system development on a practical level is still in its early stage, modelling examples that include
Infrastructure sustainability indicators by Fernández-Sánchez and Rodríguez-López [
17] is a methodology to identify, classify and prioritize sustainability indicators based on risk management standards and is an initial step (pre-assessment stage) towards developing a set of indicators for sustainability assessment.
Sustainability Appraisal in Infrastructure Projects (
SUSAIP) developed by Ugwu, et al. [
18] is used for sustainability assessment on the project level, taking into account project phases such as: design, construction, operation and decommissioning. A framework using a multi-layered or multi-staged approach to
Civil Infrastructure System (
CIS) indicators by Dasgupta and Tam [
19] resolves a set of environmental and technical indicators into a single technical sustainability index (TSI). This framework is overarched by mandatory screening indicators (MSIs) that cover regulatory indicators (RIs). As cited in Rodríguez López and Fernández Sánchez [
14],
Index of Structures’ Contribution to Sustainability (
ICES) is “based on the Environmental Sensitivity Index (ISMA) with social and life variables”. The original article by Aguado [
20] is in Spanish and thus cannot be verified.
Other assessment frameworks include a comparative methodology to assess port long-term management plans on the level of sustainable port and port-city development by Schipper, et al. [
21] with a retrospective approach; assessment of port sustainability thorough synthetic indexes by Laxe, et al. [
22] with a scope of economic, institutional, environmental and social dimensions; an index-based approach by Umer, et al. [
23] that links sustainability indicators and objectives to assess roadway sustainability based on fuzzy synthetic valuation technique.
The primary purpose of a sustainability assessment model is to appraise and facilitate the decision-making process. At this
ex ante stage, decision-makers have the greatest influence on the future sustainability performance of the project [
13].
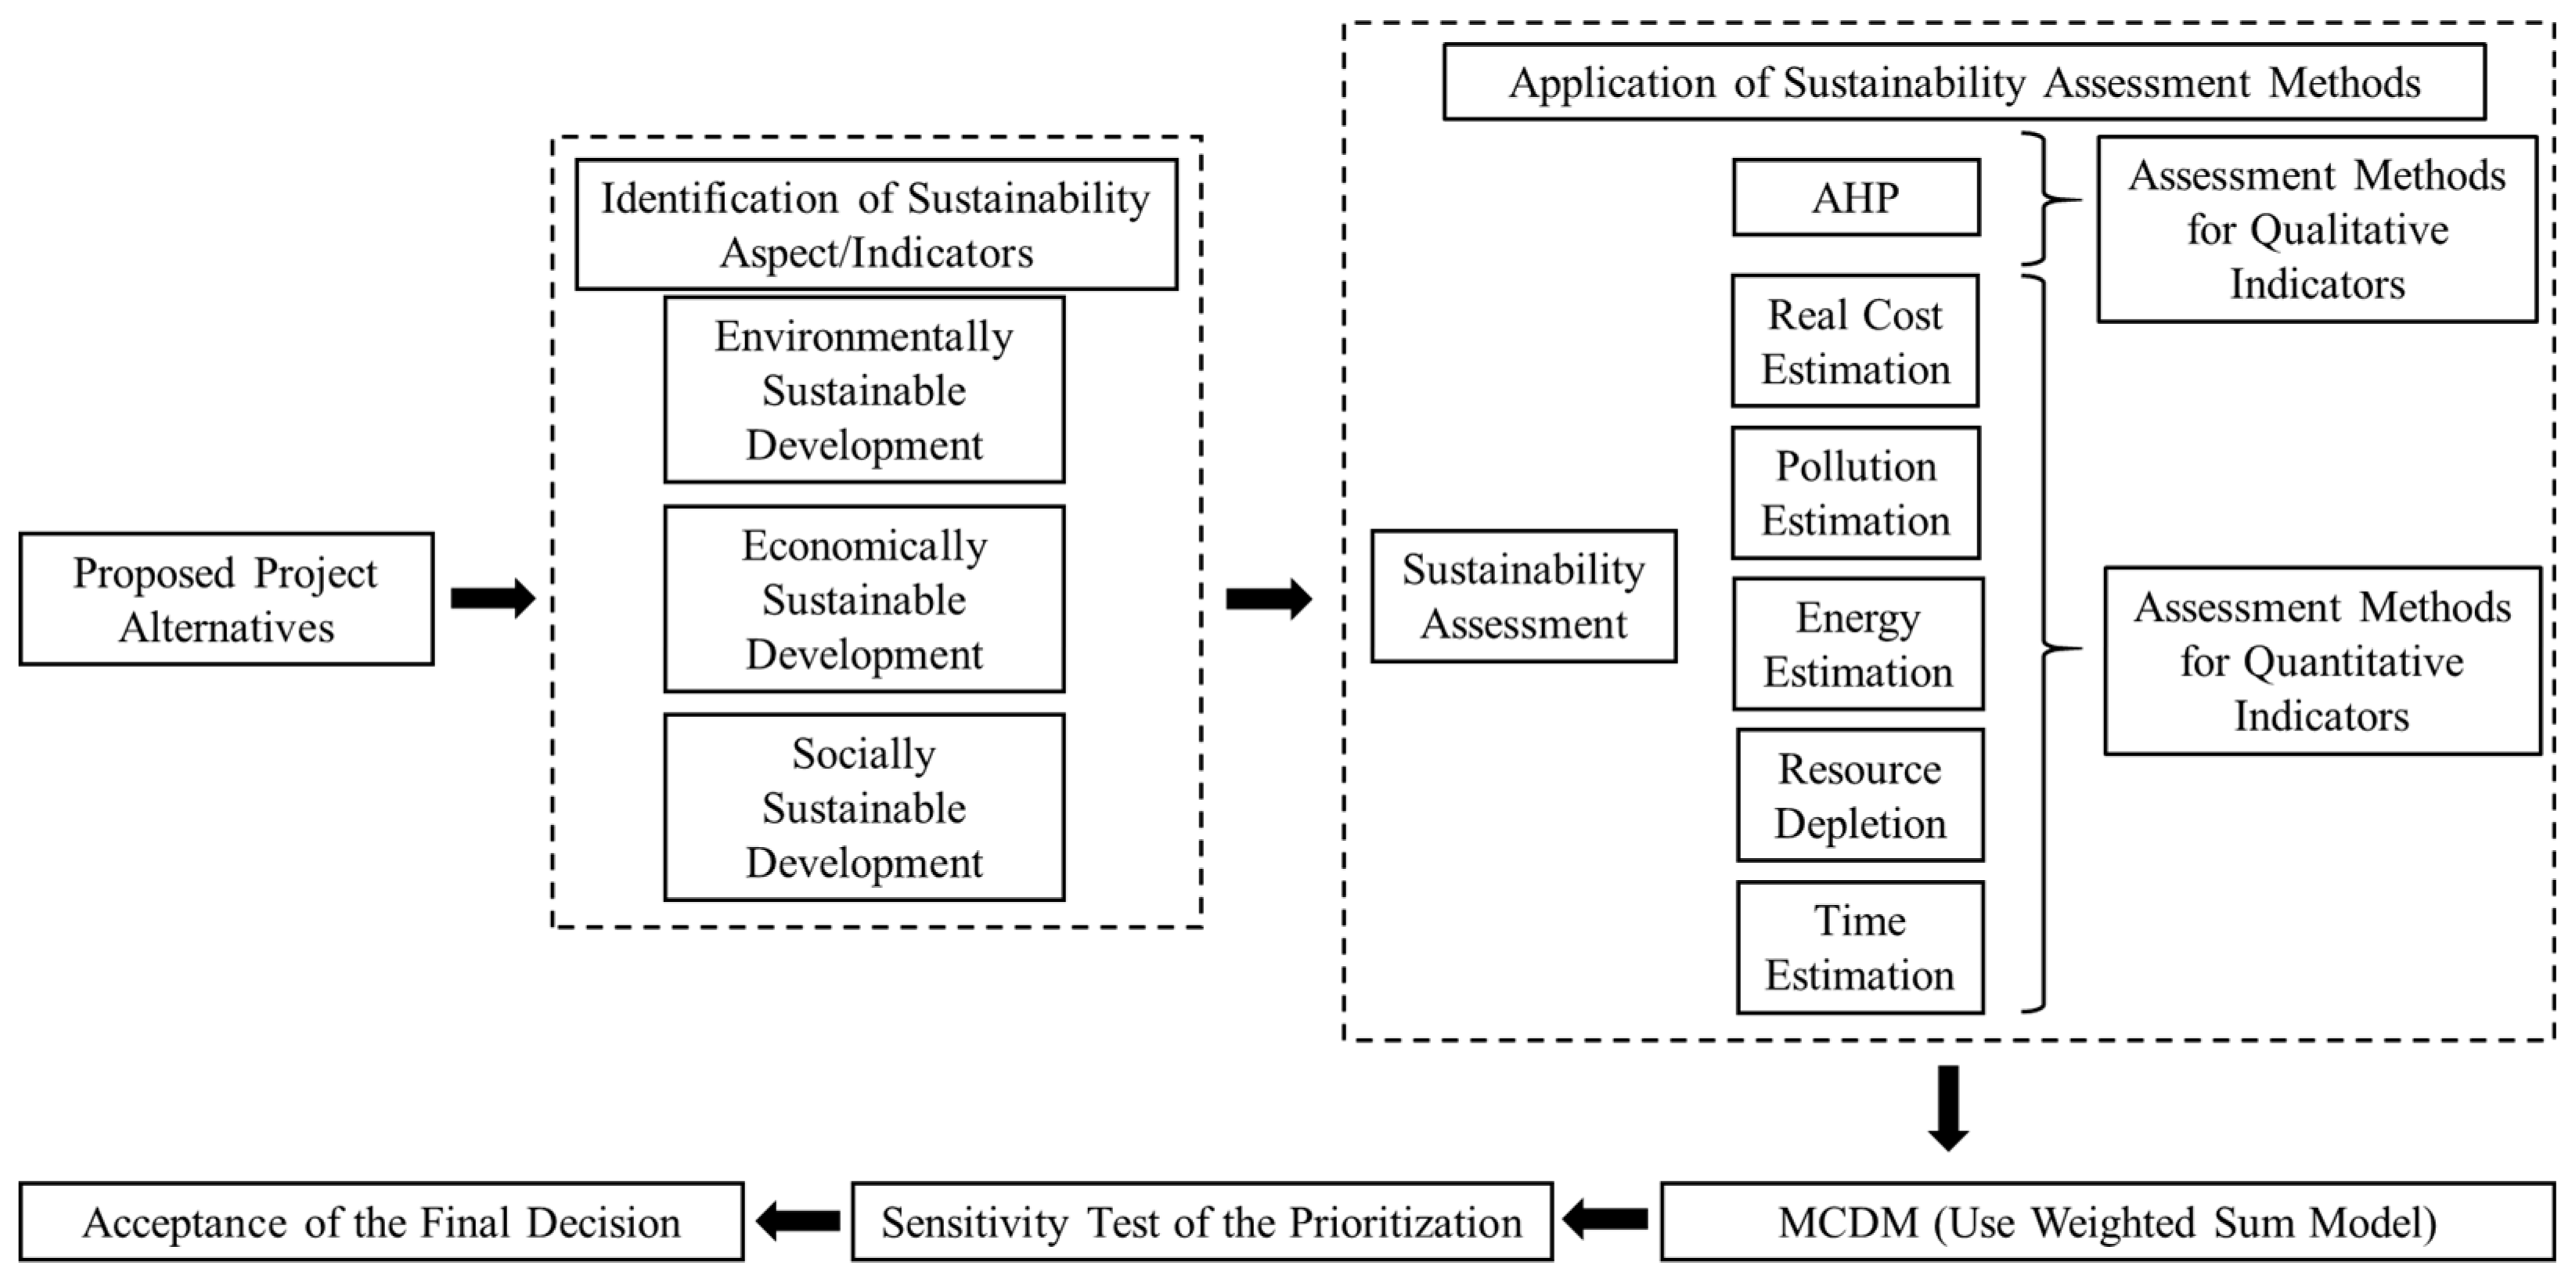
Sustainability Assessment Model (
SAM), a modelling framework developed by Koo and Ariaratnam [
1] for use when multiple alternatives are possible for a project (
Figure 2) where
‘various aspects and interests related to sustainability in project development are translated into sustainability indicators’ [
1] addresses both the level—community level—and the scope—environmental, social and economic dimensions, of the present case study. Based on The Analytic Hierarchy Process (AHP), introduced by Thomas Saaty in 1980, this model is an effective tool for dealing with complex decision-making process, and may help the decision-maker to set priorities and make the best decision. Thus, this framework combines both appraisal and a decision-making process that fits the design of the case-study. Moreover, AHP is one of the easiest multi criteria decision analysis methods in respect to ten crucial criteria that sustainability assessments tools should satisfy, among which are a life cycle perspective, thresholds and uncertainty management, software support and ease of use [
24].
Infrastructure sustainability can be assessed by focusing on the (1) development stage or (2) systemic sustainability performance during the life cycle [
1]. It is also possible to combine these approaches in order to achieve an assessment of the entire sustainability of the development project such as a terminal development project. The sustainability assessment method applied in this paper aims at being deployed on the project level. This case study focuses on a sustainability assessment of a container terminal development project in an urban area in Scandinavia and testing existing sustainability models.
Based on Koo and Ariaratnam [
1] the scope of the research is conducted for a qualitative study and use of AHP. Previously, AHP was used by Nosal and Solecka [
25] for evaluating different variants of urban public transportation integration, while Duleba and Moslem [
26] combined AHP with Kendall rank correlation and an extra level of stakeholder significance. Lyu, et al. [
27] presented an approach to assess the social-economic risks during urban development by integrating strategic environment assessment (SEA) principles into the fuzzy AHP method. Moreover, Duleba and Moslem [
28] have tested Pareto-efficiency on the gained AHP data of 5 × 5 matrix on the local bus service in Mersin, Turkey. The results show small difference (less than 0.3%) between eigenvector and Pareto optimal value. Moreover, a considerable body of prior research has explored port sustainability in various regions, except Scandinavia (Spain: Peris-Mora, et al. [
29]; the EU: Darbra, et al. [
30], Puig, et al. [
31]; Taiwan: Lu, et al. [
32]; Vietnam and Cambodia: Le, et al. [
33]; the UK: Asgari, et al. [
34], Kuznetsov, et al. [
35]; Brazil: Roos and Neto [
36]). The present paper aims to apply an AHP method to support the decision-making process in port development project by: (1) verifying the applicability of a sustainability assessment using a sustainability assessment model for a terminal development project in an urban area of Scandinavia, and (2) validating results against the sustainable models. To use AHP in this case study, a set of key performance indicators or KPIs that fit the purpose is used. These KPIs have been drawn from the literature review in
Appendix B (see
Table A2). The KPIs are organized in three groups and represent three pillars of sustainability: environmental, social and economic factors. This set of indicators forms the basis of the AHP module of the assessment model. Further analysis has been conducted using a Microsoft Excel spreadsheet.
Firstly, the port development project requires the use of heavy equipment that generates noise and air pollution and increases the traffic congestion of the area [
37]. Port activities and shipping have an impact on the surrounding environment due to factors such as noise, greenhouse gas emissions, wastewater (resulting from container cleaning) and other externalities. In addition, a container terminal logistic network generates a large amount of traffic due to the transhipment and transport vehicles that generate greenhouse gases with consequent effects on health and ecosystems. However, the main externalities generated by the road transport include: traffic, the likelihood of accidents, air pollution [
1,
37,
38], noise generated by the heavy traffic, visual pollution and fossil energy consumption (shore power is an example of an alternative source of energy in a port terminal). Consequently ESPO and EcoPorts in their European Port Industry Sustainability Report 2016 and 2017 [
39,
40] place air quality, energy consumption and noise in the top three environmental priorities.
Secondly, the port development project, as well as operation of the port, imposes both a positive effect on society [
38,
41] by employing local residents and generating state revenue and a negative effect by increasing the risk of accidents, injuries or fatalities.
Lastly, eight externalities associated with economic impact [
1,
38,
42] that any port development project entails have been considered. A terminal project demands considerable use of land. In order for it to be sustainable for future development, it should account for expansion involving available land for this purpose. As a result, land price and the land and space available for future development after the project, are of great importance. Another focus is on the quality of construction material, together with the quality of the completed infrastructure. Quality, in its turn, results in the cost of construction and operation.
2. Materials and Methods
Scandinavia is often recognized as a global leader in sustainability [
43] that is rooted in the National Strategy for Sustainable Development [
44], Norway´s Action Plan for Sustainable Development [
45], The Plan for Growth in Blue Denmark [
46] and Norwegian National Transport Plan 2018–2029. Scandinavian companies are highly-rated in different sustainability performance indicators, including the Dow Jones Sustainability Index (DJSI). The Nordic countries overall have performed robustly and well-balanced in environmental, societal and economic matters.
Indications of the growth and development of Container Terminals in symbiosis with the hinterland/cities are the expenditure on the container terminal in Oslo Port [
47], the relocation of container terminal in Kristiansand Port from the town centre to the harbour area at Kongsgård/Vige [
48], an increase in the number of gantry cranes and the extension of container quay in Larvik [
49], the relocation of Bergen Port and a new port to be built in Trondheim.
This research is conducted as a part of the NØKS II (Nærskipsfart I Øresund, Kategatt og Skagerak) project, whose objective is to facilitate a more environmentally-friendly and carbon neutral transport system through the development and improvement of the maritime transport system in the region. An interregional cluster of shipowners, enterprises, ports, institutes, universities, industrial associations and authorities with representatives from Norway, Sweden and Denmark has initiated the project. Six decision-makers for projects in Scandinavian Ports in urban areas were selected for the case study from this network. In terms of this study, a decision-maker is a stakeholder delegated to make decisions within the scope of the given project.
Kristiansand Port aspires to advance from a Fourth Generation to a Fifth Generation Port. As a result, the port relocates its container terminal outside the town [
50] where several potential terminal projects exist. This development project forms the basis of the current case study. The objectives of this study are to support the decision-making process in port development project by: (1) verifying the applicability of a sustainability assessment using a sustainability assessment model for a terminal development project in an urban area of Scandinavia, and (2) validating results against the sustainable models. Numerous indicators (see
Appendix B) were found from a literature review of sustainability assessment models (including, but not limited to [
1,
37,
38,
41,
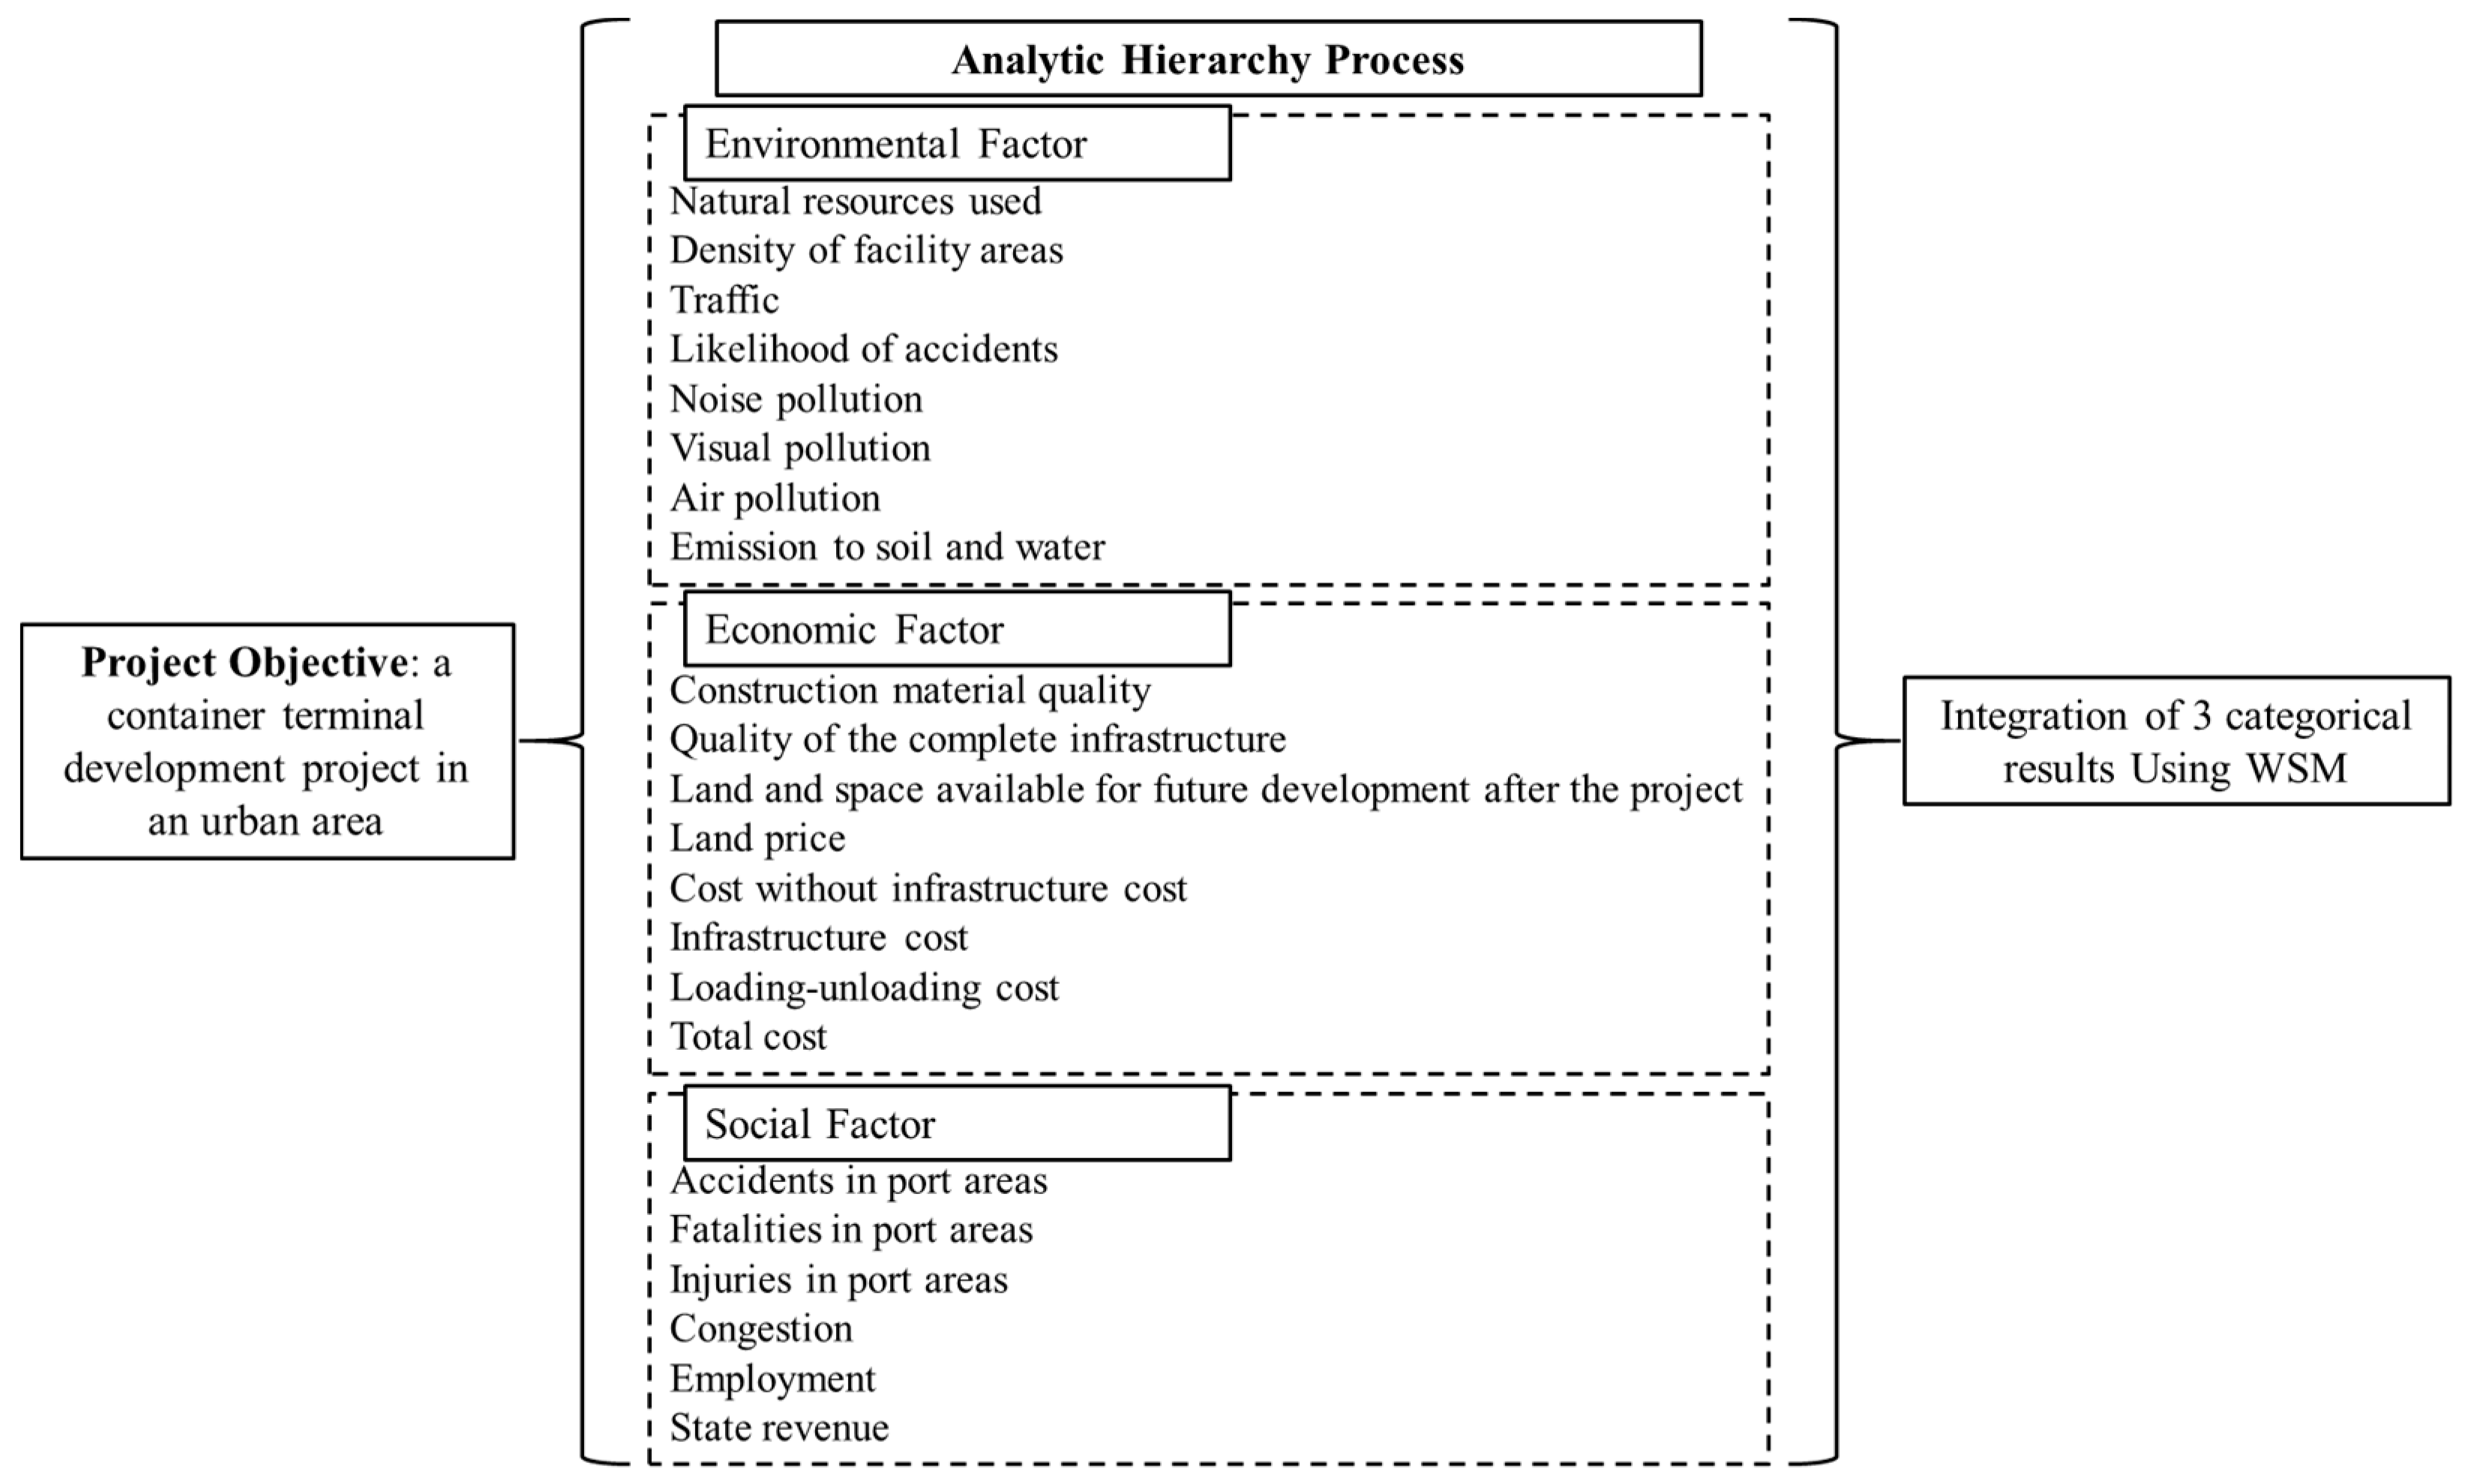
42]. To adapt to the level of a container terminal project required specific requirements to be determined. These requirements differ significantly from infrastructure sustainability of the transport sector due to the scope and content of the decision. Based on the filtered indicators from research literature and in accordance with requirements, a new system of indicators was developed. It comprises eight environmental variables, six social and eight economic. The objective, achievable level, and boundary of sustainable assessment are defined in
Figure 3.
AHP is a multi-criteria decision-making method that uses qualitative sustainable key performance indicators. AHP derives ratio scales from paired comparisons of criteria and allows for some minor inconsistencies in judgment as input data are the subjective opinion of decision-makers. The results of the pairwise comparisons are arranged in a matrix. Mathematically, the method is based on the solution of an eigenvalue problem of
where
N is a matrix of the pairwise comparisons results,
is a scalar or eigenvalue and
is an eigenvector.
The steps of the process were as follows:
The results of the pairwise comparisons are arranged in a matrix.
To determine the eigenvector of the matrix:
where
Sc1,
Sc2 and
Sc3 are sums of the elements in each column.
The first normalized eigenvector of the matrix gives the ratio scale (weighting), the largest eigenvalue determines the consistency ratio or logical conformity among pairwise comparison judgments.
To normalize and calculate first normalized principal eigenvector
:
To square normalized Matrix
and calculate next iteration of eigenvector until difference
is neglectable
To calculate largest eigenvalue
λ:
For a consistent matrix, λ = n, the condition aik = aijajk for all i,j and k does not hold for matrices involving human judgment, such as preferences of decision-makers, as human judgments are inconsistent to a greater or lesser degree. The rank of pairwise comparison can be transitive (if A > B and B > C, then A > C, where A, B and C are ranks of pairwise comparisons) but the values of judgement are not subject to multiplication formula (aik = aijajk) for the judgement to be consistent. In such a case, the ω vector satisfies the equation Nω = λω and λ ≥ n. If λ = n then the judgement is perfectly consistent.
To calculate Consistency Index (
CI), a measure of consistency, as a deviation or degree of consistency using the following formula:
To verify Consistency Ratio (
CR), a comparison of Consistency Index and Random Consistency Index (
RI):
RI (see
Table 1) is an average random consistency index derived from a sample of randomly generated reciprocal matrices using the scale 1/9, 1/8, …, 1, …, 8, 9 i.e.,
CI expected of the matrix of that order. If
CR is less than or equal to 10%, the inconsistency level is acceptable. If the
CR is greater than 10%, then subjective judgements need to be revised.
Geometric consistency index (GCI) is calculated using:
where
pi and
pj are priorities and approximated thresholds
GCI = 0.3147 for
n = 3 and
GCI = 0.37 for
n > 4 [
52].
In order to integrate the factors assessment results and to elicit the final decision priority, the weighted sum model (WSM) is utilized (see
Figure 3). This case study considered two levels, due to the lack of project specifications: 1st level: environmental, social and economic dimensions; 2nd level: KPI for environmental, social and economic dimensions.
From the research in the area of transport and physical infrastructure sustainability Awad-Núñez, González-Cancelas, Soler-Flores and Camarero-Orive [
42], A.P. Møller-Mærsk [
41], Koo and Ariaratnam [
1], Palacio, Adenso-Díaz and Lozano [
37] and Simongáti [
38] a set of variables for this research is presented in
Table A2. These 22 variables or criteria are categorized into: environmental factor, social factor and economic factor. Each of the variables can be considered as either
a benefit, when a higher value is better, or
a cost, when a lower value is preferable. This section may be divided by subheadings. It should provide a concise and precise description of the experimental results, their interpretation as well as the experimental conclusions that can be drawn.
4. Discussion
This section discusses the results of the case study with regard to the existing sustainability models. There are three sustainability models to conceptualize features of a sustainable society.
“3-legged stool model” or “three pillars of sustainable development” is
“a simple way of picturing sustainable development is to think of it as a stool with three legs, representing the environment, the economy and society. If any leg is more or less important (i.e., shorter or longer) than the others, the stool will be unstable (but perhaps still usable—at least for a while). If any leg is missing, the stool simply will not work. But if all three legs are the same length (i.e., environmental, economic and social considerations have been given equal weight), the result will be a well-balanced stool which will serve its purpose indefinitely—a sustainable stool”.
The downside of this metaphor is that the economic, environmental, and social legs look separate and equal (see
Figure 4). Dawe and Ryan [
53] in their paper argue that the environment is
“the floor upon which the stool, or any sustainable development model, must stand” as the economic and social dimensions are obsolete without it.
Figure 4 proves that the longest leg is economic, while environmental is the second longest and social is the shortest, thus resulting in its failing to be sustainable.
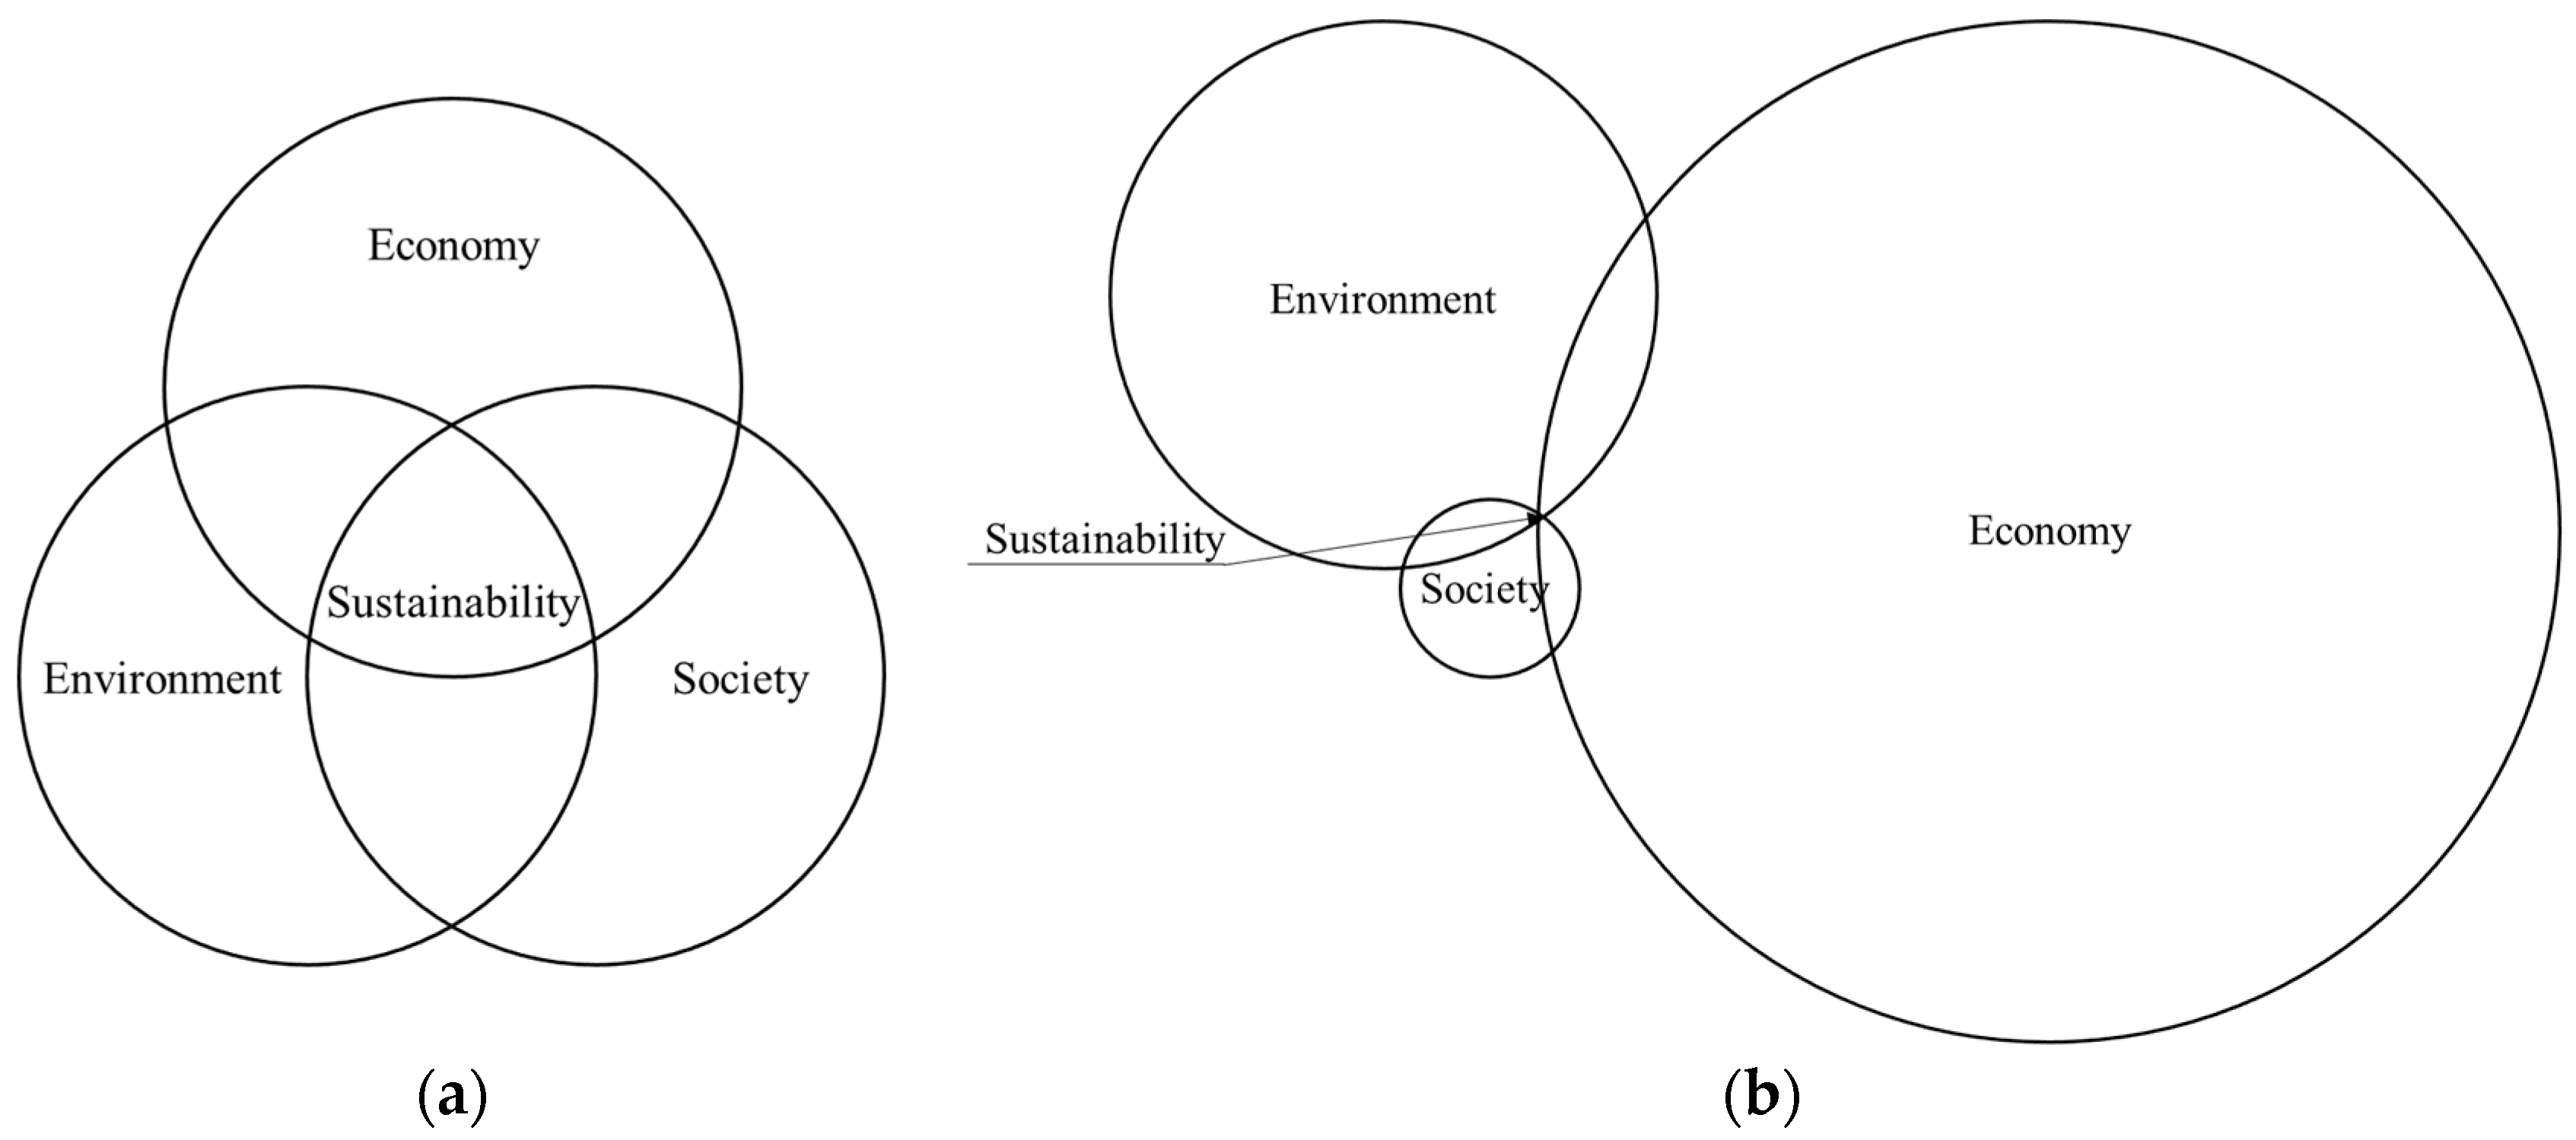
“3-overlapping-circles model” of sustainability recognizes the intersection of economic, environmental, and social factors (see
Figure 5). Depending on the perspective, any circle can be re-sized in order to show that one factor is more dominant than the other two. For example, some business leaders prefer to show the economy as the largest circle since it is crucial for their business success. Society depicts their customers and other major stakeholders and is the second largest circle. The environment is the smallest because it is the most external to standard business metrics. Results of the case study indicate the dominant importance of economic factor making it the largest circle (
Figure 5b) and proving that container ports and terminals are to be a for-profit corporation. Environment reflects the impact that the project bears and the importance of it for decision-makers. Society represents the marginal changes that are caused to the local society such as employment, state revenue, injuries and fatalities in the port area. Unfortunately, this model implies that the economy exists independently of society and the environment. This large incongruity leads to the following more accurate model.
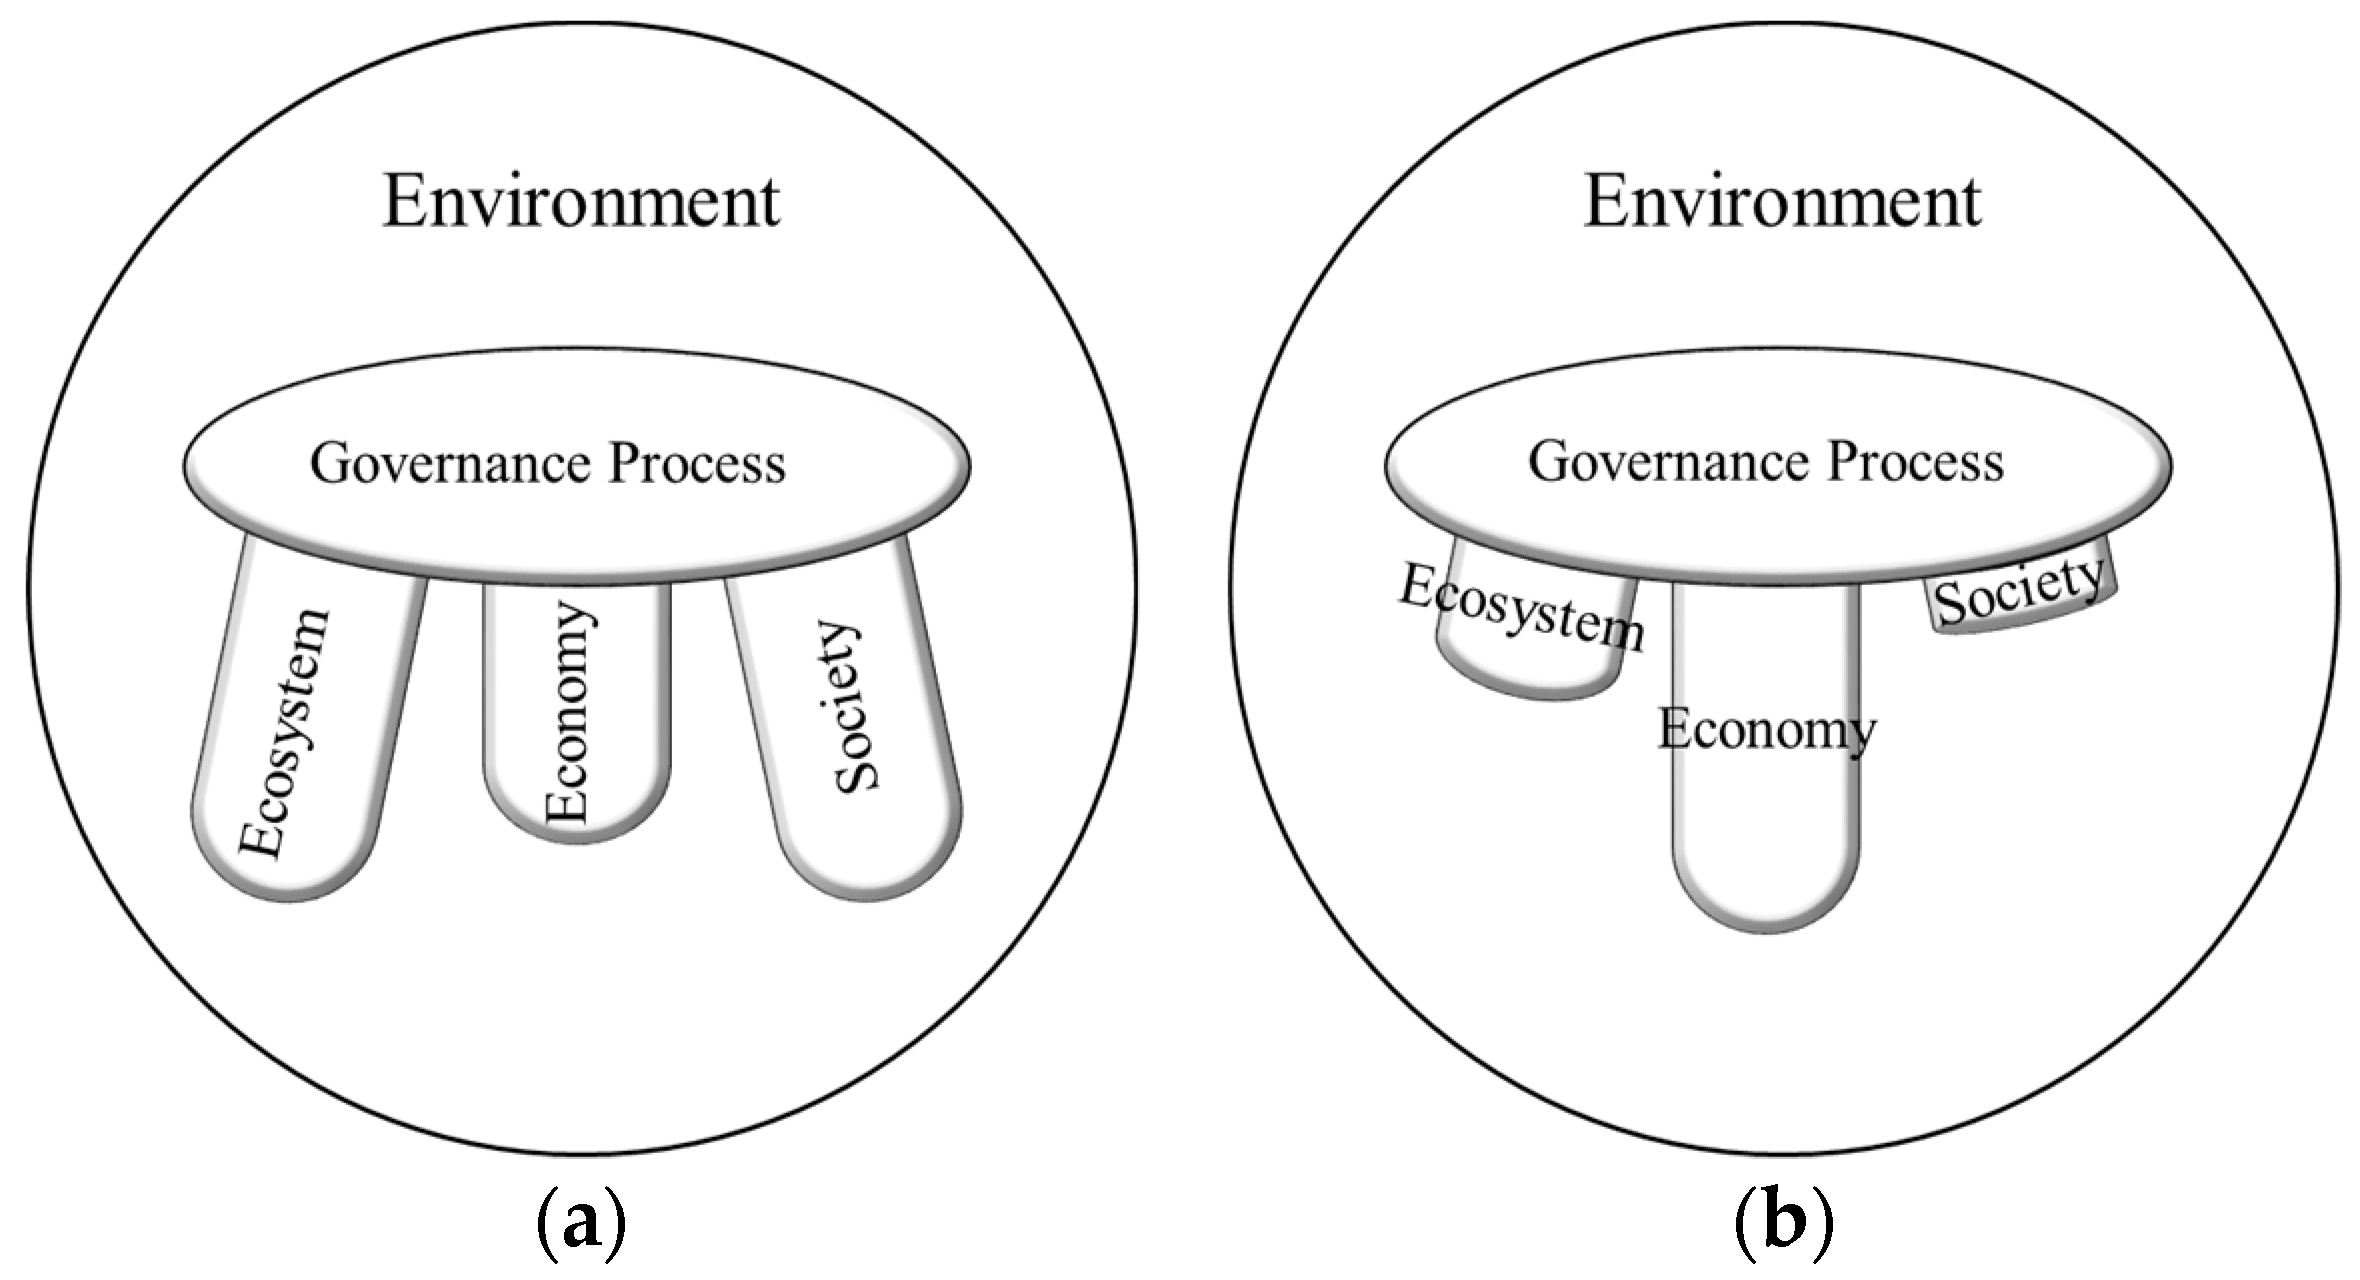
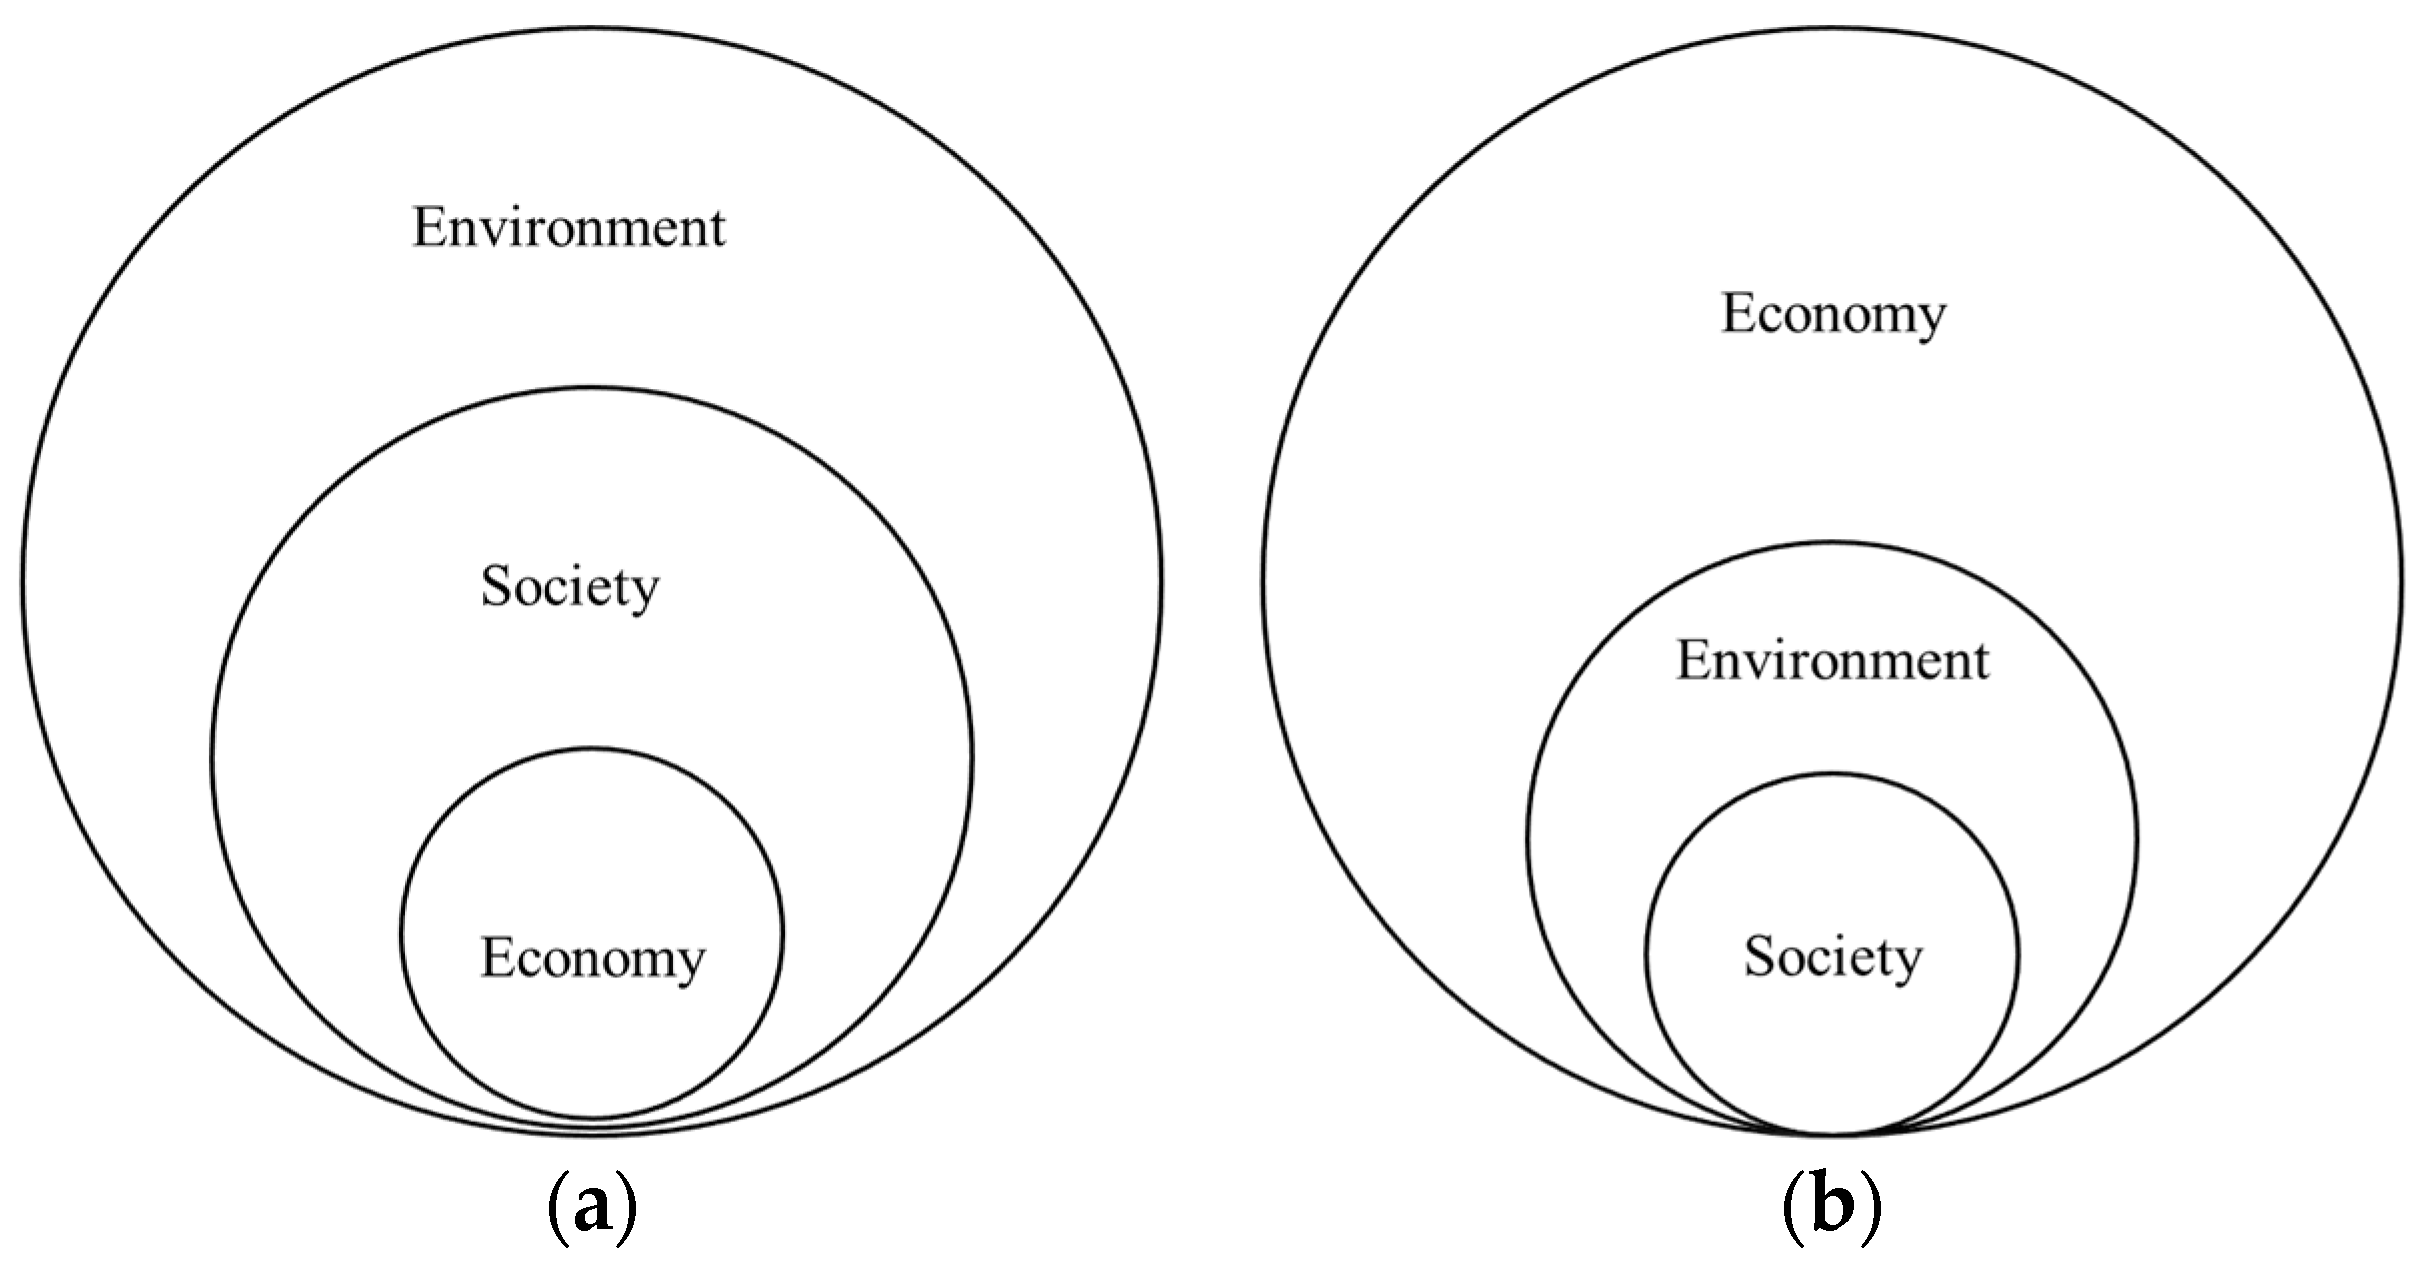
3-nested-dependencies model reflects a co-dependent reality that is true for the maritime sector. Any accident occurring in the open sea or the port area has an environmental, social and economic impact
Figure 6 shows that human society is a wholly-owned subsidiary of the environment. The 3-nested-dependencies model reflects this reality. Nevertheless, the empirical testing of the model proves that the economic benefit lays a foundation for both social and environmental factors.
The process of turning strategic sustainability objectives into concrete action at project-specific levels is a difficult task [
18]. As a result, the layout of the conceptual sustainability models and the case-study outcome are in conflict with each other. Thus, qualitative research has proved that despite the fact that the topic of sustainable development, as well as environmental issues, is gaining popularity, a decision-maker’s strategic priority remains to be the economic factor. The total cost of the project is given the leading strategic priority by the participants of this study, followed by likelihood of accidents and land and space available for future expansion.
A similar case study of the UK ports has been done by Asgari, Hassani, Jones and Nguye [
34] where five largest ports: Tees and Hartlepool, London, Grimsby and Immingham, Southampton, and Milford Haven were studied regarding port efforts in sustainable development with respect to environmental and economic aspects. Regarding the evaluation by ten managers and logistics experts, where two of them were academic logistics experts, the environmental aspect has higher priority than economic aspect in the ranking with a mean weight of 52.95%. The disparity between findings of two cases point to the uniqueness of ports, including their size, location, scope of the cases and decision-makers’ background.
Regarding the case result of the AHP method, it is no surprise that the emphasis is on money, followed by minimizing the risk of accidents in the port area and maximizing available land areas for future development projects.
In a Scandinavian context, a port is often the property of the municipality and thus publicly owned. Hence, the port is often regarded as an operational entity designed to support economically a major municipal service. At the same time, decision-makers must adapt their choices and decisions to meet the expectations of good working conditions in developed countries, as they are in Scandinavia. Since making decisions about the future incurs great risk, the choice of port project with longevity should also be seen in relation to future opportunities. The maritime sector is undergoing a lot of innovation that creates uncertainty for investment, so there is a focus on minimizing the impact of placing infrastructure in the port system.
However, if decision-makers of major infrastructure investment projects in publicly-owned ports shall support the United Nations sustainable development goals and sustainable development in general, the case result indicated that ports need to become more independent. Innovation in the maritime sector is very difficult since the sector is very conservative due to the heavy investment in assets and infrastructure. Sustainable development goes hand in hand with innovation, requiring investment in innovation and a focus on innovation, particularly in developed countries. In Scandinavia, innovation is a major challenge and as long as the port remains part of the business ecosystem serving the municipality, the probability of innovation in the port system will be very small.


