Heating, Cooling, and Lighting Energy Demand Simulation Analysis of Kinetic Shading Devices with Automatic Dimming Control for Asian Countries

Department of Architecture, Chungbuk National University, 1 Chungdae-ro, Seowon-Gu, Cheongju, Chungbukdo 28644, Korea
Sustainability 2019, 11(5), 1253; https://doi.org/10.3390/su11051253
Submission received: 19 December 2018
/
Revised: 20 February 2019
/
Accepted: 21 February 2019
/
Published: 27 February 2019
(This article belongs to the Section Energy Sustainability)
Abstract
:Kinetic shading devices have recently been introduced for energy-saving and for their innovative appearance. Quantifiable research on kinetic operation systems is necessary to evaluate their applicability in a specific region. This study developed a theoretical methodology for producing an optimal positioning algorithm targeting minimizing total energy demands of kinetic shading devices; the control algorithms for hourly operation were tested through a combined analysis framework of energy performance simulations and spreadsheet analysis. Two common types of external shading devices, vertical-folding and horizontal-rotating types, were simulated in three Asian cities with different climate conditions. Automatic kinetic operation with a consequential dimming control was simulated on the east, south and west facade of an office building, selecting the optimal position every hour based on total energy demand for heating, cooling, and lighting. Comparative simulation analyses for kinetic operation and fixed shading demonstrated that the energy saving potential of fixed shading was greater than that of kinetic operation shading. Kinetic operation was the most applicable in Seoul, where seasonal optimal operation was required for both types of kinetic shadings. In Abu Dhabi and Hanoi, cooling and lighting energy demands were balanced every hour through kinetic operation. Rotating-type kinetic operation in these two regions resulted in better energy-saving performance. The operation frequency pattern of rotating-type kinetic shading provided more active operation and consequent outperformance over the folding-type.
1. Introduction
The amount of greenhouse gas emissions is rapidly increasing globally, contributing to global climate change. Natural and human systems have proven to be vulnerable to climate change. Thus, prompt resilience actions need to be taken [1]. The International Energy Agency (IEA) reported that building energy consumption in urban areas accounts for the most significant portion (40%) of total global energy consumption. This is predicted to increase by 30% by 2035 [2].
The United Nations Framework Convention on Climate Change (UNFCCC) also recognized that the reduction of building energy consumption is essential for reducing overall energy consumption, organizing the Global Alliance for Buildings and Construction and launching a roadmap for buildings [3]. The IEA emphasized the importance of “Operational Regulations for Building Energy Efficiency Ratings” for energy saving in the building sector [2]. In Asia, urbanization is rapidly progressing. Buildings with glass-curtain-wall type envelopes have become dominant despite the harsh climates. Accordingly, policies for reducing building energy consumption have become more stringent. In Southeast Asian countries (e.g., Singapore, The Philippines, Thailand, Malaysia, and Indonesia), indices such as the Overall Thermal Transfer Value (OTTV) have been introduced to evaluate building energy consumption [4]. Shading, the primary cooling energy reduction measure in the Overall Thermal Transfer Value (OTTV) evaluation, is highly recommended. The Korean government is also advocating installation of shading devices by enacting the Building Energy Consumption Reduction Design Guideline. Installation of shading devices has been made mandatory for public buildings [5]. Meanwhile, kinetic shading devices have been developed to maximize the performance of traditional shading devices to cope with the ever-changing outdoor environment, by adjusting the form of external shading devices according to the position of the sun or climate conditions to minimize the disadvantages of conventional fixed shading devices [6]. While many experimental kinetic shading devices have been developed with a focus on transformative characteristics [7,8], their environmental performance needs to be studied in detail to ensure their applicability and accurate control. Moreover, the benefits of shading devices are determined not only by their thermal performance, but also by their lighting energy reduction. The overall benefit of shading devices should be comprehensively verified based on total energy consumption. Prior research has focused on threshold-type controls which adopted external climate variables (solar position or solar irradiance level) as control agents for kinetic shadings [9,10]. However, an optimal operation algorithm has not been addressed. In this study, the energy-saving potential of optimal kinetic operation was analyzed for three Asian cities (Seoul, Abu Dhabi, and Hanoi), with different climate conditions, to determine the applicability of kinetic shading devices. Three cities have different regional rainy season and winter characteristics: Abu Dhabi has no monsoon and a cold winter season; Seoul has a summer monsoon season and a cold winter season; and Hanoi has a summer monsoon season and a winter rainy season. Optimal operational algorithms for each city were developed. Then, total energy consumption (i.e., for heating, cooling, and lighting) of the different types of kinetic shading devices was comprehensively evaluated for each city, and the applicability of each device was analyzed.
2. Materials
2.1. Performance Criteria for Kinetic Shading Devices
To determine the performance of shading devices, a range of performance criteria have been evaluated in previous studies, including energy consumption, indoor thermal comfort, and indoor visual comfort. Energy consumption has been the prime criterion, with a complementary criterion of qualitative comfort [11]. Researchers have focused on the reduction of cooling energy by applying diverse types of shading devices to a base-case model [12]. Palmero-Marrero and Oliviera [13] and Kim et al. [14] comprehensively analyzed heating and cooling energy reduction through installation of a shading device. Improvement in daylighting performance is another objective of shading devices. The quality of daylighting is evaluated at the same time. Gagne et al. [15], Lim et al. [16], Freewan [17], and Konis [18] have evaluated indoor illuminance levels and assessed indoor visual qualities such as the glare index, uniformity ratio, and occupant satisfaction. In previous work, the overall performance criterion adopted as the objective of an internal shading device was to improve visual comfort. Aste et al. [19] and Manzan [20] e dealt with optimum matching conditions of external shading. Tzempelikos et al. [21], Shen et al. [22], and Aldawoud [23] dealt with the same optimum matching conditions for internal shading.
Since the glass-curtain-wall is the dominant type of envelope for office buildings in Asia, window properties do not need to be applied as moderating variables in this study. This is because this work focuses on the potential benefits of kinetic shading devices for typical office buildings. Meanwhile, a common evaluation platform was proposed to evaluate heating and cooling energy reduction and daylighting potential together. While a comprehensive evaluation standard has not yet been established, the most obvious approach is to evaluate total energy consumption, including heating, cooling, and lighting energy. Integrated control of lighting with an automatic dimming system is a standard mitigating measure that not only reduces artificial lighting energy, but also decreases indoor heat gain from artificial lighting. Tzempelikos et al. [24] controlled shading on a building by developing a device in which the blind started to operate when solar radiation on the window exceeded 20 W/m2. In addition, the artificial lighting was switched off automatically when the indoor illuminance exceeded 500 lux. Olbina et al. [25] analyzed the total energy consumption of a building by controlling indoor energy gain and solar radiation such that five-step dimming was carried out depending on the illuminance level of indoor daylighting using 500 lux as the reference, while the blind system operated when illuminance exceeded 2000 lux. Bellia et al. [26] analyzed lighting energy consumption and total energy consumption by applying a two-step control system a linear dimming and off control system.
The roller-blind type of device applied in the above three studies is easy to simulate compared to kinetic shading devices because its geometric variables do not need to be changed for simulation models. However, appropriate geometric models must be selected for kinetic shading devices in every simulation time step. Therefore, a valid evaluation methodology is needed to model and evaluate kinetic shading devices.
2.2. Design Variables and Operation of Kinetic Shading Devices
The most salient shading device design variables are those that define the shading module, including: the shading type, number of slats, slat length, slat angle, and properties of the slat material. The most common types in shape are vertical and horizontal shadings. Shading installation condition variables have also been frequently adopted in previous studies, including orientation of the external wall on which the shading device is installed, the building envelope installation distance of the shading, and so on. Orientation of the installed windows is also an important variable.
In general, researchers have focused on shading design parameters for regions with hot climates, where energy reduction through shading design was expected to be significant. Bellia et al. [26] analyzed heating, cooling, and lighting energy reduction through shading in three Italian cities and confirmed that the energy reduction rate was the highest in the southern region where the weather was predominantly warm and sunny weather. However, Palmero-Marrero and Oliveira [13] expanded climate types for analysis to moderate climates and compared heating and cooling energy consumption of horizontal and vertical louvers in Mexico City (Mexico), Cairo (Egypt), Lisbon (Portugal), Madrid (Spain), and London (UK). Their results showed that common energy saving effects were found in regions where solar radiation and ambient temperatures were high in summer when cooling was used, while adverse effects of shading devices were found in London. Therefore, the benefits of kinetic shading devices for regions where cooling energy consumption is not predominant also need to be analyzed in order to evaluate the possibility of reducing negative effects of fixed shading devices.
In this study, to review the applicability of kinetic shading devices in Asian regions, climatic conditions, shading type, operation type, and orientation of the kinetic shading were selected as significant modulating variables that could reflect the morphological characteristics of the kinetic shading devices. Regarding shading types, rotating- and folding-type kinetic operations were applied, based on the most common types of horizontal and vertical shading.
Kinetic shading was applied to reduce energy consumption while simultaneously securing optimum daylighting performance by controlling the position and material of the shading device. The term ‘mobile shading’ has also been used to refer to ‘kinetic shading devices’, emphasizing the operability of the shading device. The term, ‘automated shading’, refers to automatic control function related to changes in the environment. Although only a few studies have dealt with the energy performance of kinetic shading, diverse methods have been proposed to evaluate such performance, including numerical study, experimental study, and simulation.
In the case of numerical study, Aste et al. [19] developed an algorithm for a mobile blind for tracking and blocking direct solar radiation. However, the proposed mathematical model has limitations in responding to actual changes in an external environment. Therefore, experimental and simulation studies occupy the majority, applying automatic control systems with an interconnected irradiation sensor that can operate kinetic shading. Lee et al. [9] installed an automated venetian blind interlocked with an external solar flux sensor and analyzed its energy saving potential by operating the blind so that the view to the outside was maximized when there was no direct sunlight. Nielsen et al. [10] reviewed the applicability of dynamic venetian blinds through simulations where the blind was operated either when the internal temperature exceeded a certain setting point, or when there was glare. Artificial lighting was managed by using automatic dimming controlled with an illuminance sensor.
Several prior studies have emphasized the optimal operation of specific criteria such as daylighting performance. However, an ideal model in which efficient overall energy performance is generally achieved (heating, cooling, and lighting) by adapting the system to actual climatic change has not yet been presented. Accordingly, the objectives of this study were to analyze the maximum energy saving potential of ideal kinetic operation systems under different climatic conditions and evaluate their applicability using optimum operation patterns.
3. Design Cases and Performance Analysis Methods
3.1. Climatic Conditions in Abu Dhabi, Hanoi, and Seoul
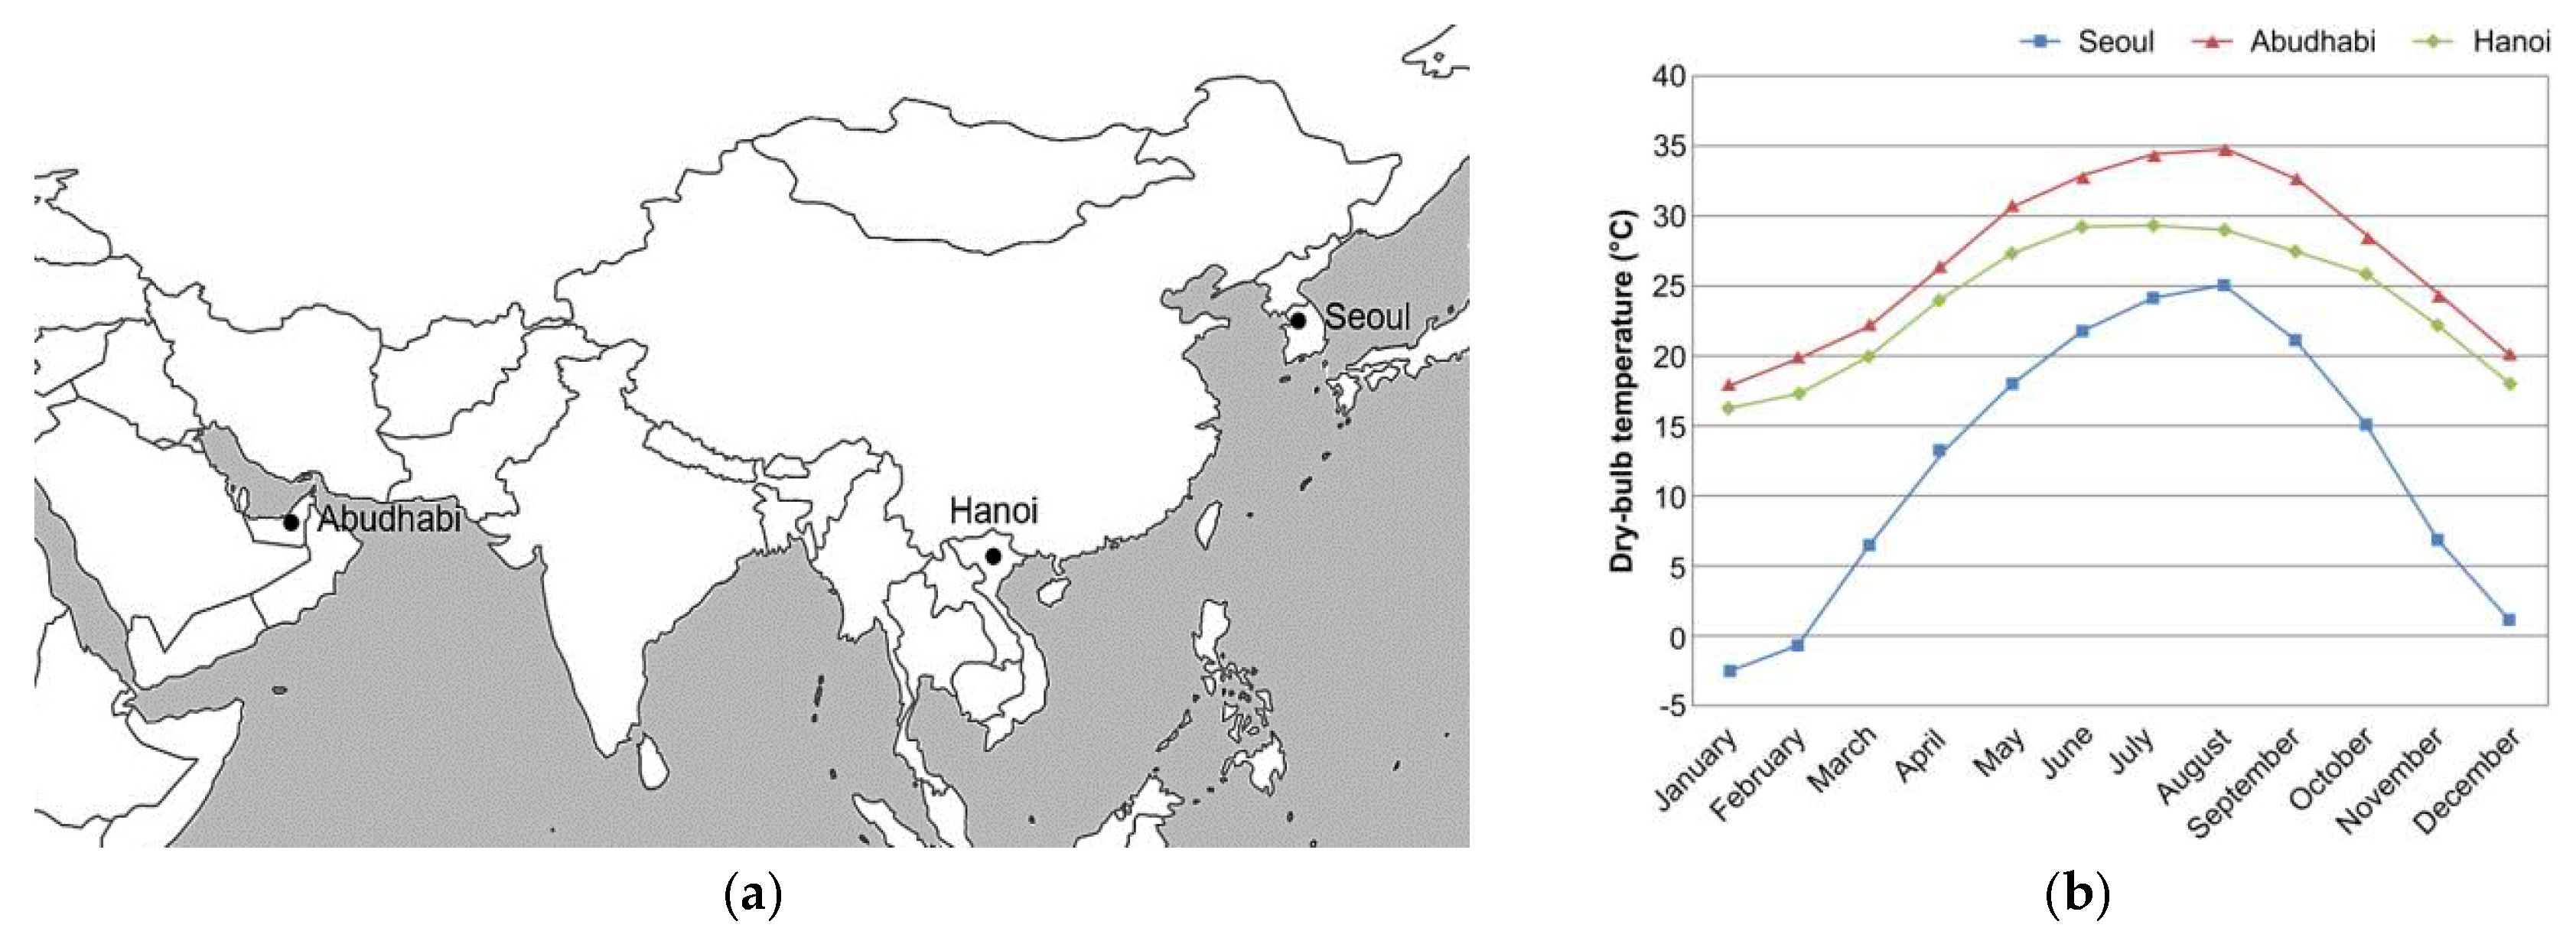
Three Asian cities (Abu Dhabi, Hanoi, and Seoul) with different climatic conditions were selected to determine benefits of kinetic shading devices. The location and monthly average temperature of each city are shown in Figure 1. Seoul showed a wide range of annual temperatures with distinctive seasonal change. The Energy Plus weather data for three cities were used for the study [27]. The average temperature was −2.52 degrees Celsius in the coldest month and 25.70 degrees Celsius in the warmest month. Monthly average temperatures during winter in Abu Dhabi and Hanoi showed that heating energy consumption could be very low. Direct and diffuse solar radiation comparisons of these three cities are shown in Table 1. Yearly average direct and diffuse radiation were 214.46 W/ and 175.09 W/ in Seoul, 523.79 W/ and 119.93 W/ in Abu Dhabi, and 280.39 W/ and 155.99 W/ in Hanoi. Direct radiation was the highest in Abu Dhabi, while diffuse radiation was the highest in Seoul. Direct radiation was shown to be noticeably low from June to September in Seoul and from April to October in Hanoi due to the rainy season.
3.2. Types of Kinetic Shading and Simulation Conditions
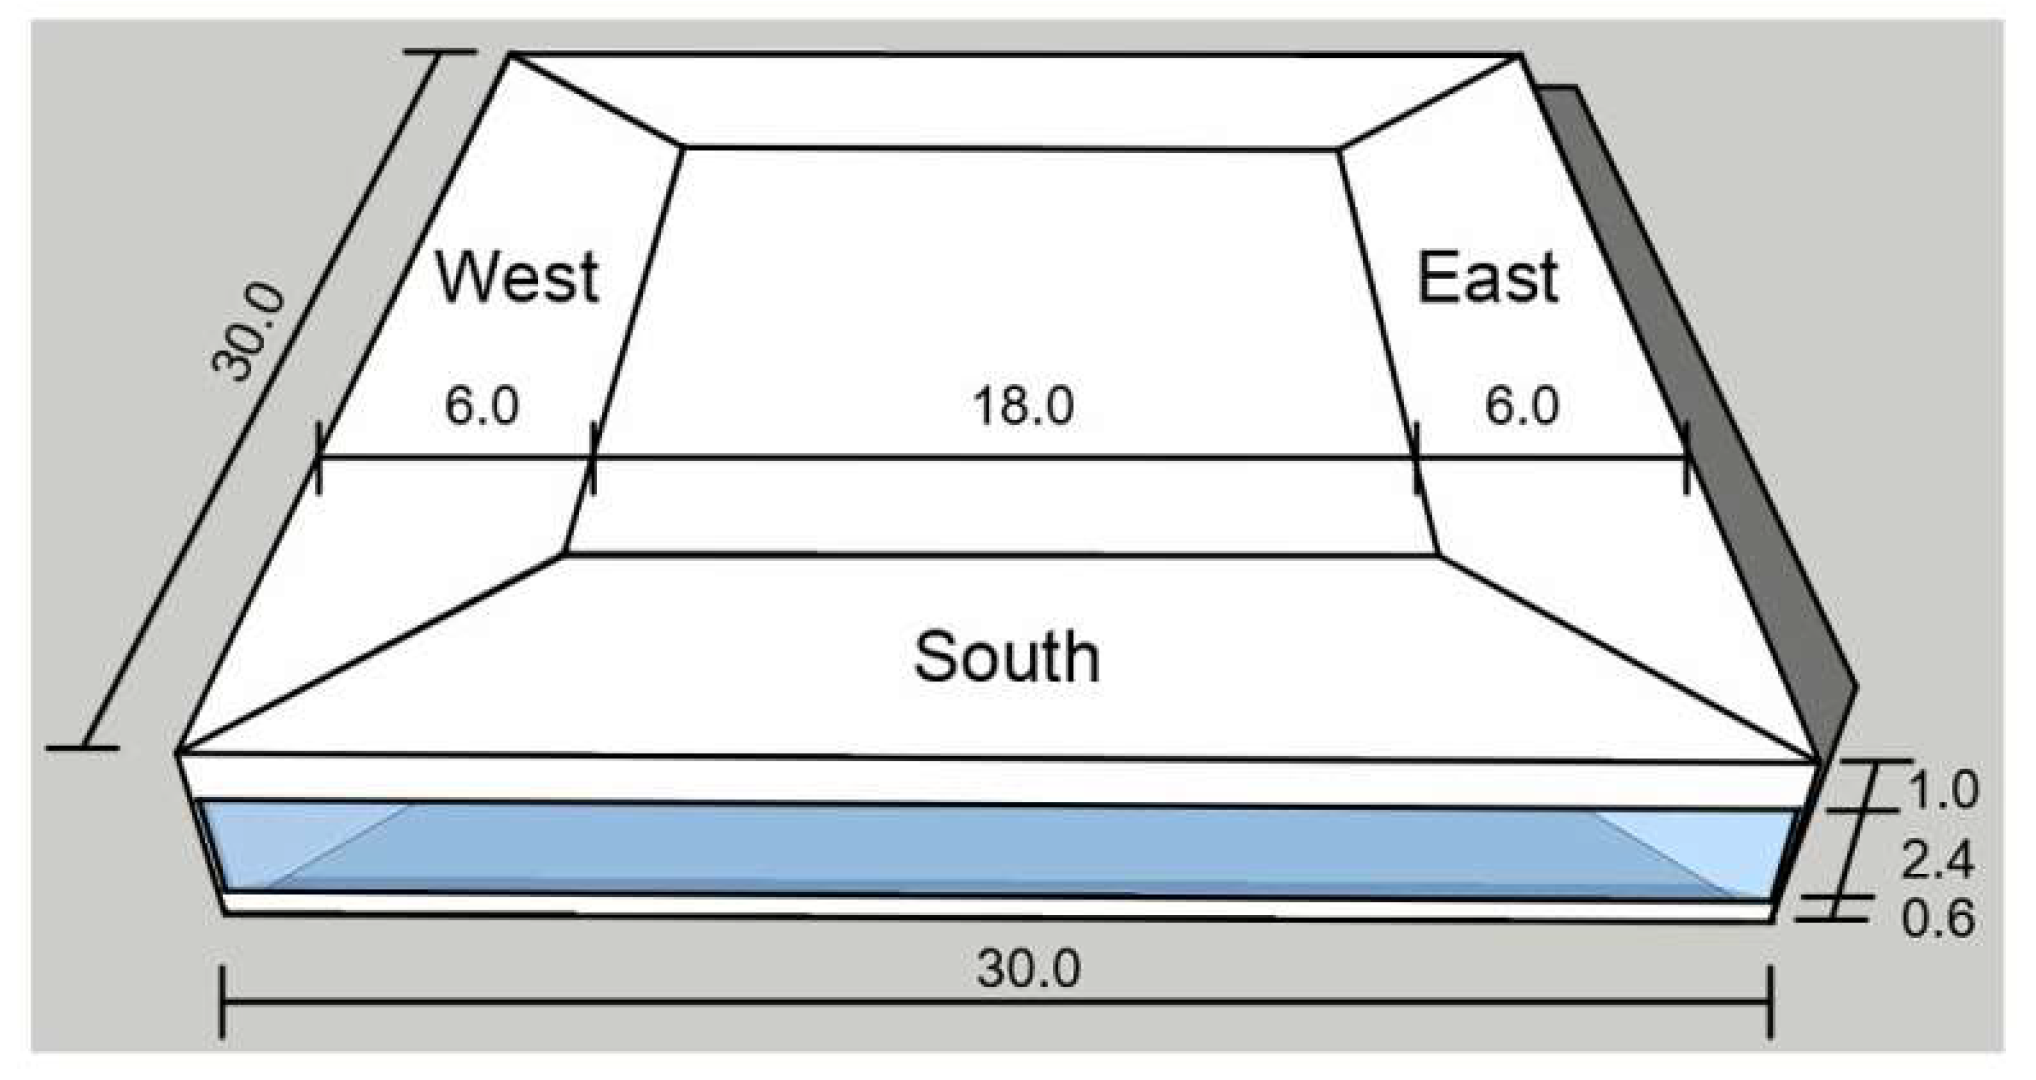
External kinetic shading devices were simulated on the east, west, and south walls of a 30-meter rectangular office, as shown in Figure 2, for comparative evaluation. The perimeter zone of each orientation, six meters from the office envelope, was set as the object of heating, cooling, and lighting energy simulation. The window area was the same in each orientation. The window-to-wall ratio was also equal (56.8%).
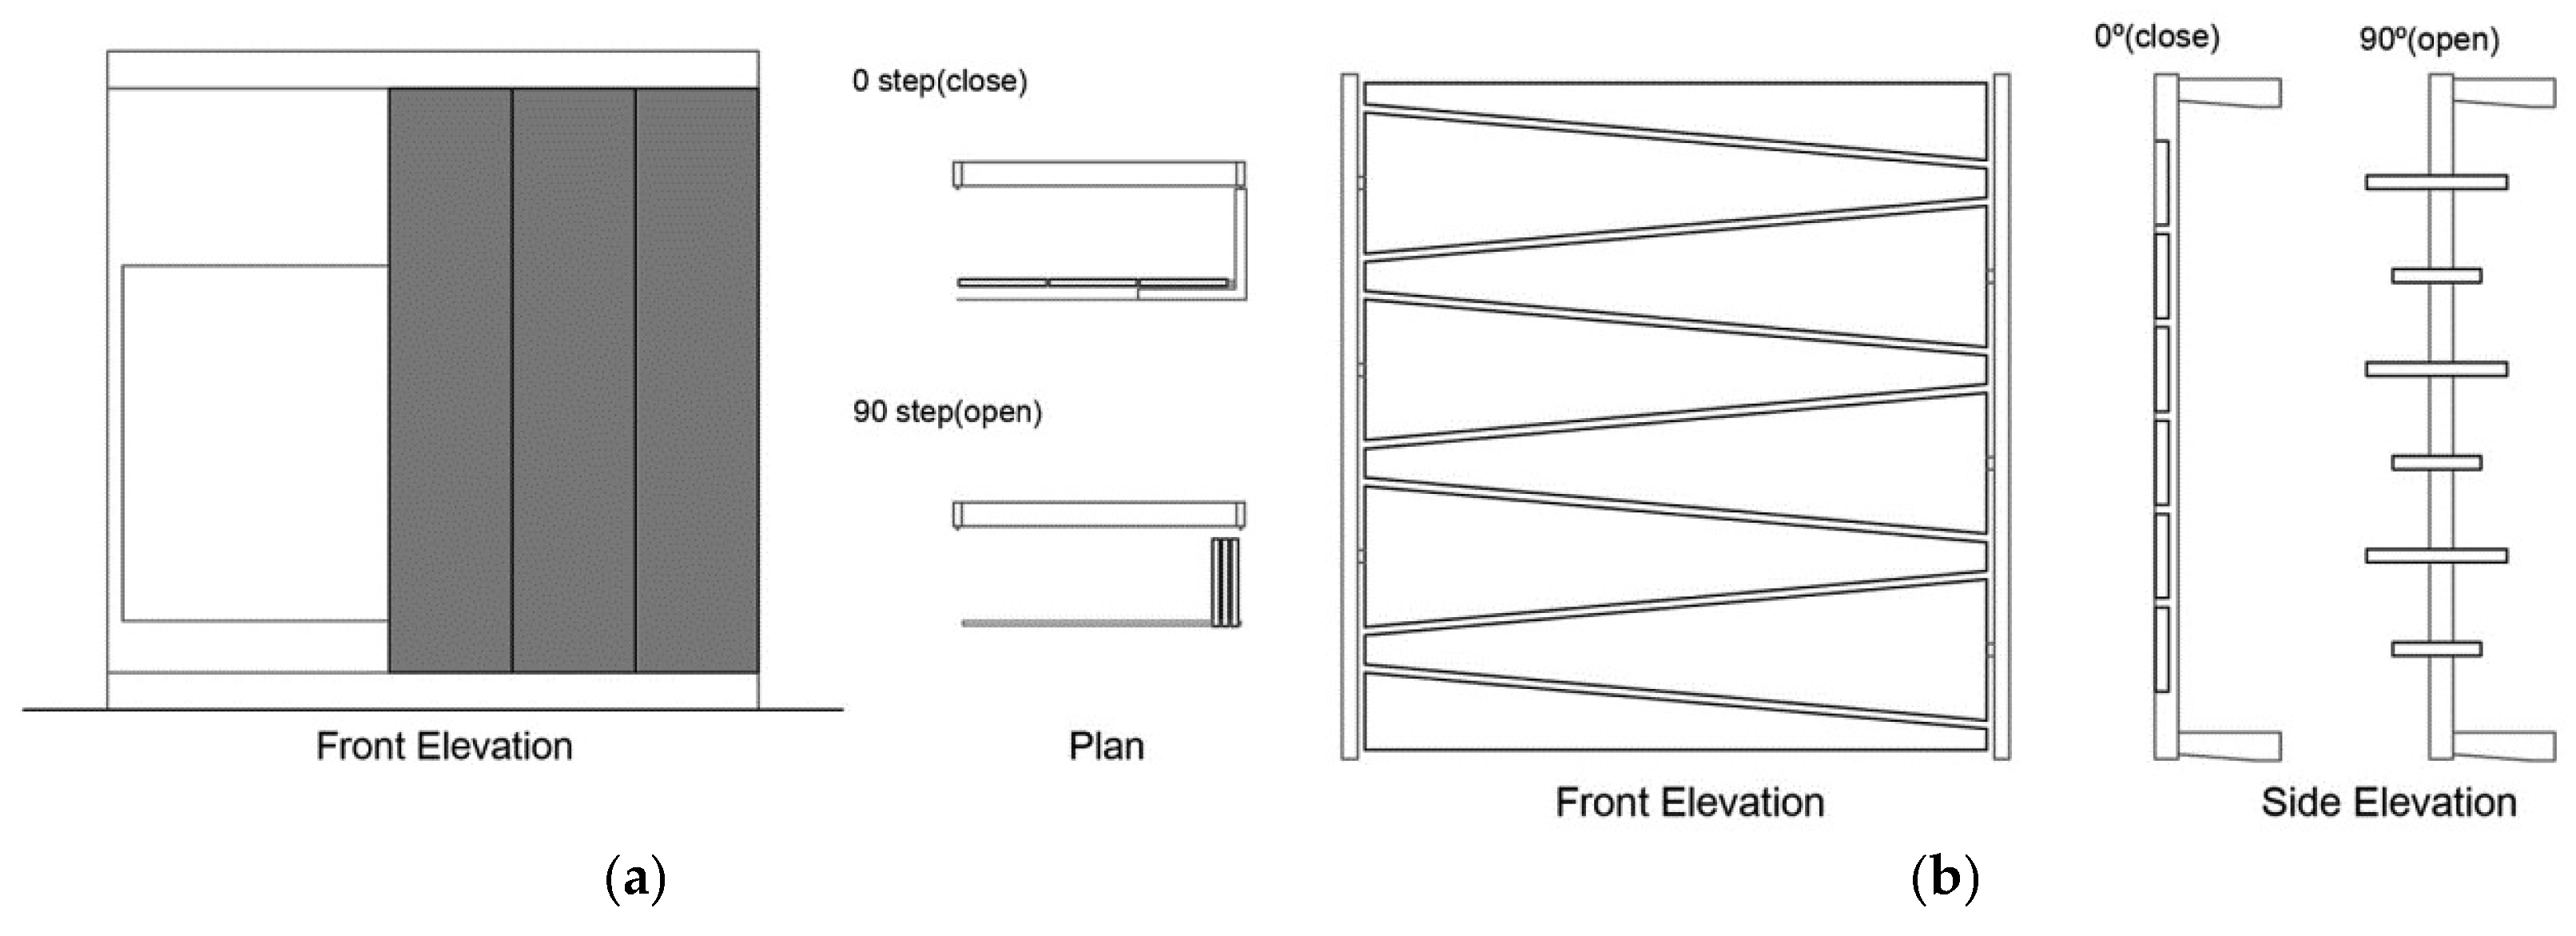
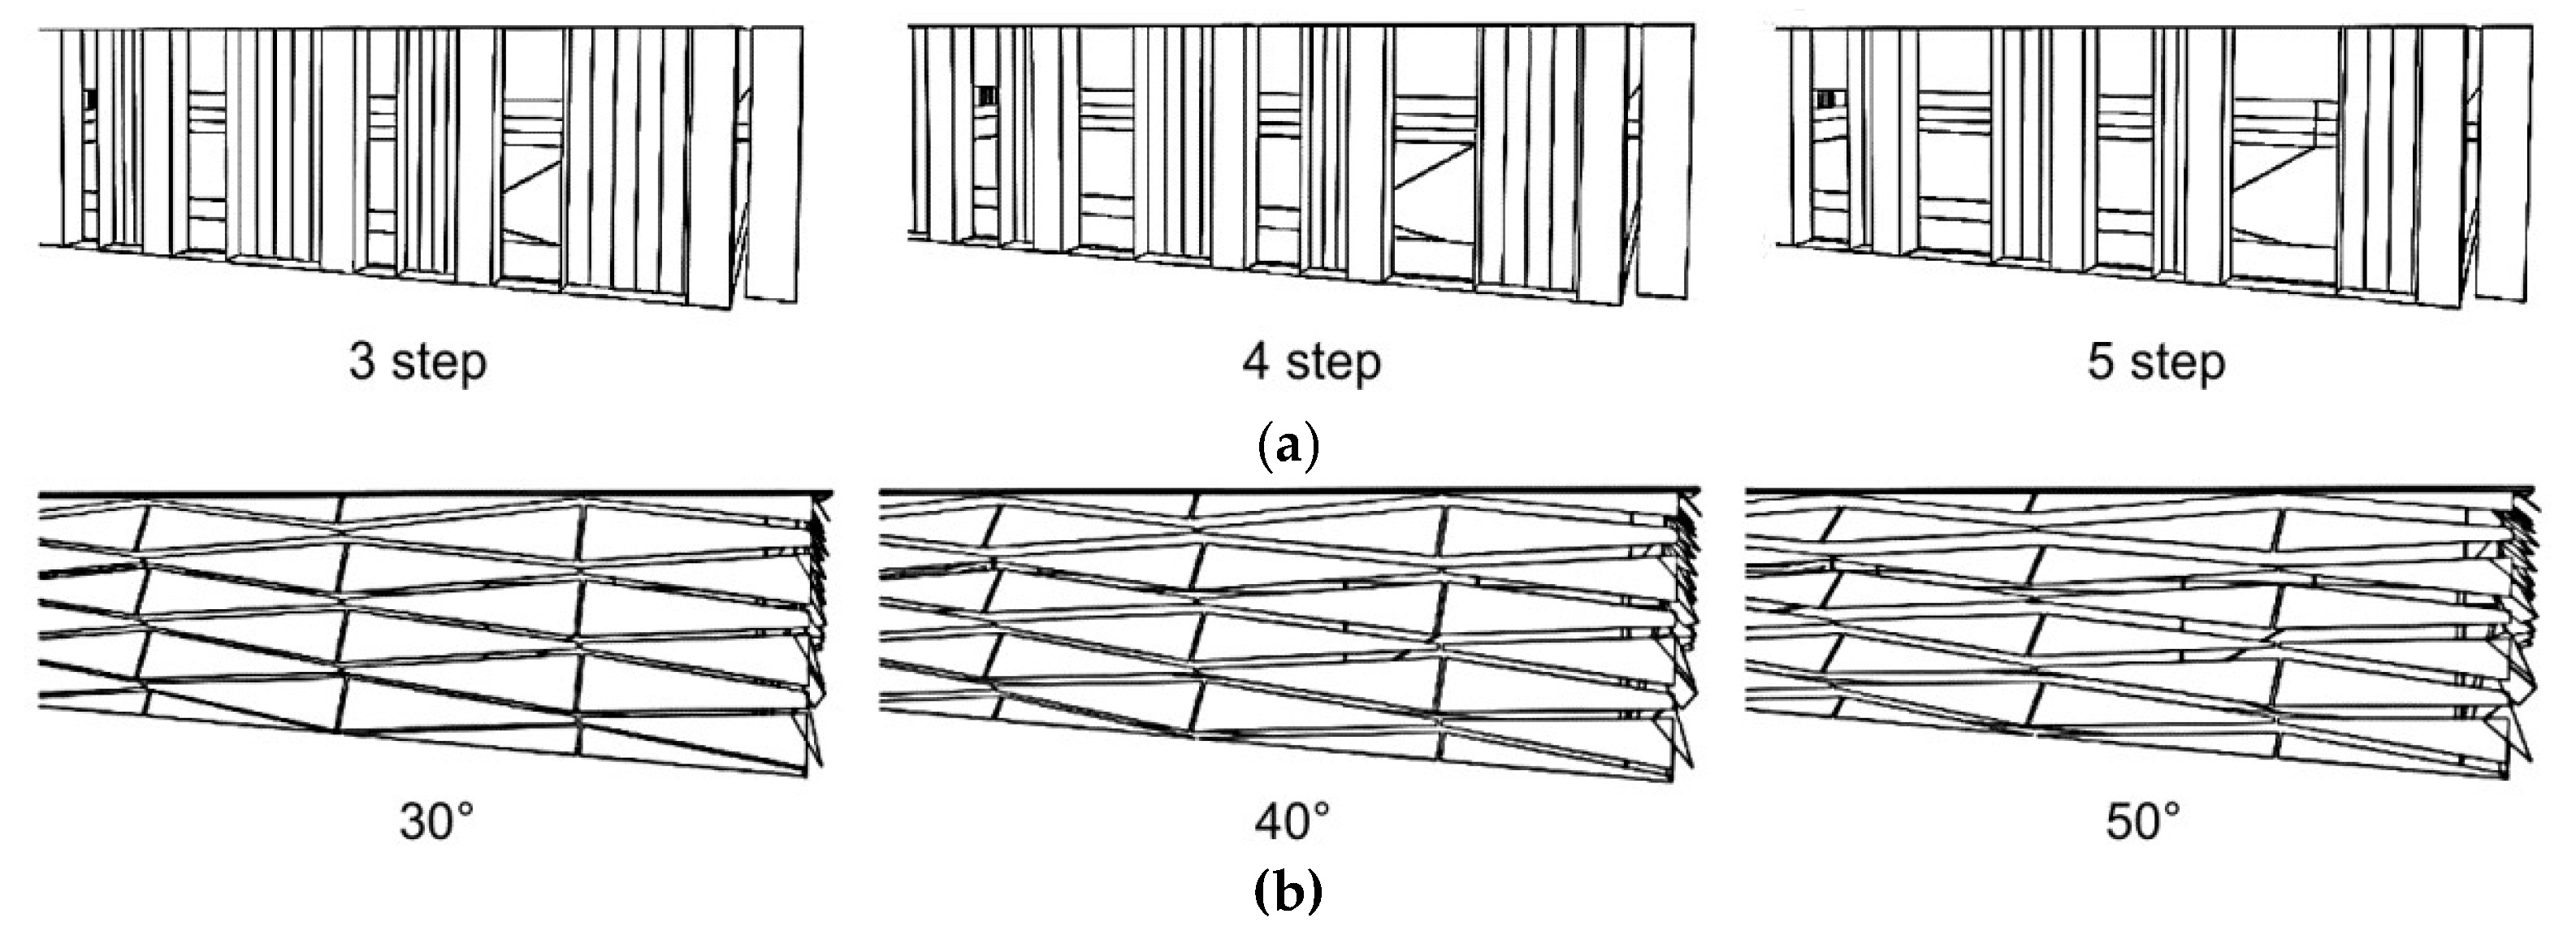
The most common folding and rotating types of external shading devices were selected to evaluate the applicability of kinetic shading. These shapes are illustrated in Figure 3. The folding type comprised vertical panels connected with hinges and operated in ten steps, from Step 0 (panels are fully open) to Step 9 (panels fully closed). External horizontal rails were placed at the top and bottom of the facade. The rotating type comprised wedge-shaped flat panels with narrow spacing slits that rotated 10° each rotation around the central axis from 0° (slats are fully closed) to 90° (slats are fully open). For the folding type, five modules (each of which comprised nine vertical panels) were placed on 30 m wide facades and panels acted as a type of vertical shading device when they were fully open. For the rotating type, eight modules were placed on the same facades. Both types were set to operate in ten steps (Figure 4). The rotating = type kinetic shading had a narrow range of shadow mask due to operational slits between the panels and their permanent position in front of the facades.
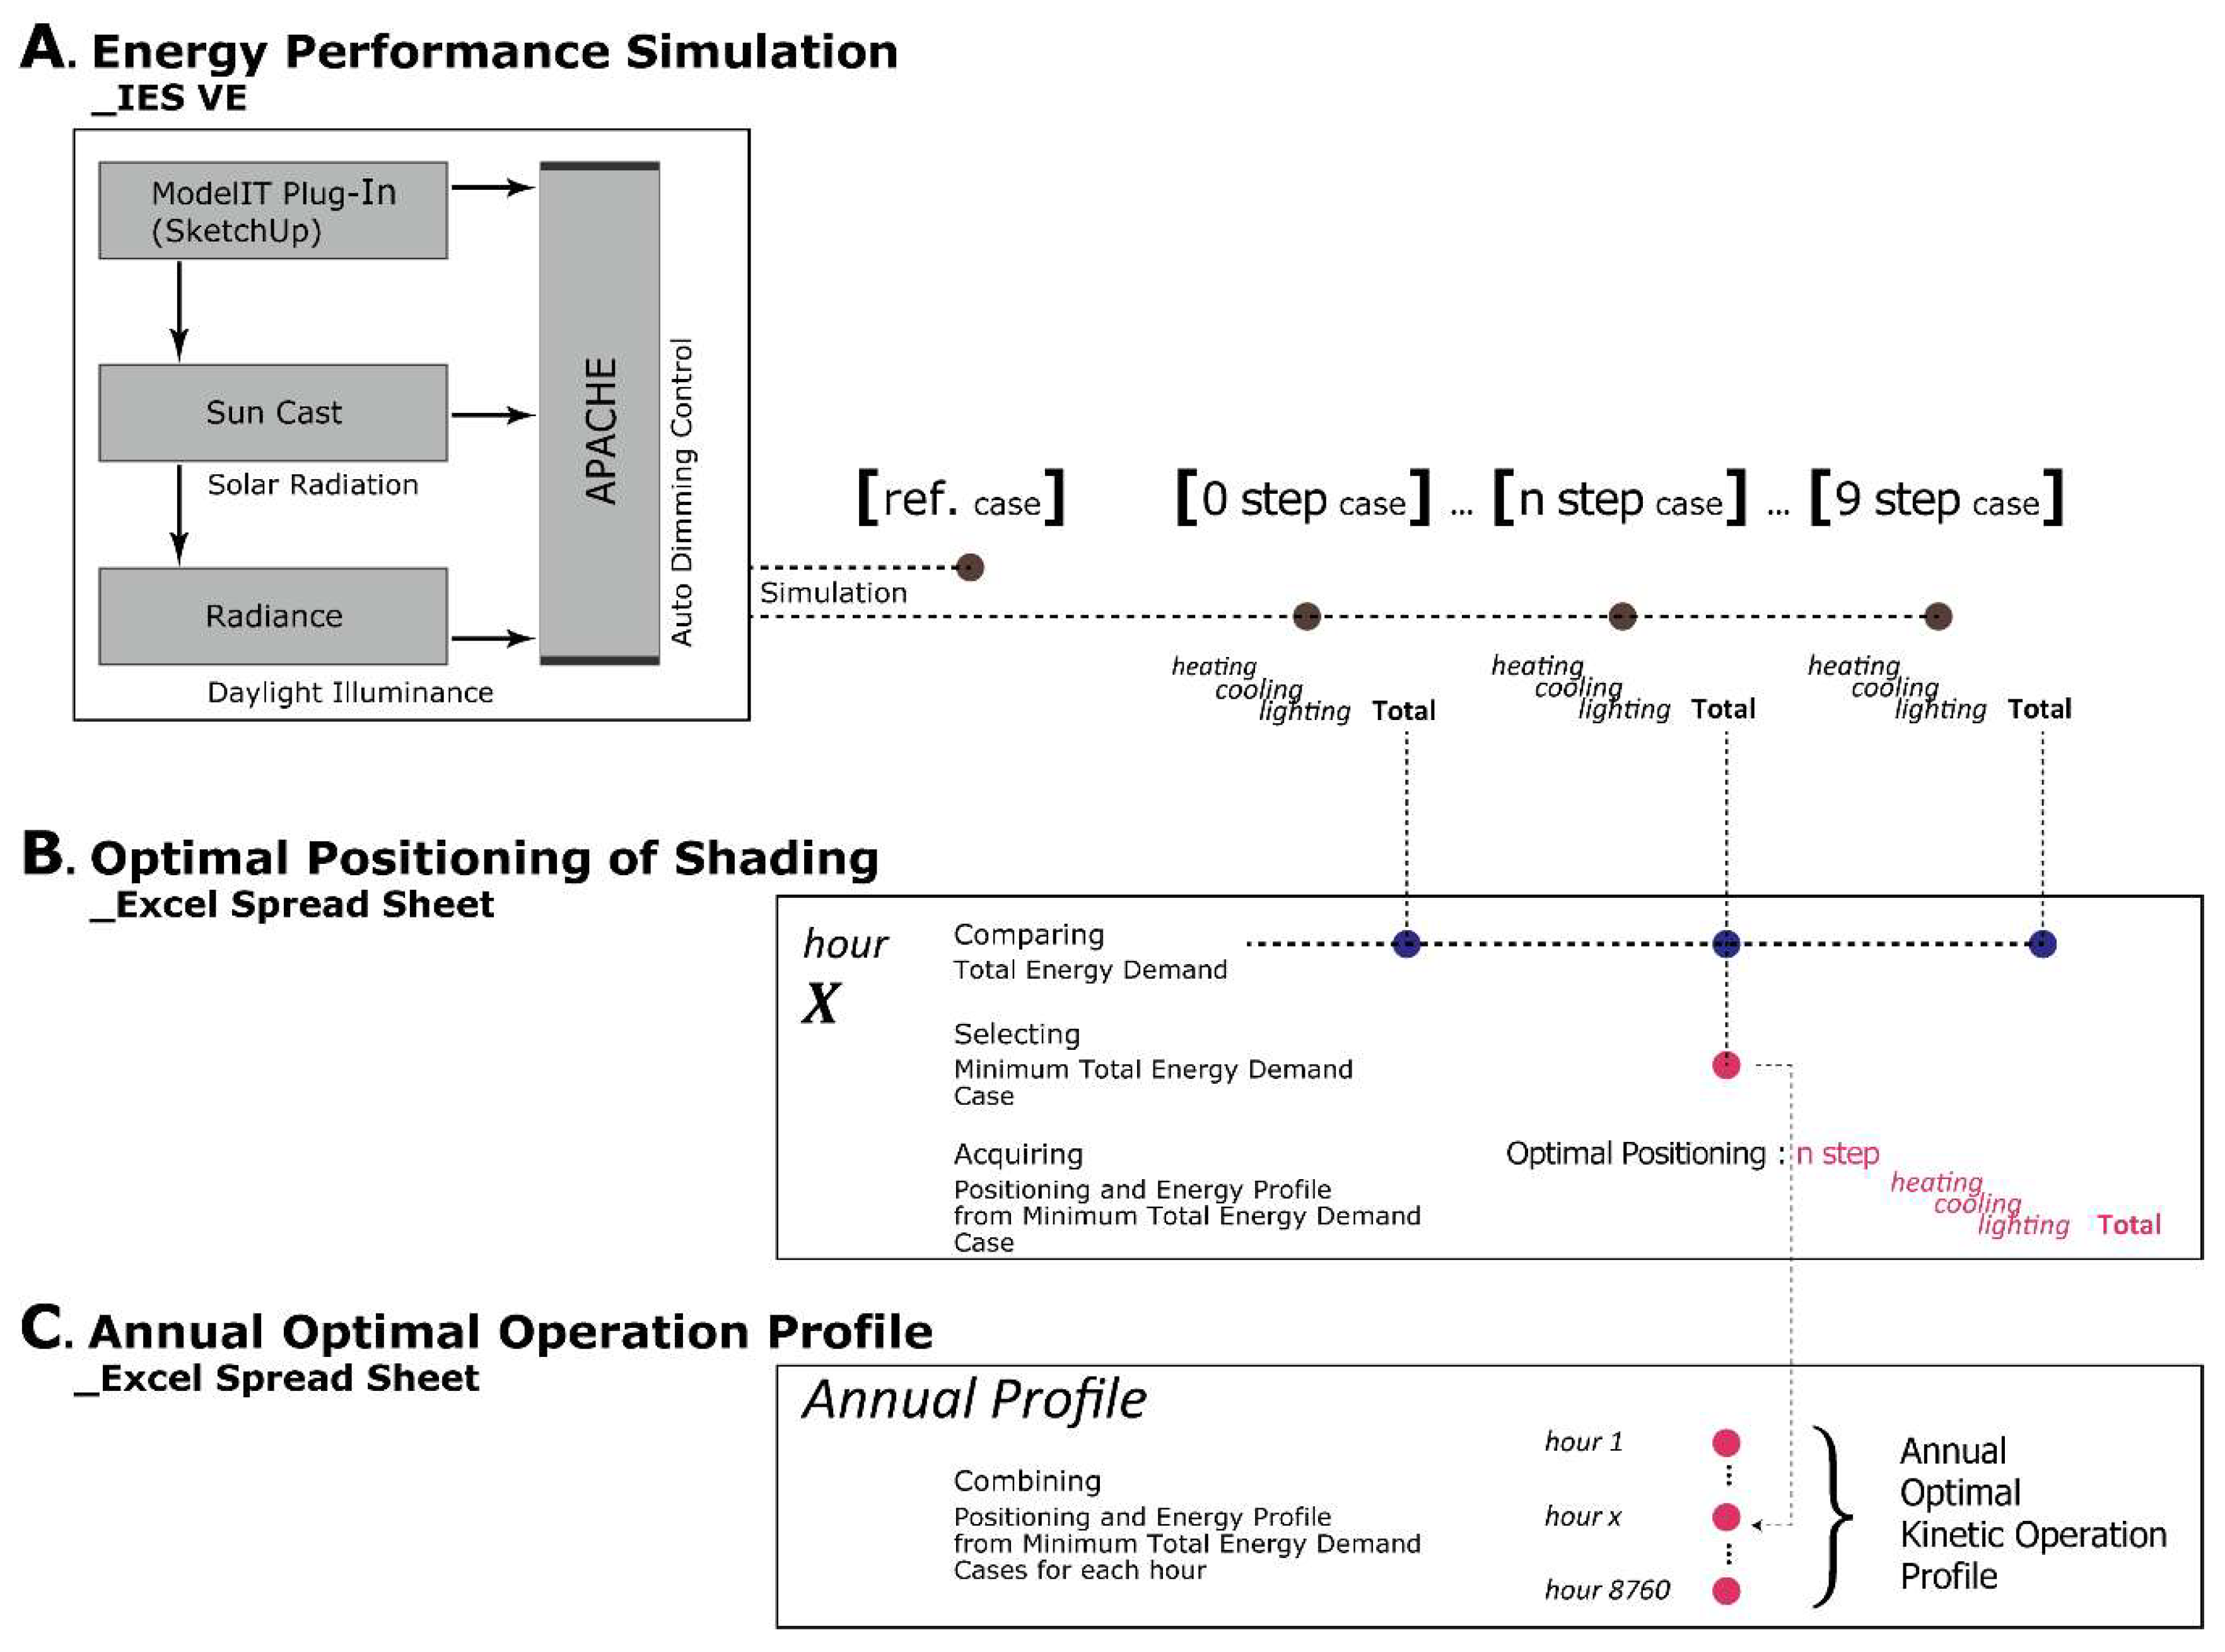
As illustrated in Figure 5, the annual kinetic operations based on minimum total energy demands were produced in three phases. The energy performance simulation with Integrated Environmental Solutions Virtual Environment (IES VE), optimal positioning analysis with Excel spreadsheets, and reorganization of an annual profile of kinetic operation and energy performance with Excel spreadsheets were used. IES VE has several simulation modules, and the results are integrated into APACHE energy simulation. All types of shading devices on three facades of the office building were modeled in the SketchUp 3D modeling tool with the IES VE Model IT plug-in. The 3D modeling data were transferred and simulated in the SunCast module for solar radiation analysis and the Radiance module for illuminance analysis. The APACHE module collected all data from Model IT and the SunCast and Radiance modules and analyzed the final energy performance simulation applying auto-dimming lighting control. The simulation results of the reference case and ten-step cases for both folding- and rotating-type shading devices were transferred into an Excel spreadsheet to compare total energy demand. The optimal positioning of the shading device for each hour was decided by selecting a case of minimum total energy demand. The positioning step and heating, cooling, lighting and total energy demand for each hour were collected throughout one year (8760 hours) and the annual optimal kinetic operation profile was produced. Finally, the energy consumption of the kinetic shading devices for each type was compared to the reference case without a shading device, and cases with fixed shading devices for a total of ten operating steps.
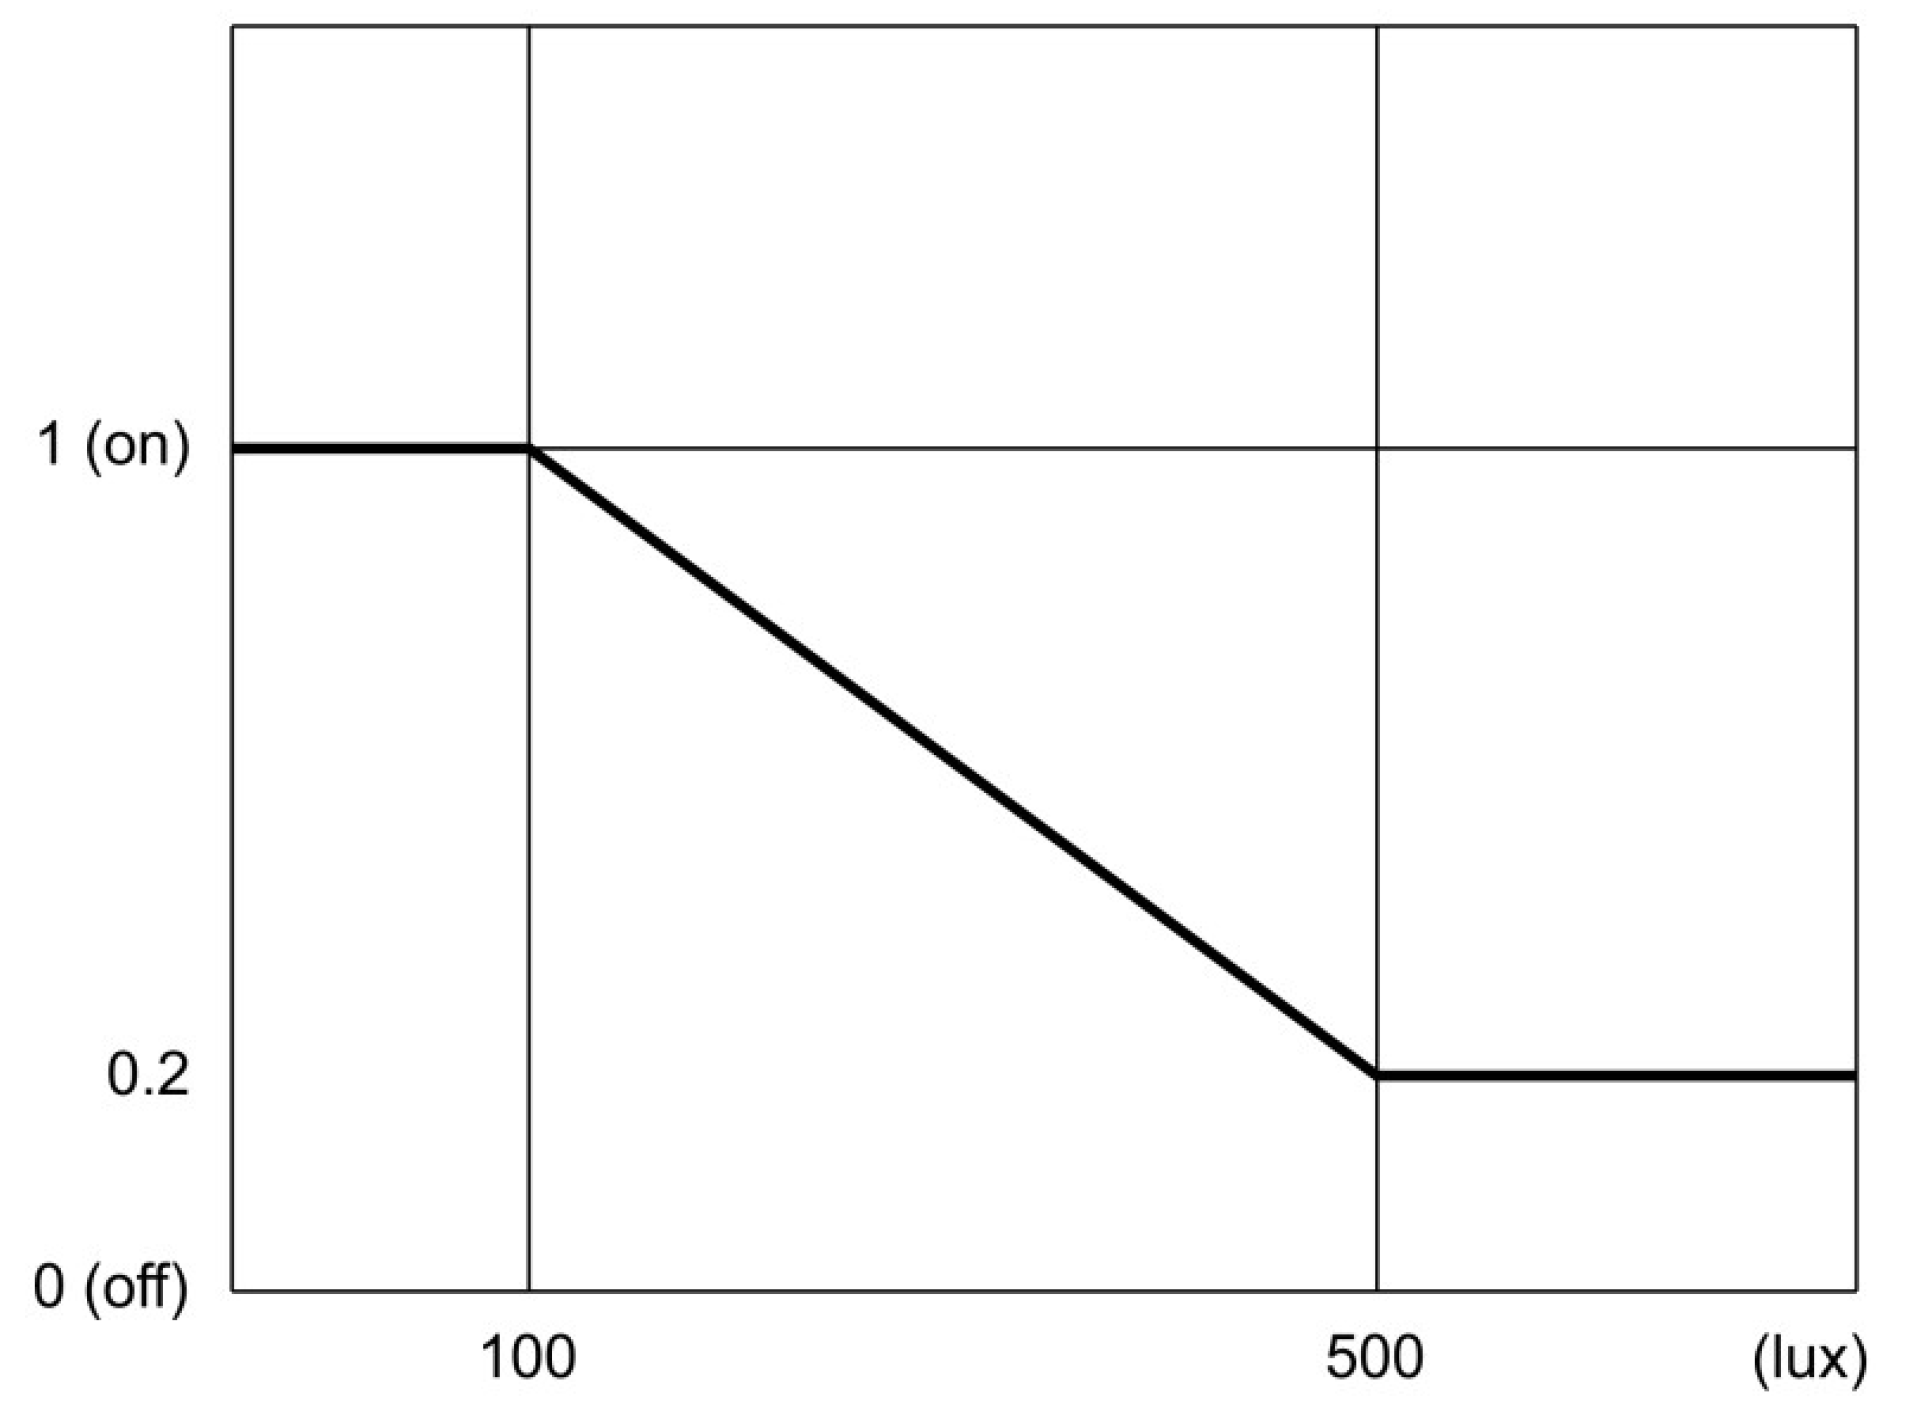
Boundary conditions and material properties of the base building are shown in Table 2. The U-value of windows was 2.1 W/K and the U-values of the opaque envelope for the external wall, floor, and roof, excluding windows, were set at 0.26, 0.013, and 0.013 W/K, respectively. The infiltration rate was set at 0.6 air change rate (ACH). Internal gain and system operation settings are shown in Table 3. Regarding the system operation condition of the building, the optimum indoor heating temperature was set at 20 °C and the cooling temperature was set at 26 °C. The occupancy schedule was set as five working days from 9 am to 6 pm. The internal heat gain from occupants and appliances was set at 9.01 W/and 10.75 W/, respectively. The internal heat gain from lighting was set at 10 W/. Lighting energy was calculated by summing artificial lighting by installing a dimming switch in each zone. The dimming switch was set at the recommended level of the illuminance of 500 lux. The dimming switch controlled the luminance level of the artificial light in inverse proportion to the natural lighting level when the daylight illuminance was between 100 and 500 lux as shown in Figure 6. The height of the natural lighting sensor was set at 0.85 m above the floor.
4. Results
4.1. Total Energy Demand Analysis for Fixed Shading
4.1.1. Energy Demand Profile of Reference Cases
Total energy performance, including heating, cooling, and lighting energy consumption, was analyzed for Abu Dhabi, Hanoi, and Seoul to establish baseline cases compared with kinetic shading devices in different climate conditions.
Energy consumption patterns of reference cases without shading devices in these three areas showed cooling-dominant load patterns. Abu Dhabi had the highest, followed by Hanoi and Seoul. Regarding annual energy consumption of Abu Dhabi and Hanoi, no heating energy was observed. Cooling energy accounted for at least 90%. On the other hand, Seoul showed complex heating and cooling energy demands depending on the orientation of the building. Heating energy consumption was the highest on the east side, while cooling energy consumption was the highest on the south side.
4.1.2. Energy Demands for Folding-Type Shading
Climatic characteristics of the three cities led to different benefits and drawbacks of the fixed shading devices. To examine the effect of folding-type fixed shading devices, the best-fixed case, in which the annual total energy consumption was the lowest, was analyzed first. In Abu Dhabi and Hanoi (full details in the Supplementary Materials) where cooling energy consumption accounted for most of the load, the southern office area recorded the most significant cooling energy reduction rate (27.4% and 27.4%, respectively). The best-fixed cases in all orientations were found at the Step 0 case, in which horizontally foldable shading panels blocked the windows entirely. The influence of cooling energy consumption on total energy consumption in the two regions was absolute. Cooling energy reduction in the two regions exceeded the side effect of lighting energy increase.
On the other hand, in the case of Seoul (full details in the Supplementary Materials), the inter-relationships among heating, cooling, and lighting energy were more complex. Shading devices in Seoul resulted in a year-round lighting energy increase and a huge heating energy increase during the winter season. Although the best-fixed cases on the south and west side showed reductions of 17.5% and 10.8% in total energy consumption, respectively, the best-fixed cases on east facade failed to result in a positive energy saving effect. Annual total energy consumption on the east side increased by 8.1% in Steps 8 and 9.
4.1.3. Energy Demands for Rotating-Type Shading
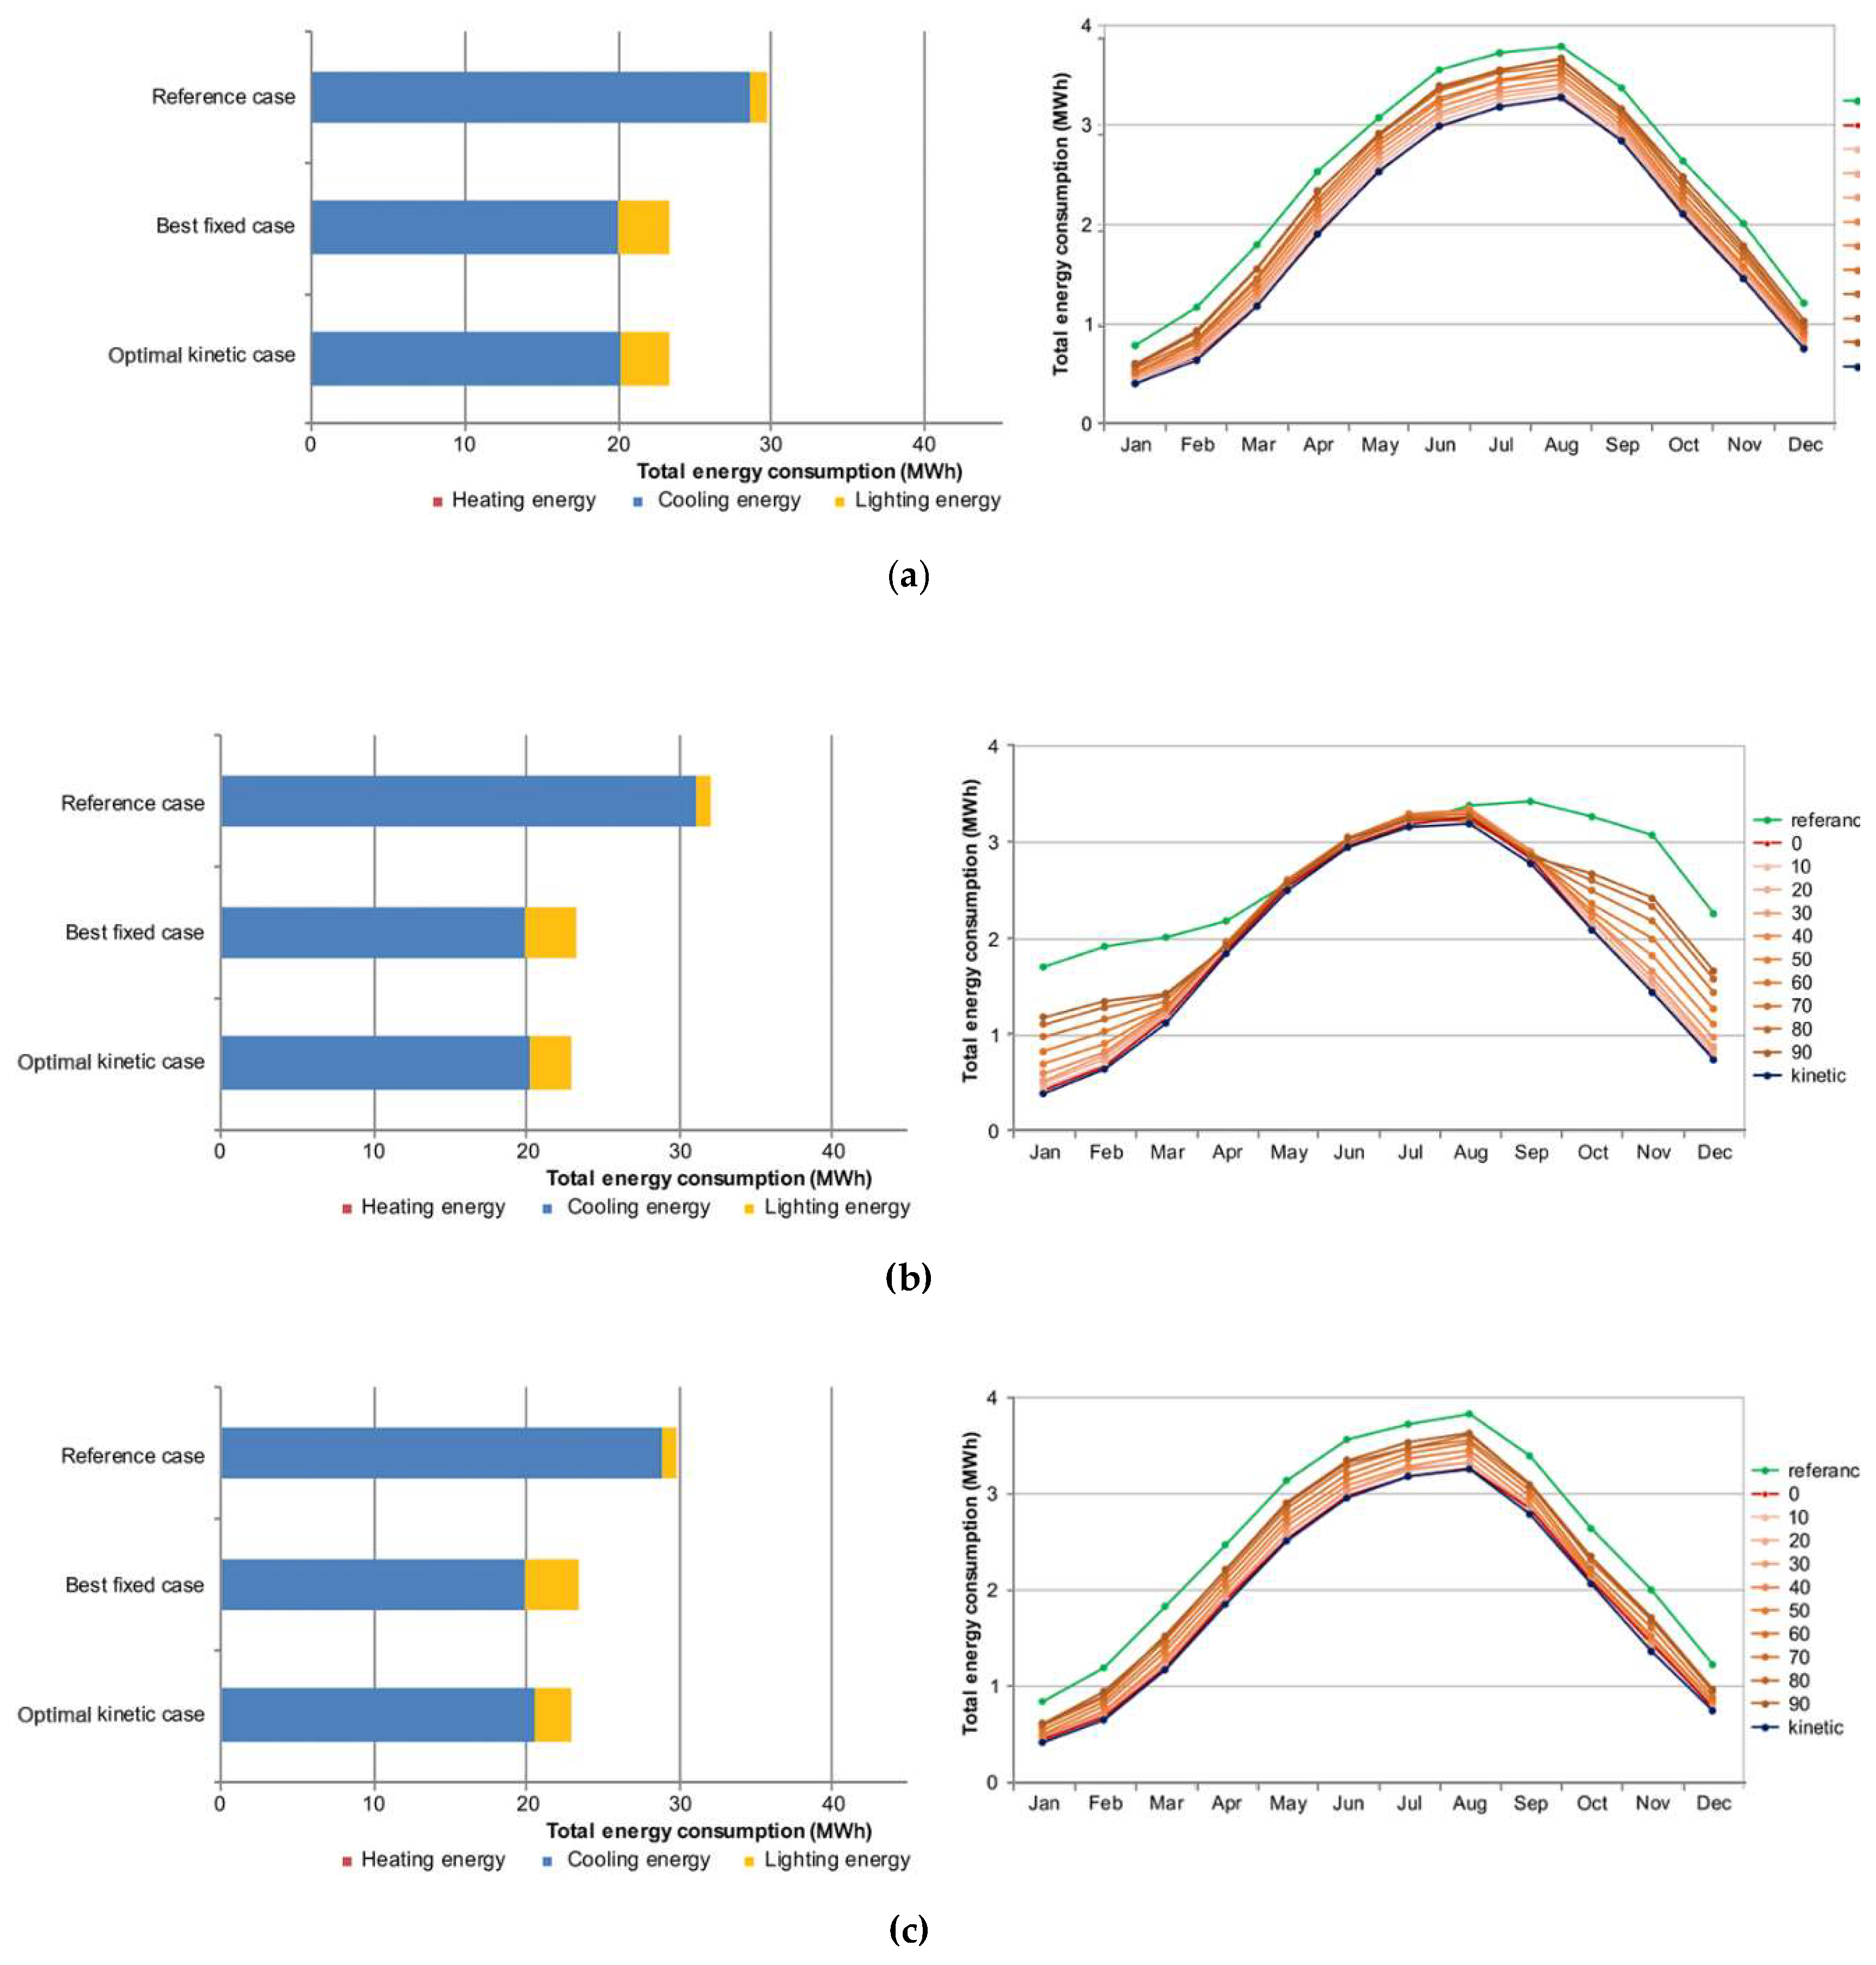
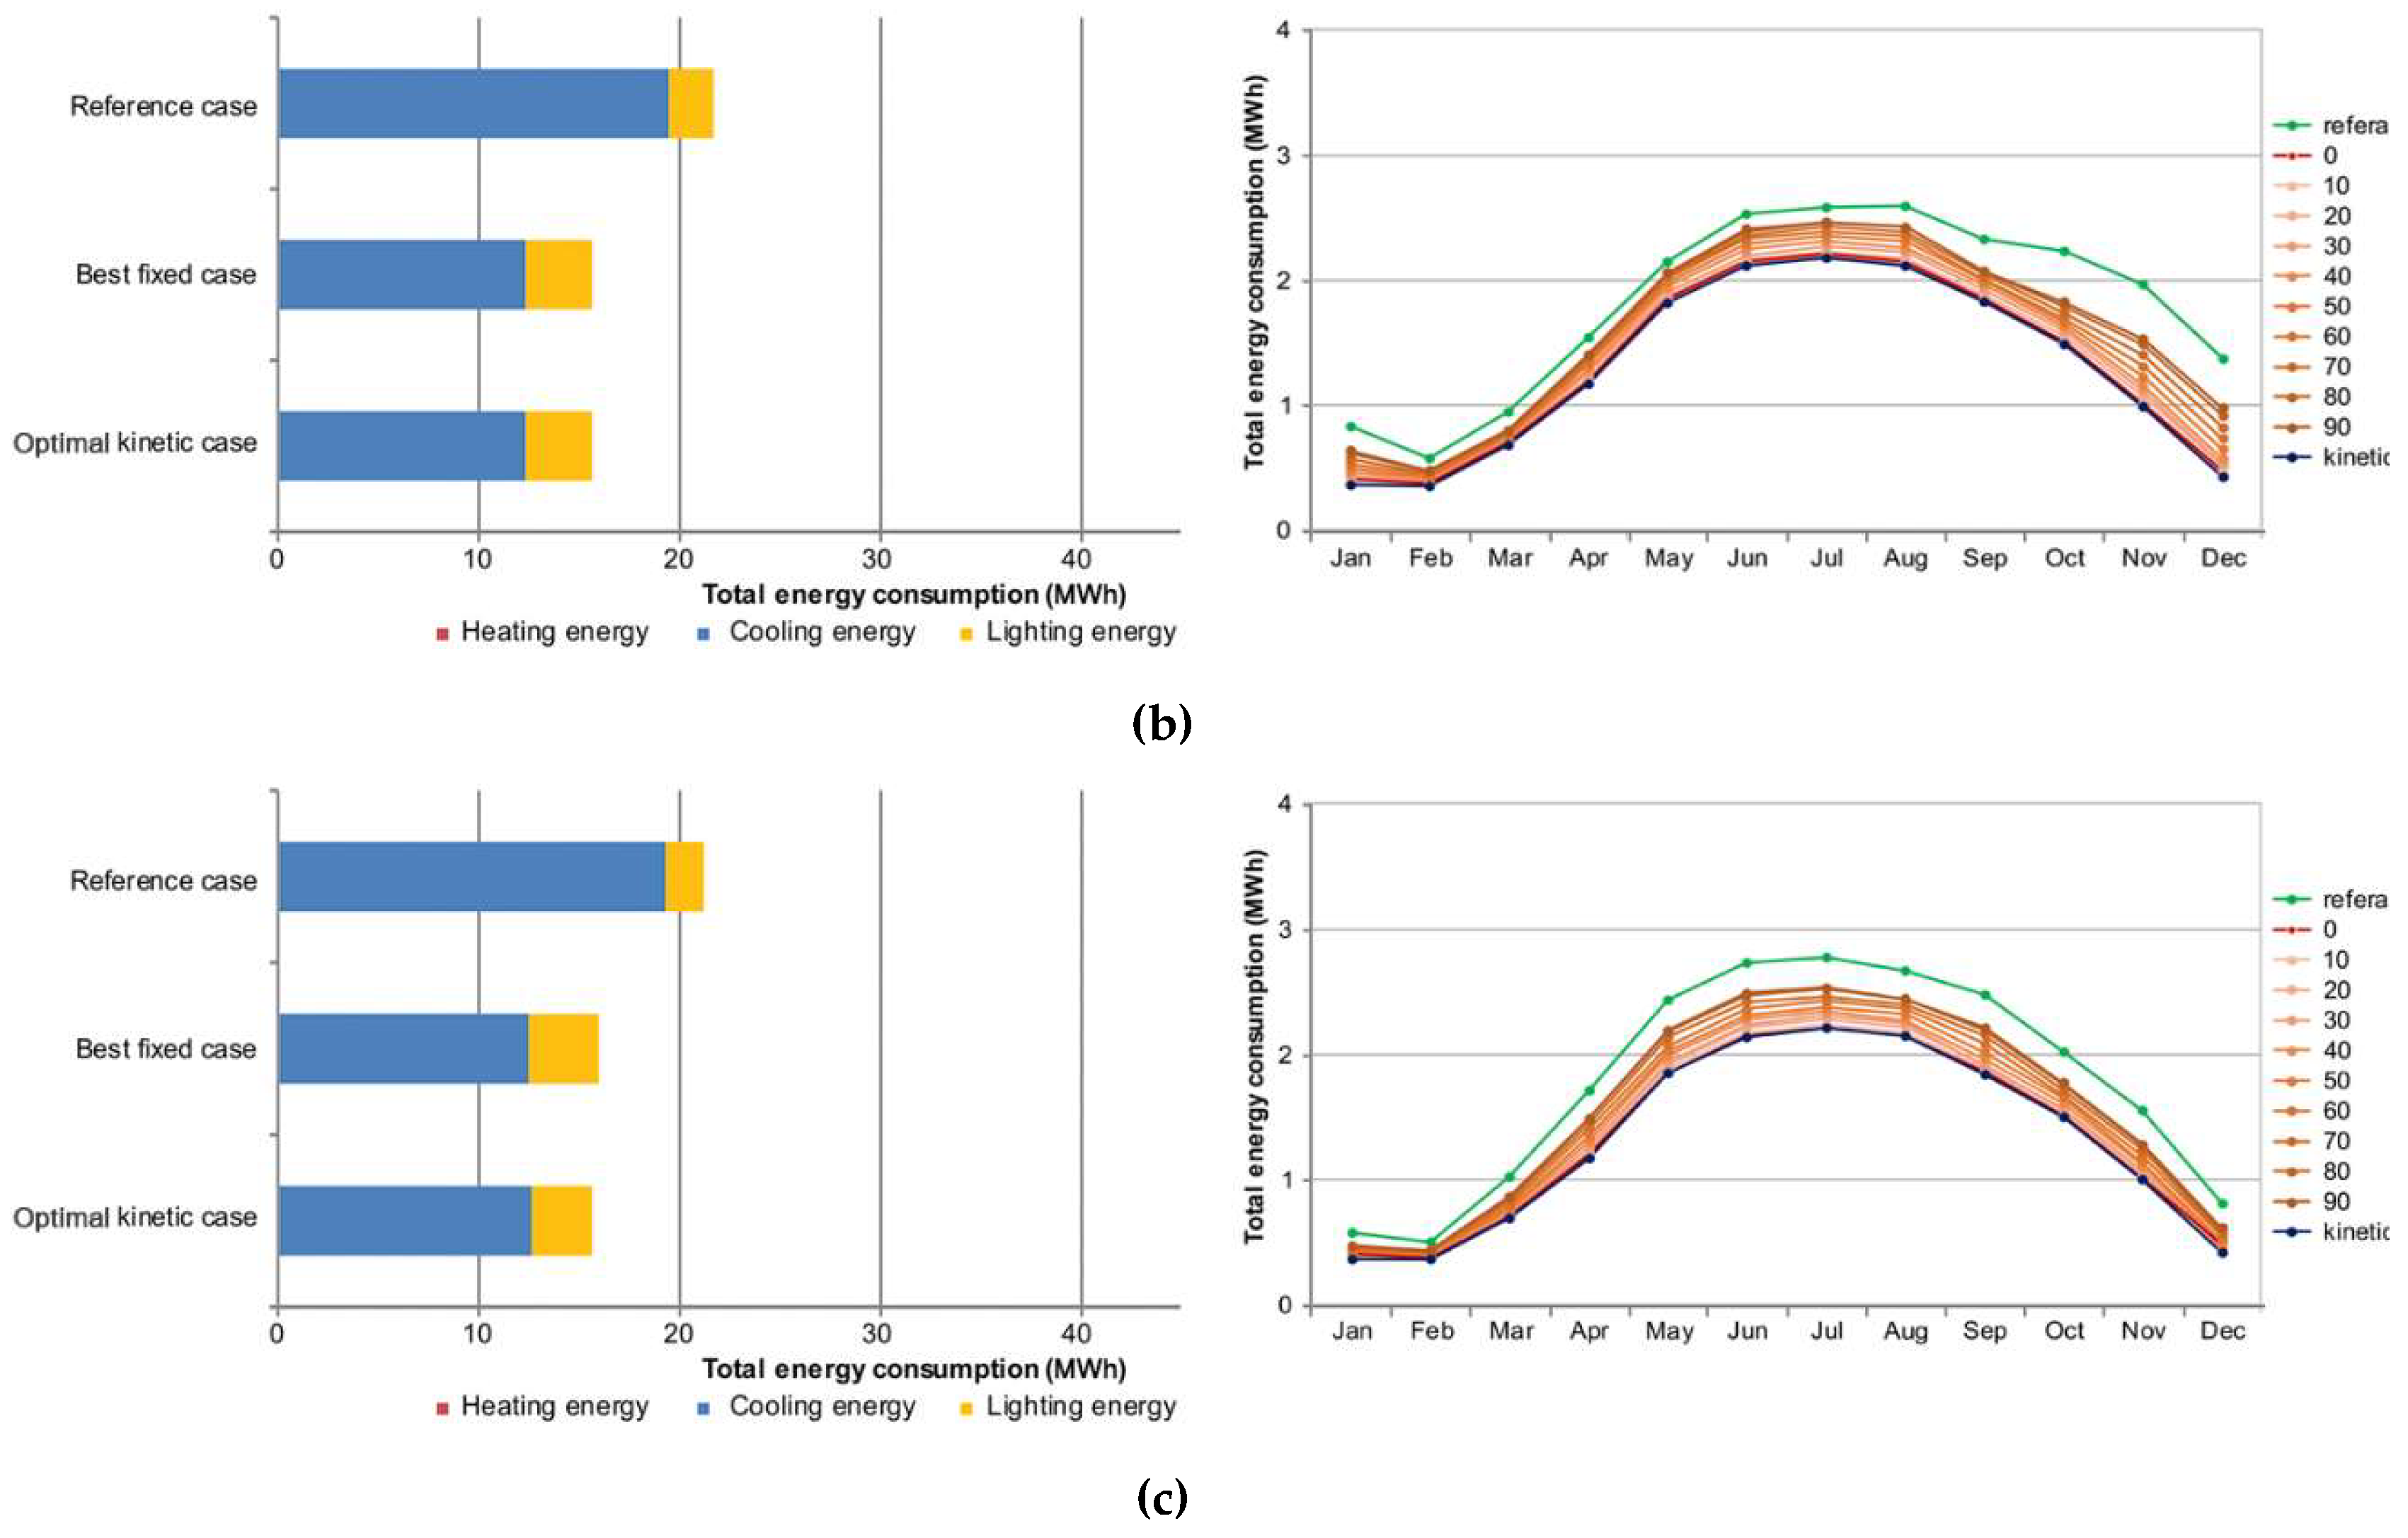
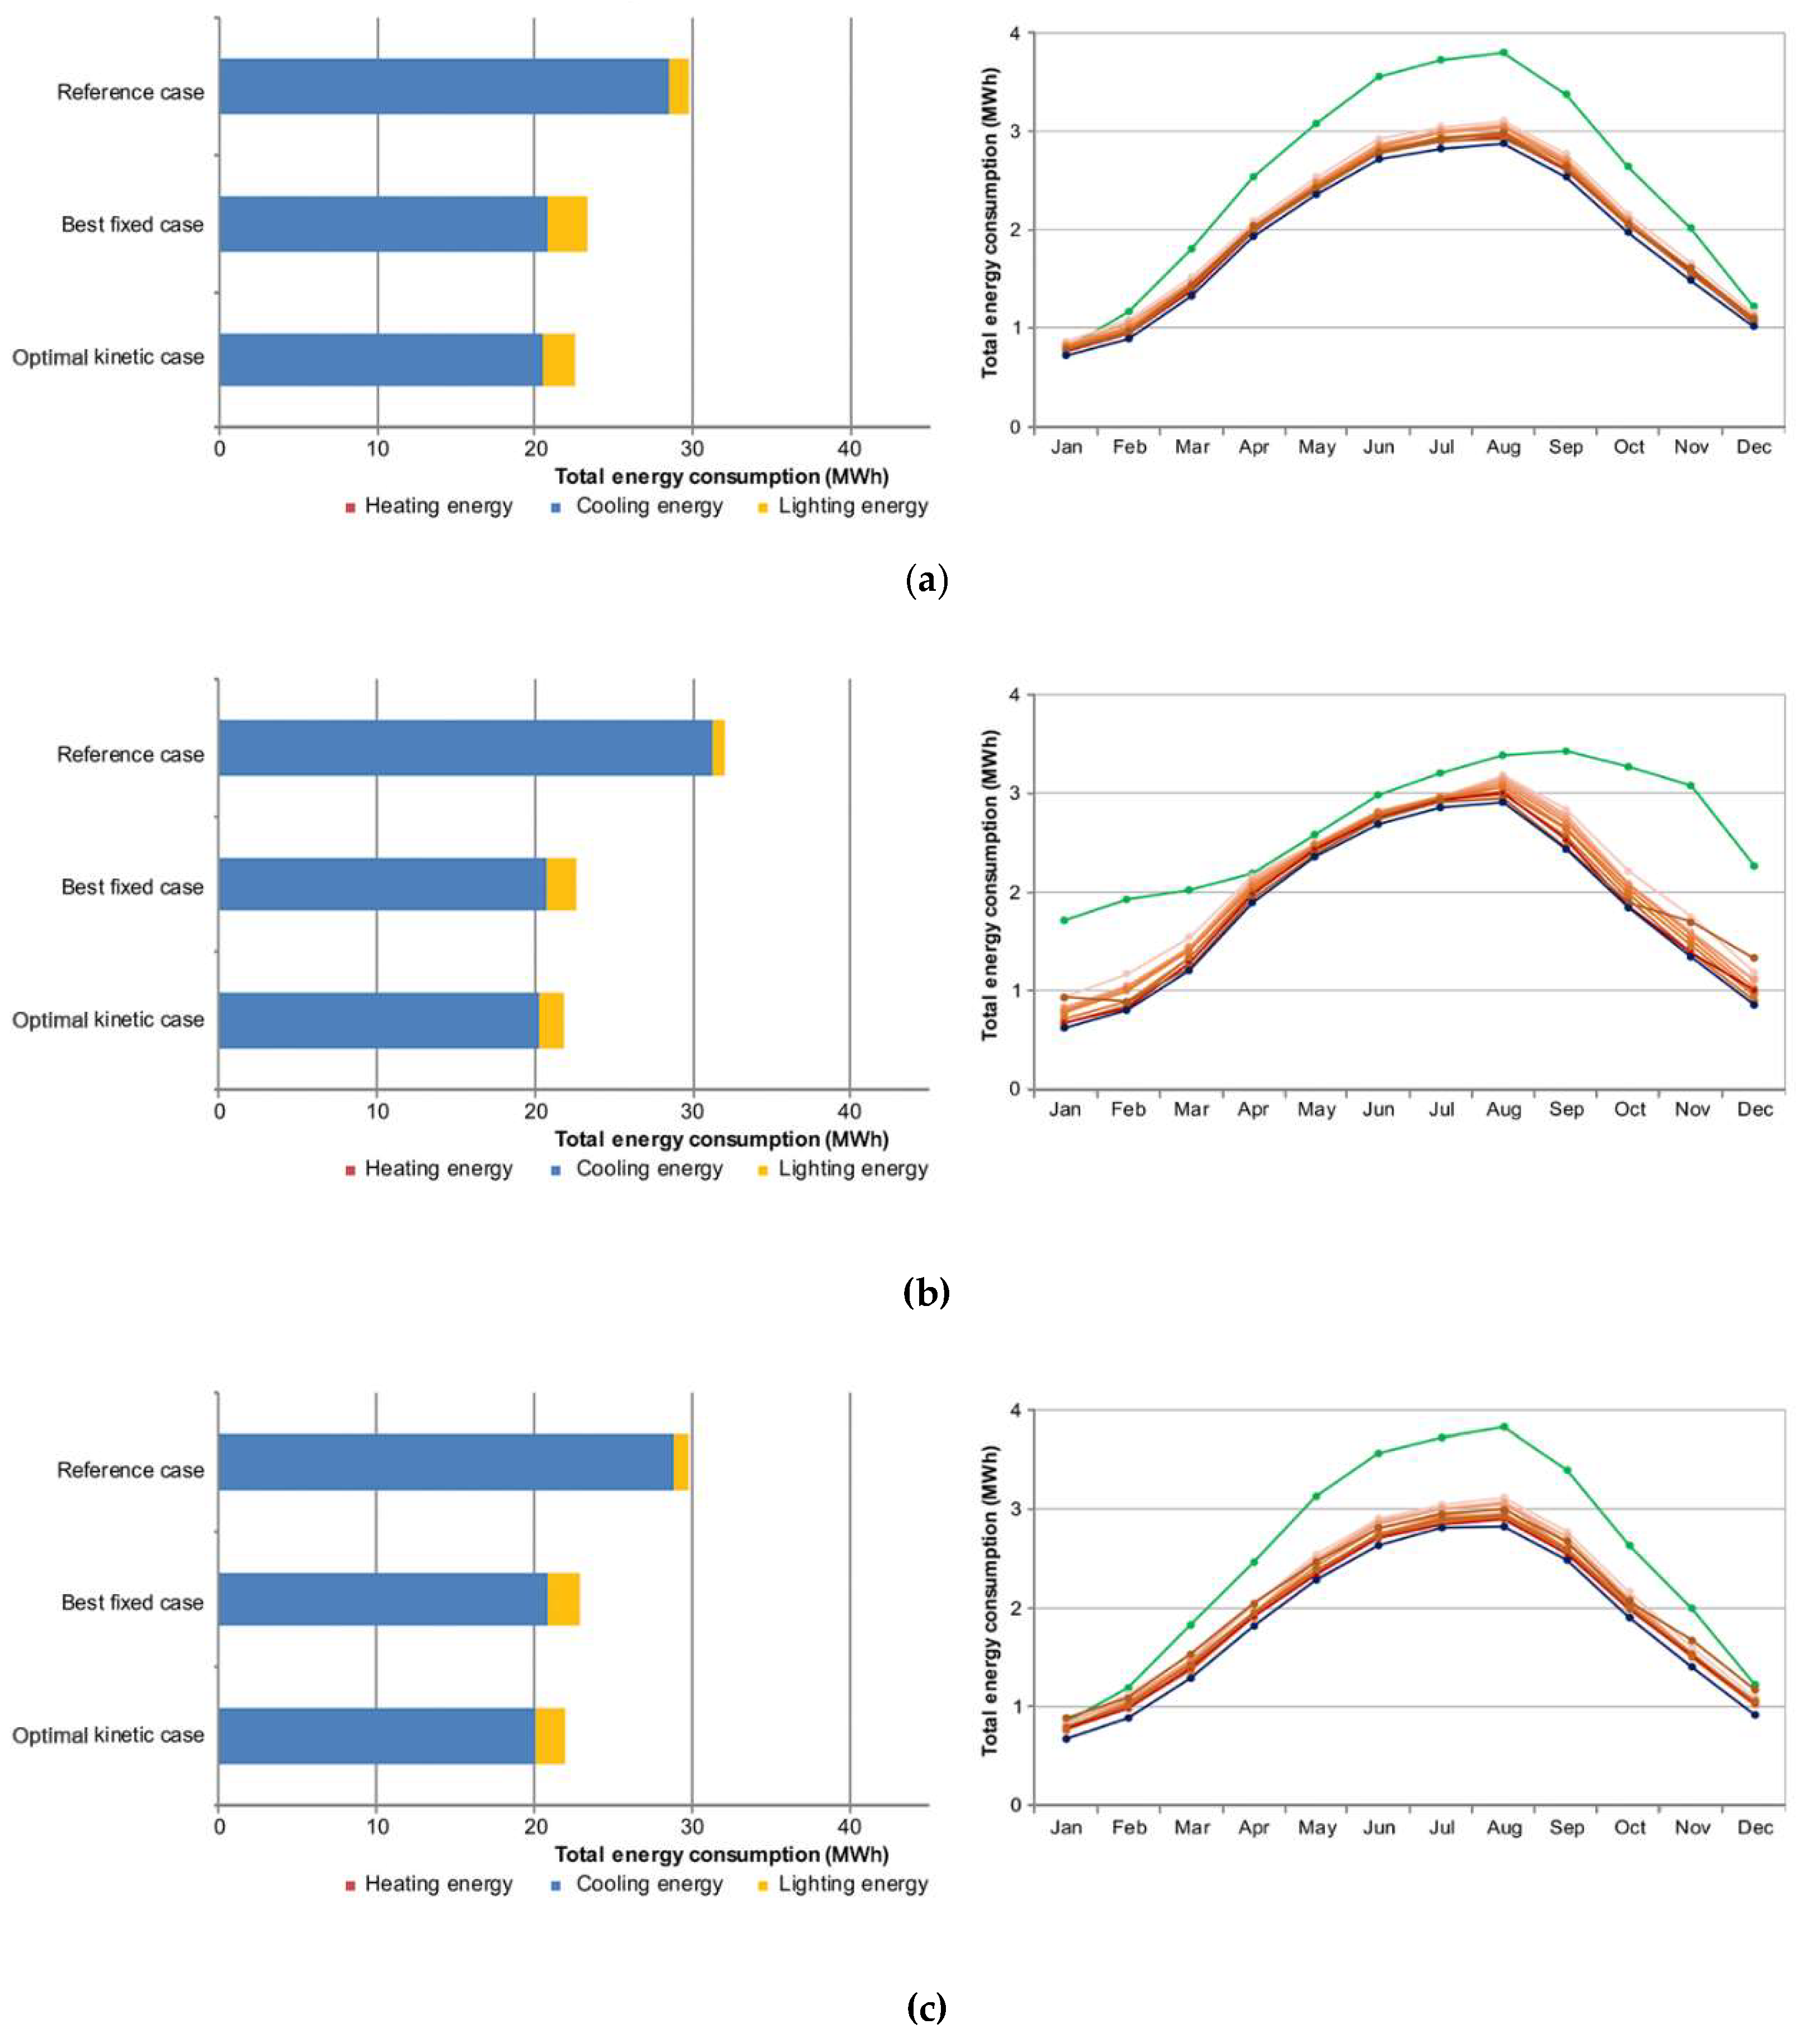
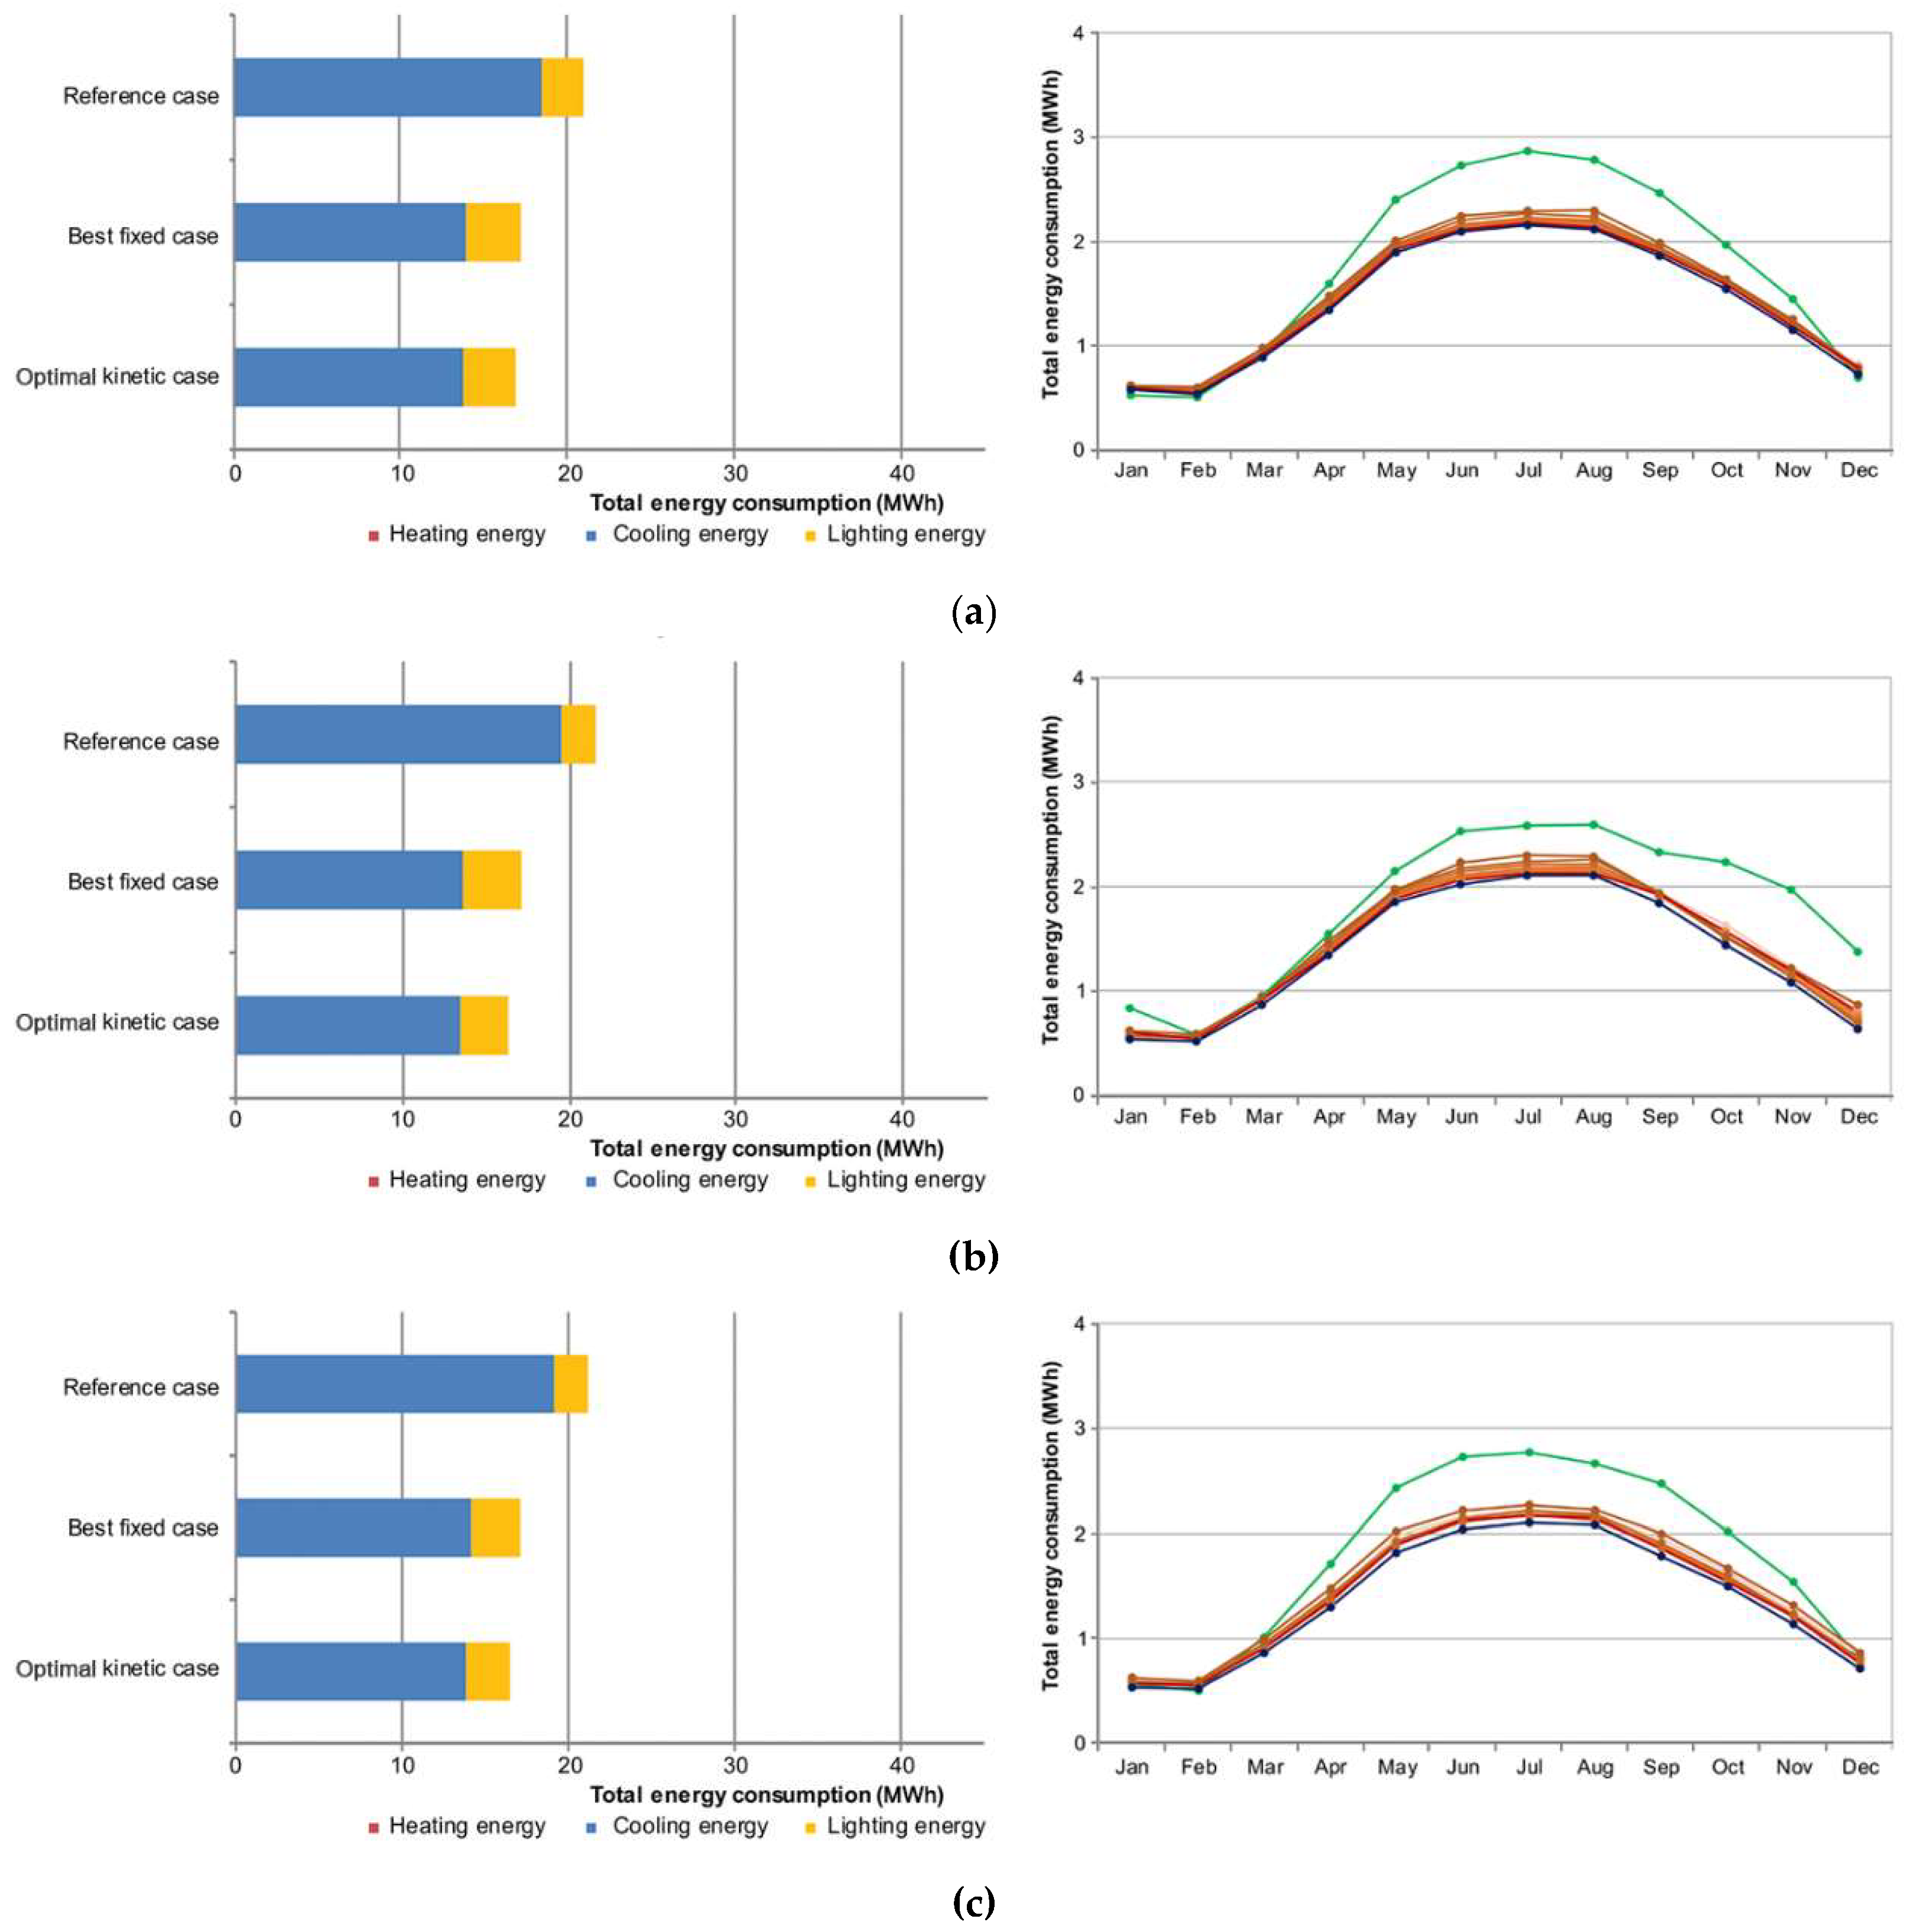
Annual energy performances of the rotating-type cases in the three cities are listed in the Supplementary Materials. The reference case and ten fixed-type cases with the same angular spacing were simulated in the same way as for the folding type. Monthly energy consumption profiles in the three cities (Figure 7, Figure 8, Figure 9, Figure 10, Figure 11 and Figure 12) showed that the performance range of the rotating-type cases in each city was narrower than for the folding-type cases in all three cities. However, the energy saving effects of rotating-type devices were different in the three cities. The energy performance of the rotating-type shading devices in Abu Dhabi and Seoul outperformed that of the folding-type shading devices, while those in Hanoi showed underperformance.
Comparing results of the folding-type and rotating-type devices in the three cities made it clear that the main driving force of energy performance change was different. In the case of Abu Dhabi, enhanced daylighting performance contributed to the overall energy performance improvement, despite a minor cooling energy increase. In Abu Dhabi, lighting energy reductions compromised poor cooling performance (Figure 10). Cooling energy consumption of the best-fixed cases on the east, south, and west sides was slightly higher than that of the folding-type cases (rotating-type best-fixed cases: 21.1 MWh, 20.7 MWh, and 20.6MWh on the east, south, and west facades, respectively; folding-type best-fixed cases: 20.0 MWh, 19.9MWh, and 20.0MWh on the east, south, and west facades, respectively). However, the lighting energy consumption with the rotating-type shading device was inevitably low (2.3 MWh, 1.8 MWh, and 2.0 MWh on the east, south, and west zone, respectively). Thus, their performance improvement compromised the cooling energy increase. As a result, the overall energy consumption of rotating-type shading devices outperformed that of folding-type shading devices. In the case of Seoul, the overall energy performance of rotating-type devices was better than that of folding-type devices because the side effect of the heating energy increase was well-suppressed. However, in the case of Hanoi, the overall energy performance deteriorated due to an increase in cooling energy demand, while the lighting energy demands were almost the same for both types. Natural lighting was not sufficient in Hanoi for either type of kinetic shading in winter, so dimming control was seldom active electric lights were necessary to reach a comfortable level of illuminance. Both types of kinetic shadings tended to minimize cooling energy, but rotating-type kinetic shading had more solar gain through spacing slits between the panels. Therefore, cooling energy demands in rotating-type shadings increased compared to those in folding = type kinetic shadings. In Abu Dhabi, the best-fixed cases were found at 70° on the east side, 80° on the south side, and 70° on the west side. The south side showed the most prominent reduction rate (29.6%) while the east and west sides showed reduction rates of 21.2% and 23.2%, respectively. In Hanoi, the best-fixed case on the south side was at 20° while those on the east and west sides were at 30° and 60°, respectively. For Hanoi, the south side also showed the highest reduction rate (20.8%) while the east and west sides showed reduction rates of 17.7% and 19.7%, respectively. In Seoul, the reduction rate was 8.9% on the east side, 27.3% on the south side, and 20.9% on the west side. The best-fixed case was found at 60° on the west side, where the cooling energy was the lowest. On the other hand, the best-fixed case was found at 90° (the horizontal overhang shape) on the east and south sides, where side effects of the shading device as well as the additional increase of heating and lighting energy, were minimized.
4.2. Optimal Operation of Kinetic Shading
4.2.1. Optimal Operation of Folding-Type Kinetic Shading
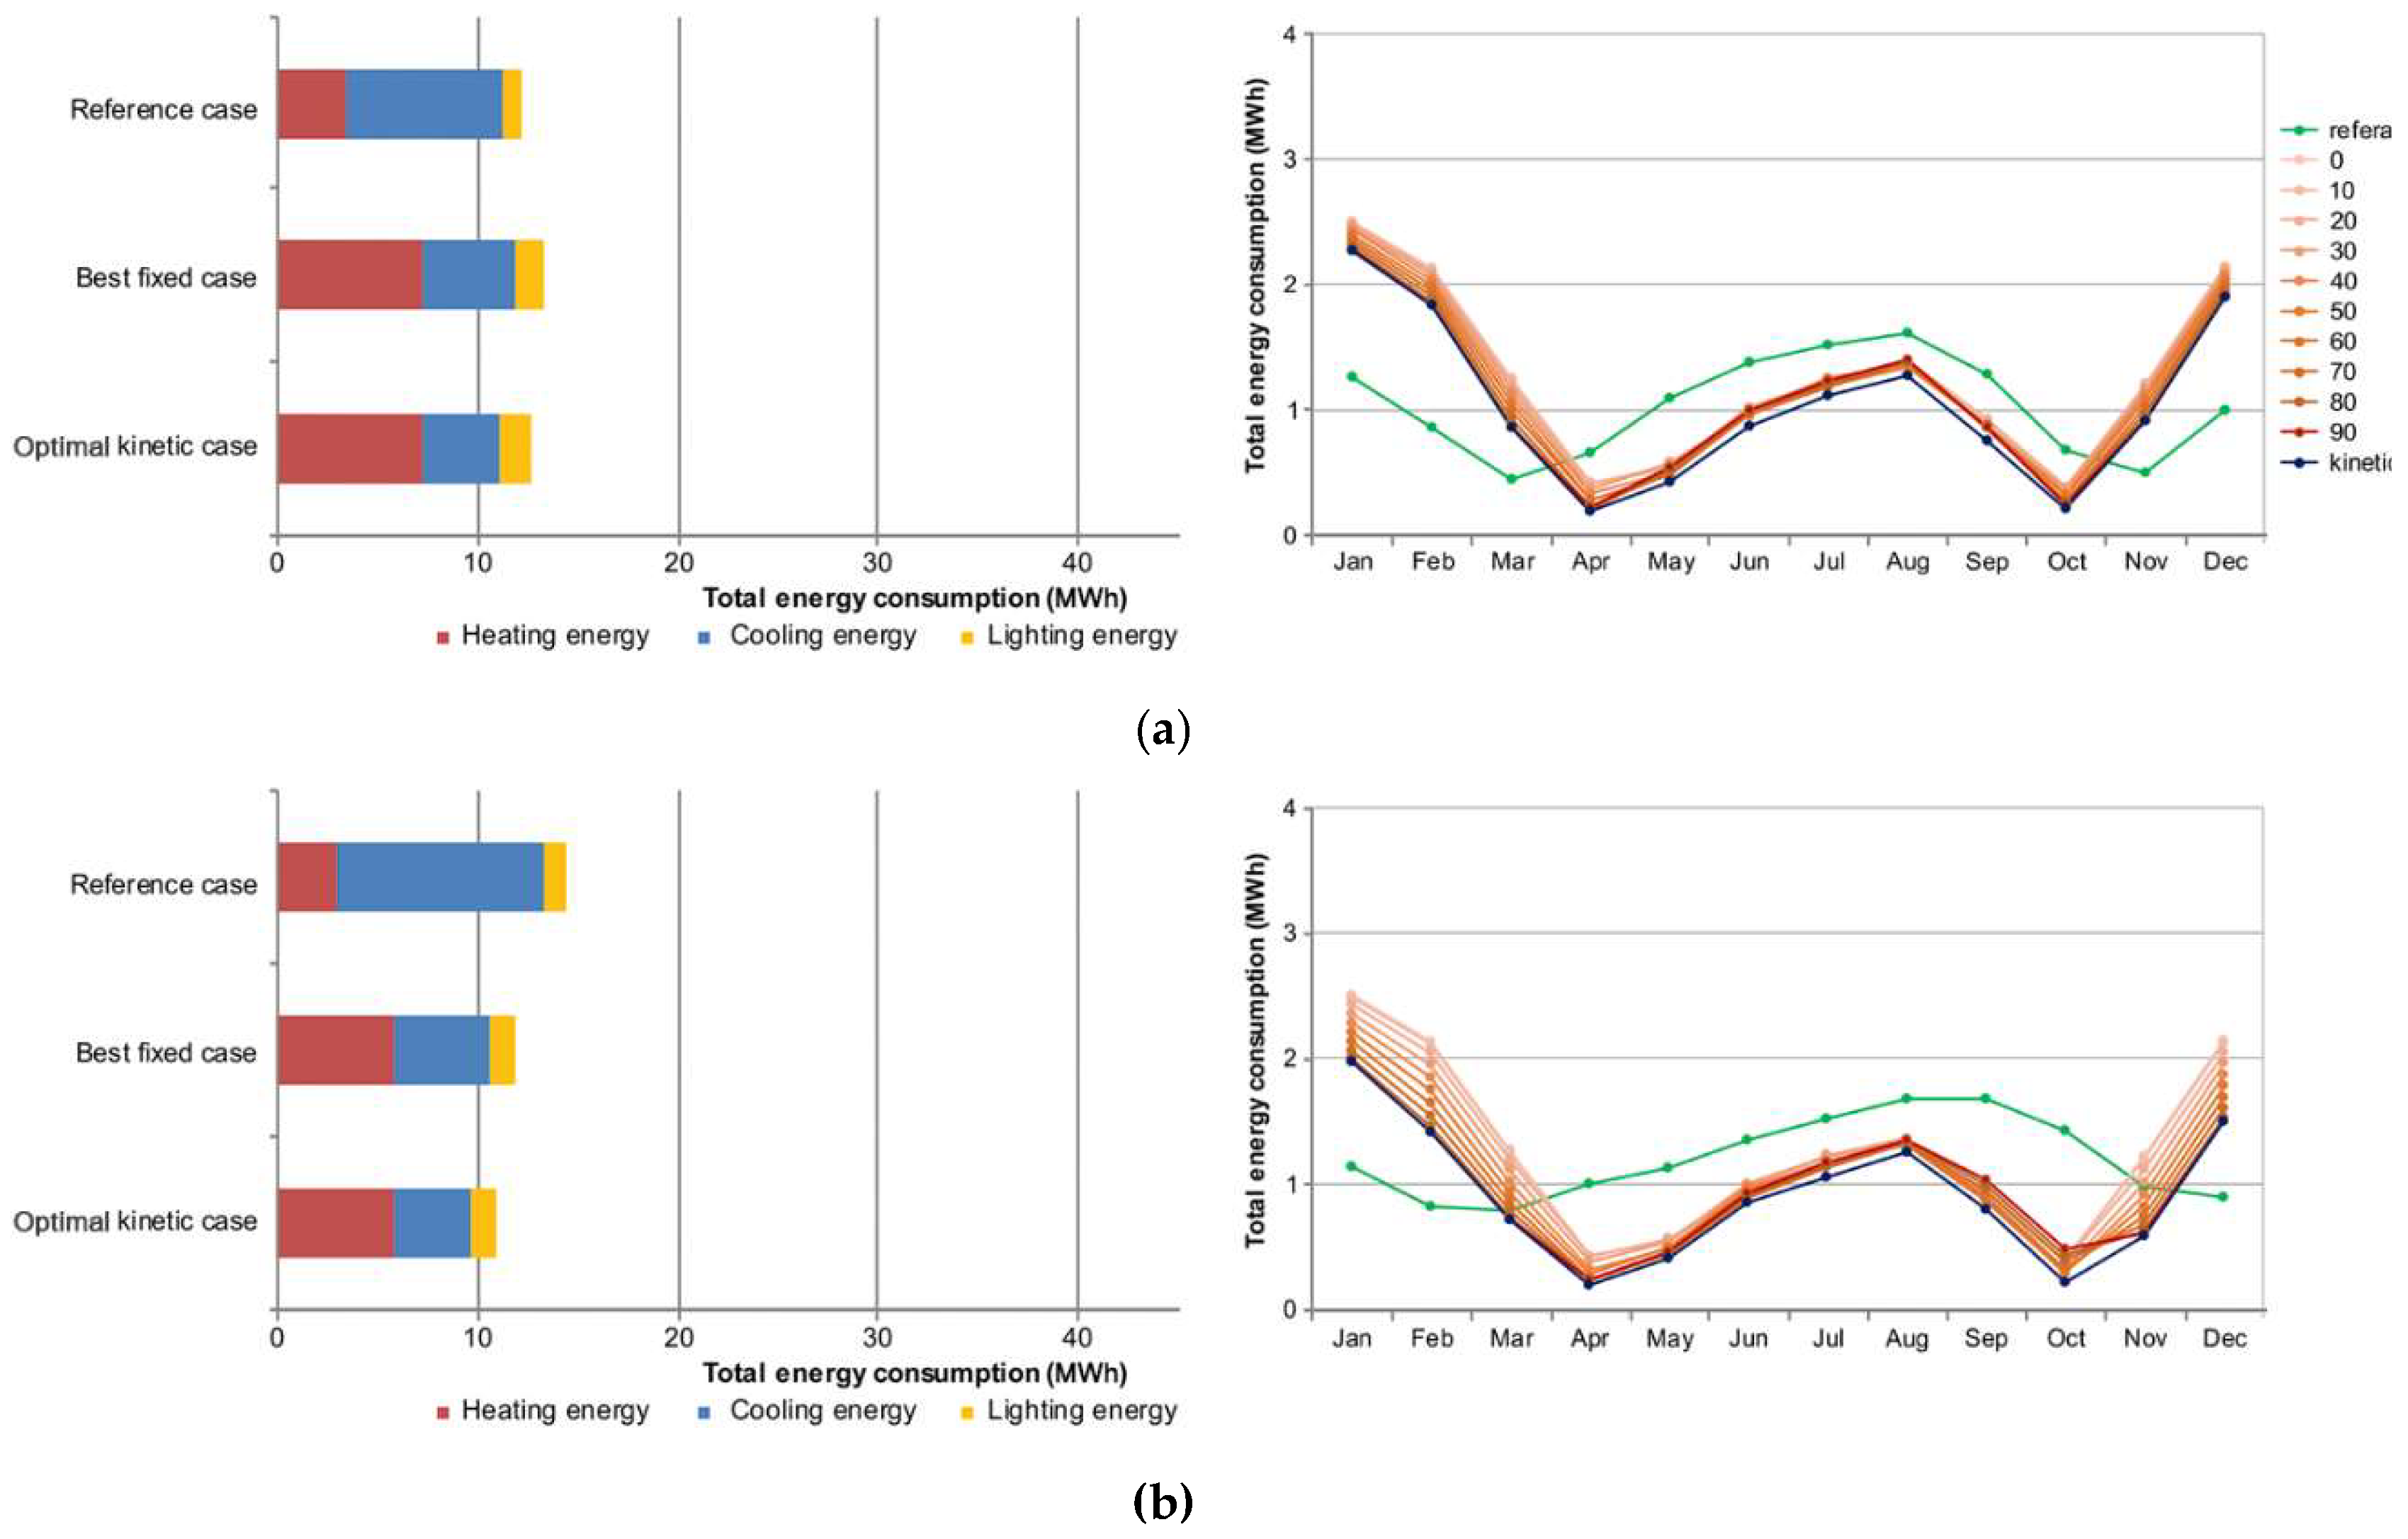
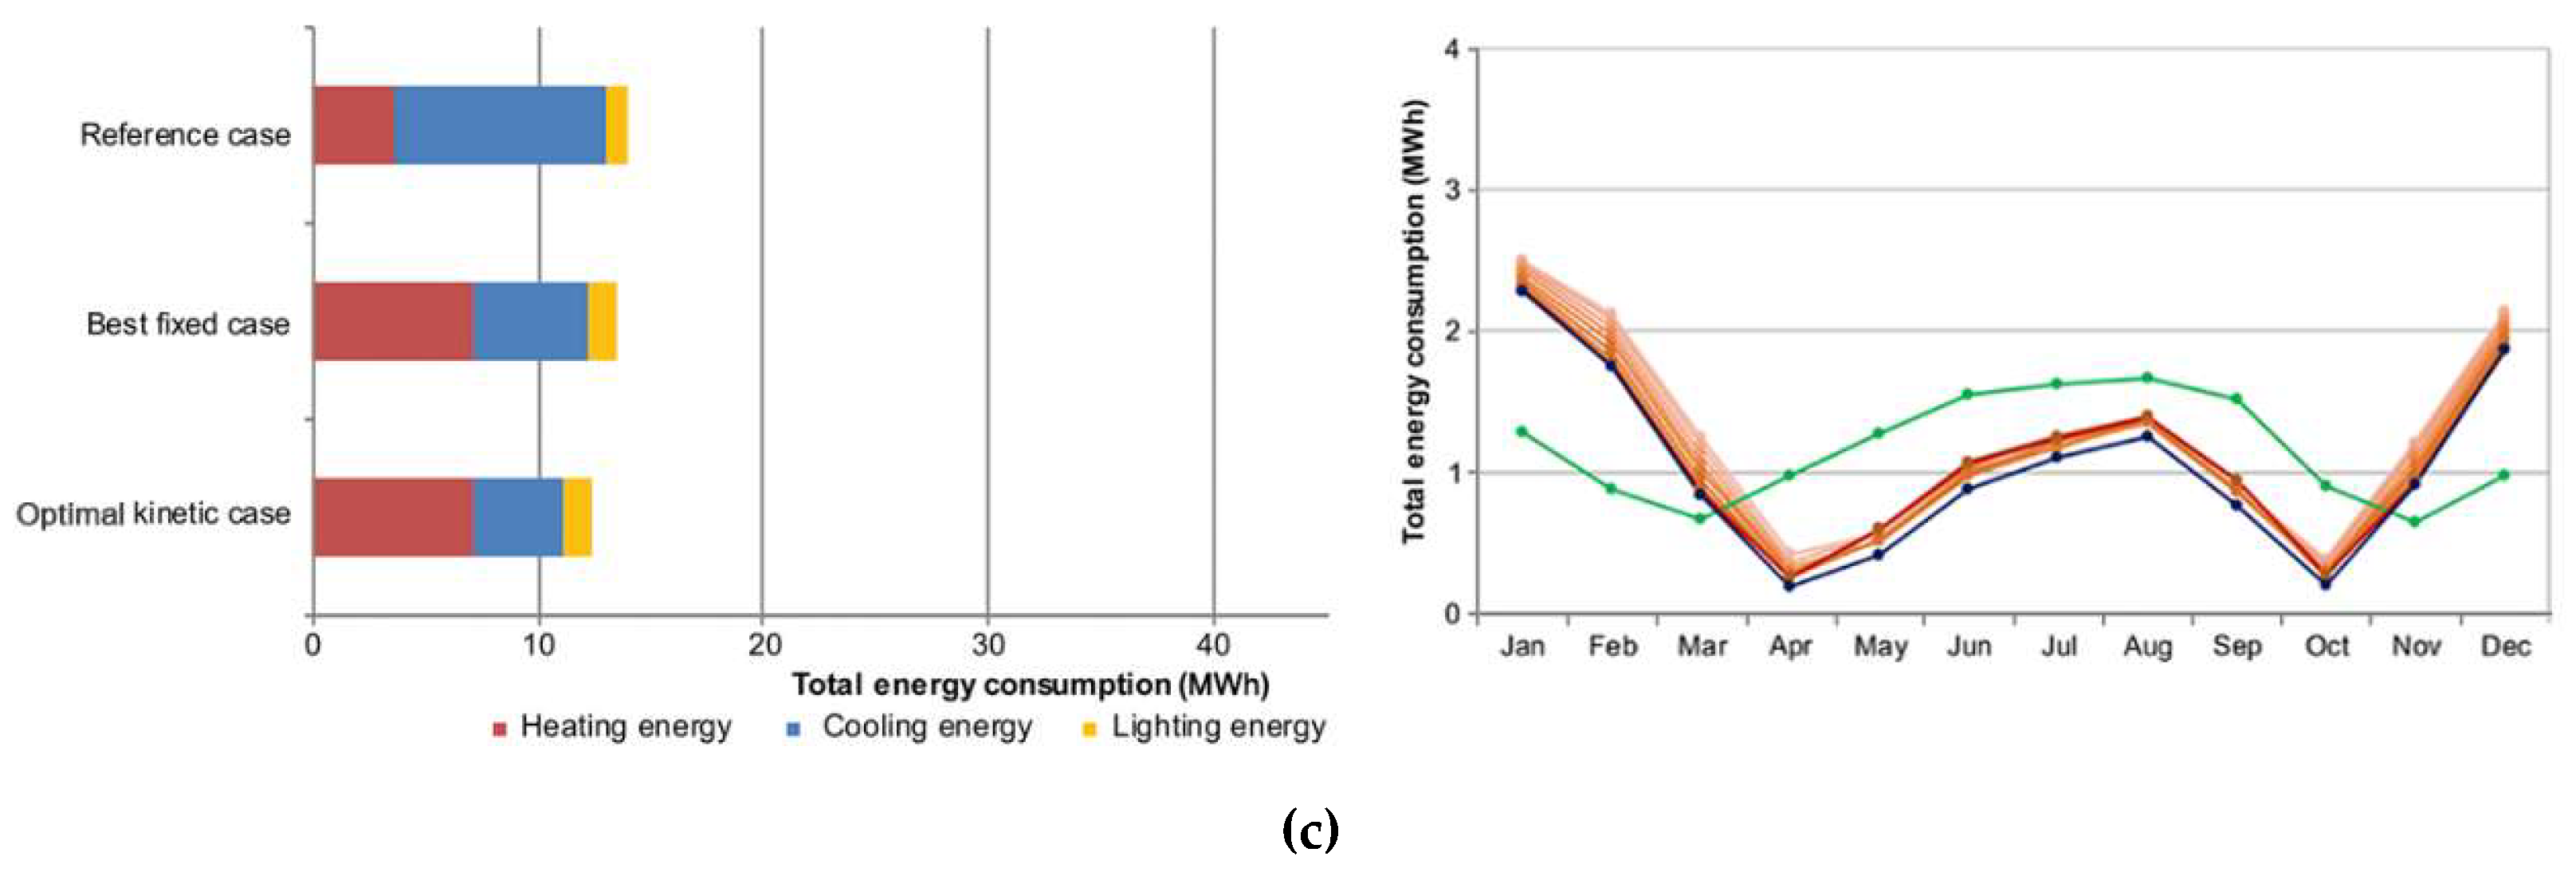
Results of comparisons for the heating, cooling, and lighting energy consumption profile induced by fixed and kinetic shading devices are illustrated clearly in Figure 7, Figure 8 and Figure 9. Optimal kinetic operation in Abu Dhabi or Hanoi did not ensure significant additional energy reduction from the best-fixed cases. However, in the case of Seoul, additional energy reduction was relatively high.
Reduction rates in total energy consumption through kinetic operation were as follows: 21.5% (east), 28.7% (south), and 22.8% (west) in Abu Dhabi; 24.4% (east), 28.2% (south), and 26.3% (west) in Hanoi; and −2.4% (east), 23.8% (south), and 10.8% (west) in Seoul. Additional reductions from kinetic devices compared to the best-fixed case were as follows: 0.3% (east), 1.3% (south), and 1.0% (west) in Abu Dhabi; 0.5% (east), 0.9% (south), and 0.9% (west) in Hanoi; and 5.7% (east), 6.3% (south), and 7.2% (west) in Seoul.
In the cases of Abu Dhabi and Hanoi, monthly energy consumption on the east side (Figure 7 and Figure 8) and the west side (Figure 7 and Figure 8), showed a symmetric pattern. Reduction effects of shading devices were almost the same during the year. Energy reductions of fixed shading devices in these two regions (Table 4) mainly resulted from a decrease in cooling energy at the expense of a small increase in lighting energy. The kinetic operation improved daylight performance additionally. However, the monthly pattern of total energy demand of kinetic shading operation in these two regions remained nearly the same as that of the best-fixed case. This meant that fixed-type shading devices worked sufficiently, while the applicability of kinetic shades in these two regions would not be highly expected.
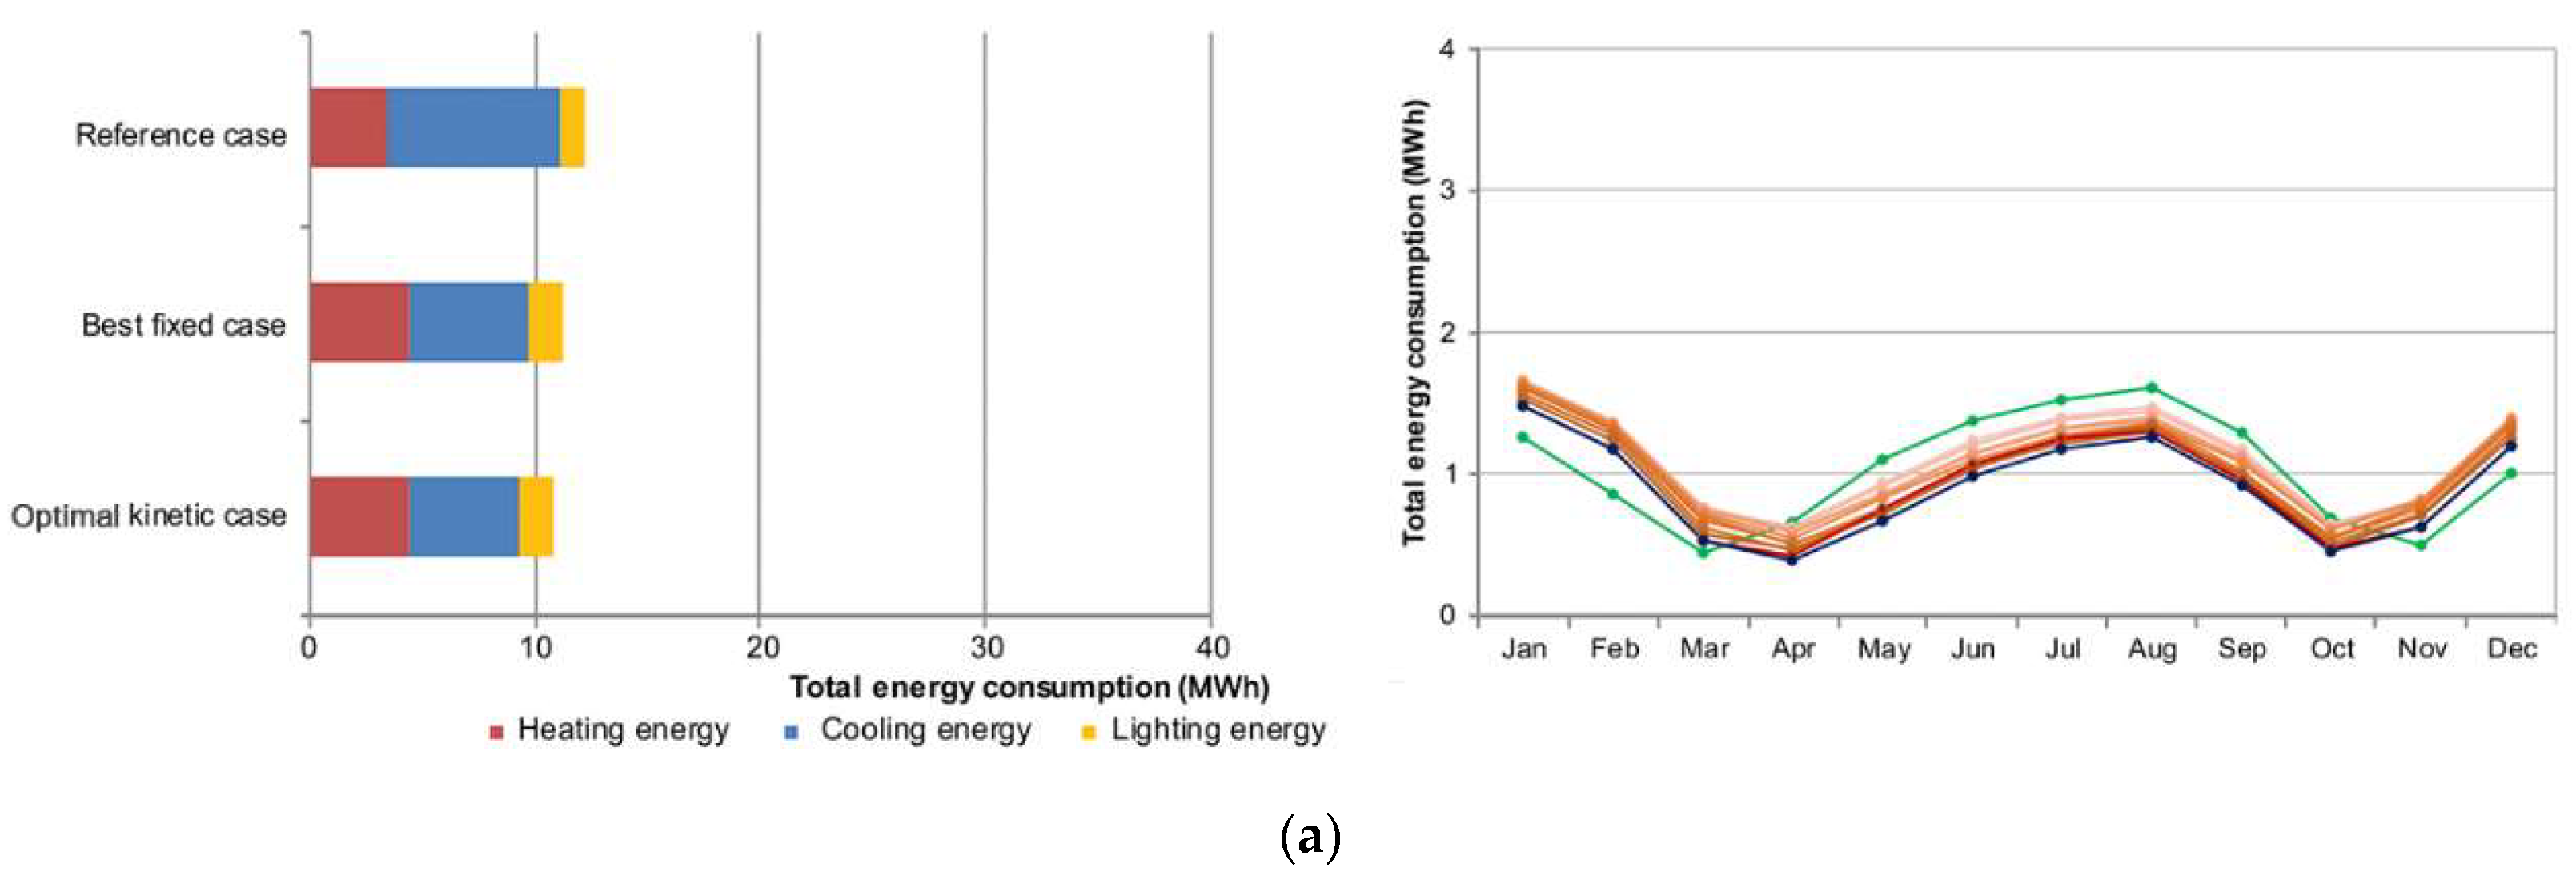
On the other hand, in the case of Seoul (Figure 9), a reduction of total energy demand as a result of optimized kinetic operation was mainly found during summer However, noticeable reduction effects were not found during winter. Therefore, a seasonal optimal operation mechanism was found, which offset the rigidity of fixed shading devices, resulting in additional heating energy demand as a side effect. Comparison data, summarized in Table 4, show that the primary benefit from optimal kinetic operation was an additional reduction in cooling energy, while heating and lighting energy were almost the same as those of the best-fixed cases. In particular, the south side showed the most prominent deviation pattern compared to that of the best-fixed case, resulting in the most positive potential for the operation of kinetic shades. Simulation results showed that kinetic shading devices improved total energy performance on all three sides in all three cities, except the east side case in Seoul.
4.2.2. Optimal Operation of Rotating-Type Kinetic Shading
Results of energy consumption in the reference case, best-fixed case, and optimal kinetic case are compared and summarized in Table 5. Profiles of monthly total energy demands are compared and shown in Figure 10, Figure 11 and Figure 12.
Reduction rates in total energy consumption through kinetic operation (Table 5) were as follows: 23.9% (east), 32.1% (south), and 26.5% (west) in Abu Dhabi; 19.1% (east), 24.5% (south), and 23.0% (west) in Hanoi; and 12.2% (east), 29.4% (south), and 27.3% (west) in Seoul (Table 5). For the performance of optimal kinetic operation, additional energy reduction rates of a kinsetic facade compared to the best-fixed case were as follows: 2.7% (east), 2.5% (south), and 3.3% (west) in Abu Dhabi; 1.4% (east), 3.7% (south), and 3.3% (west) in Hanoi; and 3.3% (east), 2.1% (south), and 6.4% (west) in Seoul.
Additional energy savings of rotating-type kinetic operation compared to the best-fixed cases were more satisfactory than those of folding-type kinetic operation. The energy saving mechanism was also apparently different; the rotating-type kinetic operation resulted in the cooling and lighting energy demands reduction, unlike the folding-type kinetic operation, which resulted in cooling energy demand reduction at the expense of lighting energy increase.
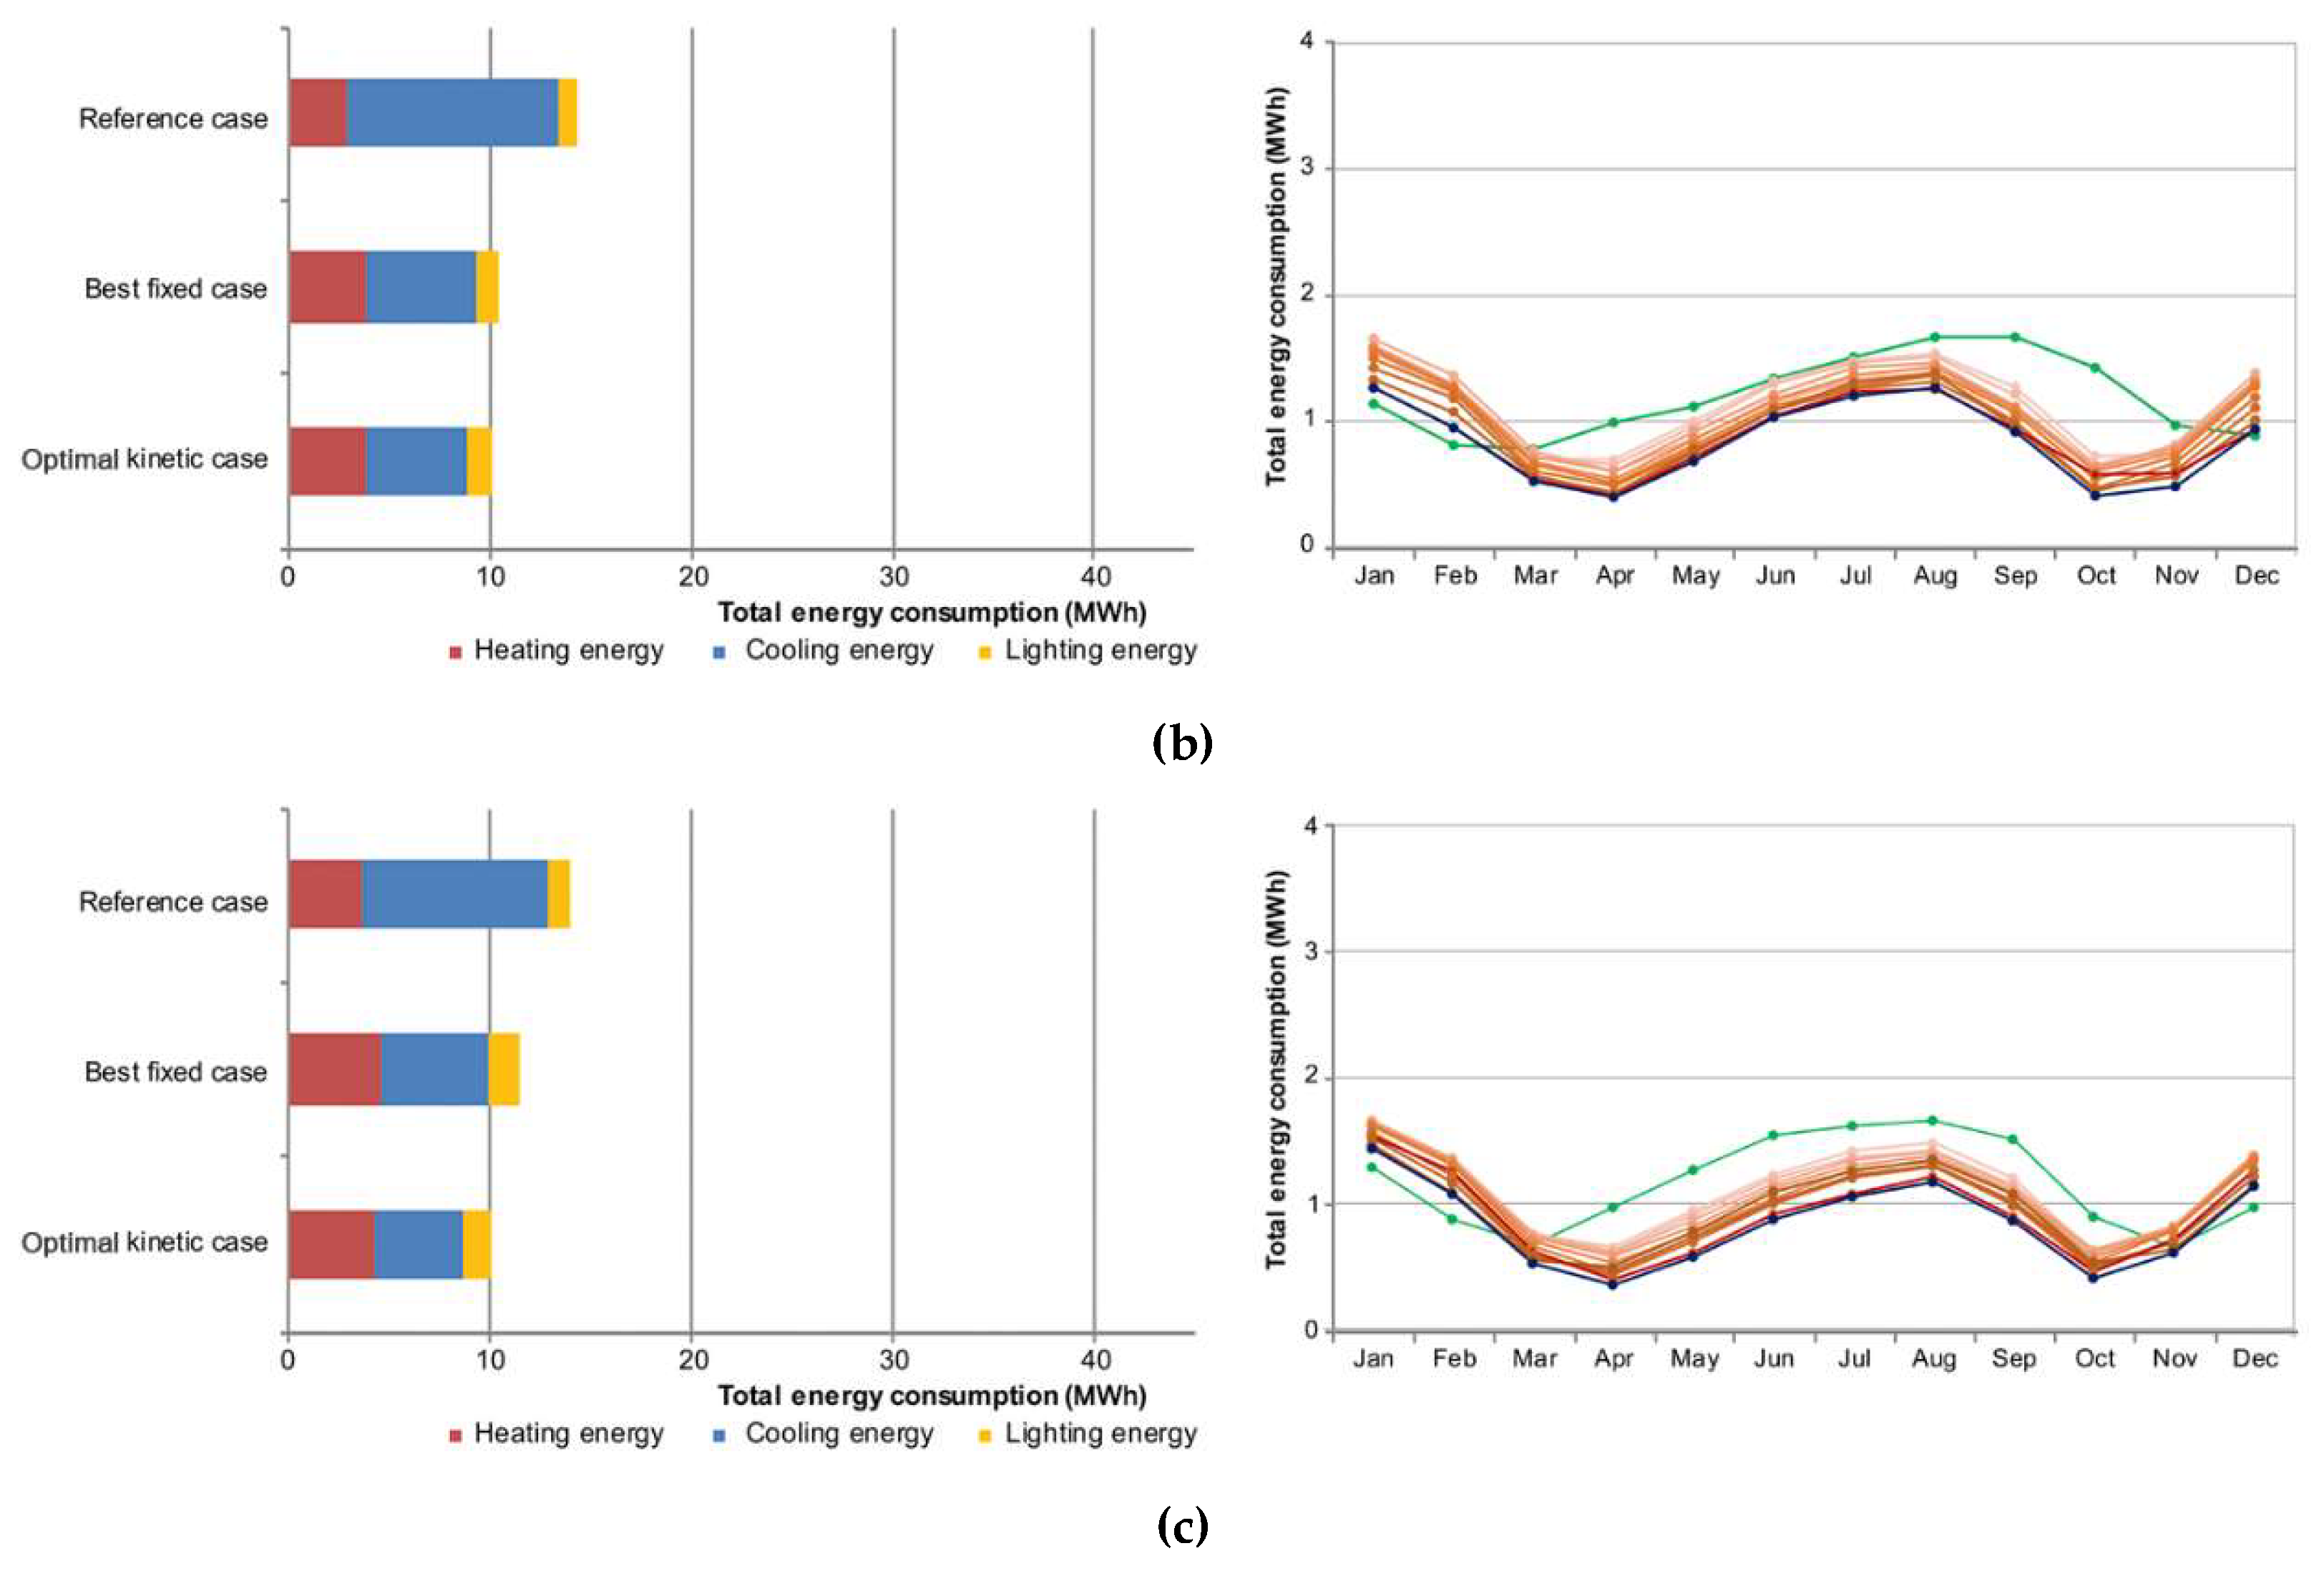
In the case of Abu Dhabi (Figure 10), the effect of optimal kinetic operation occurred year-round, although the gap in total energy consumption between optimized kinetic operation cases and best-fixed cases had a narrow range. Through kinetic operation, rotating-type shading devices resulted in better performance, both in cooling and lighting, energy saving compared to folding types.
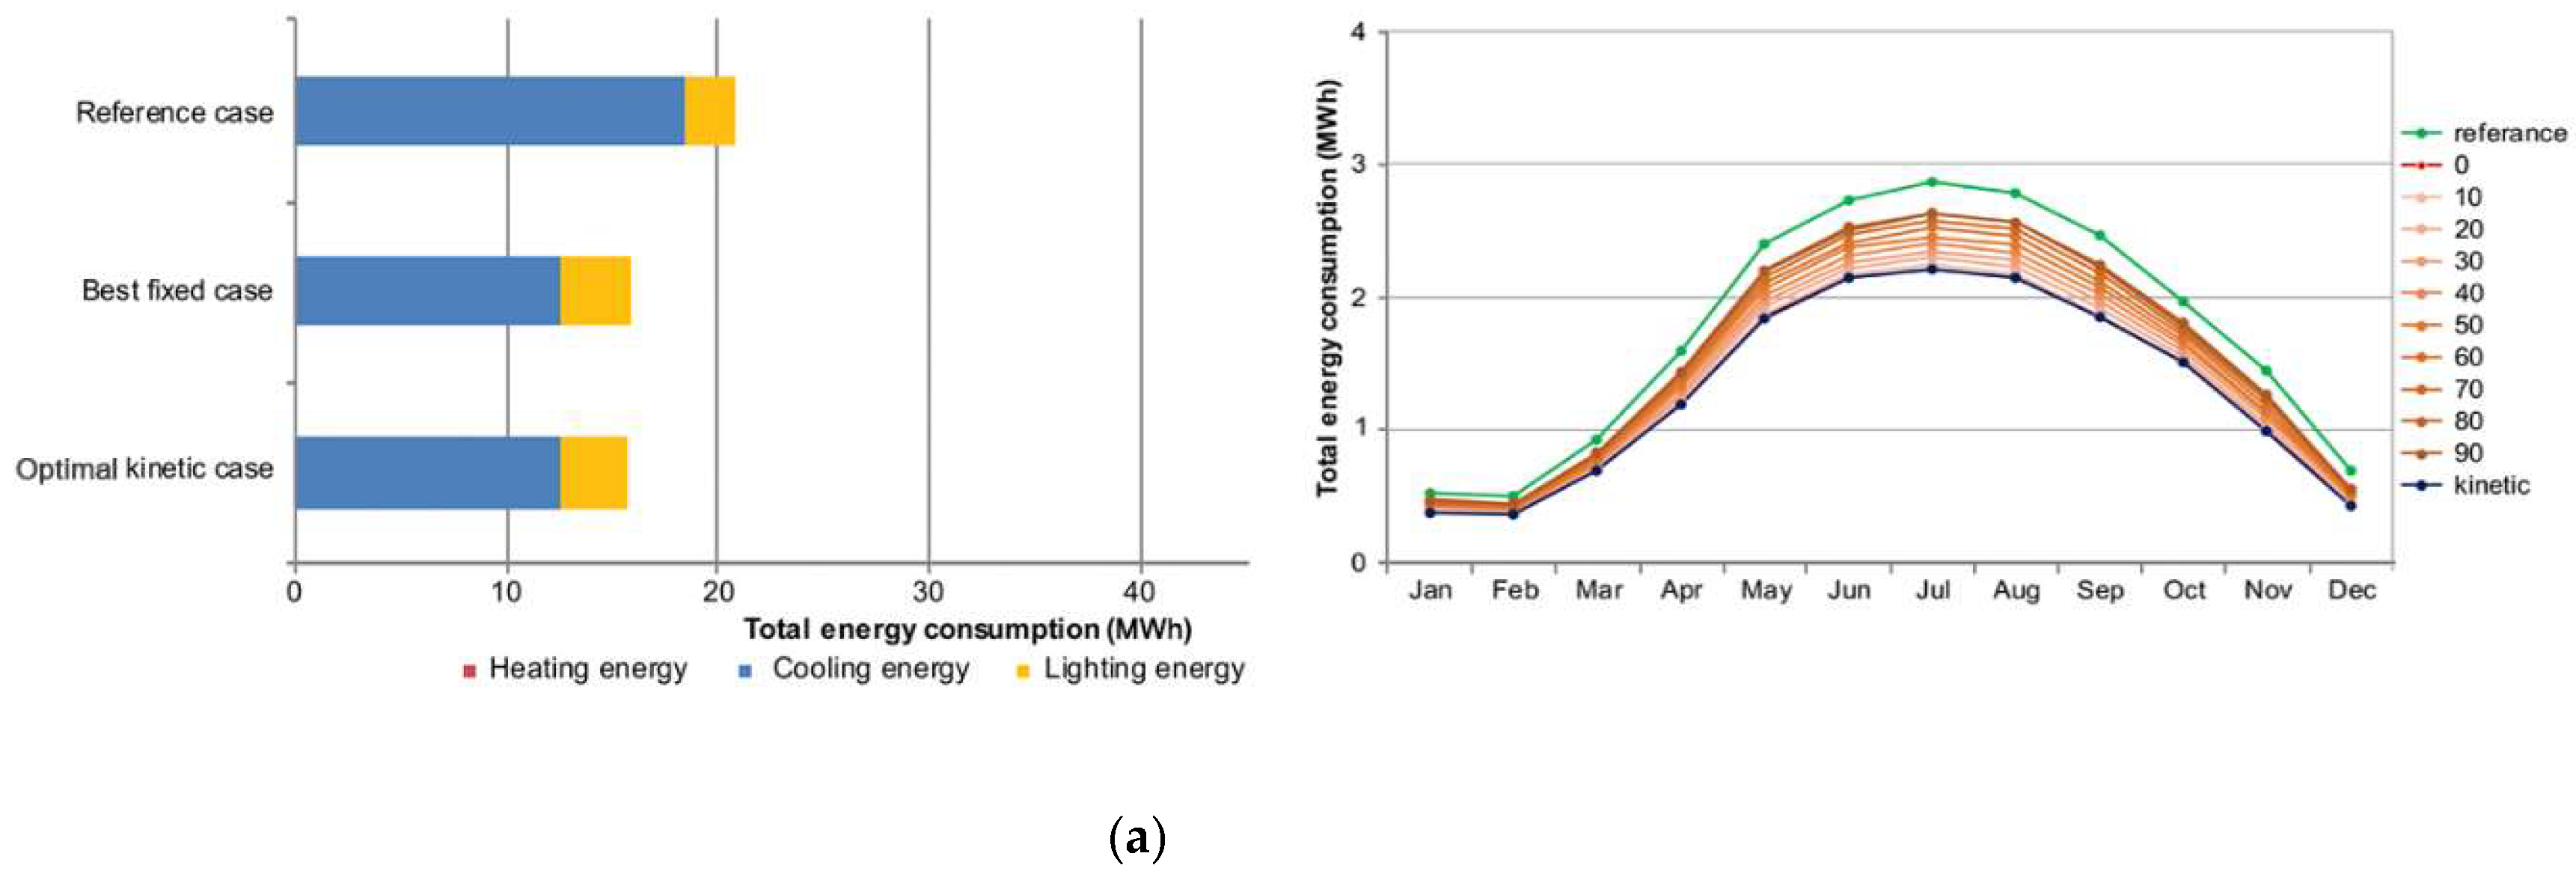
In the case of Hanoi (Figure 11), benefits of rotating-type kinetic operation were found in both cooling and lighting energy saving. Their reduction rates were far better than those of folding-type kinetic operation. However, kinetic operation failed to cover the gap between the best-fixed cases of folding-type and rotating-type shading devices. In Seoul, the effects of kinetic operation were different depending on the orientation. For the east side case, cooling energy demand was reduced, compromising lighting energy demand. However, for the south side case, energy saving was only found for cooling energy demand. The west side cases showed prominent energy saving results, with reductions in every component of energy demand—heating, cooling and lighting energy.
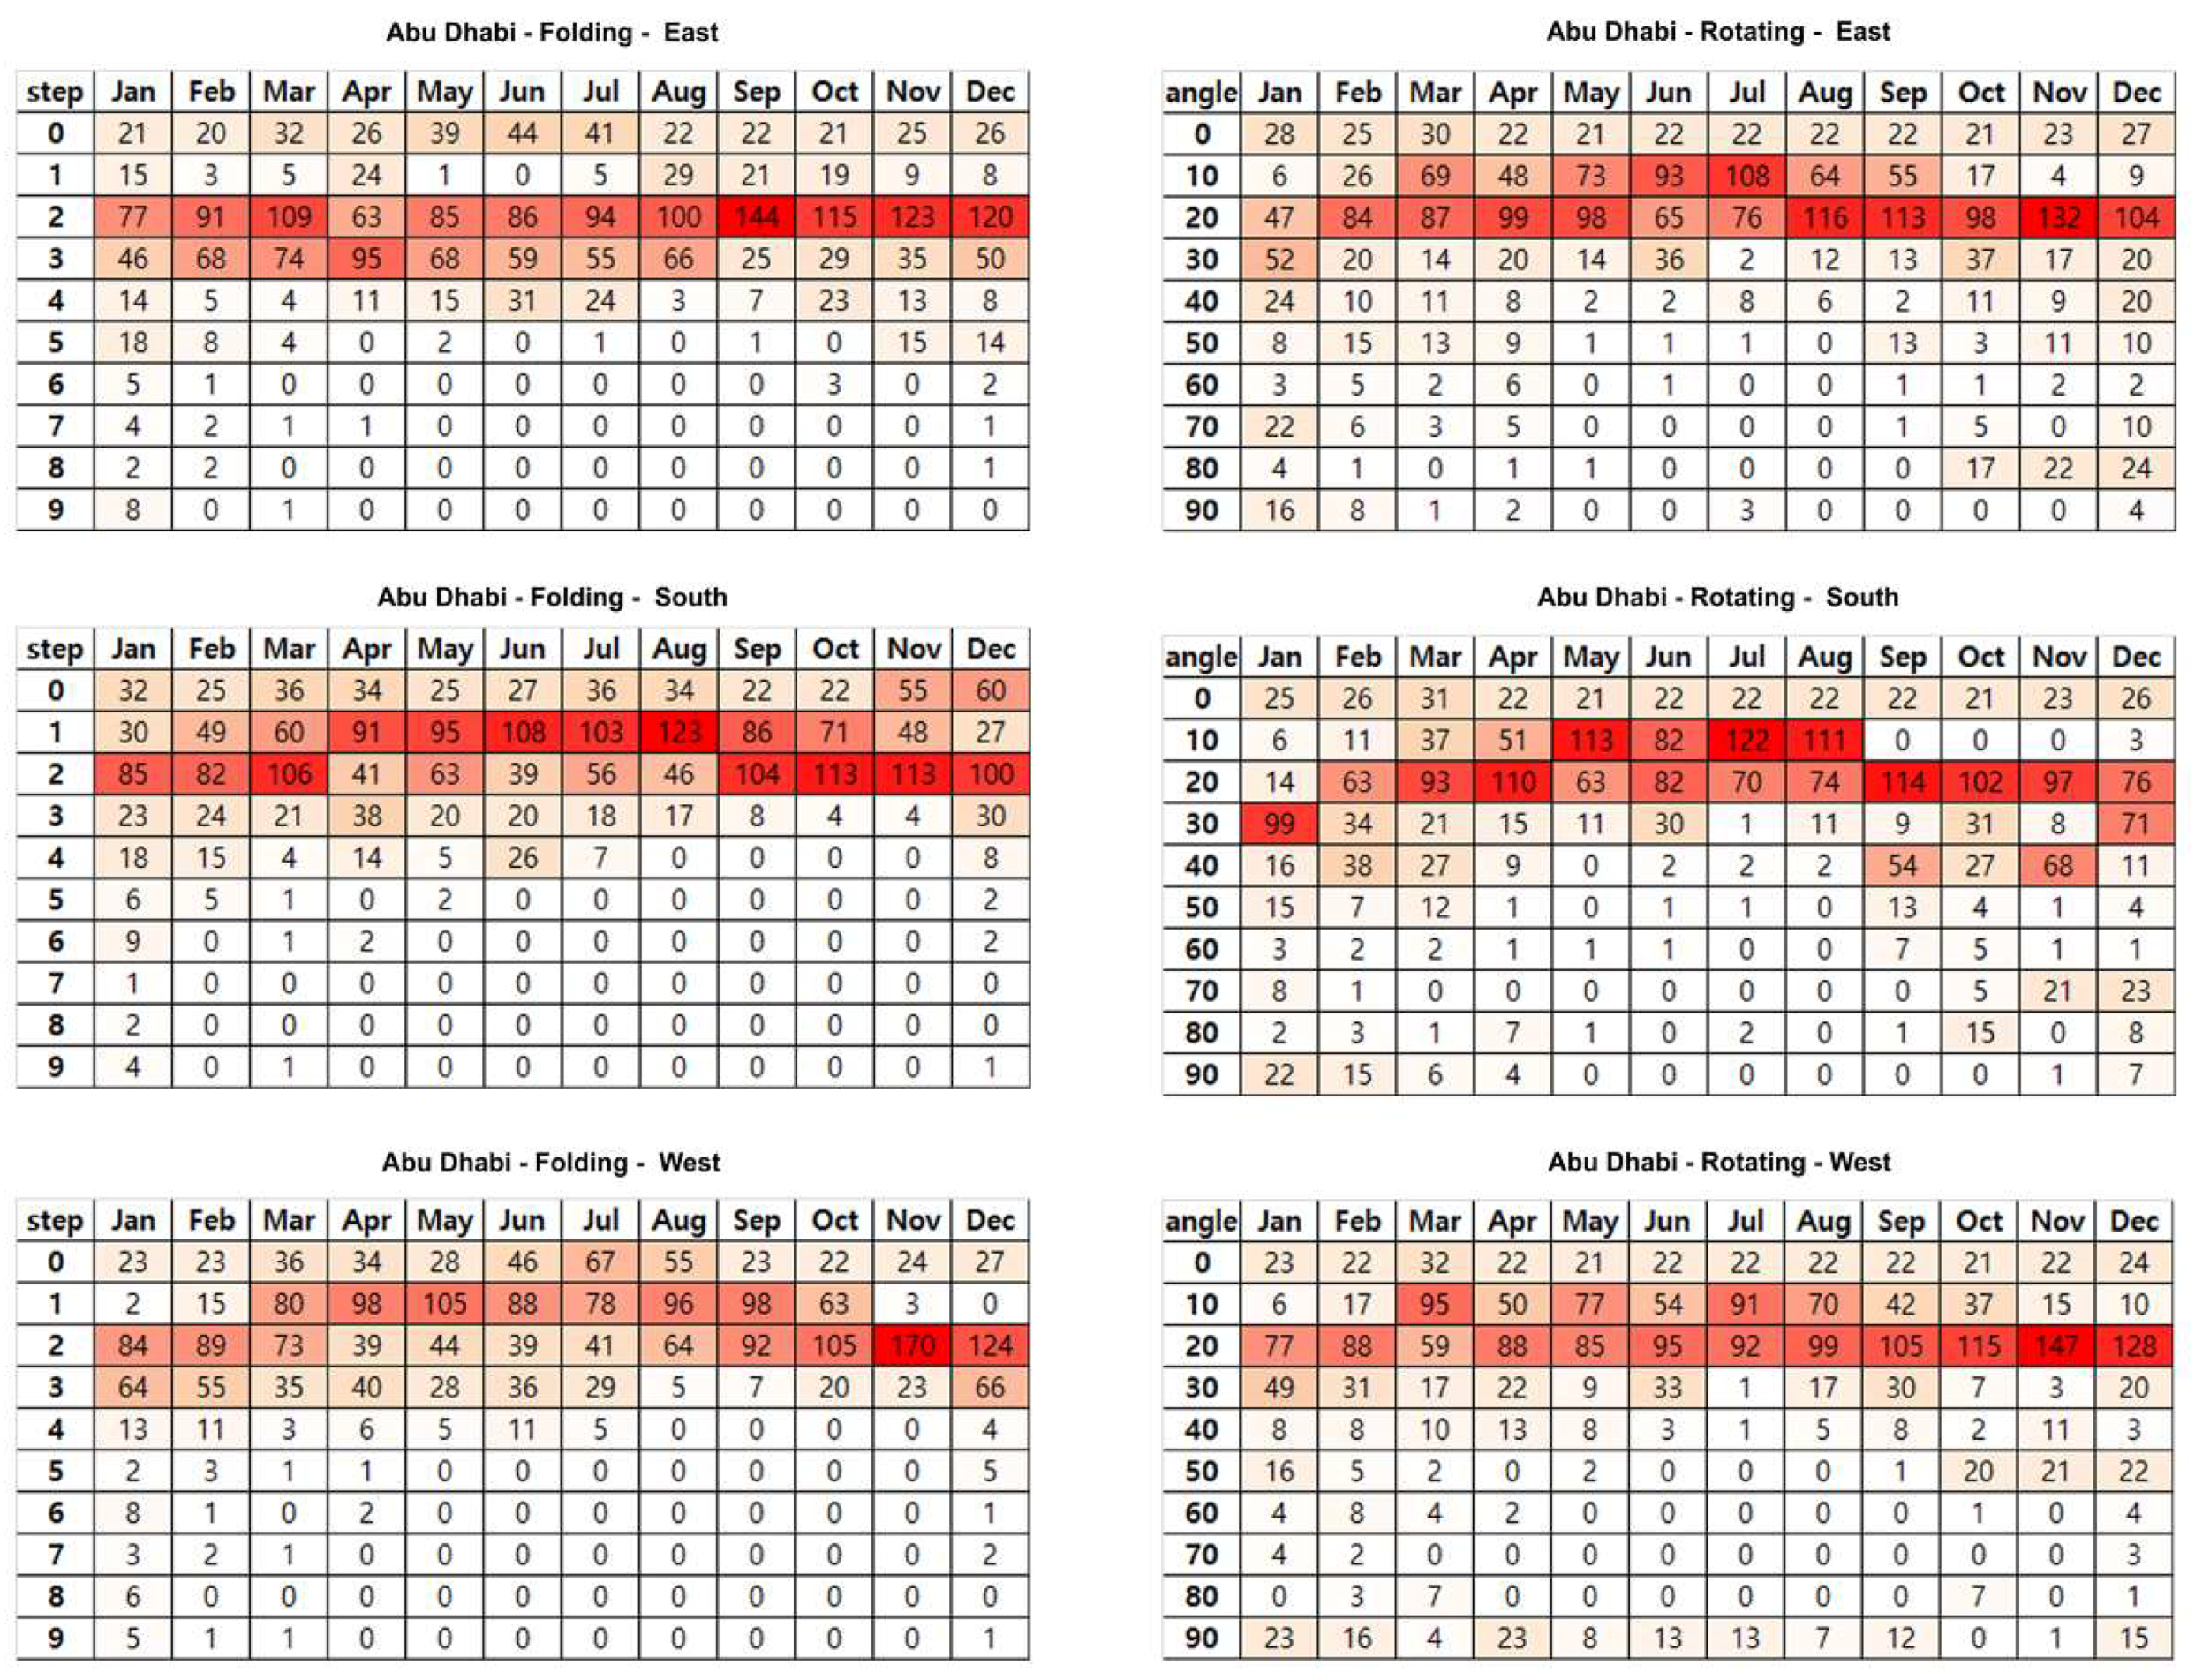
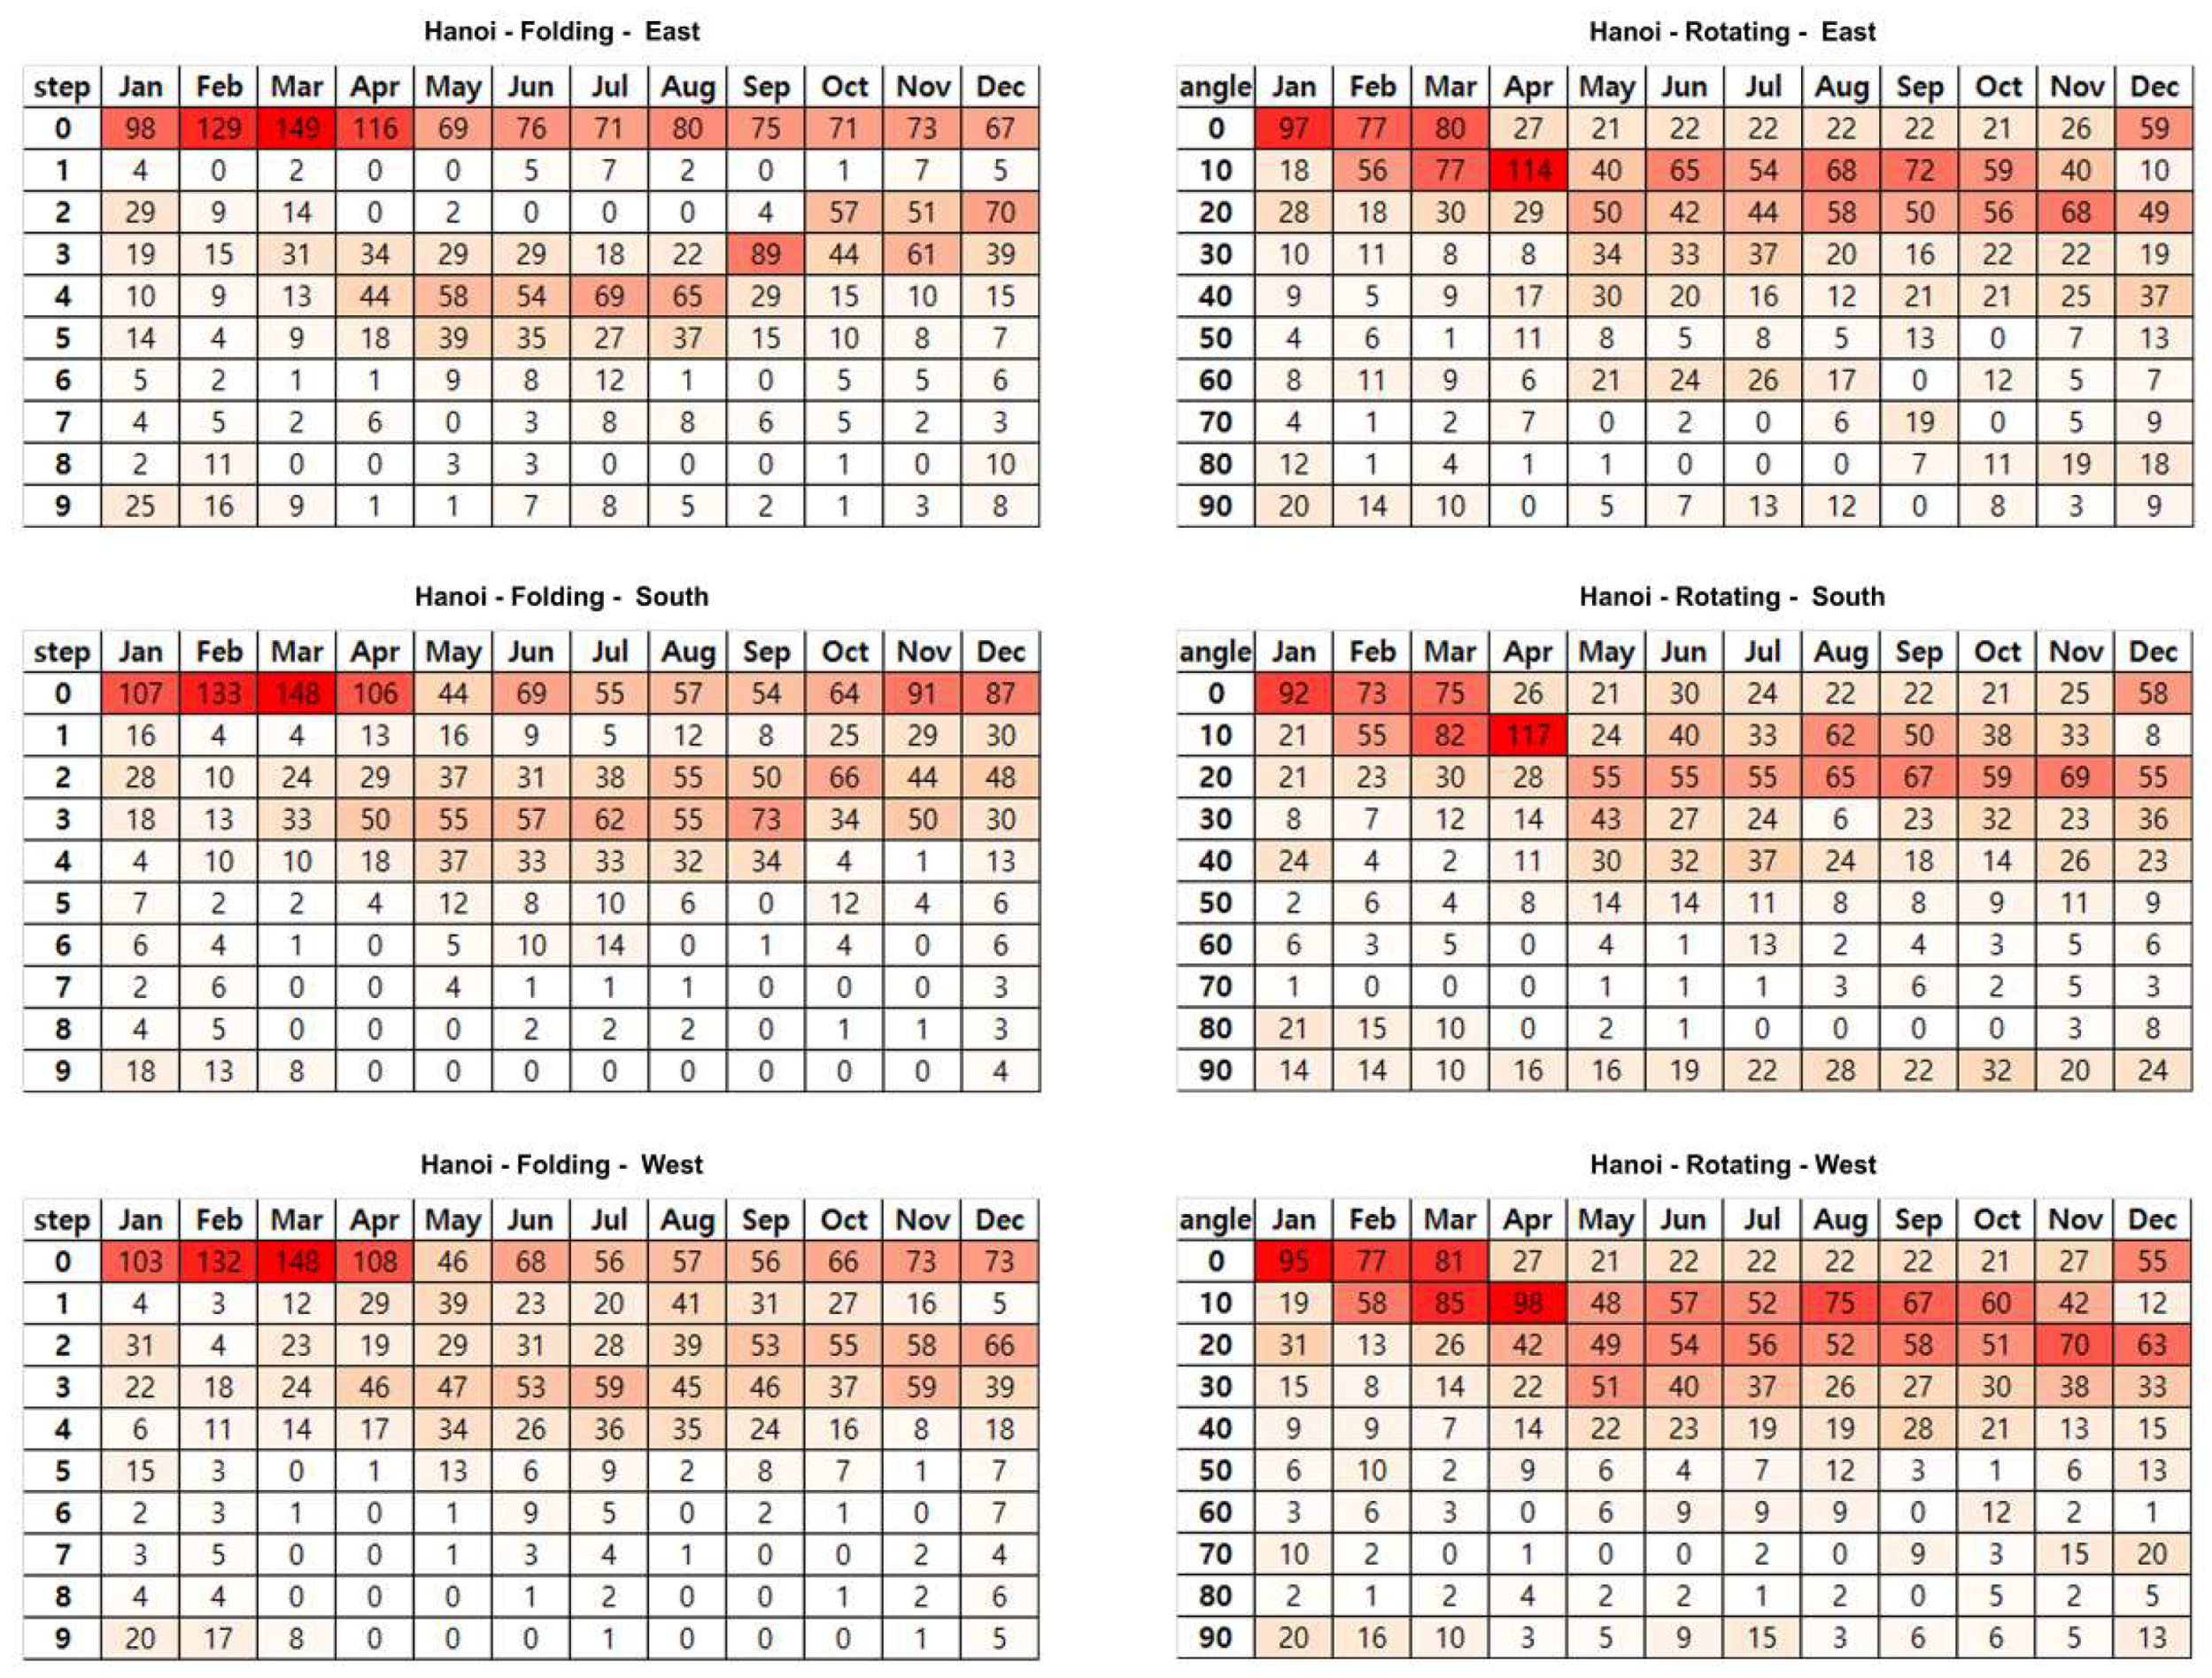
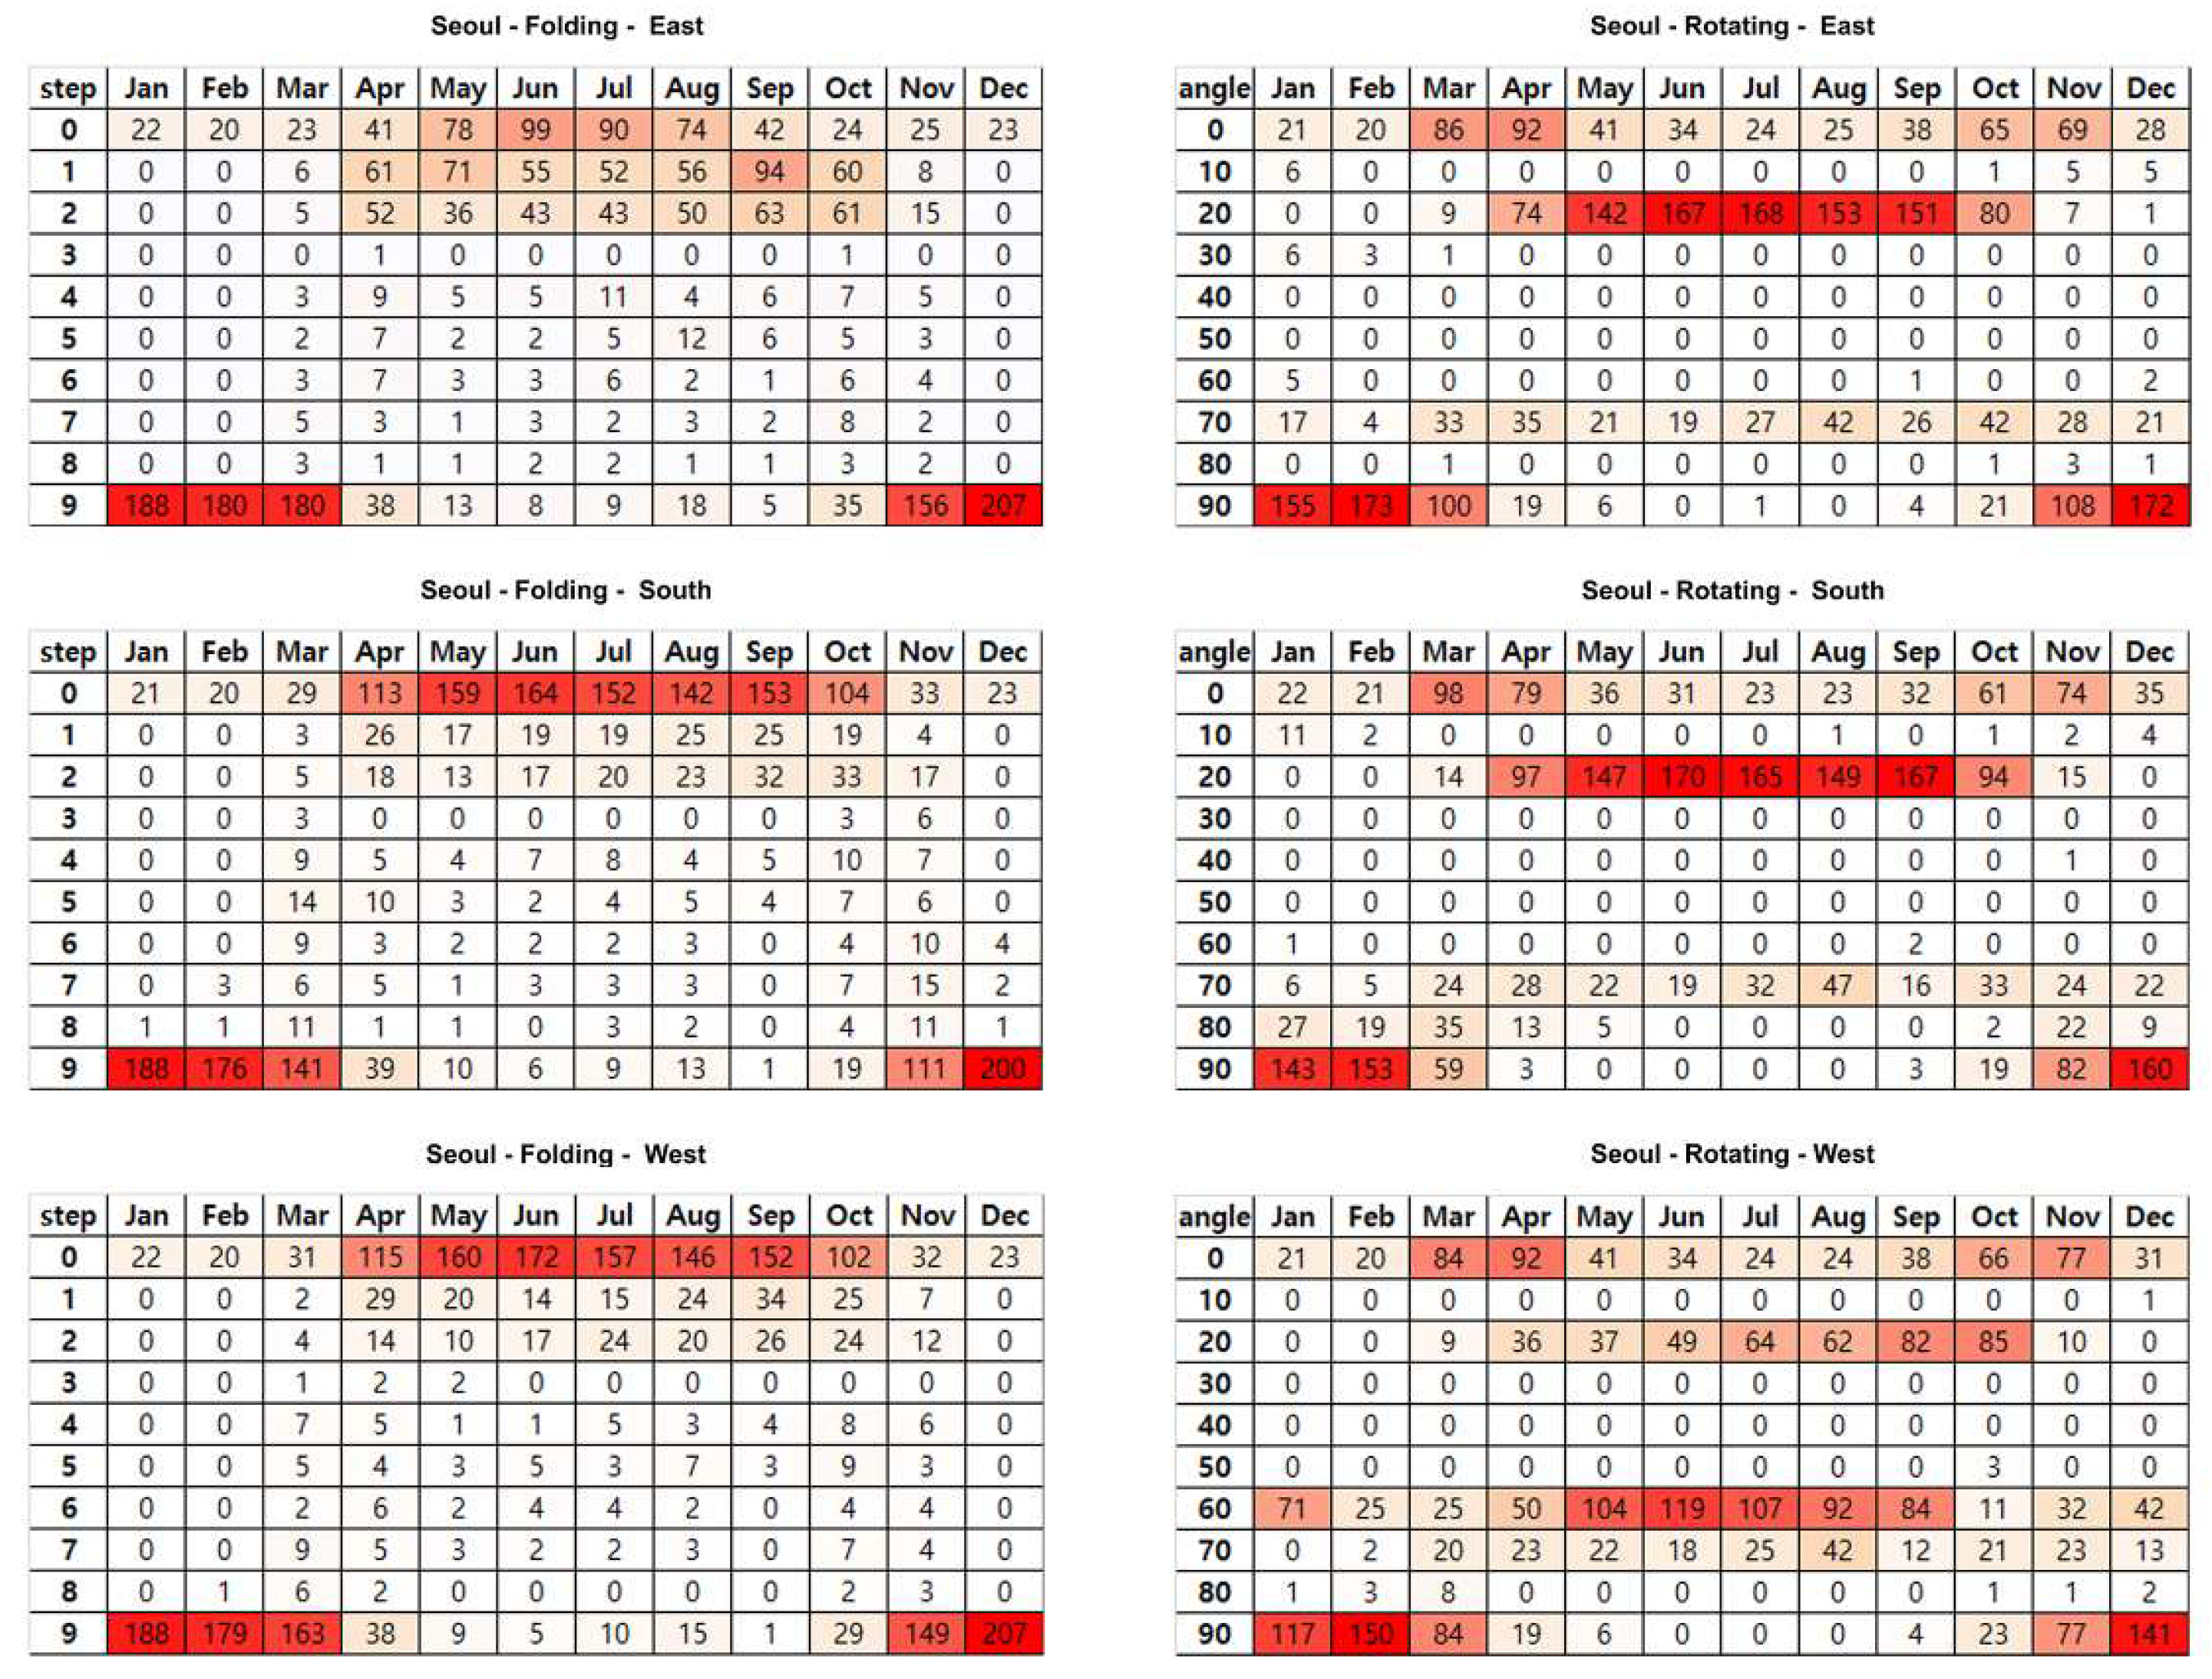
4.3. Kinetic Operation Frequency
Monthly frequencies of the optimized position or angle for each type of kinetic shading in the three cities were analyzed through counting the monthly frequency of each fixed-type case. Frequency heat maps were used to clearly illustrate the patterns of operation (Figure 13, Figure 14 and Figure 15). The dispersed pattern of monthly frequencies showed active kinetic operations from one position to another. The cooling dominant climate condition resulted in a recurrent optimal kinetic operation. However, a heating dominant climate did not require an active adjustment. In Abu Dhabi and Hanoi, the distribution of frequent positions or angles demonstrated that the rotating type operated more actively than the folding type (Figure 13 and Figure 14). Active operation resulted in positive energy savings compared to the folding-type kinetic operation. Results also showed marginal applicability of kinetic operation, because energy demands in actively optimized kinetic operation of the rotating type in Hanoi (16.9 MWh, 16.3 MWh, and 16.4 MWh for the east, south, and west zones, respectively) was higher than that of the best-fixed case of the folding type (15.9 MWh, 15.7 MWh, and 15.9 MWh for the east, south, and west zones, respectively) (Table 4 and Table 5). The active kinetic operation worked, but active operation itself did not encompass the drawbacks of shading device types, such as the folding and rotating types.
However, the case in Seoul showed a different pattern. Its neatly separated dominant position or angle verified seasonal optimal operation according to the seasonal change (Figure 15). During winter, from November to February, folding and rotating types had almost the same optimized operation pattern in which both types of shading devices were fully open. On the other hand, during the summer, the rotating type showed more active operation, similar to the cases in Abu Dhabi and Hanoi. The rotating-type slats rotated mainly among 0°, 20°, and 60°/70° angles, while the folding type operated within a narrow range of 0, 1-Step, and 2-Step.
5. Conclusions and Discussion
In this study, the energy performance and applicability of kinetic shading devices of the vertical folding and horizontal rotating type were evaluated. Total energy saving effects of kinetic shading devices were analyzed and compared quantitatively through year-round simulation in three Asian cities (Seoul, Abu Dhabi, and Hanoi) with different climate conditions to those of fixed shading devices and a reference case without shading. Both types of kinetic shading devices were devised to operate in ten steps. They were automatically controlled every hour to adjust their position or angle so that total energy consumption was minimized. The major conclusions are listed below:
1. Total energy reduction was found after adopting fixed shading devices. Reduction rates of best-fixed shading cases ranged from 3.6% to 29.6%; except for the east case of the folding-type shading devices in Seoul with negative effects of an 8.1% increase. After applying optimized kinetic operation, energy reduction rates improved and final energy reduction rates ranged from 2.4% to 32.1%, due to additional energy reductions through optimized kinetic operation ranging from 0.3% to 7.2%. In Abu Dhabi and Seoul, rotating types outperformed folding types. On the other hand, folding types were found to be more effective in Hanoi.
2. Simulation results showed that optimized kinetic operation had positive effects on energy saving. However, the energy saving potential of kinetic operation was less promising than for fixed shading devices in all regions. In all regions, kinetic operations with inferior types did not overcome the deficient energy saving potential of fixed shading devices. Folding-type shading with kinetic operation in Abu Dhabi and Seoul did not lead to energy saving results of best-fixed case of the rotating type. This means that selection and design of proper shading typologies for the kinetic facade should be considered together with kinetic operation.
3. Benefits and drawbacks of kinetic shading in these three regions were affected by the energy demand profiles of heating, cooling, and lighting. Shading application on the facade caused not only cooling energy reduction, but also heating and lighting enegy increase as side effects. However, operation patterns coping with such side effects are different depending on climate conditions in each region. Kinetic operation was the most useful in Seoul where seasonal optimized adjustment is required to tackle seasonal changes in heating and cooling energy demand. In Abu Dhabi and Hanoi, the kinetic operation took place hour-to-hour in order to balance cooling and lighting energy. Shading devices mainly maintained the position or angle to minimize cooling energy, and transformed to a certain postion or angle to let light in and reduce lighting energy demand. In Abu Dhabi, lighting energy reductions could be achieved by daily and hourly optimal operation, especially for rotating-type kinetic facades. However, such additional cooling-lighting energy balancing effects were not observed in Hanoi.
4. The activation of the kinetic operation of each type of shadings and correlations with energy saving potentials were analyzed by investigating the distribution patterns of the position or angle frequency. Kinetic operation was kept within a limited range during winter. On the other hand, kinetic shading operated actively during summer. Frequency patterns were more widely distributed in the rotating-type kinetic operation, resulting in higher energy saving potentials.
The kinetic shadings require additional energy for operation, but this study did not include operation energy in the evaluation. Frequent kinetic operations require extra energy, so the optimal interval of service should be addressed in further research. The real-time control algorithm and processing framework of sensing, analyzing, and operating needs to be researched further. An integration methodology and mechatronic design of actual sensors, embedded data processors, and actuators need to be followed to apply the kinetic shading system in the field. The effectiveness of the integrated system also needs to be evaluated through mock-up field tests. Further research on a cost-effective optimal operation algorithm considering a confined range of frequency distributions and the electrical energy for kinetic movement is needed.
Supplementary Materials
The following are available online at https://www.mdpi.com/2071-1050/11/5/1253/s1, Table S1: Annual energy consumption in Abu Dhabi, Hanoi and Seoul (folding type), Table S2: Annual energy consumption in Abu Dhabi, Hanoi and Seoul (rotating type).
Funding
This research received no external funding.
Conflicts of Interest
The author declares no conflict of interest.
References
- IEA. Energy Climate Map; International Energy Agency: Paris, France, 2013. [Google Scholar]
- IEA. Modernising Building Energy Codes to Secure our Global Energy Future; IEA/UNDP: Paris, France, 2013. [Google Scholar]
- Magliulo, C. Cities, Towns, Regions Partner to Help Achieve Paris Goals. Available online: https://unfccc.int/news/cities-towns-regions-partner-to-achieve-paris-goals (accessed on 27 January 2019).
- Chan, A.L.S.; Chow, T.T. Evaluation of Overall Thermal Transfer Value (OTTV) for commercial buildings constructed with green roof. Appl. Energy 2013, 107, 10–24. [Google Scholar] [CrossRef]
- Ministry of Land, Infrastructure and Transport of Korea. Operational Regulations for Building Energy Efficiency; Ministry of Land, Infrastructure and Transport of Korea: Sejong Special Governing City, Korea, 2015.
- Al Dakheel, J.; Tabet Aoul, K. Building Applications, Opportunities and Challenges of Active Shading Systems: A State-Of-The-Art Review. Energies 2017, 10, 1672. [Google Scholar] [CrossRef]
- Ji, S.H.; Lee, B.Y. Design Parameter Structure for Architectural Elements of External Kinetic Façade. Korea Inst. Ecol. Archit. Environ. J. 2016, 16, 35–46. [Google Scholar] [CrossRef]
- Adriaenssens, S.; Rhode-Barbarigos, L.; Kilian, A.; Baverel, O.; Charpentier, V.; Horner, M.; Buzatu, D. Dialectic Form Finding of Passive and Adaptive Shading Enclosures. Energies 2014, 7, 5201–5220. [Google Scholar] [CrossRef] [Green Version]
- Lee, E.S.; DiBartolomeo, D.L.; Selkowitz, S.E. Thermal and daylighting performance of an automated Venetian blind and lighting system in a full-scale private office. Energy Build. 1998, 29, 47–63. [Google Scholar] [CrossRef]
- Nielsen, M.V.; Svendsen, S.; Jensen, L.B. Quantifying the potential of automated dynamic solar shading in office buildings through integrated simulations of energy and daylight. Sol. Energy 2011, 85, 757–768. [Google Scholar] [CrossRef]
- Littlefair, P.J. Solar Shading of Buildings; BRE Press: Bracknell, UK, 1999; p. 1. [Google Scholar]
- Kim, G.; Lim, H.S.; Lim, T.S.; Schaefer, L.; Kim, J.T. Comparative advantage of an exterior shading device in thermal performance for residential buildings. Energy Build. 2012, 46, 105–111. [Google Scholar] [CrossRef]
- Palmero-Marrero, A.I.; Oliveira, A.C. Effects of louver shading devices on building energy requirements. Appl. Energy 2010, 87, 2040–2049. [Google Scholar] [CrossRef]
- Kim, S.H.; Shin, K.J.; Choi, B.E.; Jo, J.H.; Cho, S.; Cho, Y.H. A Study on the Variation of Heating and Cooling Load According to the Use of Horizontal Shading and Venetian Blinds in Office Buildings in Korea. Energies 2015, 8, 1487–1504. [Google Scholar] [CrossRef] [Green Version]
- Gagne, J.M.L.; Andersen, M.; Norford, L.K. An interactive expert system for daylighting design exploration. Build. Environ. 2011, 46, 2351–2364. [Google Scholar] [CrossRef] [Green Version]
- Lim, Y.W.; Kandar, M.Z.; Ahmad, M.H.; Ossen, D.R.; Abdullah, A.M. Building facade design for daylighting quality in typical government office building. Build. Environ. 2012, 57, 194–204. [Google Scholar] [CrossRef]
- Freewan, A.A.Y. Impact of external shading devices on thermal and daylighting performance of offices in hot climate regions. Sol. Energy 2014, 102, 14–30. [Google Scholar] [CrossRef]
- Konis, K. Evaluating daylighting effectiveness and occupant visual comfort in a side-lit open-plan office building in San Francisco, California. Build. Environ. 2013, 59, 662–677. [Google Scholar] [CrossRef] [Green Version]
- Aste, N.; Adhikari, R.S.; Del Peroa, C. An algorithm for designing dynamic solar shading system. Energy Procedia 2012, 30, 1079–1089. [Google Scholar] [CrossRef]
- Manzan, M. Genetic optimization of external fixed shading devices. Energy and Build. 2014, 72, 431–440. [Google Scholar] [CrossRef]
- Tzempelikos, A.; Shen, H. Comparative control strategies for roller shades with respect to daylighting and energy performance. Build. Environ. 2014, 67, 179–192. [Google Scholar] [CrossRef]
- Shen, H.; Tzempelikos, A. Sensitivity analysis on daylighting and energy performance of perimeter offices with automated shading. Build. Environ. 2013, 59, 303–314. [Google Scholar] [CrossRef]
- Aldawoud, A. Conventional fixed shading devices in comparison to an electrochromic glazing system in hot, dry climate. Energy Build. 2013, 59, 104–110. [Google Scholar] [CrossRef]
- Tzempelikos, A.; Athienitis, A.K. The impact of shading design and control on building cooling and lighting demand. Sol. Energy 2007, 81, 369–382. [Google Scholar] [CrossRef]
- Olbina, S.; Hu, J. Daylighting and thermal performance of automated split-controlled blinds. Build. Environ. 2012, 56, 127–138. [Google Scholar] [CrossRef]
- Bellia, L.; De Falco, F.; Minichiello, F. Effects of solar shading devices on energy requirements of standalone office buildings for Italian climates. Appl. Ther. Eng. 2013, 54, 190–201. [Google Scholar] [CrossRef]
- Energy Plus Weather Data—Asia WMO Region 2. Available online: https://energyplus.net/weather-region/asia_wmo_region_2 (accessed on 05 January 2016).
Figure 1.
Geographical locations and climate comparison of three cities in East Asia. (a) Geographical coordinates of the three cities: Abu Dhabi, 24.43° N and 54.47° E; Hanoi, 21.03°N and 105.80° E; and Seoul, 37.57° N and 126.97° E; (b) monthly average dry-bulb temperature in Abu Dhabi, Hanoi, and Seoul.

Figure 2.
Shape and dimensions of the office building on which kinetic shades were simulated.

Figure 3.
Shapes of kinetic shading applied for the simulation analysis. (a) Folding type kinetic facade; (b) rotating-type kinetic facade.
Figure 3.
Shapes of kinetic shading applied for the simulation analysis. (a) Folding type kinetic facade; (b) rotating-type kinetic facade.

Figure 4.
Operation cases of kinetic shades. (a) Folding-type kinetic facade; (b) rotating-type kinetic facade.
Figure 4.
Operation cases of kinetic shades. (a) Folding-type kinetic facade; (b) rotating-type kinetic facade.

Figure 5.
Flow chart for producing annual kinetic operation profiles.

Figure 6.
Automatic dimming control function diagram.

Figure 7.
Comparison of annual energy consumption and monthly profiles of folding-type shades in Abu Dhabi. (a) Shades on the east facade; (b) shades on the south facade; (c) shades on the west facade.
Figure 7.
Comparison of annual energy consumption and monthly profiles of folding-type shades in Abu Dhabi. (a) Shades on the east facade; (b) shades on the south facade; (c) shades on the west facade.

Figure 8.
Comparison of annual energy consumption and monthly profiles of folding-type shades in Hanoi. (a) Shades on the east facade; (b) shades on the south facade; (c) shades on the west facade.
Figure 8.
Comparison of annual energy consumption and monthly profiles of folding-type shades in Hanoi. (a) Shades on the east facade; (b) shades on the south facade; (c) shades on the west facade.


Figure 9.
Comparison of annual and monthly energy consumption of folding-type shades in Seoul. (a) Shades on the east facade; (b) shades on the south facade; (c) shades on the west facade.
Figure 9.
Comparison of annual and monthly energy consumption of folding-type shades in Seoul. (a) Shades on the east facade; (b) shades on the south facade; (c) shades on the west facade.


Figure 10.
Comparison of annual and monthly energy consumption of rotating-type shades in Abu Dhabi. (a) Shades on the east facade; (b) shades on the south facade; (c) shades on the west facade.
Figure 10.
Comparison of annual and monthly energy consumption of rotating-type shades in Abu Dhabi. (a) Shades on the east facade; (b) shades on the south facade; (c) shades on the west facade.

Figure 11.
Comparison of annual and monthly energy consumption of rotating-type shades in Hanoi. (a) Shades on the east facade; (b) shades on the south facade; (c) shades on the west facade.
Figure 11.
Comparison of annual and monthly energy consumption of rotating-type shades in Hanoi. (a) Shades on the east facade; (b) shades on the south facade; (c) shades on the west facade.

Figure 12.
Comparison of annual and monthly energy consumption of rotating-type shades in Seoul. (a) Shades on the east facade; (b) shades on the south facade; (c) shades on the west facade.
Figure 12.
Comparison of annual and monthly energy consumption of rotating-type shades in Seoul. (a) Shades on the east facade; (b) shades on the south facade; (c) shades on the west facade.


Figure 13.
Monthly frequency of movable steps during kinetic operation of folding- and rotating-type kinetic shading on east, south, and west facades in Abu Dhabi.
Figure 13.
Monthly frequency of movable steps during kinetic operation of folding- and rotating-type kinetic shading on east, south, and west facades in Abu Dhabi.

Figure 14.
Monthly frequency of movable steps during kinetic operation of folding- and rotating-type kinetic shading on east, south, and west facades in Hanoi.
Figure 14.
Monthly frequency of movable steps during kinetic operation of folding- and rotating-type kinetic shading on east, south, and west facades in Hanoi.

Figure 15.
Monthly frequency of movable steps during kinetic operation of folding- and rotating-type kinetic shading on east, south, and west facades in Seoul.
Figure 15.
Monthly frequency of movable steps during kinetic operation of folding- and rotating-type kinetic shading on east, south, and west facades in Seoul.


Table 1.
Average monthly statistics for direct and diffuse solar radiation in the three cities (W/m2).
Table 1.
Average monthly statistics for direct and diffuse solar radiation in the three cities (W/m2).
| Abu Dhabi | Hanoi | Seoul | ||||
|---|---|---|---|---|---|---|
| Direct Solar Radiation | Diffuse Solar Radiation | Direct Solar Radiation | Diffuse Solar Radiation | Direct Solar Radiation | Diffuse Solar Radiation | |
| January | 480.78 | 106.27 | 362.45 | 97.68 | 161.53 | 124.22 |
| February | 562.29 | 102.61 | 145.24 | 114.96 | 246.20 | 155.81 |
| March | 447.90 | 144.28 | 161.43 | 138.23 | 219.79 | 186.78 |
| April | 458.84 | 153.85 | 188.80 | 184.15 | 291.61 | 216.80 |
| May | 563.82 | 127.72 | 288.33 | 184.29 | 213.32 | 216.25 |
| June | 549.76 | 119.45 | 276.70 | 190.54 | 177.16 | 225.13 |
| July | 499.77 | 138.57 | 276.97 | 190.06 | 130.74 | 196.75 |
| August | 563.47 | 134.57 | 199.29 | 209.74 | 154.52 | 184.33 |
| September | 559.37 | 114.29 | 355.59 | 161.89 | 192.32 | 179.28 |
| October | 577.34 | 103.48 | 363.49 | 146.25 | 286.26 | 160.55 |
| November | 544.63 | 91.44 | 345.23 | 144.33 | 276.29 | 131.85 |
| December | 477.54 | 102.70 | 401.12 | 109.83 | 223.79 | 123.35 |
| AVG | 523.79 | 119.93 | 280.39 | 155.99 | 214.46 | 175.09 |
Table 2.
Thermal properties of building envelopes.
| Envelopes | U-Value (W/m2K) |
|---|---|
| Wall | 0.26 |
| Window | 2.1 |
| Ceiling | 0.013 |
| Floor | 0.013 |
Table 3.
Internal gain data of simulation cases.
| Variables | Values |
|---|---|
| Temperature Setting | Heating set-point 20 °C Cooling set-point 26 °C |
| Occupant Sensible Gain | 9.01 W/m2 (70.34 W/person) |
| Equipment Gain | 10.75 W/ |
| Lighting Gain | 10.00 W/ |
| Occupation schedule | AM 9:00–PM 18:00 |
| Outdoor fresh air supply | 0.6 ACH |
| HVAC | Fan coil unit |
Table 4.
Annual energy consumption comparison of reference case, best-fixed case and kinetic case in three Asian cities (folding type, MWh).
Table 4.
Annual energy consumption comparison of reference case, best-fixed case and kinetic case in three Asian cities (folding type, MWh).
| Abu Dhabi | Hanoi | Seoul | ||||||||
|---|---|---|---|---|---|---|---|---|---|---|
| Ref. | Best-Fixed Case | kinetic | Ref. | Best-Fixed Case | kinetic | Ref. | Best-Fixed Case | kinetic | ||
| east | heating | 0.0 | 0.0 | 0.0 | 0.0 | 0.1 | 0.0 | 3.5 | 7.2 | 7.2 |
| cooling | 28.5 | 20.0 | 20.1 | 18.5 | 12.4 | 12.4 | 7.7 | 4.6 | 3.9 | |
| lighting | 1.1 | 3.4 | 3.2 | 2.4 | 3.4 | 3.3 | 1.1 | 1.4 | 1.5 | |
| total | 29.7 | 23.4 | 23.3 | 20.9 | 15.9 | 15.8 | 12.3 | 13.3 | 12.6 | |
| reduction rate | - | 21.2% | 21.5% | - | 23.9% | 24.4% | - | −8.1% | −2.4% | |
| south | heating | 0.0 | 0.0 | 0.0 | 0.0 | 0.1 | 0.0 | 2.9 | 5.7 | 5.7 |
| cooling | 31.2 | 19.9 | 20.3 | 19.5 | 12.2 | 12.3 | 10.4 | 4.9 | 3.9 | |
| lighting | 0.9 | 3.4 | 2.6 | 2.1 | 3.4 | 3.2 | 1.0 | 1.2 | 1.3 | |
| total | 32.1 | 23.3 | 22.9 | 21.6 | 15.7 | 15.5 | 14.3 | 11.8 | 10.9 | |
| reduction rate | - | 27.4% | 28.7% | - | 27.3% | 28.2% | - | 17.5% | 23.8% | |
| west | heating | 0.0 | 0.0 | 0.0 | 0.0 | 0.1 | 0.0 | 3.7 | 7.2 | 7.2 |
| cooling | 28.9 | 20.0 | 20.5 | 19.2 | 12.4 | 12.6 | 9.3 | 5.0 | 4.0 | |
| lighting | 1.0 | 3.4 | 2.5 | 2.0 | 3.4 | 3.0 | 1.0 | 1.2 | 1.3 | |
| total | 29.8 | 23.3 | 23.0 | 21.3 | 15.9 | 15.7 | 13.9 | 13.4 | 12.4 | |
| reduction rate | - | 21.8% | 22.8% | - | 25.4% | 26.3% | - | 3.6% | 10.8% | |
Table 5.
Annual energy consumption comparison of reference case, best-fixed case and kinetic case in each side of an office building in three Asian cities (rotating type, MWh).
Table 5.
Annual energy consumption comparison of reference case, best-fixed case and kinetic case in each side of an office building in three Asian cities (rotating type, MWh).
| Abu Dhabi | Hanoi | Seoul | ||||||||
|---|---|---|---|---|---|---|---|---|---|---|
| Ref. | Best-Fixed Case | kinetic | Ref. | Best-Fixed Case | kinetic | Ref. | Best-Fixed Case | kinetic | ||
| east | heating | 0.0 | 0.0 | 0.0 | 0.0 | 0.1 | 0.1 | 3.5 | 4.5 | 4.5 |
| cooling | 28.5 | 20.8 | 20.5 | 18.5 | 13.8 | 13.7 | 7.7 | 5.2 | 4.8 | |
| lighting | 1.1 | 2.5 | 2.1 | 2.4 | 3.4 | 3.1 | 1.1 | 1.4 | 1.5 | |
| total | 29.7 | 23.4 | 22.6 | 20.9 | 17.2 | 16.9 | 12.3 | 11.2 | 10.8 | |
| reduction rate | - | 21.2% | 23.9% | - | 17.7% | 19.1% | - | 8.9% | 12.2% | |
| south | heating | 0.0 | 0.0 | 0.0 | 0.0 | 0.1 | 0.1 | 2.9 | 3.8 | 3.8 |
| cooling | 31.2 | 20.7 | 20.2 | 19.5 | 13.7 | 13.4 | 10.4 | 5.4 | 5.0 | |
| lighting | 0.9 | 1.8 | 1.6 | 2.1 | 3.3 | 2.8 | 1.0 | 1.2 | 1.2 | |
| total | 32.1 | 22.6 | 21.8 | 21.6 | 17.1 | 16.3 | 14.3 | 10.4 | 10.1 | |
| reduction rate | - | 29.6% | 32.1% | - | 20.8% | 24.5% | - | 27.3% | 29.4% | |
| west | heating | 0.0 | 0.1 | 0.1 | 0.0 | 0.1 | 0.1 | 3.7 | 4.7 | 4.3 |
| cooling | 28.9 | 20.6 | 20.1 | 19.2 | 14.1 | 13.7 | 9.3 | 4.4 | 4.3 | |
| lighting | 1.0 | 2.3 | 1.8 | 2.0 | 2.9 | 2.7 | 1.0 | 1.9 | 1.4 | |
| total | 29.8 | 22.9 | 21.9 | 21.3 | 17.1 | 16.4 | 13.9 | 11.0 | 10.1 | |
| reduction rate | - | 23.2% | 26.5% | - | 19.7% | 23.0% | - | 20.9% | 27.3% | |
© 2019 by the author. Licensee MDPI, Basel, Switzerland. This article is an open access article distributed under the terms and conditions of the Creative Commons Attribution (CC BY) license (http://creativecommons.org/licenses/by/4.0/).
Share and Cite
MDPI and ACS Style
Lee, B. Heating, Cooling, and Lighting Energy Demand Simulation Analysis of Kinetic Shading Devices with Automatic Dimming Control for Asian Countries. Sustainability 2019, 11, 1253. https://doi.org/10.3390/su11051253
AMA Style
Lee B. Heating, Cooling, and Lighting Energy Demand Simulation Analysis of Kinetic Shading Devices with Automatic Dimming Control for Asian Countries. Sustainability. 2019; 11(5):1253. https://doi.org/10.3390/su11051253
Chicago/Turabian StyleLee, Byungyun. 2019. "Heating, Cooling, and Lighting Energy Demand Simulation Analysis of Kinetic Shading Devices with Automatic Dimming Control for Asian Countries" Sustainability 11, no. 5: 1253. https://doi.org/10.3390/su11051253
Note that from the first issue of 2016, this journal uses article numbers instead of page numbers. See further details here.