Assessment of City Sustainability Using MCDM with Interdependent Criteria Weight


1
School of Business Administration, Northeastern University, Shenyang 110167, China
2
Northeastern Evaluation Center, Northeastern University, Shenyang 110167, China
3
School of Economics, Liaoning University, Shenyang 110136, China
*
Author to whom correspondence should be addressed.
Sustainability 2019, 11(6), 1632; https://doi.org/10.3390/su11061632
Submission received: 22 February 2019
/
Revised: 10 March 2019
/
Accepted: 14 March 2019
/
Published: 18 March 2019
Abstract
:The Capital Economic Circle is an important planning project in China. Sustainability is a key factor for the long-term development of the Capital Economic Circle. In this paper, we investigated the sustainability of 13 cities in the Capital Economic Circle using three dimensions: economy, society, and environment. The induced ordered weighted averaging (IOWA) operator was used for the aggregation of criteria data. The order-inducing variable in the IOWA operator was measure by the correlation degree of a criterion and all the other criteria. Criteria with larger order-inducing values were given more weight as they provided more support for the development of other criteria. The assessment results indicate that the sustainable development of most of the cities, except for Beijing and Tianjin, is poor, with performance values below 0.5. By comparing the development using three dimensions, it was found that poor performances of economic sustainability were the main reason for this. Additionally, all of the cities showed a sound momentum of sustainable growth even though the sustainable levels of most of the cities were not high. In terms of sustainable development across the three dimensions, the cities had the highest levels of environmental sustainability. The social sustainability of the cities, except for Beijing and Tianjin, was better than their economic sustainability. However, more than half of the cities (accounting for 53.8%) showed a decline in social sustainability, especially for Zhangjiakou, which had the highest degree of decline of 4.00%. Some suggestions have been provided on the basis of the main assessment results. For example, Beijing should invest more in education as well as further easing transportation pressure. There is room for further improvement of the social and environmental sustainability of Tianjin. The other cities should focus on developing economic sustainability as well as preventing the decline of social sustainability.
1. Introduction
The urbanization rate in China in 2017 was 58.5%, showing a great increase in the rate from that in 1953, which was 15.29% [1]. Within the urbanization process, city sustainable development is an important issue, as it is normally accompanied by various social-environmental problems: congestion, poor sanitation conditions, noise, and overcrowding, as well as fire and health risks [2,3]. The assessment of city sustainability performance has become popular for researchers in a wide range of fields [4,5,6,7]. However, a universally applicable assessment system has not been well established because the required conditions for city sustainability assessment are still ambiguous [8]. A widely accepted approach includes developing a framework involving a set of criteria selected from a combination of three dimensions—namely, the environmental (ecological), economic, and social dimensions [9]—which is known as the three-pillar model [10,11,12]. Many researchers have defined sustainability using other dimensions. Typically, culture [13,14] and governance [15,16] are the additional dimensions believed to affect sustainability in some manner [17].
Selected sustainability criteria need to be integrated to a final value which may be used for comprehensively measuring the sustainable performance of a city. This process can be viewed as a multi-criteria decision-making (MCDM) problem. Normalizing, weighting, and aggregating are the basic MCDM procedures [18]. Even through all the steps are important for the quality of the sustainability performance, the weighting step seems to have the greatest impact [19]. Many weighting methods have been chosen or developed for city sustainability assessment. Su et al. combined the analytical hierarchy process (AHP) with accelerating genetic algorithms (AGA) and proposed a new approach to work out the real number weights of various criteria used for measuring the degree of sustainable development of mineral resources of mining cities [20]. Reza et al. used the AHP as a multi-criteria decision-making technique to measure the impact of the proposed sub-criteria within the sustainability index proposed for a sustainability assessment of flooring systems in the city of Tehran [21]. Ameen et al. applied the AHP method to assigning weights for aggregating criteria scores used for a sustainability assessment of Iraq [22]. Asmelash et al. used the three-round Delphi method for the assessment of progress towards sustainable tourism development [23]. Ding et al. used entropy weight to evaluate the sustainable development of 287 cities at the prefecture level and above in China [24]. Lin et al. selected entropy as the basic method used to analyze the sustainability of urban ecosystems in Guangzhou, China [25]. Lu et al. used the coefficient-variation method to determine criteria weights in the process of investigating the sustainability of resource-based cities in Northeastern China [26]. Van de Kerk et al. constructed a sustainable society index with equal weights to measure sustainable development in the country region [27].
The works mentioned above primarily considered the decision makers’ subjective judgments/preferences or the objective differences of the criteria values in the weighting process. However, the criteria involved in sustainability assessment are usually complicated and involve diverse interrelationships. For example, a city with an increase of GDP may facilitate the improvement of people’s livelihood. Therefore, it is important to consider the interdependencies of criteria in the weighting process [28].
Many methods have been proposed to measure the interdependencies between criteria. For example, the Analytic Network Process (ANP), first proposed by Saaty [29], is a useful approach used for modelling the dependencies between criteria. In the ANP process, a super matrix, composed of the relative importance weights from each cluster of a network hierarchy, is developed to reflect the interaction between different clusters. Ziemba used the ANP method to solve a decision problem consisting of selecting the location and design of a wind farm. It was found that the ranking obtained with the use of the ANP was characterized by a higher quality [30]. Xu et al. used the ANP to analyze the sustainable building energy efficiency retrofit for hotel buildings [31]. The Choquet integral method is another widely used approach for measuring the dependencies between criteria. For example, Zhang et al. developed an optimization model to objectively determine the interaction coefficients and weights of multi-level criteria. Then, the overall satisfaction of an alternative was obtained by the Choquet integral method used for sustainability assessment of Jiangsu cities [32]. Angilella et al. took into account synergy and redundancy between criteria in the Choquet integral approach used for measuring rural sustainable development [33]. In this paper, we investigated the interdependency between criteria from the perspective of correlation analysis. It is supposed that if one criterion is correlated to many of the others, this criterion provides more support for the development of other associated criteria. In this case, more weight should be assigned to this criterion.
The aggregation approach plays an important role in the MCDM process. A great many aggregation methods have been developed in the literature [34,35,36,37]. In this paper we chose the ordered weighted averaging (OWA) operator [38] and one of its extensions, the induced OWA (IOWA) [39], as the basic method, which has been used in a wide range of sustainability assessments [39,40,41,42]. The reason for this is that the order-inducing variable [43] in the IOWA operator can be used to measure the correlation degree of a criterion and all the others. In this case, the criterion with larger order-inducing variables strongly correlates to the other criteria and should be given more weight. To achieve this, a programming model has been designed to determine the criteria weights by referring to the maximum entropy method studied in the OWA operator [44].
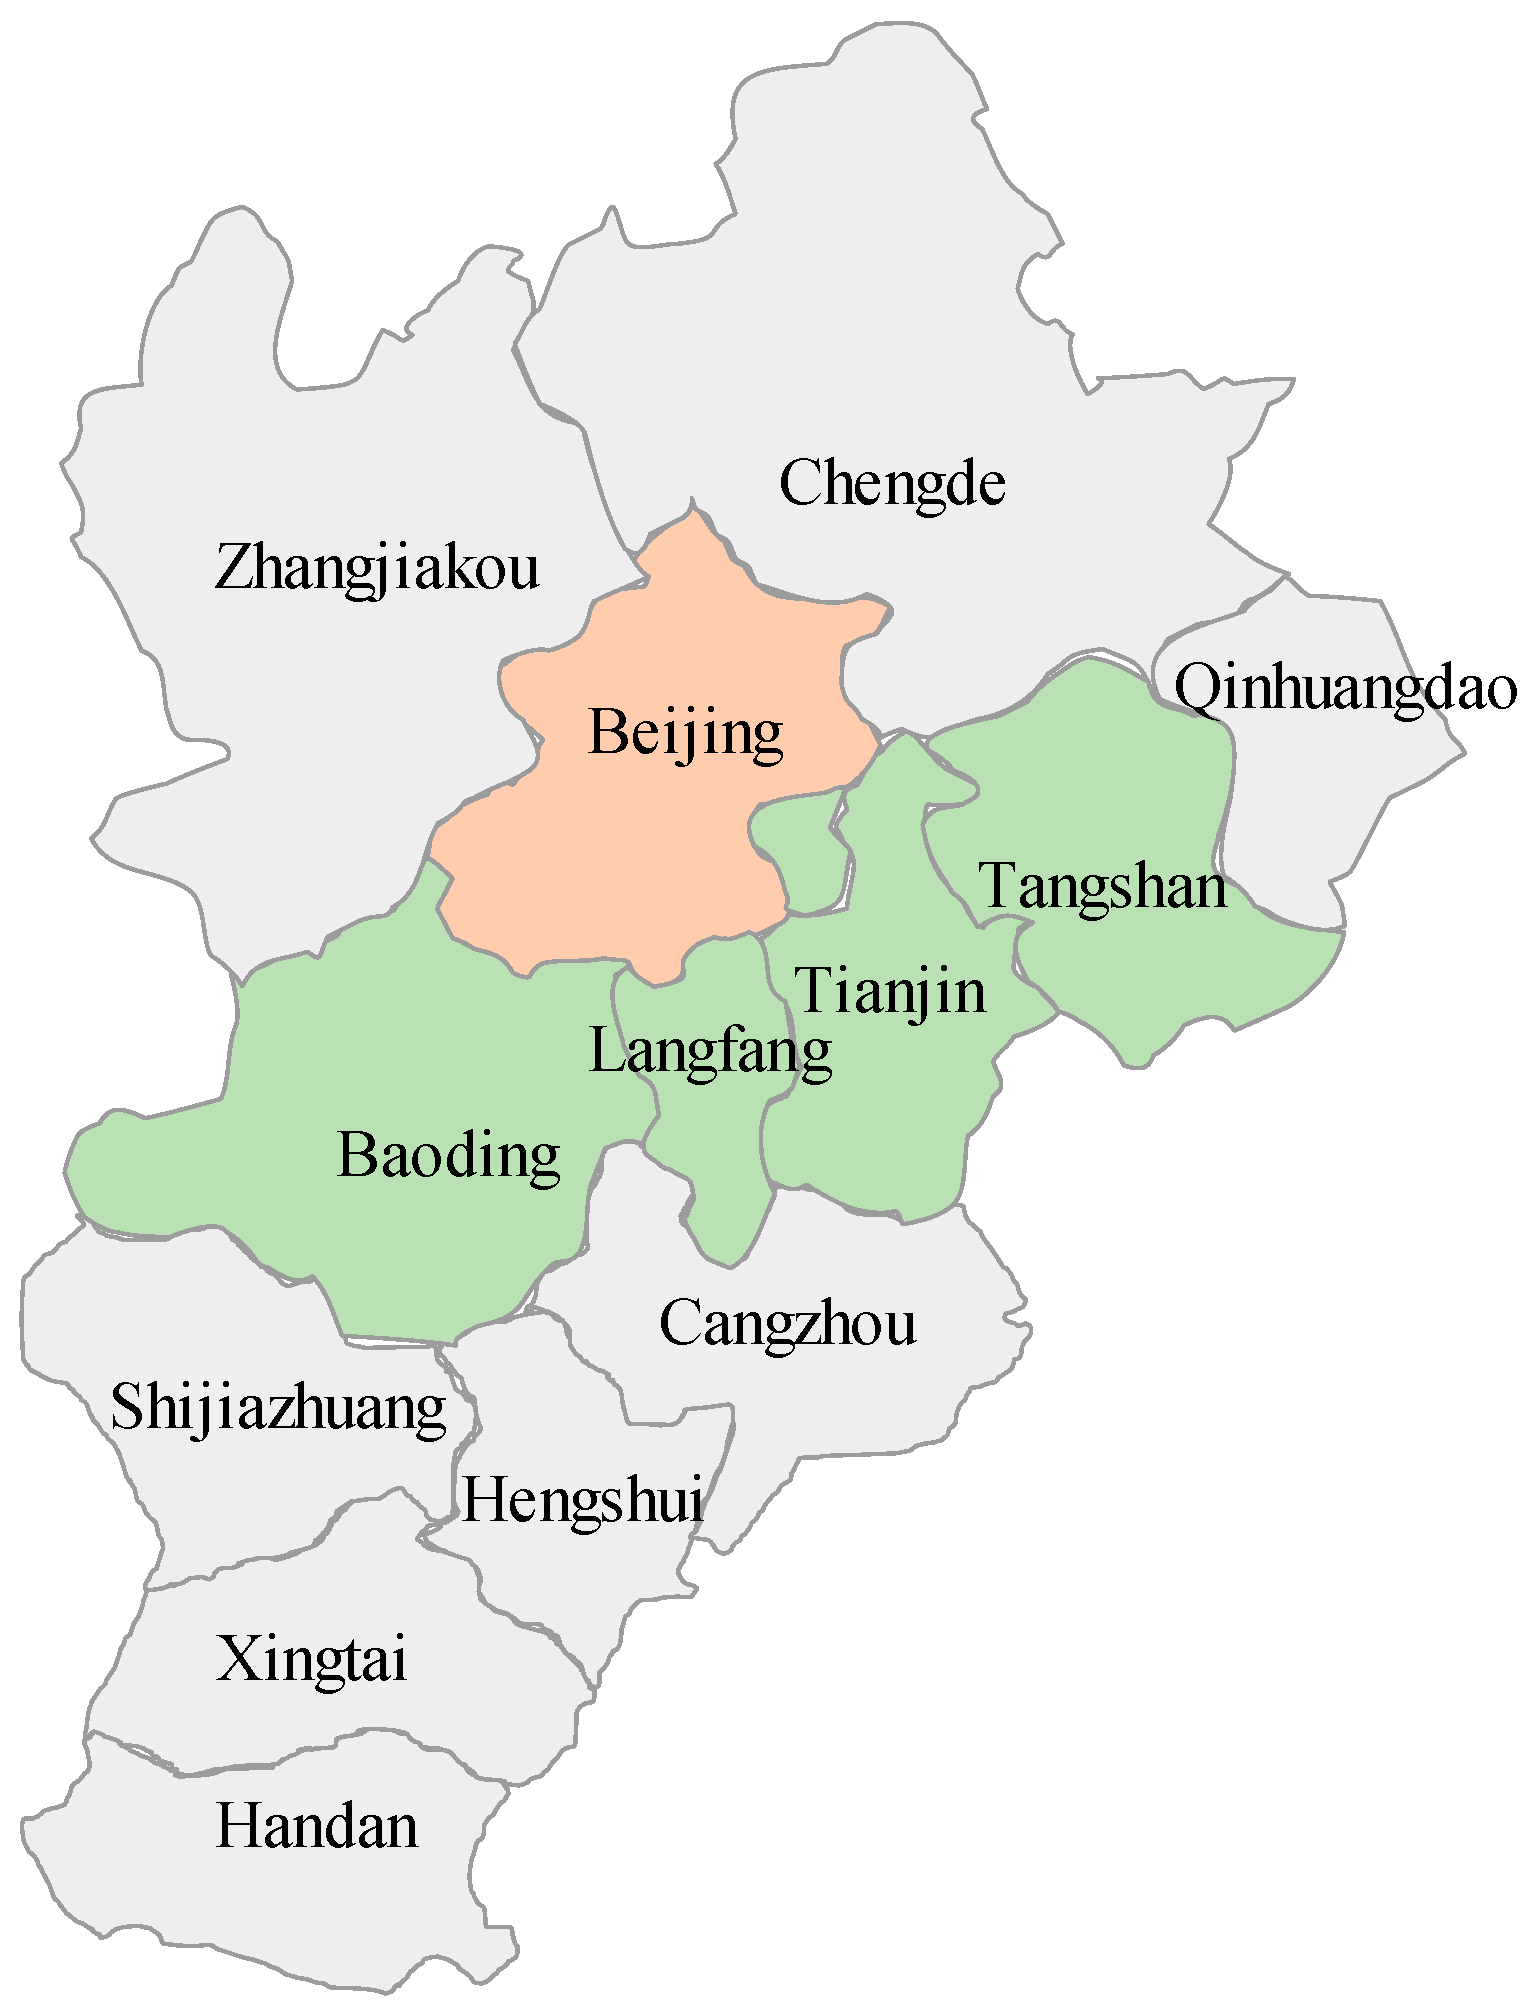
The National Development and Reform Commission (NDRC) launched the planning and formulation of the Capital Economic Circle in 2011. The Capital Economic Circle is one of the most important planning projects in China at present, and includes Beijing, Tianjin and 11 prefecture-level cities in Hebei province, such as Baoding, Tangshan, Langfang, Shijiazhuang, Cangzhou, Qinhuangdao, Zhangjiakou, Chengde, Handan, Xingtai, and Tengshui. In the regional planning approval plan in 2012, the development plan of the Capital Economic Circle was placed first, but the process has been slow. Therefore, in this paper we aim to investigate the sustainability of the cities in the Capital Economic Circle dynamically using MCDM methods, so as to provide more references for the cities’ sustainable development. The main contributions of this research are as follows: (1) from the view of this method, we propose an objective weighting method by analyzing the interdependencies between criteria from the perspective of correlation analysis; (2) from the viewpoint of the assessment results, we find that the sustainable development of most of the cities, except for Beijing and Tianjin, is poor. In addition, some special suggestions are provided according to the assessment results.
The rest of the paper is organized as follows. Section 2 provides a brief introduction to the study cases. Section 3 proposes the assessment methods, including the construction of sustainability criteria, the interdependent criteria weighting method, and the IOWA aggregation approach. The assessment results are shown in Section 4. Conclusions, suggestions, and possible future works are outlined in Section 5.
2. Study Cases
The Capital Economic Circle is an important region in China which aims at the coordinated development of Beijing, Tianjin, and Hebei province. Beijing is the capital of China as well as its national political center, cultural center, international exchange center, and science and technology innovation center. It lies between longitudes 115°25′ E and 117°30′ N, and between latitudes 39°26′ N and 41°03′ E. Tianjin is a direct-controlled municipality and national central city. It lies between longitudes 116°43′ E and 118°04′ N, and between latitudes 38°34′ N and 40°15′ E. Hebei province has jurisdiction over 11 prefecture-level cities, and lies between longitudes 113°04′ E and 119°53′ N, and between latitudes 36°01′ N and 42°37′ E. The locations of Beijing, Tianjin, and 11 prefecture-level cities in the Capital Economic Circle are shown in Figure 1. Brief profiles of these 13 cities are shown in Table 1.
3. Methods
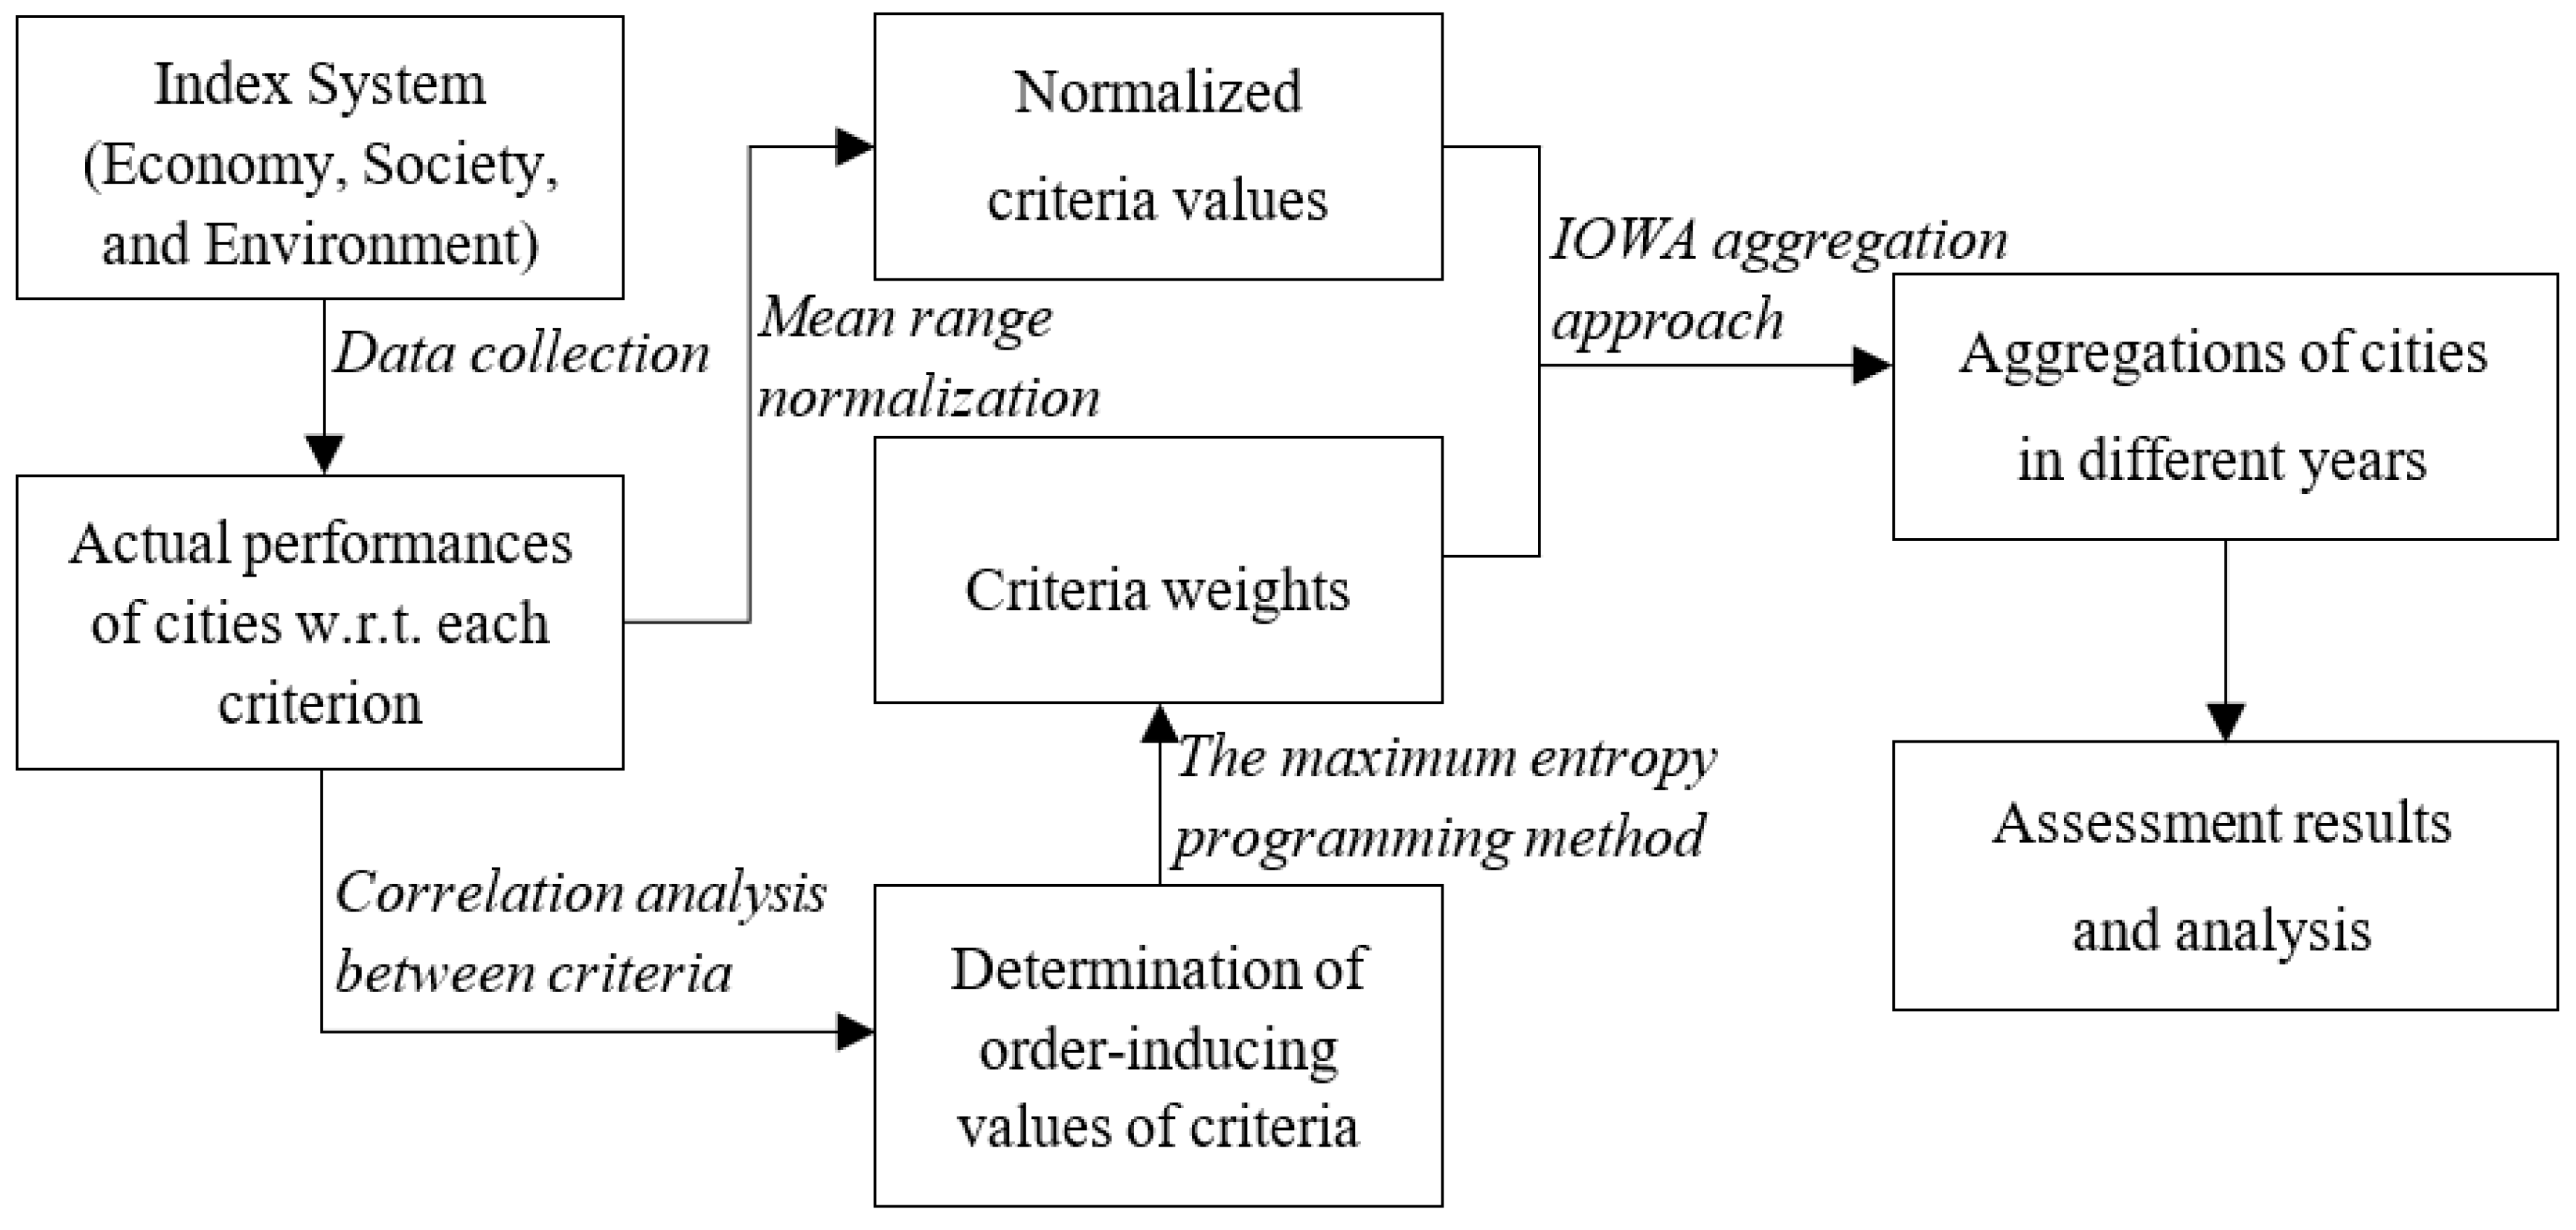
The primary purpose of this paper was to evaluate the sustainable development of cities in the Capital Economic Circle, China, in the years 2011 to 2016. The year 2011 was selected as the base period as the planning of the Capital Economic Circle was formally proposed in 2011. The year 2016 was chosen as the end period since criteria data have only been published to 2016 at present. Assessment results were used to understand the sustainability levels of the cities and provide some technology or policy references for the cities’ sustainable development. To achieve this, we proposed the following framework, which is shown in Figure 2. The key methods used are discussed in the following subsections.
3.1. Index System
In this paper, we defined city sustainability as pursuing all-round development, especially regarding the economic, social, and environmental dimensions. The assessment of city sustainability was developed by selecting a collection of criteria from the three dimensions. However, there are no commonly recognized criteria used for measuring city sustainable development [45]. In this paper, a set of 18 criteria was selected by referring to the main literature reviews about city sustainability in China [24,26,31,46,47,48,49]. Note that we only chose 18 criteria, which strictly speaking are not sufficient for sustainability assessment, because we were fettered by the accessibility of criteria data. All of the selected criteria were grouped into three dimensions—economy, society, and environment—as shown in Table 2.
Economic sustainability serves as a guarantee of city sustainable development. We considered the quantity of economic growth as well as the quality of economic development. As an important criteria of economic sustainability, C1 directly reflects the economic level of an individual city; C2 points to the situation of economic growth; C3 indicates the development of the service industry; C4 is used to measure the richness of residents; C5 reflects the level of economic openness of a city; and C6 represents the people’s consumption level and their purchasing power of social commodities [24].
Social sustainability is the ultimate goal of city sustainable development. It covers the basic aspects of population, education, science and technology, health care, job opportunities, and others. For the criteria in the social sustainability dimension, C7 reflects the distribution and density of the population of a city; C8 and C9 show the attention levels given to education and science and technology, respectively; C10 reflects the current situation of health care within a city; C11 indicates the state of unemployment; and C12 is used to reflect the degree of traffic, which ensures communication and transportation of social and economic activities [24].
Environmental sustainability is the basis for city sustainable development. We primarily focused on greening construction, environmental protection, pollution controls, and treatment. In Table 2, C13 and C14 reflect the level of green cover within a city region; C15 and C16 show, respectively, the situation of waste water discharge and air pollution in industry processes; and C17 and C18 reflect the status of pollution treatment of industrial solid waste and consumption waste, respectively.
3.2. Weighting and Aggregation Methods
We used the IOWA operator for the integration of the criteria values. Without loss of generality, let denote the actual performance of the alternative (or city) for criterion in the year , where , , . Let represent the assessment value of the alternative in the year obtained by the IOWA operator. Assume is mapping , which has a weighting vector with and such that
where is the weight associated with the criterion having the th largest order-inducing variable , and is the associated normalized criterion value of alternative in the year .
Before using Equation (1) to calculate the assessment values, we first needed to normalize the actual performance values, determine the order-inducing variable values, and obtain the associated weighting vectors. Many normalization methods have been developed [50,51] in applications. We used the mean range method for dynamic situations to improve the comparability of the assessment values for different years [52], such as
where and are the maximum and minimum values of criterion across the years to .
We used the order-inducing variable to measure the correlation degree of criterion and all the other criteria. The Pearson correlation coefficient was selected to calculate the correlation coefficient of any two criteria, denoted as , where , . Generally, if , that criterion correlates with criterion . When , criterion has a strong correlation with criterion . For criterion , we counted the times it correlated with other criteria and denoted this . If the value of is close to , correlates with most of the other criteria. In this case, the criterion should be given more weight. Therefore, we let and rearranged the criteria in descending order according to . In the case of a tie, we calculated the average of the absolute value of the correlation coefficients equal to or greater than 0.1, denoted as , and then rearranged the associated criteria using . This process was formulated using
where represents the total number of times criterion satisfies the condition .
The calculated values of the order-inducing variable are shown in Table 3 in Section 4.1.
For the ordered criteria, more weight should be given to the element located on the top. That is, the weighting vector should satisfy the condition when in Equation (1). Motivated by the maximum entropy method first provided by O’Hagan [44] in 1988, we used the following constrained nonlinear optimization model to calculate the associated weights.
The orness value was designed to measure the attitude of the decision maker. When more weight is assigned to the top of the weighting vector. To avoid the situation of unreasonable variance between criteria weights, we let and calculated the associated weights using the optimization model (4)–(7) as shown in the last column of Table 2.
4. Results and Discussion
The actual criteria data were extracted from the Beijing Statistical Yearbook (2012–2017) [53], the Tianjin Statistical Yearbook (2012–2017) [54], the Hebei Provincial Statistical Yearbook (2012–2017) [55], and the China City Statistical Yearbook (2012–2017) [56]. The collected criteria values of individual cities are shown in the Appendix A section.
4.1. Asssessment Results
For the collected criteria values, we calculated the order-inducing values of the criteria according to Equation (3). The ranking of criteria and the associated order-inducing values are shown in Table 3.
We normalized the criteria values, shown in Appendix A, by Equation (2). Then, we aggregated the normalized criteria values and the associated weights shown in the last column of Table 2 through Equation (1). We obtained the sustainable performances of the 13 cities for the years 2011 to 2016, as shown in Table 4.
4.2. Discussion
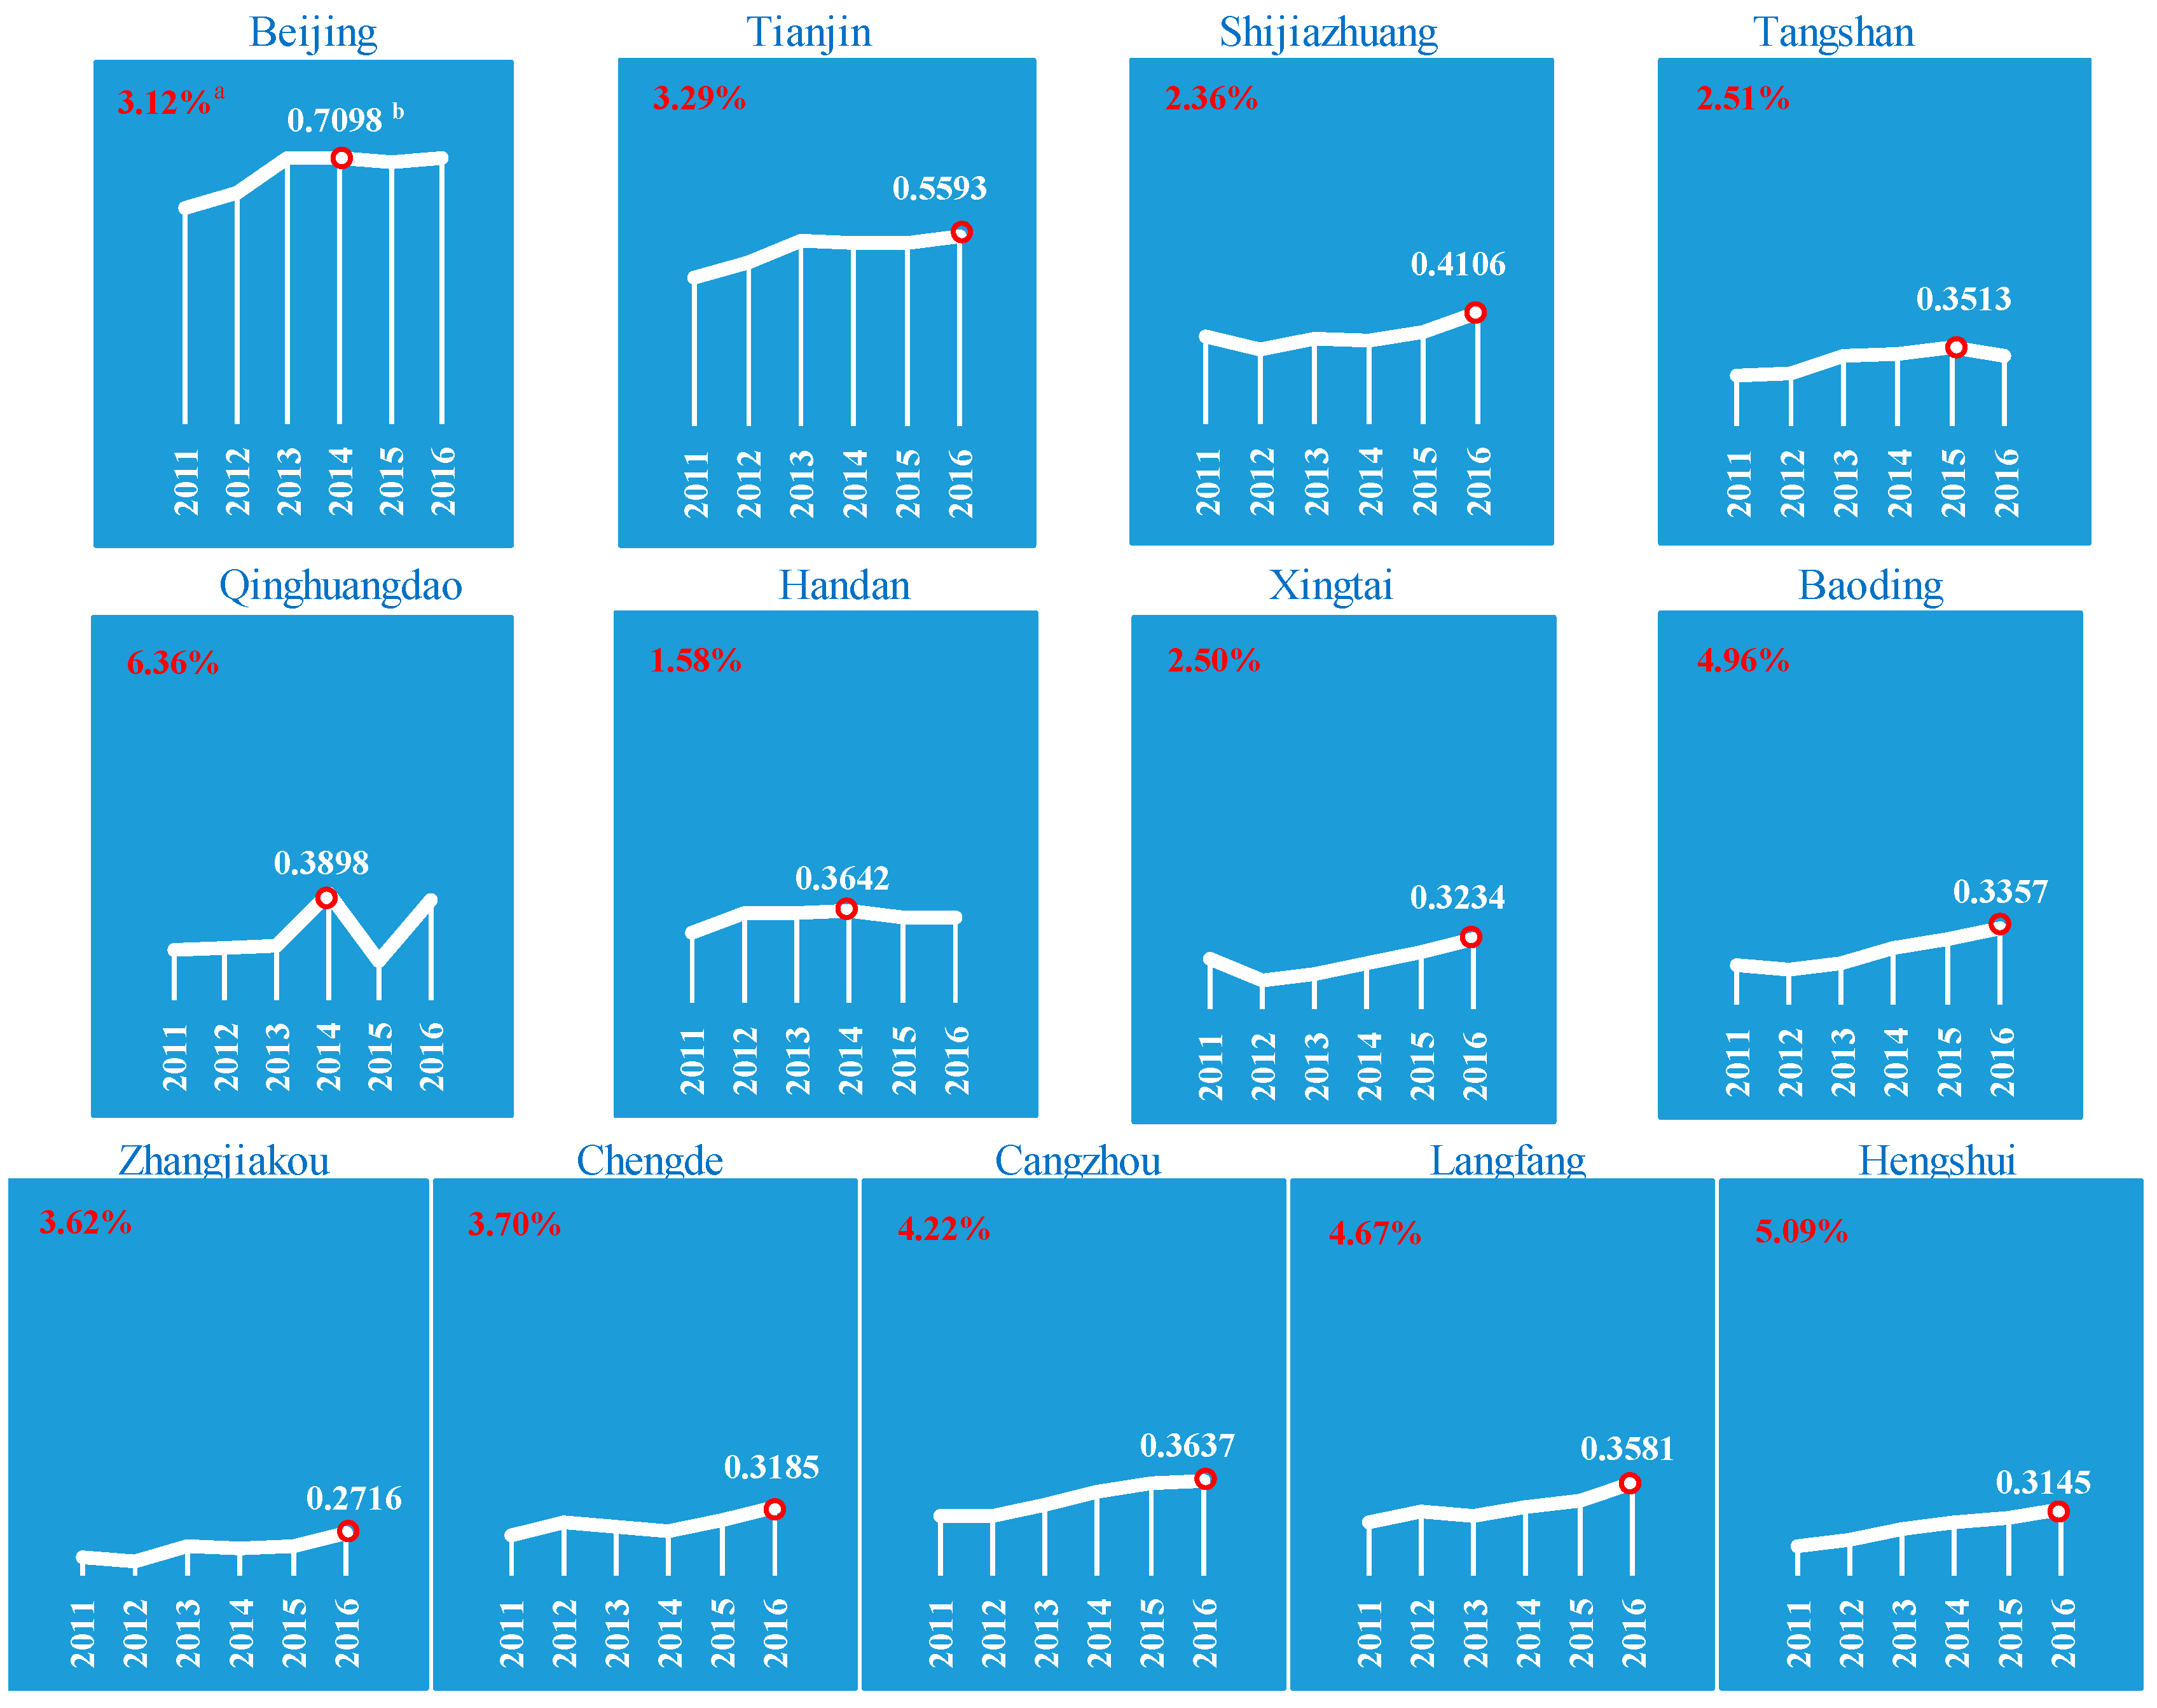
To more clearly indicate the change of performance values of the cities’ sustainability across different years, graphic representations, showing the development trend of the cities’ sustainability from 2011 to 2016, are shown in Figure 3.
(1) The sustainable development levels of Beijing and Tianjin were apparently higher than those of the other cities. The maximum performance values of the cities, except for Beijing (0.7098) and Tianjin (0.5593), were below 0.5. This indicates that the cities located in Hebei province had poor sustainability.
(2) Although the sustainable levels of most of the cities were not high, all of the cities showed positive growth rates. This indicates the cities maintained a sound momentum of sustainable growth. The sustainable growth rates of Qinhuangdao and Hengshui were significant, being over 5%. However, the performance of Qinhuangdao was highly volatile in the sustainability process for the years 2013 to 2016.
(3) The sustainability of the four cities Shijiazhuang, Tangshan, Handan, and Xingtai showed slow development as the average growth rates of these cities’ sustainable performances were below 3%. Notably, the growth rate of Handan was 1.58%.
More detailed discussion of the sustainable development of the cities using the three dimensions was given to explore the profound reasons for why the cities’ sustainability was poor, especially for the cities in Hebei province. The weights of the criteria belonging to each dimension—economy, society, and environment—were calculated by normalizing the associated criteria weights as shown in the last column of Table 2. Then, the IOWA operator was used to integrate the criteria values and associated weights to obtain the performance values of each dimension. The average performances of the cities’ sustainability for the years 2011 to 2016 and the average growth rates are shown in Table 5.
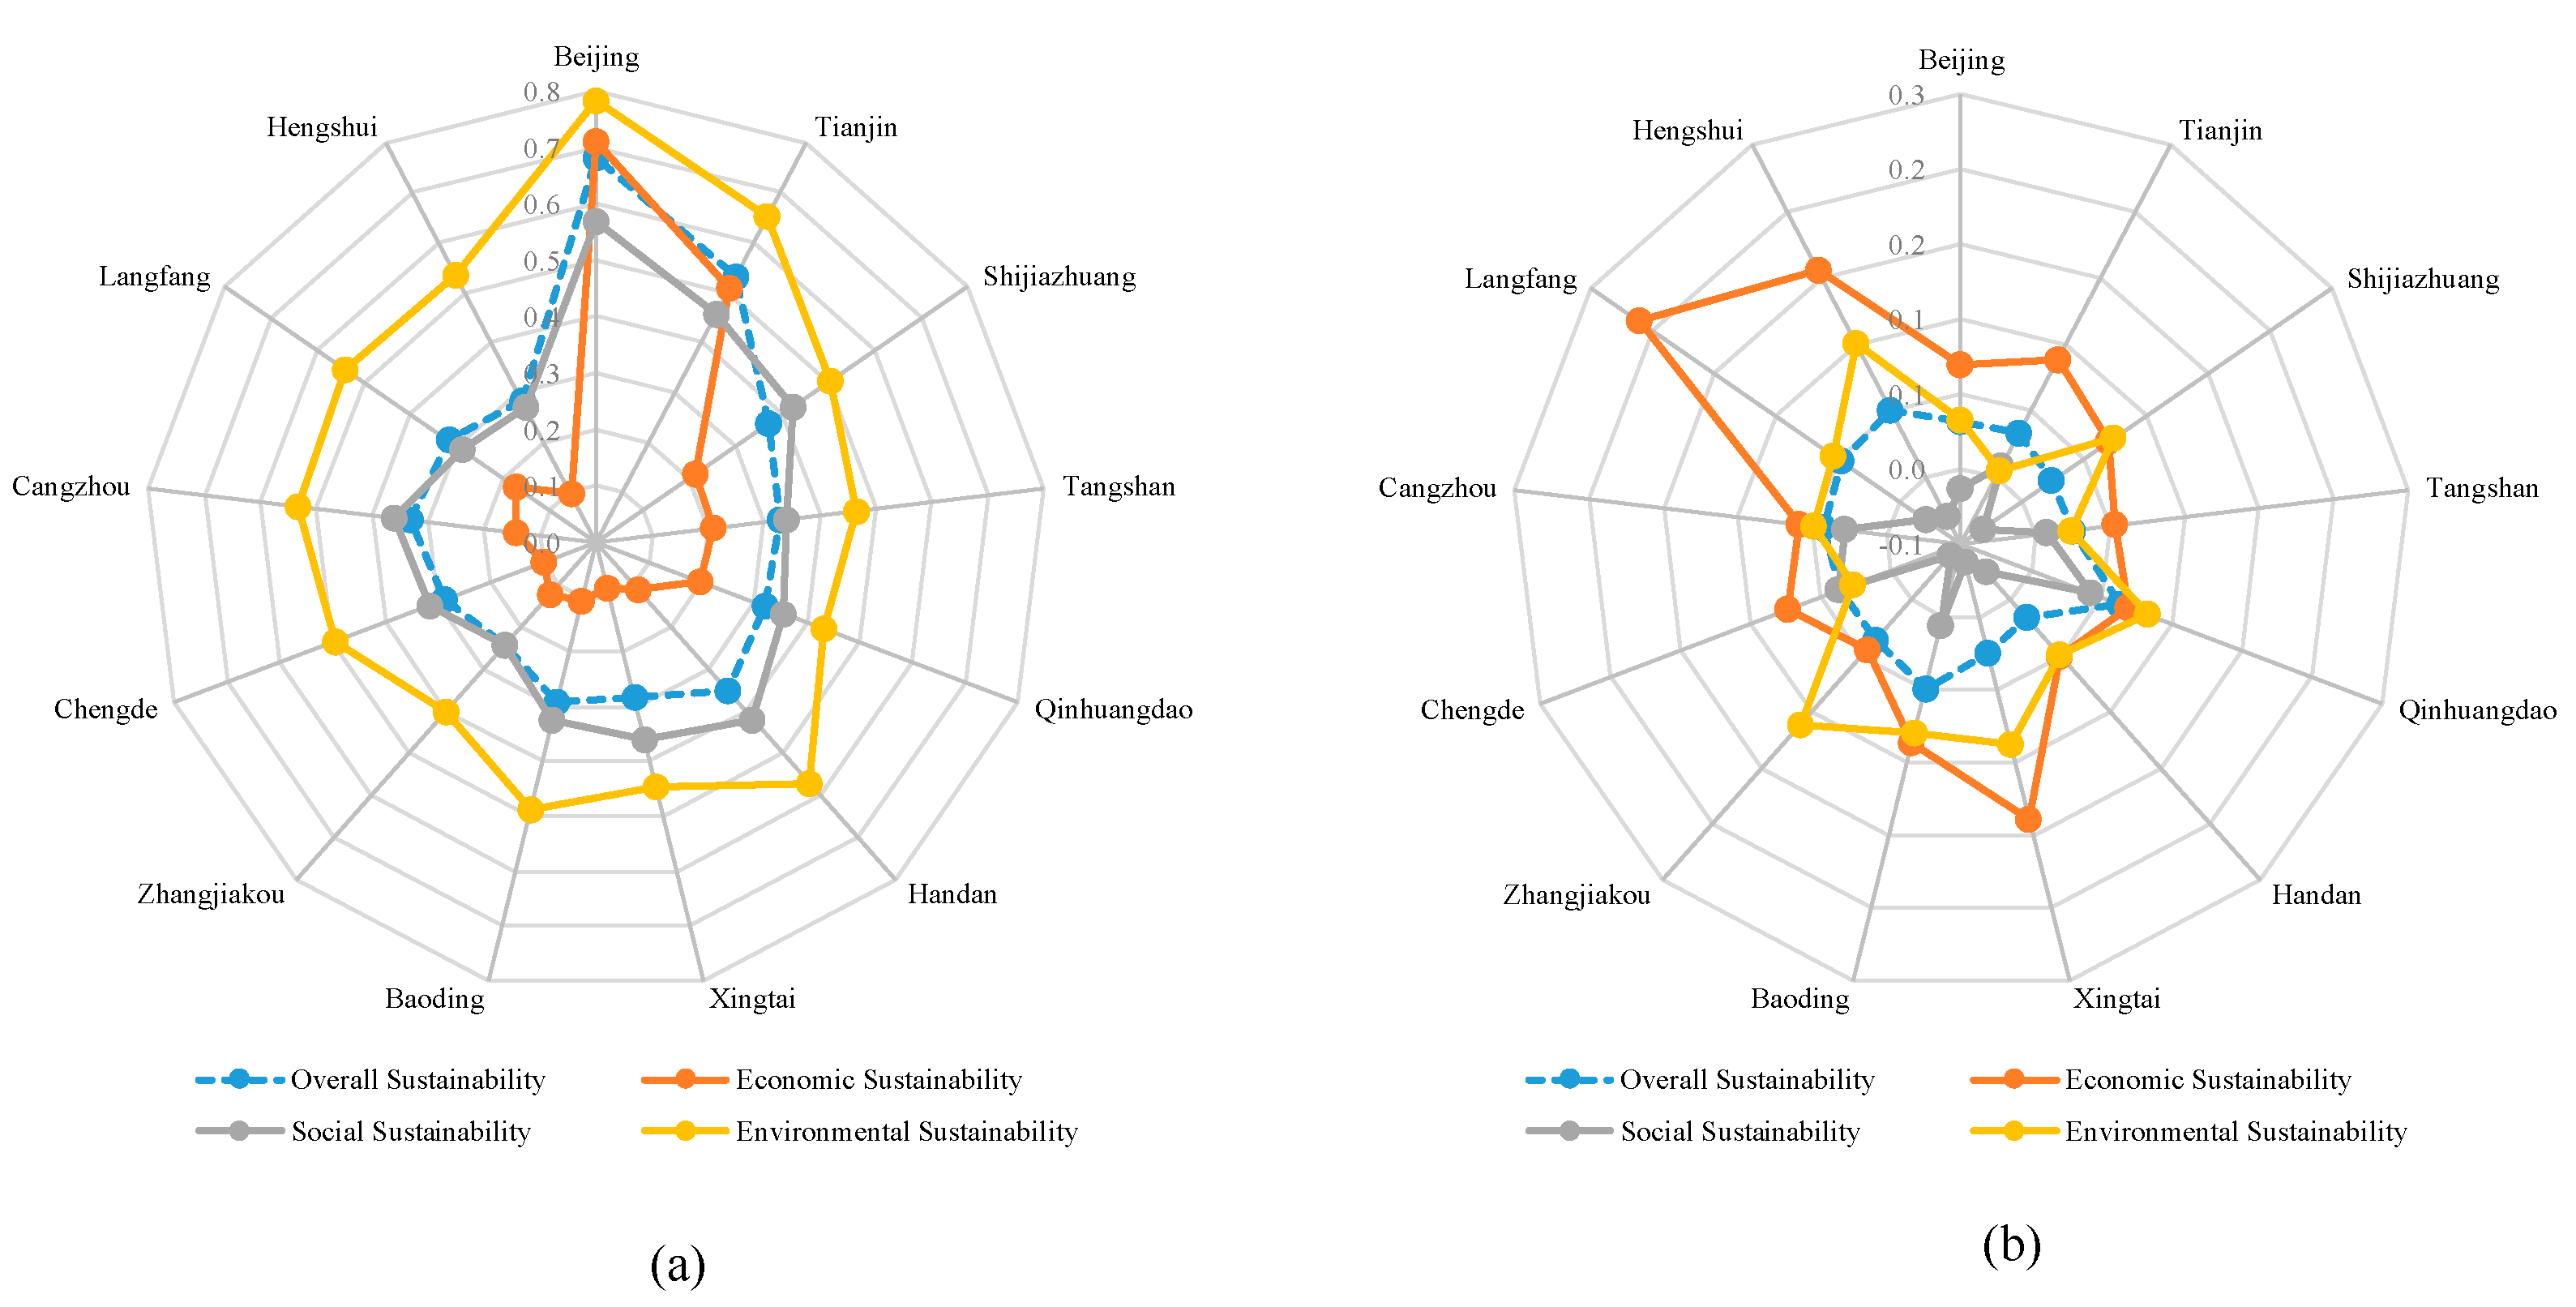
To more clearly compare the differences between the average development levels and growth rates among the cities, we created graphics which compare the cities on the basis of the three dimensions, as shown in Figure 4.
(1) For the cities located in Hebei province, their poor sustainability was mainly caused by their unfavorable performances in economic sustainability (see Figure 4a). The maximum average performance of the cities was 0.2124 (Shijiazhuang), revealing the great difference between that value and those of Beijing (0.7091) and Tianjin (0.5087).
(2) Beijing had the best development level as it performed best across the three dimensions of economy, society, and environment. Comparatively, it had the worst performance for social sustainability (0.5695). Combined with Figure 4b, the social sustainability of Beijing showed a negative growth rate (−1.35%).
(3) All of the cities performed best in environmental sustainability, which had the largest average performance values and positive growth rates. The performances of Beijing and Tianjin for economic sustainability were better than those for social sustainability. The cities in Hebei province had better social sustainability than economic sustainability. Although the cities, except for Beijing and Tianjin, had the worst economic sustainability, they showed optimistic growth rates (see Figure 4b). In particular, the average growth rates of Langfang, Hengshui, and Xingtai were over 10%, being 21.09%, 15.57%, and 13.92%, respectively.
(4) Overall, the development of the cities’ social sustainability was not optimistic. Except for Chengde, all the other cities’ growth rates for social sustainability were lower than those for the overall sustainability. In addition, more than half of the cities (accounting for 53.8%) had negative growth rates even though the development levels of their social sustainability were comparatively higher.
5. Conclusions and Suggestions
Sustainability is a very important factor in the process of the long-term development of the Capital Economic Circle. In this paper, we investigated the sustainable development of the cities in the Capital Economic Circle. The main innovation of this research is that criteria weights were determined by considering the criteria interdependences from the perspective of correlation analysis. Criteria which correlated to many of the other criteria were given more weight as they were viewed as providing more support for the development of the other associated criteria. The IOWA operator was used to aggregate the criteria data collected for the dimensions of economy, society, and environment.
The assessment results indicate that great differences exist in cities’ sustainability. The sustainable development levels of Beijing and Tianjin were shown to be much higher than those of the other cities located in Hebei province. However, all the cities were revealed to have maintained a sound momentum of sustainable growth as the average growth rates for the period 2011 to 2016 were positive. Significantly, the sustainable growth rates of Qinhuangdao and Hengshui were over 5%. In terms of the sustainable development across the three dimensions, all the cities performed best in environmental sustainability. Except for Beijing and Tianjin, the social sustainability of the cities was better than their economic sustainability. However, more than half of the cities (accounting for 53.8%) had negative growth rates for social sustainability. Overall, the cities in the Capital Economic Circle need to improve their levels of economic sustainability, prevent the decline of social sustainability, and maintain current levels of environmental sustainability in future developments.
More specifically, we suggest that local authorities in Beijing should pay more attention to social sustainability development. By analyzing the actual criteria data for social sustainability, it was found that education investment and traffic conditions were two key factors. Therefore, Beijing should invest more in education. Additionally, Beijing needs to further ease the pressures of transportation. Tianjin showed slow development in both social and environmental sustainability. There is a room for further improvement in these dimensions. With respect to the cities located in Hebei province, a focus on developing economic sustainability as well as preventing the decline of social sustainability is needed. In particular, by analyzing the actual criteria data, we suggest that more investment in science and technology is needed.
In future work, the sustainability of the cities in the Capital Economic Circle will be considered from the perspective of synergetic development. Accordingly, the criteria weight will be discussed in detail from the point of coupling. Developing a forecast approach to predict the future sustainable development of cities may also be an important topic of interest. A forecast can be developed using a fuzzy approach with reference to the research of Ziemba et al. [57].
Author Contributions
P.Y. designed the study and analyzed the data. W.L. conducted the research and wrote the paper. D.Z. contributed to data collection. All authors read and approved the manuscript.
Funding
This research was supported by the National Natural Science Foundation of China (71671031, 71701040, and 71803073), the Humanities and Social Sciences Foundation of the Chinese Ministry of Education (17YJC630067 and 18YJC790211), and the Fundamental Research Funds of the Central Universities of China (N170604004).
Acknowledgments
Special thanks to the reviewers for their valuable comments.
Conflicts of Interest
The authors declare no conflict of interest.
Appendix A. Actual Criteria Values of the Cities for the Years 2011 to 2016.

Table A1.
Criteria values for 2011.
| Criteria | City | ||||||||||||
|---|---|---|---|---|---|---|---|---|---|---|---|---|---|
| B1 | T2 | S3 | T4 | Q5 | H6 | X7 | B8 | Z9 | C10 | C11 | L12 | H13 | |
| C1 | 81,658 | 85,213 | 39,919 | 71,565 | 35,691 | 30,270 | 20,027 | 21,796 | 25,649 | 31,705 | 36,053 | 36,773 | 21,334 |
| C2 | 8.1 | 16.4 | 12.01 | 11.7 | 12 | 12.15 | 11.6 | 12 | 11.5 | 12.1 | 12.3 | 8 | 12.13 |
| C3 | 76.07 | 46.16 | 40.07 | 30.98 | 47.72 | 32.66 | 29.16 | 31.36 | 39.69 | 30.18 | 36 | 34.85 | 28.65 |
| C4 | 189,162,355 | 62,060,300 | 32,435,792 | 28,412,423 | 9,921,179 | 15,691,093 | 12,594,158 | 22,890,835 | 9,654,155 | 7,646,208 | 15,496,754 | 13,546,040 | 9,874,306 |
| C5 | 552.04 | 1310.3 | 36.83 | 146.69 | 207.71 | 66.88 | 2.18 | 38.40 | 39.97 | 15.22 | 39.85 | 135.38 | 33.34 |
| C6 | 53,997.38 | 34,073.26 | 16,674.89 | 18,108.79 | 13,611.00 | 8624.51 | 7355.84 | 8774.74 | 8173.87 | 8118.63 | 9306.35 | 11,605.44 | 8484.12 |
| C7 | 990.51 | 1103.26 | 8063.4 | 2497.65 | 1699.81 | 3429.26 | 5317.04 | 3463.46 | 2391.76 | 759.14 | 2963.39 | 2772.6 | 1819.41 |
| C8 | 0.1603 | 0.1683 | 0.2169 | 0.1773 | 0.1515 | 0.2134 | 0.2341 | 0.1980 | 0.1754 | 0.2017 | 0.2057 | 0.1905 | 0.2170 |
| C9 | 0.0564 | 0.0335 | 0.0157 | 0.0140 | 0.0064 | 0.0081 | 0.0050 | 0.0047 | 0.0044 | 0.0071 | 0.0043 | 0.0122 | 0.0049 |
| C10 | 68.55 | 44.82 | 37.88 | 43.56 | 40.42 | 31.80 | 30.73 | 27.30 | 31.98 | 35.95 | 32.18 | 35.24 | 27.90 |
| C11 | 0.0301 | 0.0868 | 0.1174 | 0.1591 | 0.1367 | 0.0812 | 0.0557 | 0.1213 | 0.1047 | 0.1254 | 0.0621 | 0.0321 | 0.0687 |
| C12 | 7.59 | 12.85 | 17.07 | 9.79 | 21.11 | 21.39 | 19.99 | 17.86 | 14.41 | 11.93 | 17.32 | 10.76 | 13.65 |
| C13 | 51.59 | 34.51 | 47.22 | 40.06 | 49.4 | 49.32 | 39.1 | 44.89 | 40.72 | 39.06 | 36.27 | 46.18 | 41.11 |
| C14 | 14.24 | 6.85 | 3.61 | 3.96 | 6.45 | 3.28 | 1.37 | 1.34 | 2.03 | 3.40 | 0.80 | 1.61 | 1.01 |
| C15 | 2.31 | 3.95 | 10.76 | 13.44 | 16.83 | 8.23 | 17.14 | 11.00 | 13.45 | 4.06 | 7.06 | 7.38 | 5.59 |
| C16 | 7.86 | 13.03 | 40.40 | 393.24 | 184.06 | 252.89 | 107.17 | 25.29 | 112.16 | 112.56 | 36.53 | 28.01 | 21.66 |
| C17 | 66.26 | 99.79 | 49.47 | 73.32 | 37.04 | 50.02 | 92.25 | 48.16 | 23.27 | 4.74 | 49.95 | 49.61 | 49.94 |
| C18 | 98.24 | 100 | 100 | 91.33 | 100 | 100 | 100 | 100 | 82 | 100 | 90.25 | 96.87 | 18.11 |
Note: B1 represents Beijing; T2 represents Tianjin; S3 represents Shijiangzhuang; T4 represents Tangshan; Q5 represents Qinhuangdao; H6 represents Handan; X7 represents Xingtai; B8 represents Baoding; Z9 represents Zhangjiakou; C10 represents Chengde; C11 represents Cangzhou; L12 represents Langfang; H13 represents Hengshui.
Table A2.
Criteria values for 2012.
| Criteria | City | ||||||||||||
|---|---|---|---|---|---|---|---|---|---|---|---|---|---|
| B1 | T2 | S3 | T4 | Q5 | H6 | X7 | B8 | Z9 | C10 | C11 | L12 | H13 | |
| C1 | 87,475 | 93,173 | 43,552 | 76,643 | 37,804 | 32,650 | 21,361 | 24,053 | 28,139 | 33,791 | 38,949 | 40,598 | 23,101 |
| C2 | 7.73 | 13.8 | 10.38 | 10.4 | 9.1 | 10.5 | 9.5 | 10.5 | 10 | 10.5 | 10.6 | 9.7 | 10.4 |
| C3 | 76.46 | 46.99 | 40.16 | 31.72 | 47.33 | 33.71 | 30.16 | 31.12 | 40.43 | 31.42 | 36.06 | 34.96 | 29.58 |
| C4 | 214,045,510 | 70,553,800 | 37,354,986 | 33,050,711 | 11,501,932 | 17,908,067 | 14,547,114 | 26,570,092 | 11,197,512 | 8,882,165 | 18,456,510 | 15,815,550 | 11,603,919 |
| C5 | 619.78 | 1511.9 | 84.36 | 165.85 | 215.64 | 80.58 | 13.34 | 46.97 | 53.29 | 34.61 | 47.84 | 143.16 | 41.46 |
| C6 | 59,366.60 | 39,482.77 | 19,056.61 | 20,693.13 | 15,584.06 | 9804.43 | 8346.29 | 10,018.90 | 9385.06 | 9278.90 | 10,585.32 | 13,113.62 | 9765.67 |
| C7 | 790.6 | 844.56 | 634.36 | 550.6 | 373.26 | 823.09 | 601.42 | 528.33 | 127.03 | 95.31 | 529.68 | 673.85 | 500.67 |
| C8 | 0.1706 | 0.1767 | 0.2355 | 0.1990 | 0.1744 | 0.2512 | 0.2293 | 0.2059 | 0.1937 | 0.2182 | 0.2368 | 0.2098 | 0.2285 |
| C9 | 0.0543 | 0.0357 | 0.0162 | 0.0216 | 0.0060 | 0.0128 | 0.0047 | 0.0050 | 0.0049 | 0.0067 | 0.0047 | 0.0126 | 0.0046 |
| C10 | 71.38 | 49.23 | 41.38 | 38.01 | 36.29 | 33.64 | 31.70 | 31.60 | 25.63 | 42.60 | 26.70 | 35.49 | 29.95 |
| C11 | 0.0151 | 0.0822 | 0.1169 | 0.1348 | 0.1604 | 0.0816 | 0.0556 | 0.1254 | 0.0898 | 0.1239 | 0.0628 | 0.0301 | 0.0763 |
| C12 | 7.53 | 14.29 | 17.34 | 9.35 | 21.46 | 22 | 17.94 | 18.28 | 14.7 | 12.11 | 17.54 | 10.82 | 13.43 |
| C13 | 51.92 | 34.89 | 41.06 | 40.62 | 48.98 | 49.3 | 39.31 | 36.94 | 41.45 | 39.75 | 37.1 | 46.3 | 38.93 |
| C14 | 15.09 | 6.89 | 3.54 | 3.99 | 6.62 | 3.30 | 1.36 | 0.95 | 2.07 | 3.57 | 0.82 | 1.60 | 0.98 |
| C15 | 2.49 | 3.58 | 13.01 | 14.79 | 14.91 | 6.08 | 15.02 | 9.78 | 14.40 | 3.08 | 6.58 | 5.23 | 4.98 |
| C16 | 8.35 | 11.05 | 41.19 | 312.68 | 194.18 | 201.43 | 90.56 | 22.75 | 70.21 | 61.01 | 26.98 | 24.57 | 14.81 |
| C17 | 78.96 | 99.62 | 49.47 | 73.32 | 37.04 | 50.02 | 48.25 | 48.16 | 23.27 | 4.74 | 49.95 | 49.61 | 49.94 |
| C18 | 99.12 | 99.8 | 100 | 91.33 | 100 | 100 | 100 | 84.455 | 85 | 100 | 92.61 | 95.7 | 41.815 |
Table A3.
Criteria values for 2013.
| Criteria | City | ||||||||||||
|---|---|---|---|---|---|---|---|---|---|---|---|---|---|
| B1 | T2 | S3 | T4 | Q5 | H6 | X7 | B8 | Z9 | C10 | C11 | L12 | H13 | |
| C1 | 148,181 | 143,129 | 48,491 | 82,831 | 39,889 | 30,800 | 21,030 | 24,951 | 28,201 | 33,653 | 39,960 | 46,046 | 23,889 |
| C2 | 9.07 | 11.45 | 8.08 | 4.43 | 2.58 | 1.23 | 4.73 | 6.74 | 6.76 | 7.63 | 7.13 | 8.29 | 5.86 |
| C3 | 76.85 | 48.05 | 41.44 | 32.27 | 47.03 | 35.76 | 31.74 | 31.54 | 39.56 | 32.38 | 37.34 | 37.16 | 32.1 |
| C4 | 229,043,566 | 76,123,070 | 41,575,970 | 36,527,884 | 13,116,573 | 20,141,656 | 16,559,275 | 30,362,317 | 12,686,186 | 10,324,862 | 20,924,394 | 18,294,251 | 13,085,517 |
| C5 | 647.59 | 1676.2 | 97.74 | 182.99 | 252.22 | 88.91 | 60.26 | 53.26 | 59.30 | 10.94 | 54.39 | 162.24 | 45.22 |
| C6 | 63,626.22 | 44,526.18 | 19,660.61 | 23,346.54 | 17,580.05 | 11,128.60 | 9286.41 | 10,486.18 | 10,704.10 | 10,382.82 | 11,749.25 | 15,250.55 | 10,977.42 |
| C7 | 802.11 | 842.47 | 632.98 | 537.57 | 375.19 | 823.89 | 613.58 | 556.89 | 126.61 | 95.17 | 536.77 | 661.83 | 507.08 |
| C8 | 0.1632 | 0.1810 | 0.2221 | 0.1956 | 0.1669 | 0.2328 | 0.2108 | 0.1698 | 0.1683 | 0.2018 | 0.2000 | 0.1834 | 0.1837 |
| C9 | 0.0562 | 0.0364 | 0.0153 | 0.0182 | 0.0069 | 0.0147 | 0.0050 | 0.0053 | 0.0046 | 0.0082 | 0.0059 | 0.0108 | 0.0043 |
| C10 | 87.58 | 52.85 | 47.67 | 51.82 | 47.58 | 35.79 | 35.14 | 29.99 | 41.29 | 41.59 | 35.31 | 36.81 | 33.85 |
| C11 | 0.0106 | 0.1221 | 0.1096 | 0.1480 | 0.2450 | 0.0426 | 0.0420 | 0.1134 | 0.0897 | 0.1075 | 0.0634 | 0.0325 | 0.0652 |
| C12 | 7.72 | 15.14 | 18.07 | 10.07 | 21.59 | 22.65 | 15.74 | 22.79 | 15.79 | 14.83 | 17.63 | 10.74 | 16.76 |
| C13 | 51.11 | 35.46 | 42.89 | 41.14 | 56.16 | 46.42 | 37.42 | 41.41 | 41.45 | 41.02 | 36.88 | 44.15 | 41.54 |
| C14 | 15.51 | 7.25 | 3.77 | 4.02 | 6.76 | 3.00 | 1.40 | 1.09 | 2.31 | 3.49 | 0.77 | 1.64 | 1.00 |
| C15 | 2.61 | 3.47 | 12.19 | 9.35 | 15.16 | 6.09 | 12.82 | 8.96 | 10.97 | 3.04 | 4.48 | 4.30 | 5.17 |
| C16 | 7.47 | 11.66 | 46.12 | 355.29 | 192.34 | 182.96 | 87.84 | 24.53 | 77.38 | 59.43 | 27.41 | 20.47 | 14.67 |
| C17 | 86.58 | 99.39 | 98.61 | 73.32 | 49.32 | 95.4 | 94.47 | 89.64 | 38.93 | 5.49 | 99.58 | 98.9 | 99.77 |
| C18 | 99.3 | 96.8 | 73.54 | 88.34 | 90.22 | 100 | 99.86 | 68.91 | 87.58 | 85.86 | 74.44 | 27.16 | 65.52 |
Table A4.
Criteria values for 2014.
| Criteria | City | ||||||||||||
|---|---|---|---|---|---|---|---|---|---|---|---|---|---|
| B1 | T2 | S3 | T4 | Q5 | H6 | X7 | B8 | Z9 | C10 | C11 | L12 | H13 | |
| C1 | 99,995 | 10,5231 | 48,970 | 80,450 | 39,282 | 32,943 | 22,758 | 26,501 | 30,540 | 38,128 | 42,676 | 48,407 | 26,022 |
| C2 | 7.3 | 10 | 7.9 | 5.1 | 5 | 6.5 | 6 | 7.1 | 5.24 | 7.84 | 8 | 8.2 | 8.2 |
| C3 | 77.95 | 49.34 | 43.81 | 33.27 | 48.01 | 36.8 | 36.04 | 34.48 | 39.58 | 33.2 | 37.89 | 42.5 | 37.65 |
| C4 | 239,722,163 | 79,168,974 | 43,876,724 | 39,905,102 | 14,476,204 | 22,516,785 | 18,590,332 | 33,889,235 | 14,175,021 | 11,398,186 | 23,316,767 | 20,718,058 | 14,641,503 |
| C5 | 678.03 | 1855.7 | 99.71 | 186.79 | 275.20 | 89.89 | 62.88 | 50.63 | 69.39 | 39.24 | 44.56 | 159.23 | 47.79 |
| C6 | 72,281.36 | 46,608.19 | 23,645.88 | 25,983.97 | 19,571.97 | 12,067.67 | 10,301.23 | 12,550.56 | 11,997.51 | 11,607.33 | 13,116.83 | 16,067.86 | 12,218.15 |
| C7 | 812.5 | 853.12 | 781.85 | 559.06 | 378.17 | 853.28 | 621.64 | 539.37 | 127.07 | 96.41 | 547.47 | 705.75 | 513.4 |
| C8 | 0.1640 | 0.1792 | 0.2120 | 0.2077 | 0.1691 | 0.2237 | 0.1916 | 0.1902 | 0.1561 | 0.1829 | 0.1975 | 0.1779 | 0.1510 |
| C9 | 0.0625 | 0.0378 | 0.0129 | 0.0155 | 0.0089 | 0.0167 | 0.0065 | 0.0050 | 0.0046 | 0.0066 | 0.0092 | 0.0097 | 0.0034 |
| C10 | 77.13 | 58.51 | 44.66 | 48.97 | 55.97 | 37.36 | 37.96 | 30.93 | 40.56 | 43.53 | 38.56 | 39.87 | 36.94 |
| C11 | 0.0090 | 0.1772 | 0.0868 | 0.1574 | 0.1405 | 0.0441 | 0.0432 | 0.1125 | 0.0803 | 0.0903 | 0.0581 | 0.0240 | 0.0493 |
| C12 | 7.93 | 15.78 | 12.83 | 9.4 | 21.83 | 17.96 | 16.66 | 22.76 | 15.07 | 12.37 | 17.78 | 10.98 | 13.65 |
| C13 | 60.41 | 41.82 | 48.98 | 41.17 | 92.87 | 46.52 | 36.89 | 40.49 | 43.38 | 41.91 | 37.15 | 44.42 | 42.89 |
| C14 | 20.18 | 7.53 | 4.22 | 3.95 | 6.84 | 2.90 | 1.35 | 1.11 | 2.32 | 3.60 | 0.78 | 1.59 | 0.99 |
| C15 | 2.49 | 3.46 | 9.26 | 8.74 | 13.04 | 5.00 | 11.53 | 7.83 | 10.66 | 2.73 | 4.32 | 4.11 | 4.20 |
| C16 | 6.16 | 20.38 | 40.20 | 335.48 | 123.12 | 236.36 | 105.93 | 29.65 | 88.75 | 134.43 | 28.85 | 30.92 | 19.24 |
| C17 | 87.67 | 98.91 | 95.1 | 70 | 65 | 95 | 95.29 | 86.2 | 44.1 | 6 | 99.88 | 100 | 99.6 |
| C18 | 99.59 | 96.23 | 71.98 | 100 | 157.94 | 100 | 99.02 | 82.37 | 88 | 88.41 | 93.55 | 29.41 | 100 |
Table A5.
Criteria values for 2015.
| Criteria | City | ||||||||||||
|---|---|---|---|---|---|---|---|---|---|---|---|---|---|
| B1 | T2 | S3 | T4 | Q5 | H6 | X7 | B8 | Z9 | C10 | C11 | L12 | H13 | |
| C1 | 106,497 | 107,960 | 51,043 | 78,398 | 40,746 | 33,450 | 24,256 | 29,067 | 30,840 | 38,505 | 44,819 | 54,460 | 27,543 |
| C2 | 6.9 | 9.3 | 7.5 | 5.6 | 5.5 | 6.76 | 6 | 7 | 5.8 | 5.54 | 7.7 | 8.8 | 7.6 |
| C3 | 79.65 | 52.15 | 45.84 | 35.55 | 50.2 | 40.03 | 39.41 | 38.2 | 42.12 | 35.82 | 40.8 | 47.1 | 40 |
| C4 | 239,139,670 | 87,437,889 | 48,689,313 | 44,661,842 | 15,588,828 | 27,072,108 | 21,100,425 | 37,437,790 | 15,948,766 | 12,744,585 | 26,413,681 | 23,774,250 | 17,135,029 |
| C5 | 966.13 | 2058.1 | 110.82 | 164.75 | 291.31 | 78.14 | 28.15 | 34.60 | 70.92 | 41.74 | 61.08 | 163.93 | 36.99 |
| C6 | 76,851.07 | 51,195.67 | 26,175.44 | 28,450.26 | 21,438.88 | 12,998.93 | 11,216.40 | 12,554.65 | 13,179.23 | 12,836.24 | 14,323.15 | 17,270.22 | 13,466.28 |
| C7 | 819.57 | 861.79 | 788.14 | 560.42 | 379.39 | 870.29 | 627.36 | 541.81 | 127.46 | 96.73 | 551.48 | 722.34 | 512.76 |
| C8 | 0.1491 | 0.1570 | 0.1995 | 0.2081 | 0.1858 | 0.1951 | 0.2046 | 0.2154 | 0.1659 | 0.1950 | 0.2134 | 0.1539 | 0.1616 |
| C9 | 0.0502 | 0.0374 | 0.0133 | 0.0108 | 0.0040 | 0.0080 | 0.0037 | 0.0039 | 0.0030 | 0.0053 | 0.0038 | 0.0086 | 0.0032 |
| C10 | 77.79 | 60.86 | 45.43 | 49.85 | 51.45 | 39.10 | 37.82 | 37.68 | 42.20 | 45.02 | 41.91 | 39.19 | 36.96 |
| C11 | 0.0096 | 0.1770 | 0.0868 | 0.1117 | 0.1343 | 0.0457 | 0.0413 | 0.1101 | 0.7010 | 0.0842 | 0.0551 | 0.0229 | 0.1069 |
| C12 | 7.46 | 13.65 | 13.08 | 9.27 | 15.21 | 17.99 | 17.23 | 13.74 | 15.07 | 12.31 | 17.61 | 11.02 | 13.27 |
| C13 | 61.00 | 32.65 | 44.42 | 41.17 | 40.17 | 46.64 | 36.17 | 38.41 | 44.08 | 42.89 | 36.72 | 45.53 | 39.87 |
| C14 | 21.93 | 8.63 | 4.27 | 3.95 | 7.21 | 2.87 | 1.41 | 1.59 | 2.33 | 3.66 | 0.78 | 1.61 | 1.25 |
| C15 | 2.53 | 3.43 | 7.98 | 7.47 | 18.39 | 4.43 | 9.15 | 6.55 | 8.11 | 2.50 | 3.75 | 3.62 | 3.69 |
| C16 | 3.66 | 13.36 | 31.66 | 292.73 | 4708.5 | 139.12 | 76.96 | 19.04 | 63.29 | 92.73 | 21.38 | 38.41 | 10.11 |
| C17 | 83.33 | 98.58 | 98 | 72.5 | 68.55 | 97 | 95.31 | 93 | 57.16 | 24 | 100 | 97 | 99.3 |
| C18 | 99.8 | 99 | 95.41 | 100 | 100 | 100 | 100 | 99.99 | 95 | 89.02 | 100 | 58.95 | 100 |
Table A6.
Criteria values for 2016.
| Criteria | City | ||||||||||||
|---|---|---|---|---|---|---|---|---|---|---|---|---|---|
| B1 | T2 | S3 | T4 | Q5 | H6 | X7 | B8 | Z9 | C10 | C11 | L12 | H13 | |
| C1 | 118,198 | 115,053 | 55,177 | 81,239 | 73,755 | 35,265 | 27,038 | 29,992 | 33,142 | 40,741 | 47,425 | 58,972 | 31,955 |
| C2 | 6.8 | 9.1 | 6.8 | 6.8 | 7 | 6.08 | 7.1 | 7.2 | 7 | 6.95 | 7.9 | 8 | 7.8 |
| C3 | 80.23 | 56.44 | 46.44 | 35.5 | 50.75 | 40.26 | 39.49 | 38.61 | 44.53 | 37.68 | 41.7 | 48.6 | 39.96 |
| C4 | 280,120,329 | 91,253,832 | 53,482,000 | 48,931,575 | 17,411,356 | 30,979,895 | 24,023,525 | 41,666,122 | 18,166,138 | 14,386,586 | 29,593,421 | 28,602,556 | 19,245,804 |
| C5 | 955.88 | 2952.7 | 117.63 | 195.13 | 303.48 | 96.83 | 69.06 | 58.28 | 97.88 | 52.23 | 72.44 | 170.65 | 52.20 |
| C6 | 80,741.75 | 53,982.83 | 28,663.12 | 31,198.76 | 23,483.38 | 14,302.20 | 12,308.20 | 15,146.55 | 14,535.61 | 14,185.55 | 15,741.19 | 18,764.07 | 14,844.71 |
| C7 | 819.57 | 861.79 | 788.14 | 560.42 | 379.39 | 870.29 | 627.36 | 541.81 | 127.46 | 96.73 | 551.48 | 722.34 | 512.76 |
| C8 | 0.1385 | 0.1358 | 0.2134 | 0.1816 | 0.1972 | 0.2006 | 0.2015 | 0.2136 | 0.1718 | 0.2000 | 0.2113 | 0.1551 | 0.1653 |
| C9 | 0.0446 | 0.0338 | 0.0164 | 0.0134 | 0.0119 | 0.0083 | 0.0060 | 0.0061 | 0.0054 | 0.0079 | 0.0086 | 0.0150 | 0.0056 |
| C10 | 80.72 | 59.16 | 47.76 | 50.77 | 51.85 | 42.21 | 39.93 | 39.19 | 47.13 | 49.06 | 43.92 | 41.24 | 40.29 |
| C11 | 0.0241 | 0.0790 | 0.0868 | 0.1081 | 0.1200 | 0.2003 | 0.0383 | 0.0910 | 0.7909 | 0.0783 | 0.0499 | 0.0215 | 0.1037 |
| C12 | 7.46 | 13.65 | 13.08 | 9.27 | 15.21 | 17.99 | 17.23 | 13.74 | 15.07 | 12.31 | 17.61 | 11.02 | 13.27 |
| C13 | 61.58 | 32.81 | 45.45 | 29.28 | 40.37 | 44.76 | 37.43 | 39.1 | 42.9 | 44.08 | 37.03 | 45.81 | 29.46 |
| C14 | 22.06 | 9.22 | 4.31 | 3.98 | 7.17 | 3.26 | 1.40 | 1.36 | 2.54 | 3.68 | 0.84 | 1.67 | 1.24 |
| C15 | 2.55 | 3.46 | 4.82 | 9.27 | 10.96 | 3.56 | 6.96 | 4.03 | 7.23 | 2.84 | 1.88 | 3.77 | 1.87 |
| C16 | 2.36 | 11.01 | 19.49 | 312.79 | 136.30 | 87.04 | 61.36 | 7.63 | 65.30 | 83.94 | 5.59 | 23.52 | 6.02 |
| C17 | 83.33 | 98.99 | 94.96 | 70.79 | 81.89 | 85.7 | 96.03 | 98.84 | 57.16 | 27.5 | 59.73 | 94.29 | 98.97 |
| C18 | 99.84 | 94 | 99.54 | 100 | 100 | 96.67 | 100 | 93.11 | 95.5 | 95.62 | 100 | 100 | 100 |
References
- National Bureau of Statistics. China Statistical Yearbook (2010, 2018); China Statistics Press: Beijing, China, 2018. [Google Scholar]
- Richardson, H.W.; Bae, C.H.C.; Baxamusa, H. Compact cities in developing countries: Assessment and implications. In Compact Cities: Sustainable Urban Forms for Developing Countries; E & F N Spon Process: New York, NY, USA, 2000; pp. 25–35. [Google Scholar]
- Chen, H.; Jia, B.; Lau, S.S.Y. Sustainable urban form for Chinese compact cities: Challenges of a rapid urbanized economy. Habitat Int. 2008, 32, 28–40. [Google Scholar] [CrossRef]
- Wang, Q.; Dai, H.; Wang, H. A smart MCDM framework to evaluate the impact of air pollution on city sustainability: A case study from China. Sustainability 2017, 9, 911. [Google Scholar] [CrossRef]
- Munier, N. Methodology to select a set of urban sustainability indicators to measure the state of the city, and performance assessment. Ecol. Indic. 2011, 11, 1020–1026. [Google Scholar] [CrossRef]
- Ness, B.; Urbel-Piirsalu, E.; Anderberg, S.; Olsson, L. Categorising tools for sustainability assessment. Ecol. Econ. 2007, 60, 498–508. [Google Scholar] [CrossRef]
- Leach, J.M.; Lee, S.E.; Hunt, D.V.L.; Rogers, C.D.F. Improving city-scale measures of livable sustainability: A study of urban measurement and assessment through application to the city of Birmingham, UK. Cities 2017, 71, 80–87. [Google Scholar] [CrossRef]
- Mori, K.; Christodoulou, A. Review of sustainability indices and indicators: Towards a new city sustainability index (CSI). Environ. Impact Assess. Rev. 2012, 32, 94–106. [Google Scholar] [CrossRef]
- Lehtonen, M. The environmental-social interface of sustainable development: capabilities, social capital, institutions. Ecol. Econ. 2004, 49, 199–214. [Google Scholar] [CrossRef]
- Costanza, R. Ecological Economics: The Science and Management of Sustainability; Columbia University Press: New York, NY, USA, 1991. [Google Scholar]
- Munasinghe, M. Environmental Economics and Sustainable Development; World Bank Publications: Washington, DC, USA, 1993. [Google Scholar]
- Elkington, J. Cannibals with Forks: The Triple Bottom Line of the 21st Century Business; New Society Publishers: Stoney Creek, CT, USA, 1998. [Google Scholar]
- NZMCH-New Zealand Ministry for Culture and Heritage. Cultural Well-Being and Local Government: Report 1, 2006. Available online: http://www.mch.govt.nz/files/report1.pdf (accessed on 15 December 2002).
- Hawkes, J. The Fourth Pillar of Sustainability: Culture’s Essential Role in Public Planning; Cultural Development Network (Vic): Melbourne, Australia, 2006. [Google Scholar]
- Lozano, R. Envisioning sustainability three dimensionally. J. Clean. Prod. 2008, 16, 1838–1846. [Google Scholar] [CrossRef]
- Valentin, A.; Spangenberg, J.H. A guide to community sustainability indicators. Environ. Impact Assess. Rev. 2000, 20, 381–392. [Google Scholar] [CrossRef]
- Ali-Toudert, F.; Ji, L.M. Modelling and measuring urban sustainability in multi-criteria based systems—A challenging issue. Ecol. Indic. 2017, 73, 597–611. [Google Scholar] [CrossRef]
- Nordo, M.; Saisana, M.; Saltelli, A.; Tarantola, S.; Hoffman, A.; Giovannini, E. Handbookon Constructing Composite Indicators: Methodology and User Guide; OECD Publishing: Paris, France, 2008. [Google Scholar]
- Zhou, L.; Tokos, H.; Krajnc, D.; Yang, Y.R. Sustainability performance evaluation in industry by composite sustainability index. Clean Technol. Environ. Policy 2012, 14, 789–803. [Google Scholar] [CrossRef]
- Su, S.; Yu, J.; Zhang, J. Measurements study on sustainability of China’s mining cities. Expert Syst. Appl. 2010, 37, 6028–6035. [Google Scholar] [CrossRef]
- Reza, B.; Sadiq, R.; Hewage, K. Sustainability assessment of flooring systems in the city of Tehran: An AHP-based life cycle analysis. Constr. Build. Mater. 2011, 25, 2053–2066. [Google Scholar] [CrossRef]
- Ameen, R.F.M.; Mourshed, M. Urban sustainability assessment framework development: The ranking and weighting of sustainability indicators using analytic hierarchy process. Sustain. Cities Soc. 2019, 44, 356–366. [Google Scholar] [CrossRef]
- Asmelash, A.G.; Kumar, S. Assessing progress of tourism sustainability: Developing and validating sustainability indicators. Tour. Manag. 2019, 71, 67–83. [Google Scholar] [CrossRef]
- Ding, L.; Shao, Z.; Zhang, H.; Xu, C.; Wu, D. A comprehensive evaluation of urban sustainable development in China based on the TOPSIS-entropy method. Sustainability 2016, 8, 746. [Google Scholar] [CrossRef]
- Lin, Z.; Xia, B. Sustainability analysis of the urban ecosystem in Guangzhou city based on information entropy between 2004 and 2010. J. Geogr. Sci. 2013, 23, 417–435. [Google Scholar] [CrossRef]
- Lu, C.; Xue, B.; Lu, C.; Wang, T.; Jiang, L.; Zhang, Z.; Ren, W. Sustainability investigation of resource-based cities in northeastern China. Sustainability 2016, 8, 1058. [Google Scholar] [CrossRef]
- Van de Kerk, G.; Manuel, A.R. A comprehensive index for a sustainable society: The SSI—The sustainable society index. Ecol. Econ. 2008, 66, 228–242. [Google Scholar] [CrossRef]
- Wagenhals, S.; Garner, W.; Duckers, L.; Kuhn, K. Sustainability index with integrated indicator dependencies. Bus. Manag. Educ. 2014, 12, 15–29. [Google Scholar] [CrossRef]
- Saaty, T.L. The Analytic Network Process: Decision Making with Dependence and Feedback; RWS Publications: Pittsburgh, PA, USA, 1996. [Google Scholar]
- Ziemba, P. Inter-criteria dependencies-based decision support in the sustainable wind energy management. Energies 2019, 12, 749. [Google Scholar] [CrossRef]
- Xu, P.; Chan, E.H.W.; Visscher, H.J.; Zhang, X.; Wu, Z. Sustainable building energy efficiency retrofit for hotel buildings using EPC mechanism in China: analytic network process (ANP) approach. J. Clean. Prod. 2015, 107, 378–388. [Google Scholar] [CrossRef]
- Zhang, L.; Xu, Y.; Yeh, C.-H.; Liu, Y.; Zhou, D. City sustainability evaluation using MCDM with objective weights of interdependent criteria. J. Clean. Prod. 2016, 131, 491–499. [Google Scholar] [CrossRef]
- Angilella, S.; Catalfo, P.; Corrente, S.; Giarlotta, A.; Greco, S.; Rizzo, M. Robust sustainable development assessment with composite indices aggregating interacting dimensions: The hierarchical-SMAA-Choquet integral approach. Knowl.-Based Syst. 2018, 158, 136–153. [Google Scholar] [CrossRef] [Green Version]
- Liang, D.; Liu, D.; Quan, W. Information aggregation of hesitant fuzzy interval sets for multicriteria decision-making. Comput. Sci. Eng. 2018, 20, 38–51. [Google Scholar] [CrossRef]
- Ye, J. A multicriteria decision-making method using aggregation operators for simplified neutrosophic sets. J. Intell. Fuzzy Syst. 2014, 26, 2459–2466. [Google Scholar]
- Garg, H. A new generalized Pythagorean fuzzy information aggregation using Einstein operations and its application to decision making. Int. J. Intell. Syst. 2016, 31, 886–920. [Google Scholar] [CrossRef]
- Wu, X.; Wang, J.; Peng, J.; Chen, X. Cross-entropy and prioritized aggregation operator with simplified neutrosophic sets and their application in multi-criteria decision-making problems. J. Intell. Fuzzy Syst. 2016, 18, 1104–1116. [Google Scholar] [CrossRef]
- Yager, R.R. On ordered weighted averaging aggregation operators in multi-criteria decision making. IEEE Trans. Syst. Man Cybern. Part B 1988, 18, 183–190. [Google Scholar] [CrossRef]
- Yager, R.R.; Filev, D.P. Induced ordered weighted averaging operators. IEEE Trans. Syst. Man Cybern. Part B 1999, 29, 141–150. [Google Scholar] [CrossRef]
- Cozzi, M.; Romano, S.; Viccaro, M.; Prete, C.; Persiani, G. Wildlife agriculture interactions, spatial analysis and trade-off between environmental sustainability and risk of economic damage. In The Sustainability of Agro-Food and Natural Resource Systems in the Mediterranean Basin; Vastola, A., Ed.; Springer: Cham, Switzerland, 2015; pp. 209–224. [Google Scholar]
- Yeheyis, M.; Hewage, K.; Alam, M.S.; Eskicioglu, C.; Sadiq, R. An overview of construction and demolition waste management in Canada: A lifecycle analysis approach to sustainability. Clean Technol. Environ. Policy 2013, 15, 81–90. [Google Scholar] [CrossRef]
- Rodger, J.A.; George, J.A. Triple bottom line accounting for optimizing natural gas sustainability: A statistical linear programming fuzzy ILOWA optimized sustainment model approach to reducing supply chain global cybersecurity vulnerability through information and communications technology. J. Clean. Prod. 2017, 142, 1931–1949. [Google Scholar]
- Yager, R.R. Induced aggregation operators. Fuzzy Sets Syst. 2003, 137, 59–69. [Google Scholar] [CrossRef]
- O’Hagan, M. Aggregating template rule antecedents in real-time expert systems with fuzzy set logic. In Proceedings of the 22nd Annual IEEE Asilomar Conference on Signals, Systems, Computers, Pacific Grove, CA, USA, 31 October–2 November 1988; pp. 681–689. [Google Scholar]
- Li, W.; Yi, P.; Zhang, D. Sustainability evaluation of cities in northeastern China using dynamic TOPSIS-entropy methods. Sustainability 2018, 10, 4542. [Google Scholar] [CrossRef]
- Tan, F.; Lu, Z. Assessing regional sustainable development through an integration of nonlinear principal component analysis and Gram Schmidt orthogonalization. Ecol. Indic. 2016, 63, 71–81. [Google Scholar] [CrossRef]
- Xu, C.; Wang, S.; Zhou, Y.; Wang, L.; Liu, W. A comprehensive quantitative evaluation of new sustainable urbanization level in 20 Chinese urban agglomerations. Sustainability 2016, 8, 91. [Google Scholar] [CrossRef]
- China City Development Academy (CCDA). Comprehensive Evaluation Report of Chinese Urban Scientific Development; Press of Social Science: Beijing, China, 2010. [Google Scholar]
- Gu, L.J. Low Carbon City: The New Idea of Chinese Urbanization. Future Dev. 2010, 3, 2–5. [Google Scholar]
- Ihsan, Z.; Idris, M.Y.; Abdullah, A.H. Attribute normalization techniques and performance of intrusion classifiers: A comparative analysis. Life Sci. J. 2013, 10, 2568–2576. [Google Scholar]
- Wang, W.; Zhang, X.L.; Gombault, S.; Knapskog, S.J. Attribute normalization in network intrusion detection. In Proceedings of the 10th International Symposium on Pervasive Systems, Algorithms, and Networks (ISPAN), Kaohsiung, Taiwan, 14–16 December 2009; pp. 448–453. [Google Scholar]
- Yi, P.; Li, W.; Li, L. Evaluation and prediction of city sustainability using MCDM and stochastic simulation methods. Sustainability 2018, 10, 3771. [Google Scholar] [CrossRef]
- Beijing Bureau of Statistics. Beijing Statistical Yearbook (2012–2017); China Statistics Press: Beijing, China, 2017. [Google Scholar]
- Tianjin Bureau of Statistics. Tianjin Statistical Yearbook (2012–2017); China Statistics Press: Beijing, China, 2017. [Google Scholar]
- Hebei Bureau of Statistics. Hebei Provincial Statistical Yearbook (2012–2017); China Statistics Press: Beijing, China, 2017. [Google Scholar]
- National Bureau of Statistics. China City Statistical Yearbook (2012–2017); China Statistics Press: Beijing, China, 2017. [Google Scholar]
- Ziemba, P.; Becker, J. Analysis of the digital divide using fuzzy forecasting. Symmetry 2019, 11, 166. [Google Scholar] [CrossRef]
Figure 1.
Locations of the studied cities in the Capital Economic Circle.

Figure 2.
The framework of the study. Legend: IOWA, induced ordered average weighting.

Figure 3.
Change in development trends of cities’ sustainability for different years. Note: a This value represents the average growth rates of the sustainable performance of a city from 2011 to 2016, calculated by (yi(2016) − yi(2011))/yi(2011)/5 × 100%; b This value represents the maximum sustainability performance of a city.

Figure 4.
Comparison of cities’ average development levels and growth across different dimensions. (a) Comparison of the average performances. (b) Comparison of the average growth rates.
Figure 4.
Comparison of cities’ average development levels and growth across different dimensions. (a) Comparison of the average performances. (b) Comparison of the average growth rates.

Table 1.
Specifications of the 13 cities in the Capital Economic Circle, China.
| City | Population | Area (km2) | Water Resources (10,000 m3) | Per-Capita GDP (USD) * |
|---|---|---|---|---|
| Beijing | 13,630,000 | 16,411 | 351,000 | 17,505.12 |
| Tianjin | 10,440,000 | 11,917 | 189,200 | 17,039.35 |
| Shijiazhuang | 10,380,000 | 13,056 | 276,800 | 8171.71 |
| Tangshan | 7,600,000 | 13,472 | 223,600 | 12,031.50 |
| Qinhuangdao | 2,980,000 | 7802 | 215,300 | 10,923.12 |
| Handan | 10,550,000 | 12,065 | 178,500 | 5222.75 |
| Xingtai | 7,880,000 | 12,433 | 146,000 | 4004.33 |
| Baoding | 12,070,000 | 22,185 | 264,700 | 4441.82 |
| Zhangjiakou | 4,700,000 | 36,797 | 177,600 | 4908.33 |
| Chengde | 3,830,000 | 39,493 | 173,000 | 6033.74 |
| Cangzhou | 7,800,000 | 14,035 | 65,300 | 7023.64 |
| Langfang | 4,700,000 | 6382 | 70,800 | 8733.75 |
| Hengshui | 4,550,000 | 8815 | 65,000 | 4732.54 |
* Exchange rate: 1 USD = 6.7514 RMB as of 15 January 2019.
Table 2.
Criteria for sustainability assessment of cities in the Capital Economic Circle in China.
| Dimension | Criteria [Code] | Unit | Property | Weight |
|---|---|---|---|---|
| Economy | GDP per capita [C1] | Yuan | Benefit | 0.0618 |
| GDP growth rate [C2] | % | Benefit | 0.0345 | |
| Proportion of GDP generated by the service industry [C3] | % | Benefit | 0.0800 | |
| Household saving deposits [C4] | 10,000 yuan | Benefit | 0.0659 | |
| Amount of foreign investment actually utilized per capita [C5] | USD | Benefit | 0.0509 | |
| Retail sales of consumer goods per capita [C6] | Yuan | Benefit | 0.0703 | |
| Society | Population density [C7] | Person/km2 | Benefit | 0.0324 |
| Ratio of education expenditure and public finance expenditure [C8] | % | Benefit | 0.0579 | |
| Ratio of science and technology expenditure and public finance expenditure [C9] | % | Benefit | 0.0910 | |
| Beds of medical institutions per 10,000 people [C10] | Unit | Benefit | 0.0853 | |
| Registered urban unemployment rate [C11] | % | Cost | 0.0368 | |
| Per capita area of paved roads [C12] | m2 | Benefit | 0.0477 | |
| Environment | Ratio green coverage of built-up areas [C13] | % | Benefit | 0.0393 |
| Per capita park green area [C14] | m2 | Benefit | 0.0542 | |
| Per industrial enterprise waste water discharged [C15] | 10,000 tons | Cost | 0.0749 | |
| Per industrial enterprise smoke and dust emissions [C16] | Ton | Cost | 0.0304 | |
| Ratio of industrial solid wastes comprehensively utilized [C17] | % | Benefit | 0.0420 | |
| Ratio of consumption wastes treated [C18] | % | Benefit | 0.0447 |
Table 3.
The ranks of criteria and their order-inducing values.
| Rank | 1 | 2 | 3 | 4 | 5 | 6 | 7 | 8 | 9 |
|---|---|---|---|---|---|---|---|---|---|
| Criterion | C9 | C10 | C3 | C15 | C6 | C4 | C1 | C8 | C14 |
| 16 | 15 | 15 | 15 | 14 | 14 | 14 | 14 | 13 | |
| - | 0.5648 | 0.5352 | 0.2861 | 0.6116 | 0.5765 | 0.5362 | 0.3603 | 0.6030 | |
| Rank | 10 | 11 | 12 | 13 | 14 | 15 | 16 | 17 | 18 |
| Criterion | C5 | C12 | C18 | C17 | C13 | C11 | C2 | C7 | C16 |
| 13 | 13 | 12 | 11 | 10 | 10 | 9 | 7 | 3 | |
| 0.4533 | 0.3822 | - | - | 0.3177 | 0.1455 | - | - | - |
Note: “-” indicates that the value of did not need to be calculated as the associated value is unique.
Table 4.
Sustainable performances of the 13 cities in the Capital Economic Circle, China.
| City | 2011 | 2012 | 2013 | 2014 | 2015 | 2016 | ||||||
|---|---|---|---|---|---|---|---|---|---|---|---|---|
| V a | R b | V | R | V | R | V | R | V | R | V | R | |
| Beijing | 0.6140 | 1 | 0.6418 | 1 | 0.7088 | 1 | 0.7098 | 1 | 0.6997 | 1 | 0.7097 | 1 |
| Tianjin | 0.4804 | 2 | 0.5095 | 2 | 0.5485 | 2 | 0.5475 | 2 | 0.5444 | 2 | 0.5593 | 2 |
| Shijiazhuang | 0.3672 | 3 | 0.3411 | 4 | 0.3639 | 3 | 0.3604 | 5 | 0.3755 | 3 | 0.4106 | 3 |
| Tangshan | 0.2979 | 6 | 0.3040 | 6 | 0.3355 | 5 | 0.3415 | 7 | 0.3513 | 5 | 0.3353 | 9 |
| Qinhuangdao | 0.2884 | 8 | 0.2933 | 8 | 0.2975 | 8 | 0.3898 | 3 | 0.2693 | 12 | 0.3801 | 4 |
| Handan | 0.3256 | 4 | 0.3566 | 3 | 0.3577 | 4 | 0.3642 | 4 | 0.3508 | 6 | 0.3513 | 7 |
| Xingtai | 0.2875 | 9 | 0.2500 | 12 | 0.2625 | 12 | 0.2792 | 11 | 0.3009 | 9 | 0.3234 | 10 |
| Baoding | 0.2690 | 10 | 0.2627 | 10 | 0.2718 | 11 | 0.2989 | 9 | 0.3131 | 8 | 0.3357 | 8 |
| Zhangjiakou | 0.2300 | 13 | 0.2218 | 13 | 0.2505 | 13 | 0.2459 | 13 | 0.2486 | 13 | 0.2716 | 13 |
| Chengde | 0.2688 | 11 | 0.2901 | 9 | 0.2845 | 9 | 0.2770 | 12 | 0.2941 | 11 | 0.3185 | 11 |
| Cangzhou | 0.3004 | 5 | 0.3031 | 7 | 0.3202 | 6 | 0.3422 | 6 | 0.3578 | 4 | 0.3637 | 5 |
| Langfang | 0.2903 | 7 | 0.3100 | 5 | 0.3041 | 7 | 0.3177 | 8 | 0.3277 | 7 | 0.3581 | 6 |
| Hengshui | 0.2507 | 12 | 0.2616 | 11 | 0.2807 | 10 | 0.2910 | 10 | 0.2978 | 10 | 0.3145 | 12 |
Note: a V represents the sustainable performance value of a city; b R represents the rank of a city.
Table 5.
The average sustainability development of cities with regard to different dimensions.
| City | Overall Sustainability a | Economic Sustainability | Social Sustainability | Environmental Sustainability | |||||||
|---|---|---|---|---|---|---|---|---|---|---|---|
| V | R | V | R | G b | V | R | G | V | R | G | |
| Beijing | 0.6806 | 1 | 0.7091 | 1 | 6.98% | 0.5695 | 1 | −1.35% | 0.7811 | 1 | 3.24% |
| Tianjin | 0.5316 | 2 | 0.5087 | 2 | 8.83% | 0.4576 | 2 | 0.81% | 0.6518 | 2 | 0.54% |
| Shijiazhuang | 0.3698 | 3 | 0.2124 | 3 | 6.93% | 0.4229 | 3 | −3.23% | 0.5047 | 7 | 7.39% |
| Tangshan | 0.3276 | 6 | 0.2096 | 4 | 5.38% | 0.3388 | 8 | 0.73% | 0.4639 | 10 | 2.44% |
| Qinhuangdao | 0.3198 | 7 | 0.1982 | 5 | 6.86% | 0.3552 | 7 | 4.27% | 0.4309 | 12 | 8.29% |
| Handan | 0.3510 | 4 | 0.1123 | 9 | 4.98% | 0.4192 | 4 | −2.53% | 0.5710 | 3 | 4.87% |
| Xingtai | 0.2839 | 11 | 0.0821 | 13 | 13.92% | 0.3606 | 5 | −3.77% | 0.4463 | 11 | 8.77% |
| Baoding | 0.2919 | 9 | 0.1064 | 10 | 8.66% | 0.3236 | 9 | 0.56% | 0.4889 | 9 | 8.04% |
| Zhangjiakou | 0.2447 | 13 | 0.1232 | 8 | 4.44% | 0.2431 | 13 | −4.00% | 0.4014 | 13 | 11.09% |
| Chengde | 0.2888 | 10 | 0.1002 | 11 | 7.33% | 0.3164 | 10 | 3.77% | 0.4949 | 8 | 2.72% |
| Cangzhou | 0.3312 | 5 | 0.1439 | 7 | 5.93% | 0.3605 | 6 | 2.82% | 0.5337 | 6 | 4.91% |
| Langfang | 0.3180 | 8 | 0.1708 | 6 | 21.09% | 0.2900 | 11 | −2.21% | 0.5396 | 4 | 5.38% |
| Hengshui | 0.2827 | 12 | 0.0972 | 12 | 15.57% | 0.2701 | 12 | −2.97% | 0.5342 | 5 | 10.02% |
Note: a Overall sustainability represents the sustainability across the three dimensions; b G represents the average growth rate of sustainable performance of a city from the year 2011 to 2016; the average growth rates of overall sustainability of the cities are shown in Figure 3.
© 2019 by the authors. Licensee MDPI, Basel, Switzerland. This article is an open access article distributed under the terms and conditions of the Creative Commons Attribution (CC BY) license (http://creativecommons.org/licenses/by/4.0/).
Share and Cite
MDPI and ACS Style
Yi, P.; Li, W.; Zhang, D. Assessment of City Sustainability Using MCDM with Interdependent Criteria Weight. Sustainability 2019, 11, 1632. https://doi.org/10.3390/su11061632
AMA Style
Yi P, Li W, Zhang D. Assessment of City Sustainability Using MCDM with Interdependent Criteria Weight. Sustainability. 2019; 11(6):1632. https://doi.org/10.3390/su11061632
Chicago/Turabian StyleYi, Pingtao, Weiwei Li, and Danning Zhang. 2019. "Assessment of City Sustainability Using MCDM with Interdependent Criteria Weight" Sustainability 11, no. 6: 1632. https://doi.org/10.3390/su11061632
Note that from the first issue of 2016, this journal uses article numbers instead of page numbers. See further details here.