Article

Assessing the Livelihood Vulnerability of Rural Indigenous Households to Climate Changes in Central Nepal, Himalaya

1
National Centre for Borderland Ethnic Studies in Southwest China, Yunnan University, Kunming 650091, China
2
Centre for Mountain Futures, Kunming Institute of Botany, Kunming 650201, Yunnan, China
3
East and Central Asia Regional Office, World Agroforestry Centre (ICRAF), Kunming 650201, China
4
Faculty of Environment and Natural Resources, Freiburg University, Tennenbacherstr. 4, 79106 Freiburg, Germany
5
Institute of Economics, Yunnan Academy of Social Sciences, Kunming 650034, China
*
Authors to whom correspondence should be addressed.
Authors contributing equally.
Sustainability 2019, 11(10), 2977; https://doi.org/10.3390/su11102977
Submission received: 19 March 2019 / Revised: 7 May 2019 / Accepted: 16 May 2019 / Published: 24 May 2019

Abstract

:
Climate change and related hazards affect the livelihoods of people and their vulnerability to shocks and stresses. Though research on the linkages between a changing climate and vulnerability has been increasing, only a few studies have examined the caste/ethnicity and gender dimensions of livelihood vulnerability. In this study, we attempt to explore how cultural and gender-related aspects influence livelihood vulnerability in indigenous farming mountain communities of the Nepal Himalaya in the context of climate change. We applied the Livelihood Vulnerability Index (LVI) to estimate household (social group and gender-based) vulnerability in farming communities in the Melamchi River Valley, Nepal. The results identified female-headed families, and those belonging to disadvantaged social groups as more vulnerable and in need of being preferentially targeted by policy measures. Higher exposure to climatic extremes and related hazards, dependency on natural resources, lack of financial assets, and weak social networking were identified as components that determine overall vulnerability. The study also visualizes complex adaptation pathways and analyzes the influence of gender and ethnicity on the capacities of households and communities to adapt to climate change.

Graphical Abstract

1. Introduction

Climate change and its impacts on livelihood have become areas of prime concern in the scientific and political community [1]. The impacts of climate change are predicted to have severe consequences for societies and economies [2]. Current climate shocks and stresses already have an overwhelming impact on the vulnerability of households, particularly in rural communities [3,4,5]. Vulnerability is understood to be the result of the interaction between the biophysical drivers (include climatic exposure) and the function of the system’s sensitivity and adaptive capacity [4]. Frequency and intensity of weather-related extremes and gradual changes in the average temperature are expected to exacerbate vulnerability and are more prominent in mountainous regions [5,6]. In addition to exposure to climate extremes and gradual changes in climatic conditions, a combination of social, economic, and environmental factors is responsible for the vulnerability of rural households [7,8]. Inaccessibility, marginality, and fragility are constraints specific to mountains and contribute to the vulnerability of mountain communities. Climate change poses environmental, social, and economic challenges especially for indigenous rural communities in mountains because of their high dependency on climate-sensitive natural resources [9,10] and because lack of resources limits their ability to cope with and adapt to stresses of all kinds.
Little attention has so far been given to mountainous areas of the Himalayan region regarding how climate change and related hazards impact on marginalized community livelihoods [3,11,12] and with respect to the challenges faced specifically by ethnic minority groups [8,13]. Social hierarchies as well as geographic location, e.g. upstream, downstream, and access to resources are some key factors that determine the marginalization of social groups in the Himalayas [14,15,16]. Such marginalized social groups, including women, are particularly vulnerable and bear a disproportionate share of the costs of disasters [17]. Women are included in the marginalized groups mainly due to low literacy and cultural bias [17,18]. In general, the male is the household head in this region. However, in the absence of an adult male, women are often the breadwinners. Results from other studies have shown that women of female-headed households often face gender-based discrimination [19]. Their capacity to adapt to the changes is limited by socio-cultural, demographic, and policy trends. Therefore, adaptation planning at the community level has to take into account the differential vulnerabilities of men and women and leverage existing adaptive capacity [12]. There has, so far, been limited research on the relationship between changing climate and, livelihood vulnerability with a focus on, caste/ethnicity (based on households) and gender dimensions (male-headed and female-headed households) [7]. This study aims to fill this gap via a case study from Nepal.
Disciplines such as anthropology, geography, sociology, disaster management, climate science, and sustainable livelihood research provide the foundation for approaches to the study of vulnerability [20,21,22]. Hahn et al. [23] suggested examining climate change vulnerability at the community level to understand and compare the vulnerability of communities within a locality or region. Different vulnerability indexes have been developed and applied to assess changing climate vulnerability [4,24]. While examining the livelihood vulnerability of marginalized communities and households to climate change and climate variability in specific localities is important as a first step, a practical approach to designing and directing programs to minimizing vulnerability is also an urgent need. A contextualized index of livelihood vulnerability needs to be developed given the complexity of ethnicity and gender issues.
In this paper, we aim to enhance the understanding of the vulnerability of individual households by combining the livelihood vulnerability Index developed by Hahn et al. [23] and Islam et al. [25]. This combination helps to take into consideration the complexity of ethnicity and gender issues in the Himalayan region. We assess livelihood vulnerability to climate change in four ways. First, we incorporate indigenous knowledge of the local community into the selection of indicators. Communities’ adaptations are determined by local perceptions, observations, and experiences of climate change and related hazards [3,12]. Integrating local and indigenous knowledge can advise more effective decision-making, planning, and management in the Himalayan region susceptible to changing climate. Second, the study examines how ethnicity and gender influence livelihood vulnerability to climate change and related hazards. Third, the study used original empirical data for an assessment of the Livelihood Vulnerability Index (LVI). Only very few studies on climate change vulnerability have collected some form of primary empirical data. On the contrary, most were built on secondary data from various sources [4,24]. This study assesses the LVI based on observations in the field to provide insight for informing local climate change adaptation and mitigation planning. Lastly, by identifying key points of intersection between ethnicity, gender, and vulnerability, this study contributes to designing appropriate climate change adaptation activities in international research and development initiatives.

2. Materials and Methods
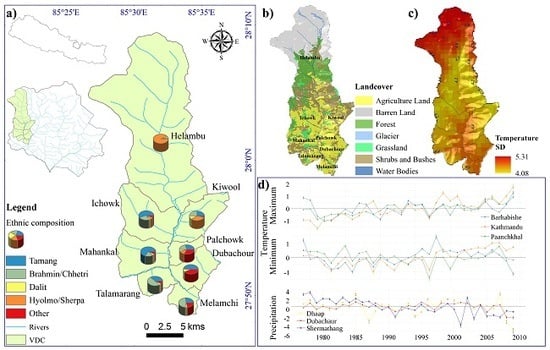
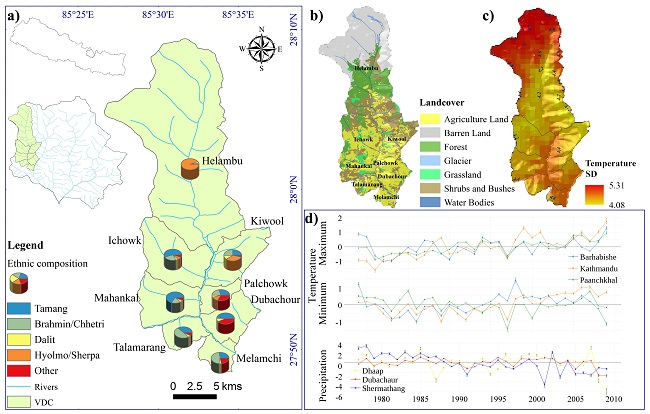
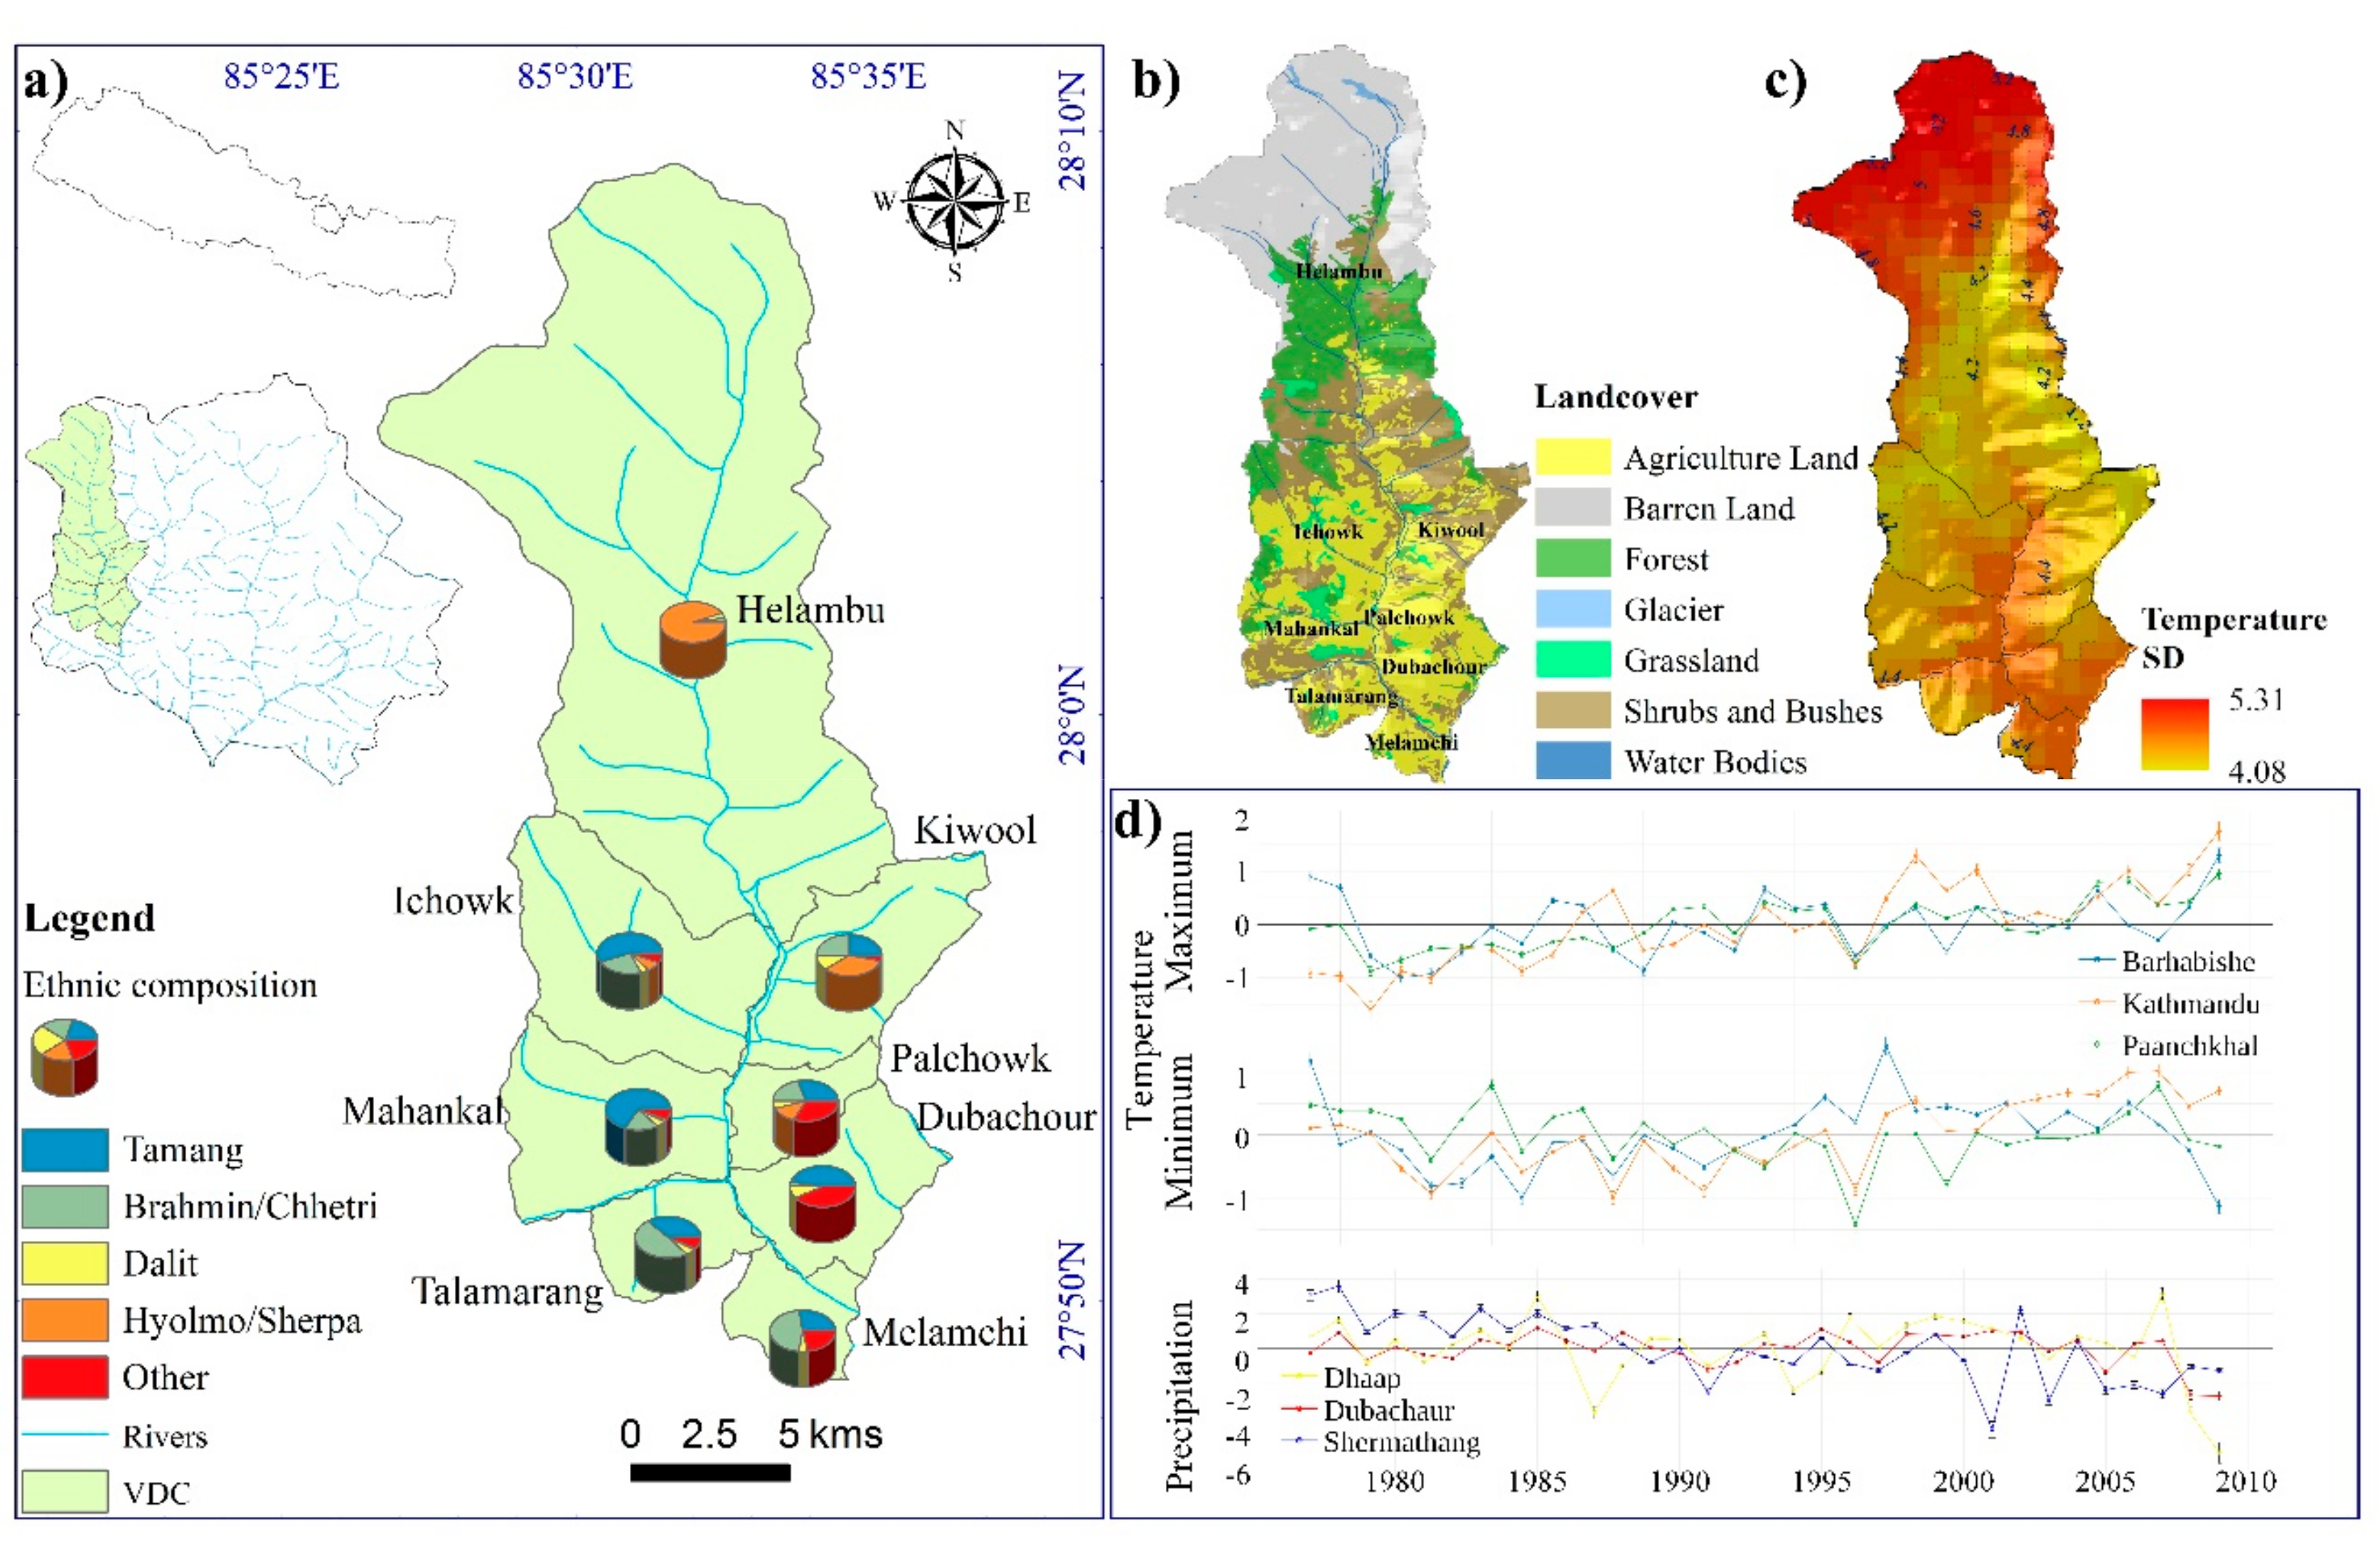
2.1. Study Area

This study was conducted in rural households of eight Village Development Committees (VDCs) out of 14 VDCs in the Melamchi River Valley (Figure 1). A VDC is the lowest administrative unit in Nepal. The Melamchi River Valley is located in the upstream part of the Indrawati River Basin in western Sindhupalchok, which is one of the most vulnerable districts in Nepal in terms of rainfall and temperature sensitivity [26].
Geographically, the valley can be divided into three parts: upland, middle hills, and lowland, where the major (30%) land cover is farmland (Figure 1b). The people who live in these geographic areas belong to different social groups (Table 1). The social group composition of the study area is also shown in Figure 1a. Baseline scenario (1950–2000) of the Worldclim dataset shows that the standard deviation of temperature was higher in the agricultural land (Figure 1c). Temperature data from the meteorological stations close to the study area revealed a rising temperature within the last three decades (Figure 1d). Similarly, erratic precipitation has been recorded in Dhaap, Dubachour, and Shermathang hydro-meteorological stations in the study area (Figure 1d).
A caste system is the hierarchical division of Hindu society into occupational groups, with Brahmins at the “top” and the “untouchables” (known as “Dalit”) at the “bottom” of this social class system [27]. We refer in this paper to castes/ethnic groups collectively as social groups. While the country is heading toward implementation of a new constituency, which recognizes people from every caste or ethnic group as equal, the impact of the existing system cannot be eliminated at once. It is still reflected in the livelihoods of different social groups particularly regarding access to resources, benefit sharing, and financial condition. However, it is important to point out that while, in the older literature, there was an emphasis on caste/ethnic group affiliation as a determining factor for economic wellbeing or poverty, recent studies point toward differences in economic status with social groups that can be due to a variety of factors including geographical remoteness or availability of family labor [28].
Hyolmo people are indigenous people living in the upland part of the valley, who are traditionally herders and traders. The Hyolmo people later diversified their occupations with tourism and wage labor, both domestic and abroad. The Hyolmo population (representing 0.089% of the total population in Nepal) has been recognized as an official minor ethnic group recently [29]. The Tamang constitute the major ethnic group in the study area representing nearly 39% of the Melamchi valley’s population [30]. The Tamang people were the first settlers of the region, and their settlements are well distributed in all 14 VDCs in the Melamchi River Valley. Most of the Tamang villages are located in the middle hills of the study area. Both Hyolmo and Tamang have been categorized as marginalized indigenous nationalities [31]. The detail ethnography of these two major indigenous groups is presented in Appendix A. The lowland of the Melamchi Valley is the dwelling place of Brahmin/Chhetri and Dalit. Furthermore, there are other social groups spread in the lowland and middle hills of Melamchi Valley, which include the Newar, Gurung, Magar, Danuwar, Majhi, Sanyasi, and Bhujel [32].

2.2. Data Collection

This study is based on primary data collected between February and July 2013 in surveys of 365 local households using a pre-tested, semi-structured questionnaire. Altogether 24 (three in each VDC) pretest surveys were done in order to assess the clarity of the questionnaire, suitability for participants, and to calculate the time needed for each interview, and to assess possible obstacles that could arise during the survey. Based on the pretest survey, the questionnaire was finalized. The finalized questionnaire consisted of three sections: exposure, sensitivity, and adaptive capacity as well as nine livelihood components. Interviews were conducted with the household head by trained field staff with the respective household head in Nepalese language. Community leaders were consulted to explain the purpose of the study and obtain permission to visit households. Households were selected randomly, and the sample size for the household survey was computed according to a formula with a 5% margin of error (95% of confidence level) and 50% of response distribution. Respondent households were identified through a multi-stage sampling approach. At the first stage, clusters were made according to a geographical location. At the second stage, samples were chosen through stratified random sampling. At the third stage, households were selected using the left-hand and right-hand rule. If a household was found to be unoccupied, s/he skipped that household and moved to the next closest household. The interviewers returned to any empty households to see if the habitants had returned and would agree to be interviewed. If the household was still empty when the interviewer returned, then they went back to the last household they interviewed and resumed interviewing at the next house on the original path. Verbal consent was obtained from each head of the household. Unwilling respondents were not interviewed.
Historical changes in temperature and precipitation, as well as extreme climate events, were taken as indicators of exposure. The monthly average precipitation data (1979–2009) from three stations (Shermathang, Dhaap, and Dubachour) were used for upland, middle hills, and lowland, respectively. The standard deviation of monthly average precipitation data was fitted into the current analysis. As temperature data was not available from these stations, we used ‘temperature seasonality’ from the Worldclim dataset (http://www.worldclim.org/), which is a grid-based raster data of 1-km resolution (Figure 1c). It is the amount of temperature variation over a given year, based on the standard deviation of the monthly temperature average.

2.3. Vulnerability Analysis

The IPCC Third Assessment Report (2007) mentions that climate change vulnerability is a function of exposure, sensitivity, and adaptive capacity [9,33]. The vulnerability is a positive function of the system’s exposure and sensitivity, and a negative function of the system’s adaptive capacity [19,34]. Exposure is the nature and degree to which a system is exposed to a significant change in climate. Sensitivity is the degree to which a system is affected, either adversely or beneficially by climate-related stimuli. Adaptive capacity is the ability of a system to adjust to climate variation and extremes to prevent potential damage or to cope with its consequences [9,33,35].
We used LVI and LVI-IPCC indices developed by Hahn et al. [23] to assess the risks derived from climate variability. Some modifications have been made to adapt their method to fit our specific case study. To that end, we added two more major LVI components (finances together with knowledge and communication) to the existing seven that were developed by Hahn et al. [23]. Financial assets—the first additional component—play a crucial role in determining livelihood options and strategies available to the people [36,37,38,39]. Households’ annual expenditure, annual savings, and ownership of livestock (Cows, goats, poultry, etc.) and cash crop growing by households are taken as indicators of financial assets. We assume that households with less financial assets are more vulnerable to climate change.
The second LVI component that we added including access to information on climate change and related hazards, increases the adaptive capacity of local people [40,41]. In addition, education of household heads enhances better understanding of climate-related hazards. Increased access to information on climate change enables a household in planning proactive adaptation measures against climate risks [42,43]. Each of the components is comprised of several indicators or sub-components. The indicators were developed based on a review of the relevant literature and consultation with experts. The sub-components of each major component of the LVI are listed in Table 2.
The LVI uses a weighted-average approach [23,44,45], where each sub-component contributes equally to the overall index even though each major component comprises a variable number of sub-components. Because each of the sub-components was measured on a different scale, they were standardized as an index using Equation (1).
  I n d e x s g = S g S m i n S m a x S m i n ,
where Sg is the original sub-component of the studied group g, and Smin and Smax are the minimum and maximum values, respectively, for each sub-component in all studied groups. These minimum and maximum values were used to transform this indicator into a standardized index. For variables that were measured in frequencies such as the “percent of households reporting conflicts over water resources in their social group,” the minimum value was set at 0 and the maximum at 100. Some sub-factors—such as the “crop diversity index”—were created because of an increase in the crude indicator, and, in this instance, the number of livelihood activities undertaken by a household was assumed to decrease with exposure. In other words, we assumed that households growing more than one crop have more adaptive capacity than the households growing only one crop. Using the inverse of the crude indicator, we created a number that assigns higher values to households with a lower number of livelihood activities. The maximum and minimum values were also transformed following this logic, and the equation above was applied to standardize these sub-elements. After each element was standardized, the sub-components were averaged using Equation (2) to calculate the value of each major component.
M g = i = 1 n S g i n ,
where Me = one of the nine major components of the studied group g (Socio -Demographic Profile (SDP), Livelihood Strategies (LS), Social Networks (SN), Knowledge and Communication (KC), Finance (FN), Health (H), Food (F), Water (W), or Natural Disasters and Climate Variability (NDCV)). Index Sgi represents the sub-components, indexed by Mg, that make up each major component, and n is the number of sub-components in each major component. Once values for each of the nine major components were calculated, they were averaged using Equation (3), to obtain the LVI for each group.
L V I g   = i = 1 9 W M i M e i i = 1 9 W M i ,
This can also be expressed as Equation (4).
L V I g   =   W S D P S D P g + W S N S N g + W L S L S g + W K C K C g + W F N F N g + W H H g + W F F g + W w W g + W N D C V N D C V g W S D P + W S N + W L S + W K C + W F N + W H + W F + W W + W N D C V ,
where LVIg is the Livelihood Vulnerability Index for the studied group, which equals the weighted average of the nine major components. The weights of each major component, WMi, is the number of sub-components that make up each major component, and are included to ensure that all sub-components contribute equally to the overall LVI [45]. In this study, the LVI was scaled from 0 (least vulnerable) to 1 (highly vulnerable). For explanatory purposes, step-wise calculation of the food major component for the LVI for Dalit is presented in Appendix B (Table A1).

2.4. IPCC Framework for Calculating LVI

LVI-IPCC incorporated the IPCC vulnerability definition, where we classify the nine major components under the three categories of exposure, adaptive capacity, and sensitivity. In this approach, each major component comprises several sub-components or indicators, as in the standard LVI. Similarly, Equations (1)–(3) were applied to calculate the LVI–IPCC. Instead of one weighted average, as in the standard LVI approach, we used three weighted averages of the major sub-elements, computed according to the three contributing factors. The index of exposure (Exp) contains natural disaster and climatic variability (Equation (5)), sensitivity (Sen) containing health, food, and water (Equation (6)), and adaptive capacity (Adp. Cap) containing the socio-demographic profile, livelihood strategies, social network, knowledge, communication, and finance (Equation (7)), which has been calculated as follows.
  E x p g = W e 1 N D + W e 2 C V W e 1 + W e 2 ,
We1 and We2 are the weight for natural disasters and climatic variability, respectively, and equal to the number of sub-components. We assumed that the higher the rate of change of the climate variables and the higher the frequency of natural disasters, the higher will be the exposure of households to a changing climate and extremes.
S e n g = W s 1 H + W s 2 F + W s 3 W W s 1 + W s 2 + W s 3 ,
where Ws1, Ws2, and Ws3 are the weights for health, food, and water, respectively.
A d p . c a p g = W a 1 S D P + W a 2 L S + W a 3 S N + W a 4 K S + W a 5 F N W a 1 + W a 2 + W a 3 + W a 4 + W a 5 ,
where Wa1, Wa2, Wa3, Wa4, and Wa5 are the weights for the socio-demographic profile, livelihood strategies and social networks, knowledge, communication, and finance, respectively.
The three contributing factors were combined using Equation (8) to calculate the LVI-IPCC.
L V I I P C C g = E x p g A d p . c a p g S e n g ,
where LVI–IPCCg is the LVI for the studied group, which uses the IPCC vulnerability framework. Exp is the exposure score (equivalent to the Natural Disaster and Climate Variability), Adp.cap is the adaptive capacity score (weighted average of the socio-demographic, livelihood strategies, social networks, knowledge, communication, and finance), and Sen is the sensitivity score (weighted average of the heath, food, and water). The LVI–IPCC was scaled from 0 (least vulnerable) to 1 (most vulnerable). For explanatory purposes, a detailed step-wise calculation of the contributing factors of the LVI–IPCC for Dalit is presented in Appendix B (Table A2).

3. Results

Overall, we found financial assets, and natural disaster and climate variability to be the most important components affecting livelihood vulnerability of the social group, which is followed by the components of livelihood strategies. The former two components had the highest vulnerability score of the nine components used to calculate LVI while the remaining components contributed to identifying the vulnerability score among different social groups (Table 2 and Table 3).

3.1. Social Group: LVI

Our analysis revealed Dalit (0.50) as the most vulnerable group, which is followed by Tamang (0.48). Major contributing factors in determining the vulnerability of Dalit were health, food, water, natural disaster, and climate variability (see standardized values of each sub-component in Table 2 and detailed calculation in Appendix B, Table A1). Summing them up, the sub-components result in a higher score for the health index for Dalit than for others (Table 2). Dalit reported that food production is sufficient for five to six months only. The small size of land, high dependence on rain-fed cultivation, lack of access to new technologies, and lack of water security were listed as factors causing insufficient food production. About 77% of Dalit respondents reported conflicts over water use in their village and claimed that drinking water supply is sufficient for only nine and a half months. In addition to conflicts over water, climate-related hazards such as drought, erratic rainfall, hailstorms, and new crop pests emerging as a result of warmer temperatures were identified as important causes of low agricultural production. In addition, 100% of Dalit reported impacts on their livelihood due to climate variability and climate-related hazards like drought, crop pest, and hailstorm (Table 2).
Rice planting usually starts in May and June before the first rainfall. However, in drought years, farmers opt for delayed plantation, which leads to declining yield. Respondents also reported landslides, flood, and strong winds damaging their houses and farmland. Generally, the houses and farmlands of Dalit are located close to hazard zones (landslide and flood-prone areas), which makes them more vulnerable than those of other social groups.
Tamang were vulnerable regarding livelihood strategies due to a higher proportion (64%) of household members working in other communities, leaving women, elderly people, and children behind to handle the crises. This also relates to higher dependency on agriculture and livestock as an income source. The results also show that about 55% of households did not have membership in any social organization and that 64% of them reported poor relations with the local government and difficulties in making themselves heard.
Hyolmo people were found vulnerable in terms of socio-demographic parameters and finance. The remaining social groups, which are both smaller and more scattered, were found vulnerable in terms of information access. Conversely, the Brahmin/Chhetri group was the least vulnerable of all social groups (Table 2). Brahmin/Chhetri grow cash crops like coffee and cardamom on their farmland and earn cash income, which strengthens their financial assets. However, such crop diversification practice is not common among Dalit, Tamang, Hyolmo, and the remaining groups.

3.2. Gender: LVI

Comparison of female and male-head household-differentiated livelihood vulnerability (Table 3) showed that female-headed households (n = 37) were more vulnerable than male-headed households (n = 328). Table 3 shows that, in terms of natural hazards and climate variability, communication and knowledge, water, and health, female-headed households were highly vulnerable compared to male-headed households.
The result shows limited access of female-headed households to communication and proper information about climate-related hazards, as well as to membership in local organizations. About 68% of female-headed households reported conflict over water use in their communities. In general, they have less access to water resources for irrigation than male-headed households. All female-headed households reported that they use water directly from springs without any treatment even during the rainy season since they cannot afford the time and cost. Moreover, at the time when our study was conducted, about 60% of female-headed households did not have a toilet, which lowers their health index as compared to male-headed households.
However, in terms of socio-demographic profile, livelihood strategies, social network, finance, and food, the difference between female-headed and male-headed households was small. Female-headed households were still more vulnerable. About 57% of female-headed households are solely dependent on climate-sensitive agriculture for their livelihood, compared to 44% of male-headed households. Females are, in general, not involved in non-agriculture-based livelihood activities such as tourism, construction, and seasonal migration for work. Moreover, only 40% of female-headed households had membership in community-based or other social organizations during the survey period. All these factors contribute to a higher vulnerability of female-headed households.

3.3. Social Group: LVI-IPCC

The LVI-IPCC model showed that Dalit people were more sensitive to climate variables and were, thus, highly vulnerable (see Table 4 and a detailed calculation in Appendix B). Geographical location of the household from a hazard zone and economic opportunity were major factors increasing exposure and adaptive capacity of social groups within the community. Our results show that the adaptive capacity of Dalit and Tamang is lower, which indicates higher vulnerability. Dalit were found to be more exposed and sensitive than other groups. Although the adaptive capacity of Tamang was low, lower sensitivity and exposure made them less vulnerable than Dalit. The lowest level of exposure, sensitivity, and high adaptive capacity made Brahmin/Chhetri the least vulnerable of all social groups.

3.4. Gender: LVI-IPCC

Gender-based analysis using the LVI-IPCC model shows that female-headed households were more exposed (+0.18) and more sensitive (+0.06) than male-headed households (Table 4) while male-headed households showed a higher adaptive capacity (+0.04) than female-headed households.

4. Discussion

We used primary data obtained from the household survey to assess the livelihood vulnerability approaches, i.e., LVI and LVI-IPCC of a rural indigenous community. This avoids the dependency on secondary data and climate models, which fail to capture the impacts at the local community level. LVI identifies the important component(s) and nested sub-components, which are the most important drivers of vulnerability in the studied community, whereas LVI-IPCC identifies adaptive capacity, sensitivity, or exposure of the studied community, which could be useful for developing planning for the reduction of livelihood vulnerability to changing climate and related hazards. In addition, for adaptation and mitigation planning at the community level, livelihood components that are capable of leveraging existing adaptive capacity and sensitivity should be considered. Therefore, calculating both indexes concurrently has been found useful. In addition, vulnerability is assessed through specific indicators that we found suitable for the studied communities. Such indicators highlight a person’s, a group’s, or a system’s sensitivity to certain risks [46]. A comparative analysis based on the two approaches validates their results since both approaches identify the Dalit and female-headed households as the most vulnerable groups followed by Tamang. Although both approaches indicate similar results, they complement each other in the following ways.
Although the vulnerability index construction process was robust, there are some limitations regarding the estimates of the effects of changing climate in mountain systems. These are due to uncertainties associated with inaccuracies in describing dynamic systems of climate and community change, as well as data (e.g., climatic) unavailability, especially in developing countries [47]. The use of an equal-weighing scheme has been pointed out as another important limitation of this approach [48]. Since not all components are equally important for different communities, weighting would be applied more appropriately in research on a regional scale. In addition, our research calculated LVI with reference to past climatic conditions while not considering future projections.
The result shows that the livelihood strategy is one of the major contributors to the vulnerability index. A similar finding was reported by Hahn et al. [23], where the study was conducted in Mozambique. Approaches toward more diverse or more sustainable livelihoods are emphasized in a sub-component of this component. Our results indicate that social groups engaged in more than one income generating activity, are relatively less vulnerable.
Vulnerable social groups have less access to social organizations and community-based institutions than less vulnerable groups [49]. Similar research elsewhere has shown that involvement in a social organization enhances adaptive capacity [50]. In our study, this applies especially to the Tamang, whose limited involvement in local institutions and organizations and lack of political participation is a cause of their low adaptive capacity.
Financial assets that can be easily converted into other assets play a crucial role in determining livelihood options and the adaptive capacity to a changing climate [51,52]. Hyolmo people were the most vulnerable group in terms of financial assets, followed by the Dalit. However, about 50% of the Hyolmo households from Helambu and other VDCs were not available for an interview during our household survey because of their seasonal migrations. We learned from interviewed Hyolmo respondents that the migrated Hyolmo are engaged in different income-generating activities especially with regard to tourism, trekking, and hotel business rather than other cities and they are economically strong enough. We were, therefore, able to interview the subsistence-based households who are economically weaker than the migrating households. Because of this distortion and referring to the work of Graner [53], we conclude that Dalit people who must live on insufficient wages are the most vulnerable group in terms of finance. They borrow money from a money lender to fulfill their subsistence needs at high interest rather than for productive investment. Dalit often lack fixed assess as collateral in order to obtain a loan from formal banks, co-operatives, and finance. Therefore, the vulnerability of Dalit households is enhanced by borrowing money and incurring high amounts of interest.
Dalit and Tamang are the most vulnerable groups regarding health and access to health services, which is an important indicator of livelihood vulnerability [52]. A rising temperature has made the area suitable for mosquitos and lengthened the season for flies (field survey 2013). An increase in the number of disease vectors and widespread open defecation in Tamang and Dalit settlements were identified during our survey as important causes of poor health and high sensitivity. Until the date of the survey, there was no toilet in every household in the surveyed community.
Food security, which refers to the time period during which food is available from a farmer’s own farm production, also affects livelihood vulnerability scores [52]. Graner [54] found Dalit are the most vulnerable group with respect to food security, which is still true after about three decades, as shown in our results. This is because they do not own enough land (4.07 ropanies = 0.20 hectares) to produce sufficient food for their family. None of the Dalit households in the study area own irrigated land, which would increase their adaptation capacity by increasing crop yields and crop varieties [55].
Though water plays a subordinate role in the overall livelihood vulnerability determination, distribution of water among the households still affects household sensitivity. Dalit households reported water conflicts and usually have less water sufficiency for months than other ethnic groups. Folmar [56] mentions that Dalit households in some hill districts of Nepal are the first to be cut off from the water supply during water shortages. Similarly, Tiwary and Phansalkar [57], also reported the Dalit community faces multiple deprivations and discriminations in the community with regard to access to different natural resources, especially the community water resource.
Crop pests and drought were found to be major climate-related hazards that impact livelihoods in terms of crop production, water availability for irrigation systems, and household activities. These hazards were reported to have occurred frequently since the last decade. Other hazards such as landslides and floods damage infrastructure, mainly roads, during the monsoon period. The aggregate exposure value for Dalit was higher due to a higher percentage of Dalit households reporting changing climate hazards over the past 20 years [58]. This was also mentioned in their report where minorities like the Dalit community tend to live in the more marginal areas and exposed areas, which is seeing a more changing climate and is more susceptible to climate impact.
Due to the different roles played in household livelihoods, men and women experience and respond to the impacts of changing climate differently [59]. Men often migrate in search of alternative work, while women are left behind to face the crisis, as indicated by the increasing number of female-headed households in the study area [29]. Evidence suggests that female-headed households were more vulnerable than male-headed households. According to Tenge et al. [60], female-headed households are less likely to adopt technologies because female heads have less access to information and other resources due to traditional barriers. This has also been confirmed by our study. Our finding that female-headed households in the study area have less access to physical, social, financial, political, and natural assets is in accordance with previous gender studies [61,62]. There is limited ownership and lack of access to cultivated land among female-headed households. In addition, female-headed households own about 48% less cultivated land than male-headed households, which prevents women from growing a greater variety of staple and cash crops [4].
The Melamchi Valley is generally well endowed with water resources mostly from springs and streams. In spite of this, the respondents from some social groups, especially those from Dalit communities, reported conflicts over water resources, which, according to their assessment, are due to poor management rather than physical scarcity of water. Effective water governance can increase water security through irrigation, and improve livelihoods through water-based income generating opportunities such as fish culture. Moreover, participation in water governance can strengthen the social network among the vulnerable groups. Improvement of these components can improve the financial status of vulnerable groups and reduce livelihood vulnerability.
As indicated by the results, planting cash crops can provide an excellent opportunity for vulnerable groups to strengthen their financial status, provided they have access to markets [12]. Adaptation options such as irrigation management and promotion of cash crops are only viable if there is external institutional support. Therefore, local government and local institutions should support vulnerable groups in order to generate long-term strategies for improving adaptation capacity.

5. Conclusions and Policy Implication

This paper has tested the suitability of the livelihood and vulnerability index to understand the social group and female-headed and male-headed household-based dimension of local vulnerability to climate variability and social factors. We found the indicators that have been used are very important for calculating livelihood vulnerability and are suitable for mountainous regions. Therefore, these indicators can be very useful in the vulnerability assessment in other mountainous regions as well. The LVI and LVI-IPCC approach for a household vulnerability analysis structured around those indicators proved a powerful tool for understanding the diversity of vulnerability.
The overall vulnerability of the entire studied population is relatively similar across LVI components and LVI-IPCC criteria. While marginalized groups are relatively more vulnerable, none of the components revealed an extreme difference in the vulnerability score. The vulnerabilities related to the food, water use, and health are ranked lower than finance-related, climate-related, and hazard-related components. While food-related, water use-related, and health-related components contributed to increasing the gap between more vulnerable and less vulnerable groups, the later components play a more significant role in determining overall vulnerability in the study sites. Biophysical elements that determine exposure such as temperature and rainfall cannot be changed through policy. Financial assets, however, can be improved to strengthen the adaptive capacity of the community, and, ultimately, lower its vulnerability. Improving the adaptive capacity of marginalized groups through participatory approaches needs to be made a priority of adaptation policy. Livelihood Vulnerability Indices identified in the present research are a useful tool in adaptation planning for enhancing adaptive capacity and reducing sensitivity. The results are useful in developing interventions such as crop diversification and water-based income-generating opportunities. Changing climate and livelihood policies for improved well-being and resilient communities should take into consideration the major components responsible for vulnerability along with other environmental, socioeconomic, and demographic drivers.
The policy implication drawing from this research lies in two key aspects. First, we propose policy measures that aim to reduce the sensitivity of habitat conditions, improve the resilience of society, and enhance the stability of individuals in order to address livelihood problems. That required the external investment from the government to pay particular attention to marginalized groups. Second, it calls for international aid to help build local adaptive capacity in coping with climate change, given the fact that Nepal is a low-income country.

Author Contributions

Conceptualization, N.M.S. and J.X. Methodology, N.M.S. and S.R. Formal analysis, N.M.S. Writing—original draft preparation, N.M.S. Writing—review and editing, S.R., D.S.-V., Y.S., and J.H. All co-authors contributed to finalizing the manuscript.

Funding

The Building Effective Water Governance in the Asian Highlands (Project no. 107085-002) funded this research. Additionally, the National Natural Science Foundation of China (Project No. 41661144002), Ministry of Education of China (Project No. 16JJD850015), and the CGIAR Research Program on climate change (FTA-FP5) partially supported this research.

Acknowledgments

The first author would like to express sincere thanks to Sweta Bhattarai, Smriti Pokhrel, and Anusha Malla for assisting during the household survey.

Conflicts of Interest

The authors declare no conflict of interest.

Appendix A

Detailed ethnography of major social groups mentioned in the manuscript from the study site.
Hyolmo—The Hyolmo also called ‘Yolmo’ are an indigenous group living in the central part of Nepal Himalayas. In Nepal, 10,752 individuals representing Hyolmo are living in 11 districts of the country, according to the Nepal National Census of 2011 [63]. They are believed to have migrated from the Gyirong Valleys of southwestern Tibet about 300 years ago Clarke [64] and settled in the valleys of Helambu (about 99% of total Hyolmo population of Nepal) in the upland part of the Melamchi valley. This migration appears to have occurred slowly over multiple generations, rather than in one large migration event [32]. Intermarriages between the male Hyolmo and the local Tamang women in the region became common [64] after Hyolmo people settled in the upper part of the Melamchi valley.
Tamang—The Tamang are the largest ethnic group in Nepal belonging to the Tibeto-Burman language group that makes up 5.8% of the total population of Nepal [63]. They are mostly farmers planting corn, millet, wheat, barley, and potatoes. Rainfed agriculture and small land holdings cannot provide sufficient income. Therefore, they supplement their farming income with manual labor. Due to discrimination in the past, Tamang people, in general, remained poorly educated and the majority have been limited to working as farmers, portering in mountain trekking, and wage working in cities. They are mid-hill dwellers in Nepal and also in the Melamchi valley. The Tamang people were the first settlers of the region, and their settlements are well distributed in all 14 VDCs in the Melamchi Valley.
A caste system is the hierarchical division of the Hindu society into occupational groups, with Brahmins at the “top” and the “untouchables” (known as “Dalit”) at the “bottom” of this social class system [27]. There are several castes within these groups. According to the Nepal National Census of 2011 [63], Brahmin/Chhetri constitute about 12.6% Brahmin + 16.6% Chhetri and Dalit constitute 0.5% of the total population.

Appendix B

Table A1. Calculating the food major component for the LVI for Dalit people.
Sub-Components for Socio-Demographic Profile (SDP) Major ComponentSub-Component Values for DalitMax Sub-Component Value for Study PopulationMin Sub-Component Value for Study PopulationIndex Value for DalitSocio-Demographic Profile Major Component Value for Dalit
Dependency ratio of HHs (SDP1)0.66300.22
% of HHs head that did not attend school (SDP2)73.0810000.73
% of female-headed HHs (SDP3)7.6910000.080.30
Average age of HH heads (1/years) (SDP4)0.020.040.010.24
Average HH size (SDP5)6.272310.24
  • Step 1 (repeat for all sub-component indicators): i n d e x S D P 1 D a l i t =   0.66 0 3 0 ;
  • Step 2 (repeat for all major components): S D P D a l i t = i = 1 n S e i n = S D P 1 D a l i t + S P D 2 D a l i t + S P D 3 D a l i t + S P D 4 D a l i t + S P D 5 D a l i t 5 = 0.22 + 0.73 + 0.08 + 0.24 + 0.24 5 = 0.30 ;
  • Step 3 (repeat for all study caste/ethnic group): L V I D a l i t = i = 1 9 W M i M e i i = 1 9 W M i = 5 0.30 + 6 0.55 + 3 0.44 + 3 0.49 + 4 0.81 + 4 0.52 + 3 0.27 + 5 0.32 + 5 0.75 5 + 6 + 3 + 3 + 4 + 4 + 3 + 5 + 5 = 0.50 .
Table A2. Calculating LVI–IPCC for the Dalit population.
Contributing FactorsMajor Components for DalitMajor Component Values for DalitNumber of Components per Major ComponentContributing Factor ValuesLVI-IPCC for Dalit
Socio-demographic profile0.705
Livelihood strategies0.456
Adaptive capacitySocial networking0.6230.49
Knowledge and communication0.513
Finance0.194 0.10
Health0.524
SensitivityFood0.2730.37
Water0.325
ExposureNatural disasters and climate variability0.7550.75
  • Step 1 (calculate indexed sub-component indicators and major components):
  • Step 2 (repeat for all contributing factors: exposure, sensitivity, and adaptive capacity): A d p . c a p g = W a 1 S D P + W a 2 L S + W a 3 S N + W a 4 K S + W a 5 F N W a 1 + W a 2 + W a 3 + W a 4 + W a 5 = ( 5 ) ( 0.70 ) + ( 6 ) ( 0.45 ) + ( 3 ) 0.62 ) + ( 3 ) ( 0.51 ) + ( 4 ) ( 0.19 ) ( 5 + 6 + 3 + 3 + 4 ) = 0.50
  • Step 3 (repeat for all study areas): L V I I P C C D a l i t = E x p g A d p . c a p g S e n g = 0.75 0.49 0.37 = 0.10

References

  1. Dube, T.; Phiri, K. Rural livelihoods under stress: The impact of climate change on livelihoods in south western Zimbabwe. AIJCR 2013, 3, 11–25. [Google Scholar]
  2. Ajani, E.N.; Mgbenka, R.N.; Okeke, M.N. Use of indigenous knowledge as a strategy for climate change Adaptation among Farmers in sub-Saharan Africa: Implications for policy. Asian J. Agric. Ext. Econ. Sociol. 2013, 2, 23–40. [Google Scholar] [CrossRef] [PubMed]
  3. Manandhar, S.; Vogt, D.S.; Perret, S.R.; Kazama, F. Adapting cropping systems to climate change in Nepal: A cross-regional study of farmers’ perception and practices. Reg. Environ. Chang. 2011, 11, 335–348. [Google Scholar] [CrossRef]
  4. Shah, K.U.; Dulal, H.B.; Johnson, C.; Baptiste, A. Understanding livelihood vulnerability to climate change: Applying the livelihood vulnerability index in Trinidad and Tobago. Geoforum 2013, 47, 125–137. [Google Scholar] [CrossRef]
  5. Sujakhu, N.M.; Ranjitkar, S.; Niraula, R.R.; Salim, M.A.; Nizami, A.; Schmidt-Vogt, D.; Xu, J. Determinants of livelihood vulnerability in farming communities in two sites in the Asian Highlands. Water Int. 2018, 43, 165–182. [Google Scholar] [CrossRef] [Green Version]
  6. Xu, J.; Grumbine, R.E.; Shrestha, A.; Eriksson, M.; Yang, X.; Wang, Y.; Wilkes, A. The melting Himalayas: Cascading effects of climate change on water, biodiversity, and livelihoods. Conserv. Biol. 2009, 23, 520–530. [Google Scholar] [CrossRef]
  7. Nelson, V. Gender, Generations, Social Protection and Climate Change: A Thematic Review; Overseas Development Institute, ODI: London, UK, 2011; p. 171. [Google Scholar]
  8. Goodrich, C.G.; Mehta, M.; Bisht, S. Status of Gender, Vulnerabilities and Adaptation to Climate Change in the Hindu Kush Himalayan: Impacts and Implications for Livelihoods, and Sustainable Mountain Development; Integrated Centre for Mountain Development (ICIMOD): Kathmandu, Nepal, 2017. [Google Scholar]
  9. Paavola, J. Livelihoods, vulnerability and adaptation to climate change in Morogoro, Tanzania. Environ. Sci. Policy 2008, 11, 642–654. [Google Scholar] [CrossRef]
  10. Morton, J.F. The impact of climate change on smallholder and subsistence agriculture. Proc. Natl. Acad. Sci. USA 2007, 104, 19680–19685. [Google Scholar] [CrossRef] [PubMed] [Green Version]
  11. Chaudhary, P.; Bawa, K.S. Local perceptions of climate change validated by scientific evidence in the Himalayas. Biol. Lett. 2011, 7, 767–770. [Google Scholar] [Green Version]
  12. Sujakhu, N.M.; Ranjitkar, S.; Niraula, R.R.; Pokharel, B.K.; Schmidt-Vogt, D.; Xu, J. Farmers’ perceptions of and adaptations to changing climate in the Melamchi Valley of Nepal. Mt. Res. Dev. 2016, 36, 15–30. [Google Scholar] [CrossRef]
  13. Hung, L.S.; Wang, C.; Yarnal, B. Vulnerability of families and households to natural hazards: A case study of storm surge flooding in Sarasota County, Florida. Appl. Geogr. 2016, 76, 184–197. [Google Scholar] [CrossRef]
  14. Sheth, D. Caste, Ethnicity and Exclusion in South Asia: The Role of Affirmative Action Policies in Building Inclusive Societies Contents, Human Development Report Office, Occasional Paper; United Nations Development Programme: New York, NY, USA, 2004. [Google Scholar]
  15. Pandey, T.R.; Mishra, S.; Chemjong, D.; Pokhrel, S.; Rawal, N. Forms and Patterns of Social Discrimination in Nepal; UNESCO Kathmandu: Kathmandu, Nepal, 2006. [Google Scholar]
  16. Mikkonen, E. Bridges over the Mountain Ranges Ethnography on the Complexities of Transition; University of Lapland: Rovaniemi, Finland, 2017. [Google Scholar]
  17. ANPFa. Class, Caste and Climate Change: A Vulnerability Analysis in Nepal; Gillespie, P., Ed.; Pesticide Action Network, Asia and the Pacific: San Francisco, CA, USA, 2011. [Google Scholar]
  18. Metha, M. Gender Matters: Lessons for Disaster Risk Reduction in South Asia; Integrated Centre for Mountain Development (ICIMOD): Kathmandu, Nepal, 2007. [Google Scholar]
  19. Barros, R.; Fox, L.; Mendonca, R. Female-headed households, poverty, and the welfare of children in urban Brazil. Econ. Dev. Cult. Chang. 1997, 45, 231–257. [Google Scholar] [CrossRef]
  20. Adger, W.N. Vulnerability. Glob. Environ. Chang. 2006, 16, 268–281. [Google Scholar] [CrossRef]
  21. IPCC Climate Change 2014: Impacts, Adaptation, and Vulnerability. Part B: Regional Aspects; Contribution of Working Group II to the Fifth Assessment Report of the Intergovernmental Panel on Climate Change; Barros, V.R.; Field, C.B.; Dokken, D.J.; Mastrandrea, M.D.; Mach, K.J.; Bilir, T.E.; Chatterjee, M.; Ebi, K.L.; Estrada, Y.O.; Genova, R.C. (Eds.) Cambridge University Press: Cambridge, UK; New York, NY, USA, 2014. [Google Scholar]
  22. Gallopín, G.C. Linkages between vulnerability, resilience, and adaptive capacity. Glob. Environ. Chang. 2006, 16, 293–303. [Google Scholar] [CrossRef]
  23. Hahn, M.B.; Riederer, A.M.; Foster, S.O. The livelihood vulnerability index: A pragmatic approach to assessing risks from climate variability and change—A case study in Mozambique. Glob. Environ. Chang. 2009, 19, 74–88. [Google Scholar] [CrossRef]
  24. Preston, B.L.; Yuen, E.J.; Westaway, R.M. Putting vulnerability to climate change on the map: A review of approaches, benefits, and risks. Sustain. Sci. 2011, 6, 177–202. [Google Scholar] [CrossRef]
  25. Islam, M.M.; Sallu, S.; Hubacek, K.; Paavola, J. Vulnerability of fishery-based livelihoods to the impacts of climate variability and change: Insights from coastal Bangladesh. Reg. Environ. Chang. 2013, 14, 281–294. [Google Scholar] [CrossRef]
  26. MoE. MoE Climate Change Vulnerability Mapping for Nepal; Government of Nepal, Ministry of Environment: Kathmandu, Nepal, 2010.
  27. Subedi, M. Caste system: Theories and practices in Nepal. Himal. J. Sociol. Antropol. 2010, 4, 134–159. [Google Scholar] [CrossRef]
  28. Fitzpatrick, I.C. Cardamom and Clas: A Limbu Village and Its Extensions in East Nepal; Vajra Publications: Kathmandu, Nepal, 2011; Volume 32. [Google Scholar]
  29. CBS National Population and Housing Census 2011 (National Report); CBS: Kathmandu, Nepal, 2012; Volume 01.
  30. CBS National Population and Housing Census 2011: Caste and Ethnicity; CBS: Thapathali, Kathamandu, Nepal, 2013.
  31. NEFIN Classified Schedule of Indigenous Nationalities of Nepal; NEFIN: Kusunti, Nepal, 2004.
  32. Pokharel, B. Changing relations between high castes and Tamang in Melamchi. Dhaulagiri J. Sociol. Anthropol. 2010, 4. [Google Scholar] [CrossRef]
  33. Macchi, M. Framework for Community-Based Climate Vulnerability and Capacity Assessment in Mountain Areas; Integrated Centre for Mountain Development (ICIMOD): Kathmandu, Nepal, 2011. [Google Scholar]
  34. Ford, J.D.; Smit, B. A framework for assessing the vulnerability of communities in the Canadian Arctic to risks associated with climate change. Artcic 2004, 57, 389–400. [Google Scholar] [CrossRef]
  35. Smit, B.; Pilifosova, O. Adaptation to climate change in the context of sustainable development and equity. Sustain. Dev. 2003, 8, 879–906. [Google Scholar]
  36. Hoff, H.; Warner, K.; Bouwer, L.M. The role of financial services in climate adaptation in developing countries. Vierteljahrshefte zur Wirtschaftsforsch 2005, 74, 196–207. [Google Scholar] [CrossRef]
  37. Dowla, A. In credit we trust: Building social capital by Grameen Bank in Bangladesh. J. Sociol. Econ. 2006, 35, 102–122. [Google Scholar] [CrossRef]
  38. Islam, S. Role of Microfinance Tools in Disaster Risk Reduction: A Study in India, Bangladesh and Sri Lanka; Bangladesh Country Report; INAFI Asia and Bangladesh: Dhaka, Bangladesh, 2008. [Google Scholar]
  39. Hammill, A.; Matthew, R.; McCarter, E. Microfinance and climate change adaptation. IDS Bull. 2009, 39, 113–122. [Google Scholar] [CrossRef]
  40. Hess, J.J.; Mcdowell, J.Z.; Luber, G. Integrating climate change adaptation into public health practice: Using adaptive management to increase adaptive capacity and build resilience. Environ. Health Perspect. 2012, 120, 171–179. [Google Scholar] [CrossRef] [PubMed]
  41. Peñalba, L.M.; Elazegui, D.D. Improving adaptive capacity of small-scale ricefarmers: Comparative analysis of Lao Pdr and the Philippines. World Appl. Sci. J. 2013, 24, 1211–1220. [Google Scholar]
  42. Hassan, R.; Nhemachena, C. Determinants of African farmers’ strategies for adapting to climate change: Multinomial choice analysis. AFJARE 2008, 2, 83–104. [Google Scholar]
  43. Nhemachena, C.; Hassan, R. Micro-Level Analysis of Farmers’ Adaptation to Climate Change in Southern Africa; IFPRI Discussion Paper No. 00714; International Food Policy Research Institute (IFPRI): Washington, DC, USA, 2007. [Google Scholar]
  44. Pandey, R.; Jha, S. Climate vulnerability index—Measure of climate change vulnerability to communities: A case of rural Lower Himalaya, India. Mitig. Adapt. Strateg. Glob. Chang. 2011, 17, 487–506. [Google Scholar] [CrossRef]
  45. Sullivan, C.; Meigh, J.; Fediw, T. Derivation and Testing of the Water Poverty Index Phase 1; Centre for Ecology and Hydrology: Wallingford, UK, 2002; Volume 1. [Google Scholar]
  46. Tubiello, F.N.; Rosenzweig, C. Developing climate change impact metrics for agriculture. Integr. Assess. 2008, 8, 165–184. [Google Scholar]
  47. Hinkel, J. Indicators of vulnerability and adaptive capacity: Towards a clarification of the science—Policy interface. Glob. Environ. Chang. 2011, 21, 198–208. [Google Scholar] [CrossRef]
  48. Yoon, D.K. Assessment of social vulnerability to natural disasters: A comparative study. Nat. Hazards 2012, 63, 823–843. [Google Scholar] [CrossRef]
  49. Agrawal, A. The role of local institutions in adaptation to climate change. In Proceedings of the Social Dimensions of Climate Change: Equity and Vulnerability in a Warming World; Mearns, R., Norton, A., Eds.; World Bank: Washington, DC, USA, 2010; pp. 173–197. [Google Scholar]
  50. Smit, B.; Wandel, J. Adaptation, adaptive capacity and vulnerability. Glob. Environ. Chang. 2006, 16, 282–292. [Google Scholar] [CrossRef]
  51. Ospina, A.V.; Heeks, R. Linking ICTs and Climate Change Adaptation: A Conceptual Framework for E-Resilience and E-Adaptation; University of Manchester: Manchester, UK, 2010. [Google Scholar]
  52. Lemos, M.C.; Agrawal, A.; Johns, O.; Eakin, H.; Nelson, D.; Engle, N. Building adaptive capacity to climate change in Less developed countries. In Climate Science for Serving Society; Springer: Dordrecht, The Netherlands, 2013; pp. 437–457. ISBN 978-94-007-6692-1. [Google Scholar]
  53. Graner, E. User Group Forestry—Poor Policy for Poor People? Nepal’s Forest Legislation from a Political Ecology Perspective; Freiburg University: Freiburg im Breisgau, Germany, 1996. [Google Scholar]
  54. Graner, E. Kami Blacksmith Today: Forests and livelihood security. CNAS 1997, 24, 217–231. [Google Scholar]
  55. Fischer, G.; Tubiello, F.N.; van Velthuizen, H.; Wiberg, D.A. Climate change impacts on irrigation water requirements: Effects of mitigation, 1990–2080. Technol. Forecast. Soc. Chang. 2007, 74, 1083–1107. [Google Scholar] [CrossRef]
  56. Folmar, S. Problems for identity for Hills Dalits and Nepal’s nationalist project. In Nationalism and Ethnic Conflict in Nepal: Identities and Mobilization after 1990; Lawoti, M., Hangen, S., Eds.; Routledge: London, UK, 2013; pp. 85–101. ISBN 078-0-415-78097-1. [Google Scholar]
  57. Tiwary, R.; Phansalkar, S.J. Dalits’ access to water: Patterns of deprivation and discrimination. Int. J. Rural Manag. 2007, 3, 43–67. [Google Scholar] [CrossRef]
  58. Baird, R. The Impact of Climate Change on Minorities and Indigenous Peoples, Briefing Paper; Minority Rights Group International: London, UK, 2008. [Google Scholar]
  59. Lambrou, Y.; Piana, G. Gender: The Missing Component of the Response to Climate Change; Food and Agriculture Organization of the United Nations (FAO): Rome, Italy, 2006. [Google Scholar]
  60. Tenge, A.J.; De Graaff, J.; Hella, J.P. Social and economic factors affecting the adoption of soil and water conservation in West Usambara highlands, Tanzania. Land Degrad. Dev. 2004, 15, 99–114. [Google Scholar] [CrossRef]
  61. IFPRI. Empowering women to achieve food security. In Proceedings of the A 2020 Vision for Food, Agriculture and the Environment; Quisumbing, A.R., Meinzen-Dick, R.S., Eds.; International Food Policy Research Institute (IFPRI): Washington, DC, USA, 2001; p. 24. [Google Scholar]
  62. Meinzen-Dick, R.; Biermayr-jenzano, P.; Wilde, V.; Noordeloos, M.; Catherine, R.; Beintema, N. Engendering Agricultural Research; Environment and Production Technology Division, IFPRI: Washington, DC, USA, 2010. [Google Scholar]
  63. Nepal CBS. National Population and Housing Census 2011; (National Report); Government of Nepal, National Planning Commission Secretariat: Kathmandu, Nepal, 2012.
  64. Clarke, G.E. A Helambu History. J. Nepal Res. Cent. 1980, 4, 1–38. [Google Scholar]
Figure 1. Study area: (a) Map of Nepal showing the Melamchi River Valley and surveyed VDCs with social composition in the outline of the Sindhupalchok District. (b) Land cover map of the Melamchi River Valley. (c) Map of the Melamchi Valley showing temperature seasonality. (d) Temperature maximum, minimum, and precipitation recorded at different meteorological and precipitation recording stations.
Sustainability 11 02977 g001
Table 1. Surveyed household’s distribution in study area.
VDCsHelambuKiwoolIchowkPalchowkMahankalMelamchiTalamarangDubachour
ElevationUpland (ca. 2000–3000 masl)Middle hills (ca. 1500–2500 masl)Lowland (ca. 900–1500 masl)
Surveyed HHs3844454749445048
Female headed5 (13.15%)2 (4.54%)5 (11.11%)10 (21.27%)2 (4.08%)5 (11.36%)2 (4%)6 (12.5%)
Brahmin/Chhetri0111910932288
Dalit65420090
Hyolmo3218041003
Tamang0722193991224
Other0301203113
Note: HHs—Households.
Table 2. Normalized sub-components, major components, and overall LVI for studied social groups in the Melamchi Valley.
Major ComponentsBrahmin/ChhetriDalitHyolmoTamangOtherSub-ComponentsBrahmin/ChhetriDalitHyolmoTamangOther
Socio-demographic profile0.250.30.320.290.29Dependency ratio of HHs0.140.220.190.220.19
% of HHs head that did not attend school0.580.730.820.620.69
% of female-headed HHs0.080.080.160.090.13
Average age of HH heads (1/years)0.230.240.20.270.25
Average HH size0.220.240.250.240.22
Livelihood strategies0.560.550.530.590.58% of HHs with family member working in a different community0.570.50.430.640.56
% of HHs solely dependent on agriculture and livestock as a source of income0.40.310.330.460.38
Average agricultural livelihood diversification index0.200.220.290.210.24
Exterior wall type of house0.630.680.620.640.66
Roof type of house0.620.590.580.610.66
Total cultivated land owned by HHs0.940.980.950.960.95
Social networking0.30.440.430.470.35% of HHs with no membership in any community based and social organization0.280.420.420.550.44
% of HHs borrowing money from others0.120.310.220.210.06
Influence of HHs on local government for decision-making0.490.60.630.640.56
Finance0.710.810.820.790.7Annual expenditure of HHs0.690.60.710.580.43
Annual savings of HHs0.790.910.90.940.89
% of HHs not growing cash crop (s)0.420.770.690.710.5
Livestock units owned by HHs0.950.960.970.950.96
Knowledge and communication0.340.490.40.490.5% of HHs without TV and radios0.170.380.180.420.38
% of HHs without phone0.070.150.10.170.25
Average years of schooling of HHs heads0.760.910.920.880.86
Health0.420.520.470.510.46% of HHs who reported diseases0.120.120.020.120.06
Distance from HHs to district hospital (MBBS doctor)0.410.650.790.490.34
% of HHs that did not treat water0.930.810.650.861
% of HHs that did not have a toilet0.220.50.440.550.44
Food0.170.270.170.160.23Average crop diversity Index of HHs0.060.10.130.070.18
% of HHs that did not save seed0.170.190.070.060.16
Average number of months with sufficient food0.270.510.320.350.35
Water0.250.320.170.240.29% of HHs reporting water decrease in irrigating channels0.460.270.070.260.28
% of HHs reporting water conflicts within their local community0.440.770.40.480.72
Average time to collect water in dry season for HHs0.060.140.060.090.15
Quality of water used by HHs0.150.220.190.220.13
Average months that water is sufficient for the HHs0.120.210.150.130.17
Natural disasters and climate variability0.670.750.710.700.72% of HHs reporting change in temperature in last 20 years0.9510.980.910.97
% of HHs reporting change in precipitation in last 20 years0.870.920.770.770.84
% of HHs reporting climate hazards (landslide, flood, drought, crop pest) that cause damage to livelihoods0.6810.940.980.97
Mean standard deviation of monthly average precipitation (1979–2009)0.280.310.350.30.28
Temperature seasonality (standard deviation, 1950–2000)0.580.520.510.570.56
Overall LVI0.420.500.460.480.47
HHs—Household; Bold score indicated the highest score
Table 3. Normalized sub-components, major components, and overall LVI for female and male-headed households in Melamchi Valley.
Major ComponentsFemale-Headed HHMale-Headed HHSub-ComponentsFemale-Headed HHMale-Headed HH
Socio-demographic profile0.370.34Dependency ratio0.1930.19
Percent of HHs with no school attendance0.890.66
Average age of household head (1/years)0.220.29
Average household size0.180.24
Livelihood strategies0.590.58% of HHs with family member working in a different community0.620.66
% of HHs solely dependent on agriculture and livestock as a source of income0.570.44
Average agricultural livelihood diversification index0.160.20
Exterior wall type of house0.610.61
Roof type of house0.600.64
Total cultivated land owned by HHs0.980.95
Social networking0.470.42% of HHs with no membership in any community-based and social organization0.600.50
% of HHs borrowing money from others0.190.18
Influence of HHs on local government for decision-making0.610.58
Communication and knowledge0.570.42% of HHs without TV and radios0.430.29
% of HHs without phone0.300.12
Average years of schooling of HHs heads0.970.84
Finance0.770.76Annual expenditure of HHs0.560.63
Annual savings of HHs0.940.88
% of HHs not growing cash crop(s)0.620.60
Livestock units owned by HHs0.960.95
Health0.540.46% of HHs who reported diseases0.080.16
Distance from HHs to district hospital (MBBS doctor)0.480.45
% of HHs that did not treat water1.000.85
% of HHs that did not have a toilet0.600.39
Food0.210.18Average crop diversity Index of HHs0.140.08
% of HHs that did not save seed0.140.13
Average number of months with sufficient food0.350.33
Water0.340.26% of HHs reporting water decrease in irrigating channels0.320.35
% of HHs reporting water conflicts within their local community0.680.55
Average time to collect water in dry season for HHs0.060.09
Water quality used by HHs0.500.18
Average months that water is sufficient for the HHs0.140.14
Natural disasters and climate variability0.780.60% of HHs reporting change in temperature in last 20 years0.920.96
% of HHs reporting change in precipitation in last 20 years0.810.83
% of HHs reporting climate hazards (landslide, flood, drought, crop pest) that cause damage to livelihoods0.950.99
Mean standard deviation of monthly average precipitation (1979–2009)0.590.22
Temperature seasonality (standard deviation, 1950–2000)0.640.04
Overall LVI0.520.45
The bold score in the table indicate the highest score of LVI major and sub-components for female headed and male headed households, indicating more vulnerable factors. HHs—Households.
Table 4. LVI-IPCC contribute factors for calculating studied social groups and female-headed and male-headed households in Melamchi Valley.
IPCC Contributing
Factors to Vulnerability
Social GroupsFemale-Headed and Male-Headed HH Based
Brahmin/ChhetriDalitHyolmoTamangOtherFemaleMale
Adaptive capacity0.550.490.510.490.520.460.50
Sensitivity0.280.370.270.310.330.370.31
Exposure0.670.750.720.700.720.780.60
LVI-IPCC0.030.100.060.070.070.120.03
Bold score in the table indicates highest score LVI-IPCC components for each social groups and female-headed and male-headed households in the Melamchi Valley.

