Multicriteria Approach to Sustainable Transport Evaluation under Incomplete Knowledge: Electric Bikes Case Study


1
Department of Artificial Intelligence Methods and Applied Mathematics, Faculty of Computer Science and Information Technology, West Pomeranian University of Technology in Szczecin ul. Żołnierska 49, 71-210 Szczecin, Poland
2
Department of Information Systems Engineering in the Faculty of Economics and Management, University of Szczecin, Mickiewicza 64, 71-101 Szczecin, Poland
*
Author to whom correspondence should be addressed.
Sustainability 2019, 11(12), 3314; https://doi.org/10.3390/su11123314
Submission received: 1 May 2019
/
Revised: 7 June 2019
/
Accepted: 13 June 2019
/
Published: 15 June 2019
(This article belongs to the Special Issue Methodological Aspects of Solving Sustainability Problems: New Challenges, Algorithms and Application Areas)
Abstract
:The problem of sustainable city transport is a growing field of study, and will be addressed in this paper. With the rising significance of present transportation systems’ negative externalities on the environment, such as the unavoidable increase of air pollution levels, cities seek sustainable means of transport and reduction of combustion cars’ utilization. Moreover, improvements in the area of renewable energy sources have led to rising trends in sustainability, driving the usage and production of electric vehicles. Currently, there is an increasing tendency of looking for more sustainable transport solutions, especially in highly congested urban areas. It seems that in that case, electric bicycles can be a good option, as they yield more benefits in comparison to cars, especially combustion cars. In this paper, we identify an assessment model for the selection of the best electric bicycle for sustainable city transport by using incomplete knowledge. For this purpose, the Characteristic Objects METhod (COMET) is used. The COMET method, proven effective in the assessment of sustainable challenges, is a modern approach, utterly free of the rank reversal phenomenon. The evaluated model considers investigated multiple criteria and is independent of chosen alternatives in the criteria domain. Hence, it can be easily modified and extended for diverse sets of decisional variants. Moreover, the presented approach allows assessing alternatives under conditions of incomplete knowledge, where some data are presented as possible interval numbers.
1. Introduction
More than 50% of the world’s population lives in urban areas, and it is estimated that by 2045 the number of people living in cities will increase up to 1.5 times—which is around 6 billion people [1]. There are more than 1 billion motorized vehicles worldwide, and with rising income levels, one should expect continuous expansion [2,3]. As a result of high flows of people into cities, transport systems are on the verge of transformation. With rising numbers of people dwelling in urban areas, many challenging needs and problems arise regarding sustainable development, where the critical element is the sustainable transport. The importance of this issue is not only proven by the critical postulates of the Sustainable Development Goals [4], but also by negative aspects current urban transport poses, such as elevated levels of air pollution or more frequent premature deaths from human exposure to harmful pollutants [5]. Diseases caused by pollution were responsible for an estimated 9 million premature deaths in 2015 three times more deaths than from AIDS, tuberculosis, and malaria combined and 15 times more than from all wars and other forms of violence [6].
Sustainable urban transport has become more complex and more significant to sustainability policies [6]. Thus researchers investigate this ongoing challenge through diverse and innovative means [7,8]. This problem is examined not only concerning modern metropolitan areas [9], but also to cities in developing countries [10,11]. The vital role of transport in the sustainability of the cities has been ascertained in previous papers, motivating researchers to explore new solutions in the area [12]. Consequently, new approaches have been proposed that aim to improve current transportation systems and solve prevailing environmental and economic aspects concerned with currently unsustainable transportation [13,14]. However, the previous works examine the problem of transport systems as a whole, often only regarding the supply chain, entirely omitting or briefly investigating specifically urban transportation [15]. Furthermore, researchers in the sustainable city transport discipline need to consider a broad spectrum of criteria, such as environmental, economic, social, legal and political issues [16]. Such multidimensional matter requires the use of various techniques to address this problem, such as fuzzy logic or multi-criteria decision analysis (MCDA) methods [17,18,19]. Currently, the evaluation of sustainable transport is an emerging area that researchers handle more frequently with the use of MCDA methods, proven to be effective in such challenges [20,21,22], as well as in evaluating other sustainable decision problems [23,24]. With growing attention towards sustainability assessment, one should also consider renewable energy sources, which is a popular subject in many kinds of research. Studies have shown that zero-emission energy sources, highly demanded by modern cities, are tending to be more accessible and cleaner [25,26]. Researchers have used various methods to investigate renewable energy sources problems, such as evaluating locations for offshore wind farms using PROMETHEE for Sustainability Assessment (PROSA) method [27,28], or investigating the design of wind farms using Analytic Network Process (ANP) and Analytic Hierarchy Process (AHP) methods [29]. Consequently, with greener energy, studies showed that there is a rising interest in sustainable means of transport, such as electric vans or public city buses [30,31].
The key to sustainable urban transport is finding optimal means of transport, which would satisfy both the needs of the present and the future. In this area, multiple various research and practical initiatives undertaken in the recent years can be indicated [32,33,34]. They include both works focused on formulating a strategy of building and developing sustainable city transport [35,36,37], as well as papers of tactical [38,39,40] and operational [41] scope, focused for example on selection and evaluation of selected variants of sustainable city logistics [42,43,44]. It should be pointed out that the dynamic development of technology allows to undertake new attempts in searching for new and updating the existing sustainable options in city logistics and transport (for example the search for a portfolio of apropriate variants of sustainable city transport should be conducted in multiple layers [45] with the use of the complete set of available transport options [46]. As other types of solutions, such as car sharing, proved to be promising sustainable transport fields, it should be pointed out that their optional coexistence in a single unified system of sustainable city logistics [47,48,49,50] should be considered with other pro-ecological variants of city logistics such as ebikes, emotors, bikes. Naturally, a holistic approach to sustainable city transport requires to take into account a set of external conditions (e.g., climate conditions), technical or urbanistic options, which condition obtaining the desired effects [51] while sustaining an appropriate level of safety. As indicated, the coexistence of different modes of sustainable transport is therefore essential and in this context, the use of e-bikes may fill this gap. Electric bicycles are relatively cheap, and their cost of use is significantly lower compared to, e.g., fuel-powered personal cars [52]. Furthermore, they create a great opportunity concerning more rapid movement around the city, especially in congested city centers and are more comfortable than other ecological means of transport, such as traditional bicycles. Electric bikes are less safe (higher speed of movement) and do not require any physical activity compared to traditional bikes. However, they empower many positive externalities such as negligible emissions of pollutants, reduction in harmful noise levels and impacting overall awareness towards a sustainable future, to name a few. Today, many modern cities are limiting the usage of combustion vehicles and some are planning to completely withdraw existing ones or ban future sales [53]. With the encouragement of sustainable means of transport, one can expect an increasing trend towards electric vehicles in the foreseeable future [54]. The dynamically developing technology causes that the set of available sustainable transport variants (e.g., ebikes, electric powered or hybrid cars, emotors) grows rapidly. In such context, it becomes necessary to develop methodological foundations for the evaluation of sustainable transport options. The specifics of this problem, implicating the natural lack of selected data (e.g., malfunction reports data, loss of value of newly-introduced variants over a few-year time span), result in the necessity to develop the methodological guidelines in the environment of incomplete knowledge in the model.
In this paper, the ongoing challenge of sustainable transport will be addressed, which is the selection of the most rational electric bicycle. The paper shows step by step how to identify multi-criteria decision-making assessment model. For this purpose, the Characteristic Objects METhod (COMET) is used, which was proven successful in other sustainable development problems [55]. The COMET method, as one of the multi-criteria decision-analysis technique based on a rule set, is completely free of the rank reversal paradox, which is a key in a proper analysis [56,57]. The obtained model is used to rank the considered bicycles and choose the most rational from the set of ten proposed products. Methodically, work presents a successful attempt of building integrated, inference based model, that aggregates full data with incomplete expert knowledge. In a practical sense, the authors’ contribution is an attempt to build a reference ranking of ebikes for a carefully selected extensive set of ebikes, which can provide useful knowledge both for particular decision makers as well as for local communities and policy makers, where the evaluation and selection of sustainable transport variants is at stake.
The rest of the paper is organized as follows: in the next section, the Fuzzy Set Theory preliminaries are outlined. In Section 3, the COMET method is described as a useful tool to identify multi-criteria decision models. Subsequently, in Section 4, an experiment to build a decision model for an assessment of electric bicycles is described step by step, and the results are presented. The conclusions and the possible future directions are presented in Section 5.
2. Fuzzy Set Theory: Preliminaries
The fuzzy set theory was developed by Lofti Zadeh, who introduced the idea of fuzzy sets in [58]. The growing importance of the Fuzzy Set Theory in model creation in numerous scientific fields has proven to be an effective way to approach and solve multi-criteria decision problems [59,60,61]. The necessary concepts of the Fuzzy Set Theory are described as follows [62,63,64]:
Definition 1.
The fuzzy set and the membership function—the characteristic function of a crisp set assigns a value of either 0 or 1 to each member of X, and the crisp sets only allow a full membership or no membership at all . This function can be generalized to a function so that the value assigned to the element of the universal set X falls within a specified range, i.e., . The assigned value indicates the degree of membership of the element in the set A. The function is called a membership function and the set , where , defined by for each is called a fuzzy set [65,66].
Definition 2.
Definition 3.
Definition 4.
Definition 5.
Definition 6.
Definition 7.
The T-norm operator (intersection)—the T-norm operator is a T function modelling the intersection operation of two or more fuzzy numbers, e.g., and . Basic requirements for a function T is described by four properties: boundary Equation (6), monotonicity Equation (7), commutativity Equation (8), and associativity Equation (9) (for any ).
Definition 8.
The S-norm operator (union), or T-conorm—the S-norm operator is an S function modelling the union operation of two or more fuzzy numbers, e.g., and . Basic requirements for a function S is described by four properties: boundary Equation (11), monotonicity Equation (12), commutativity Equation (13), and associativity Equation (14) (for any ).
3. The Characteristic Objects Method
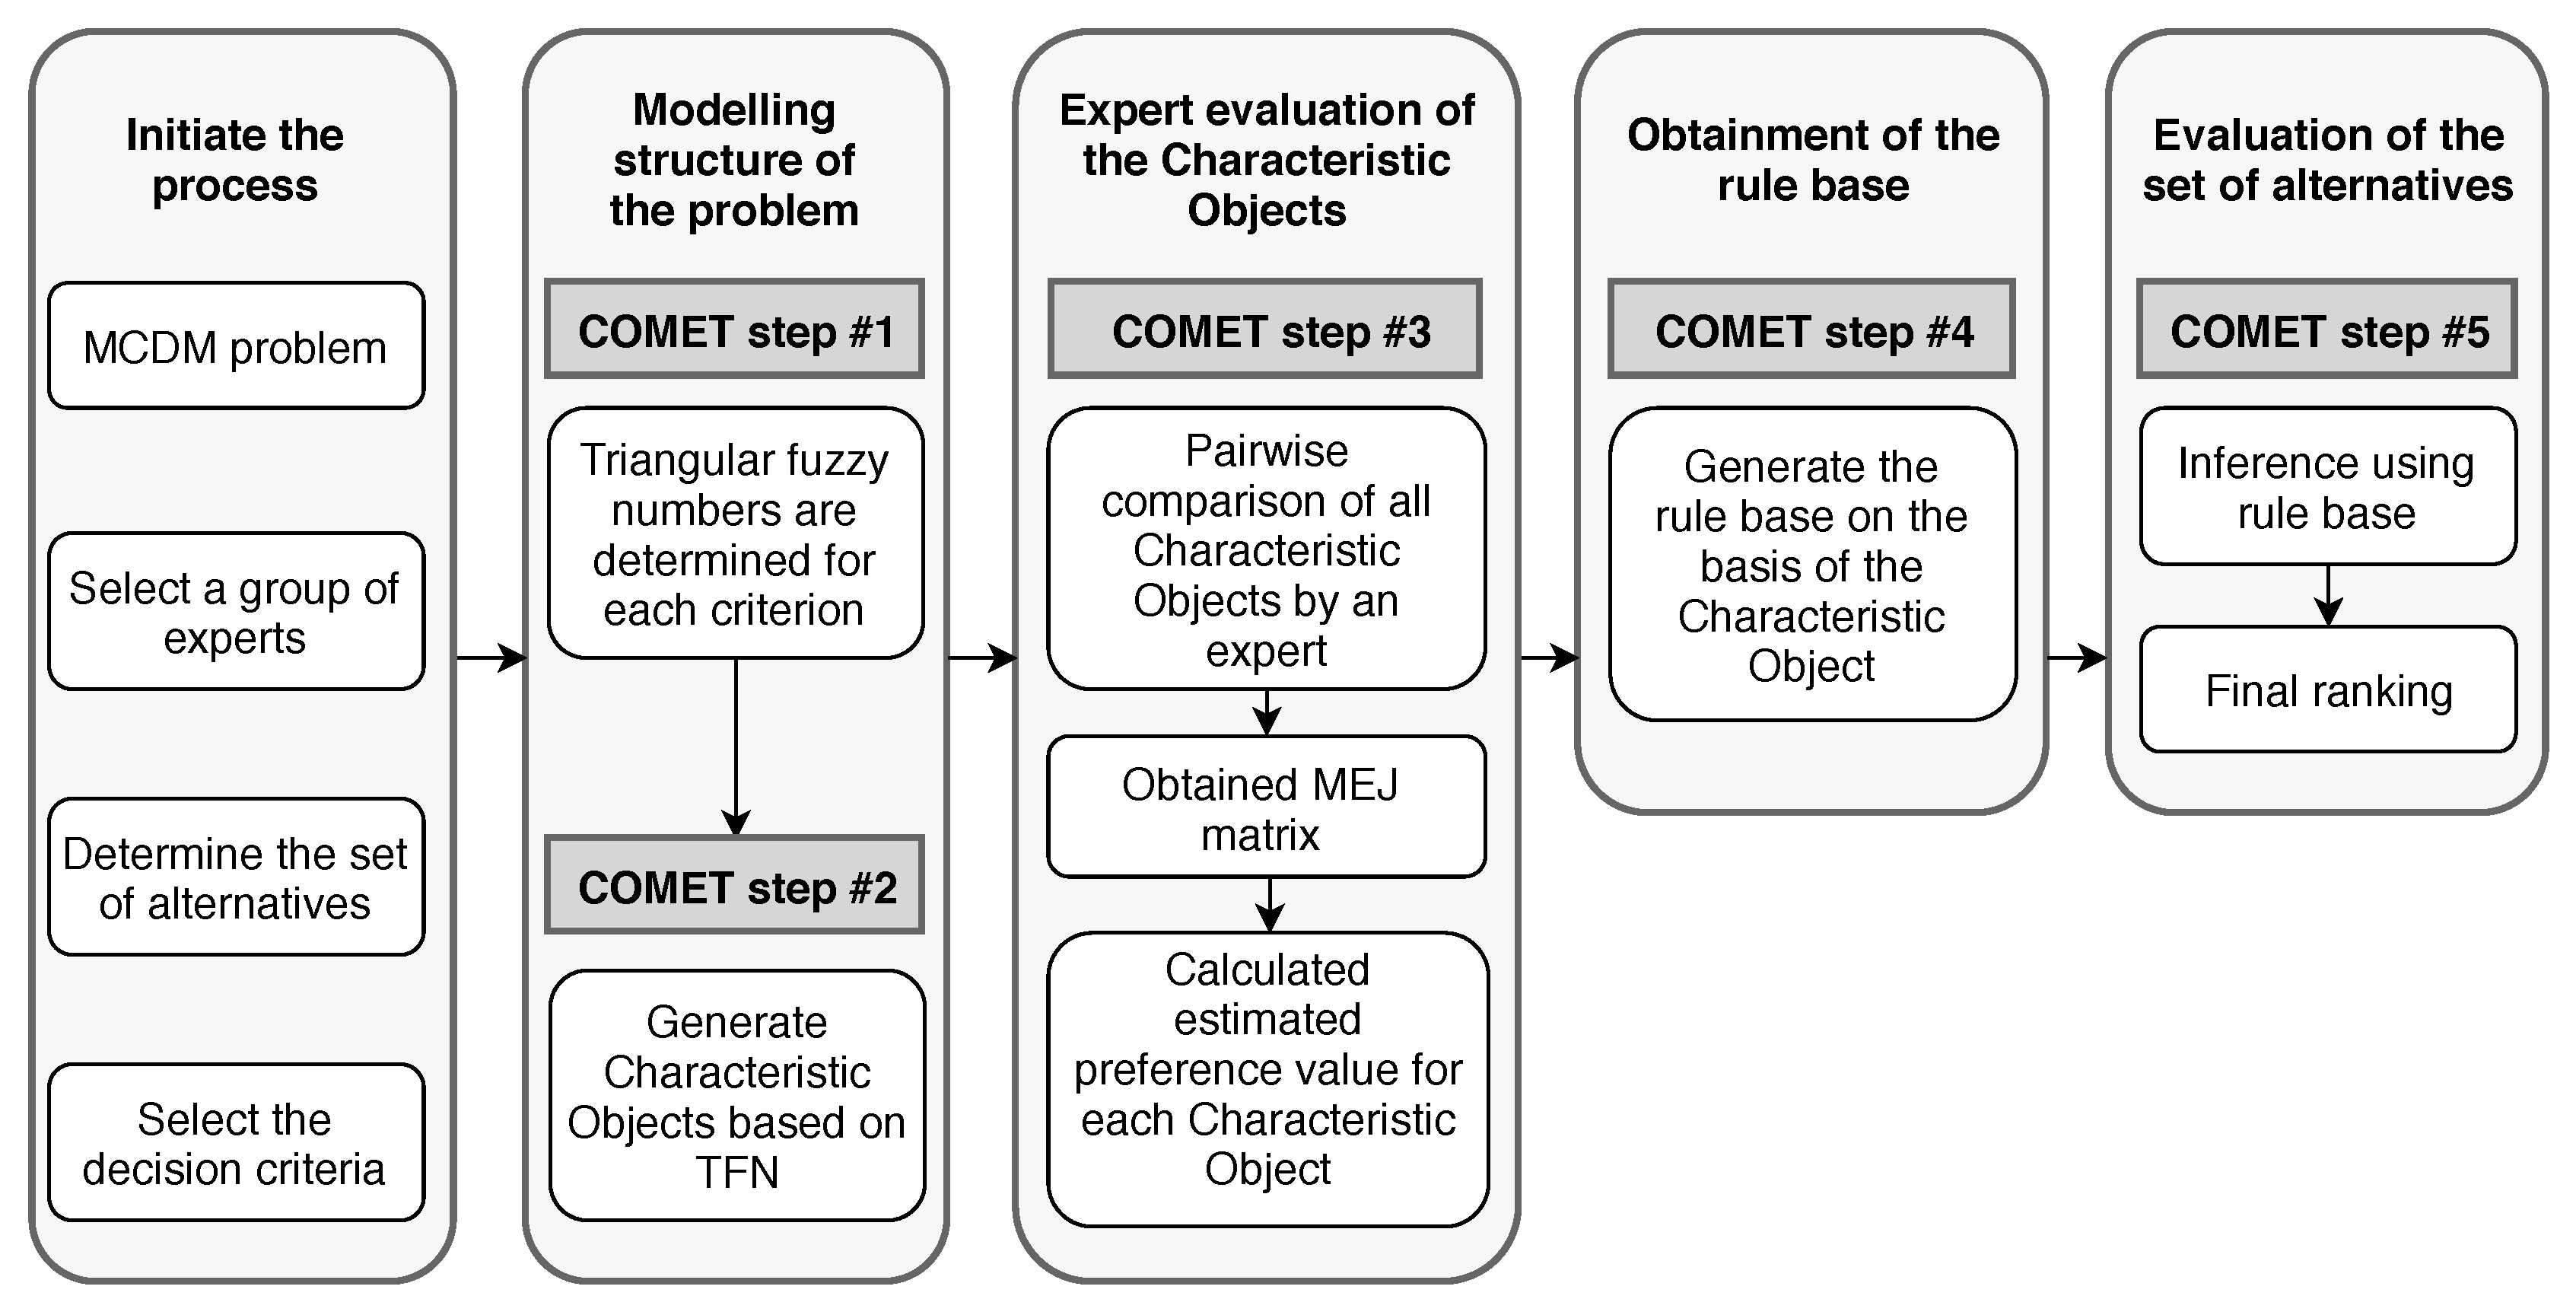
Many MCDM methods exhibit the rank reversal phenomenon; however, the Characteristic Objects Method (COMET) is completely free of the this problem. In previous works, the accuracy of the COMET method was verified [68]. The formal notation of the COMET method should be briefly recalled [62,63,64]. The whole decision-making process by using the COMET method is presented in Figure 1.
Step 1.Definition of the space of the problem—the expert determines the dimensionality of the problem by selecting r criteria, . Then, a set of fuzzy numbers is selected for each criterion , e.g., (16):
where are the ordinals of the fuzzy numbers for all criteria.
Step 2.Generation of the characteristic objects—the characteristic objects are obtained with the usage of the Cartesian product of the fuzzy numbers’ cores of all the criteria:
As a result, an ordered set of all is obtained:
where t is the count of s and is equal to:
Step 3.Evaluation of the characteristic objects—the expert determines the Matrix of Expert Judgment () by comparing the s pairwise. The matrix is presented below:
where is the result of comparing and by the expert. The function denotes the mental judgement function of the expert. It depends solely on the knowledge of the expert. The expert’s preferences can be presented as:
After the matrix is prepared, a vertical vector of the Summed Judgments () is obtained as follows:
Eventually, the values of preference are approximated for each characteristic object. As a result, a vertical vector P is obtained, where the row contains the approximate value of preference for .
Step 4.The rule base—each characteristic object and its value of preference is converted to a fuzzy rule as:
In this way, a complete fuzzy rule base is obtained.
Step 5.Inference and the final ranking—each alternative is presented as a set of crisp numbers, e.g., . This set corresponds to the criteria . Mamdani’s fuzzy inference method is used to compute the preference of the alternative. The rule base guarantees that the obtained results are unequivocal. The bijection makes the COMET completely rank reversal free.
4. Study Case
This paper presents the assessment model of decision-making concerning sustainable city transport. Selecting an optimal electric bike, especially considering multiple criteria, is a complex challenge. Such compound problems require the expert’s knowledge to establish the requirements for the model and therefore, based on the expert’s opinion, eight criteria were selected. Hence, the space of the investigated problem is equal to 8. Based on [69,70,71,72,73,74,75,76,77,78,79,80], the following criteria are specified:
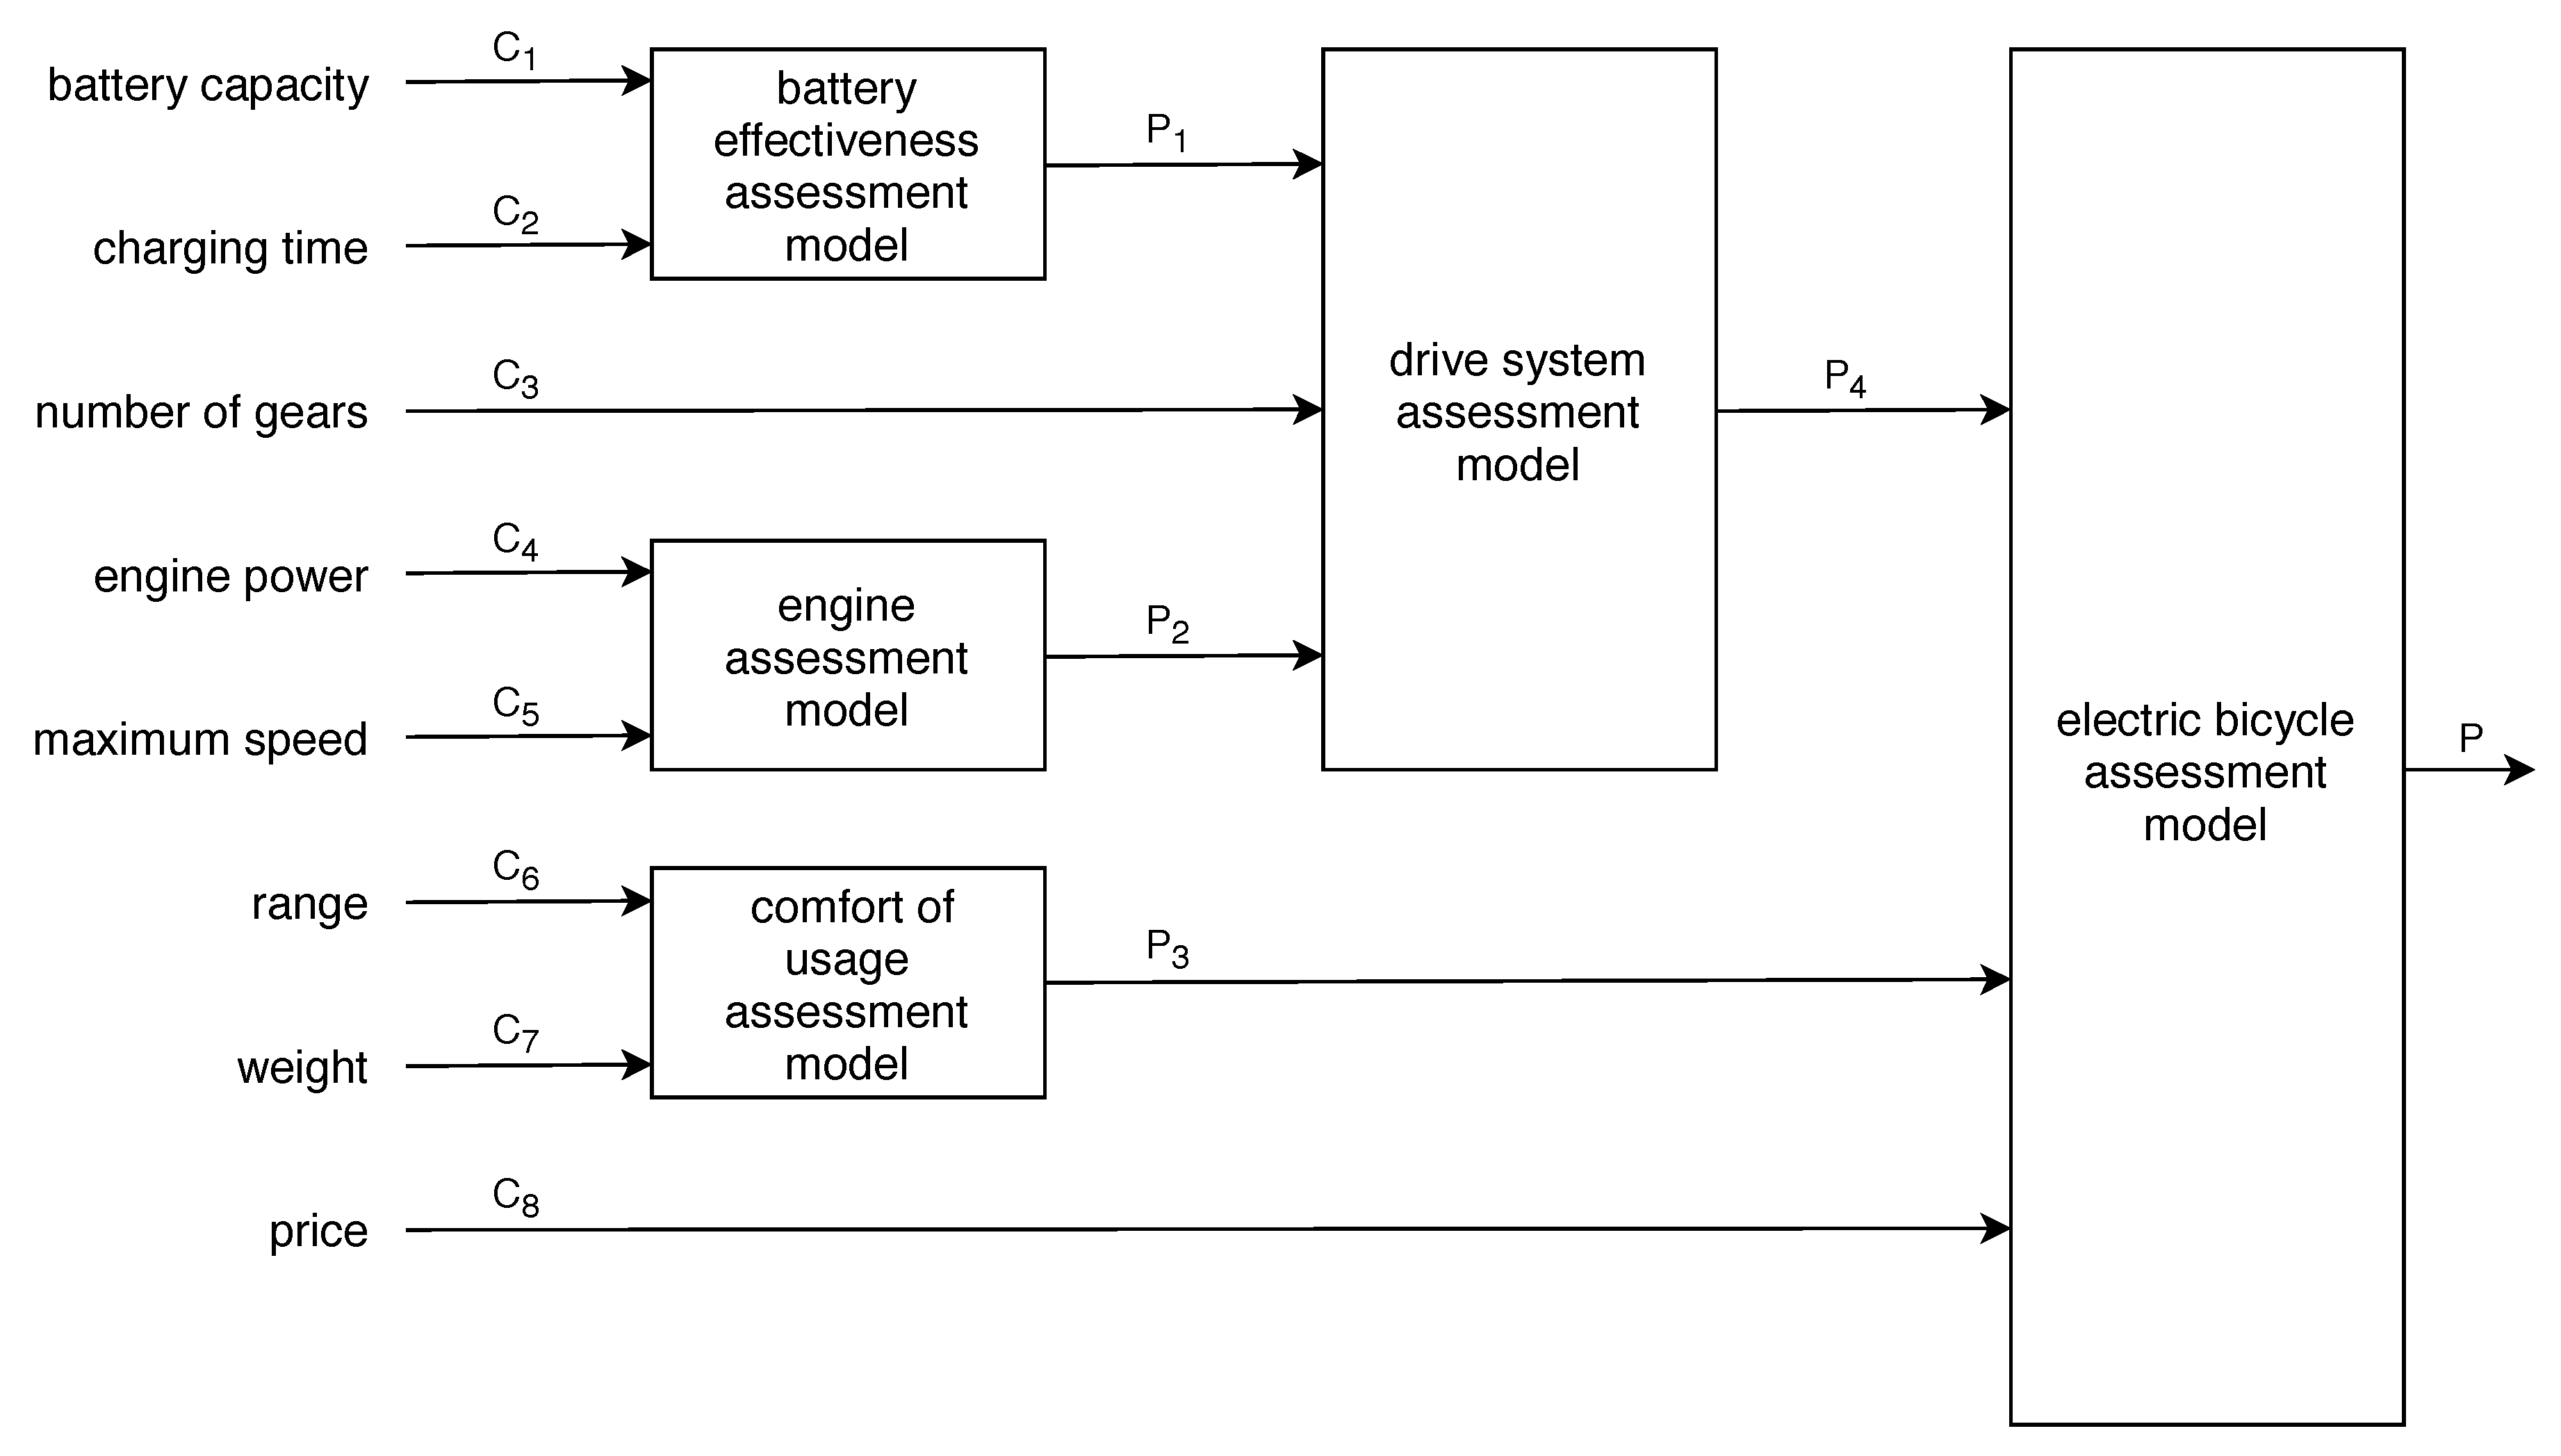
In this study case, the considered problem is simplified to a simple structure which is presented in Figure 2. In that way, we have to identify four related models, where each one requires a lot smaller number of queries. The decision model can be presented as the following models:
- battery effectiveness assessment model with two inputs (9 characteristic objects and 36 pairwise comparisons are needed);
- engine assessment model with two inputs (9 characteristic objects and 36 pairwise comparisons are needed);
- drive system assessment model with three inputs (27 characteristic objects and 351 pairwise comparisons are needed);
- comfort of usage assessment model with two inputs (9 characteristic objects and 36 pairwise comparisons are needed);
- electric bicycle assessment model with three inputs (36 characteristic objects and 351 pairwise comparisons are needed).
In Table 1, criteria are presented along with their respective linguistic values. Table 2 presents 10 exemplary ebikes along with the explanation of the model foundations, whereas the complete model for 64 bikes is presented in Section 4.7.
In order to identify the final model for the electric bicycle assessment, we first have to determine the following assessment models, i.e., battery effectiveness, engine, drive system and comfort of the usage.
4.1. Battery Effectiveness Assessment Model
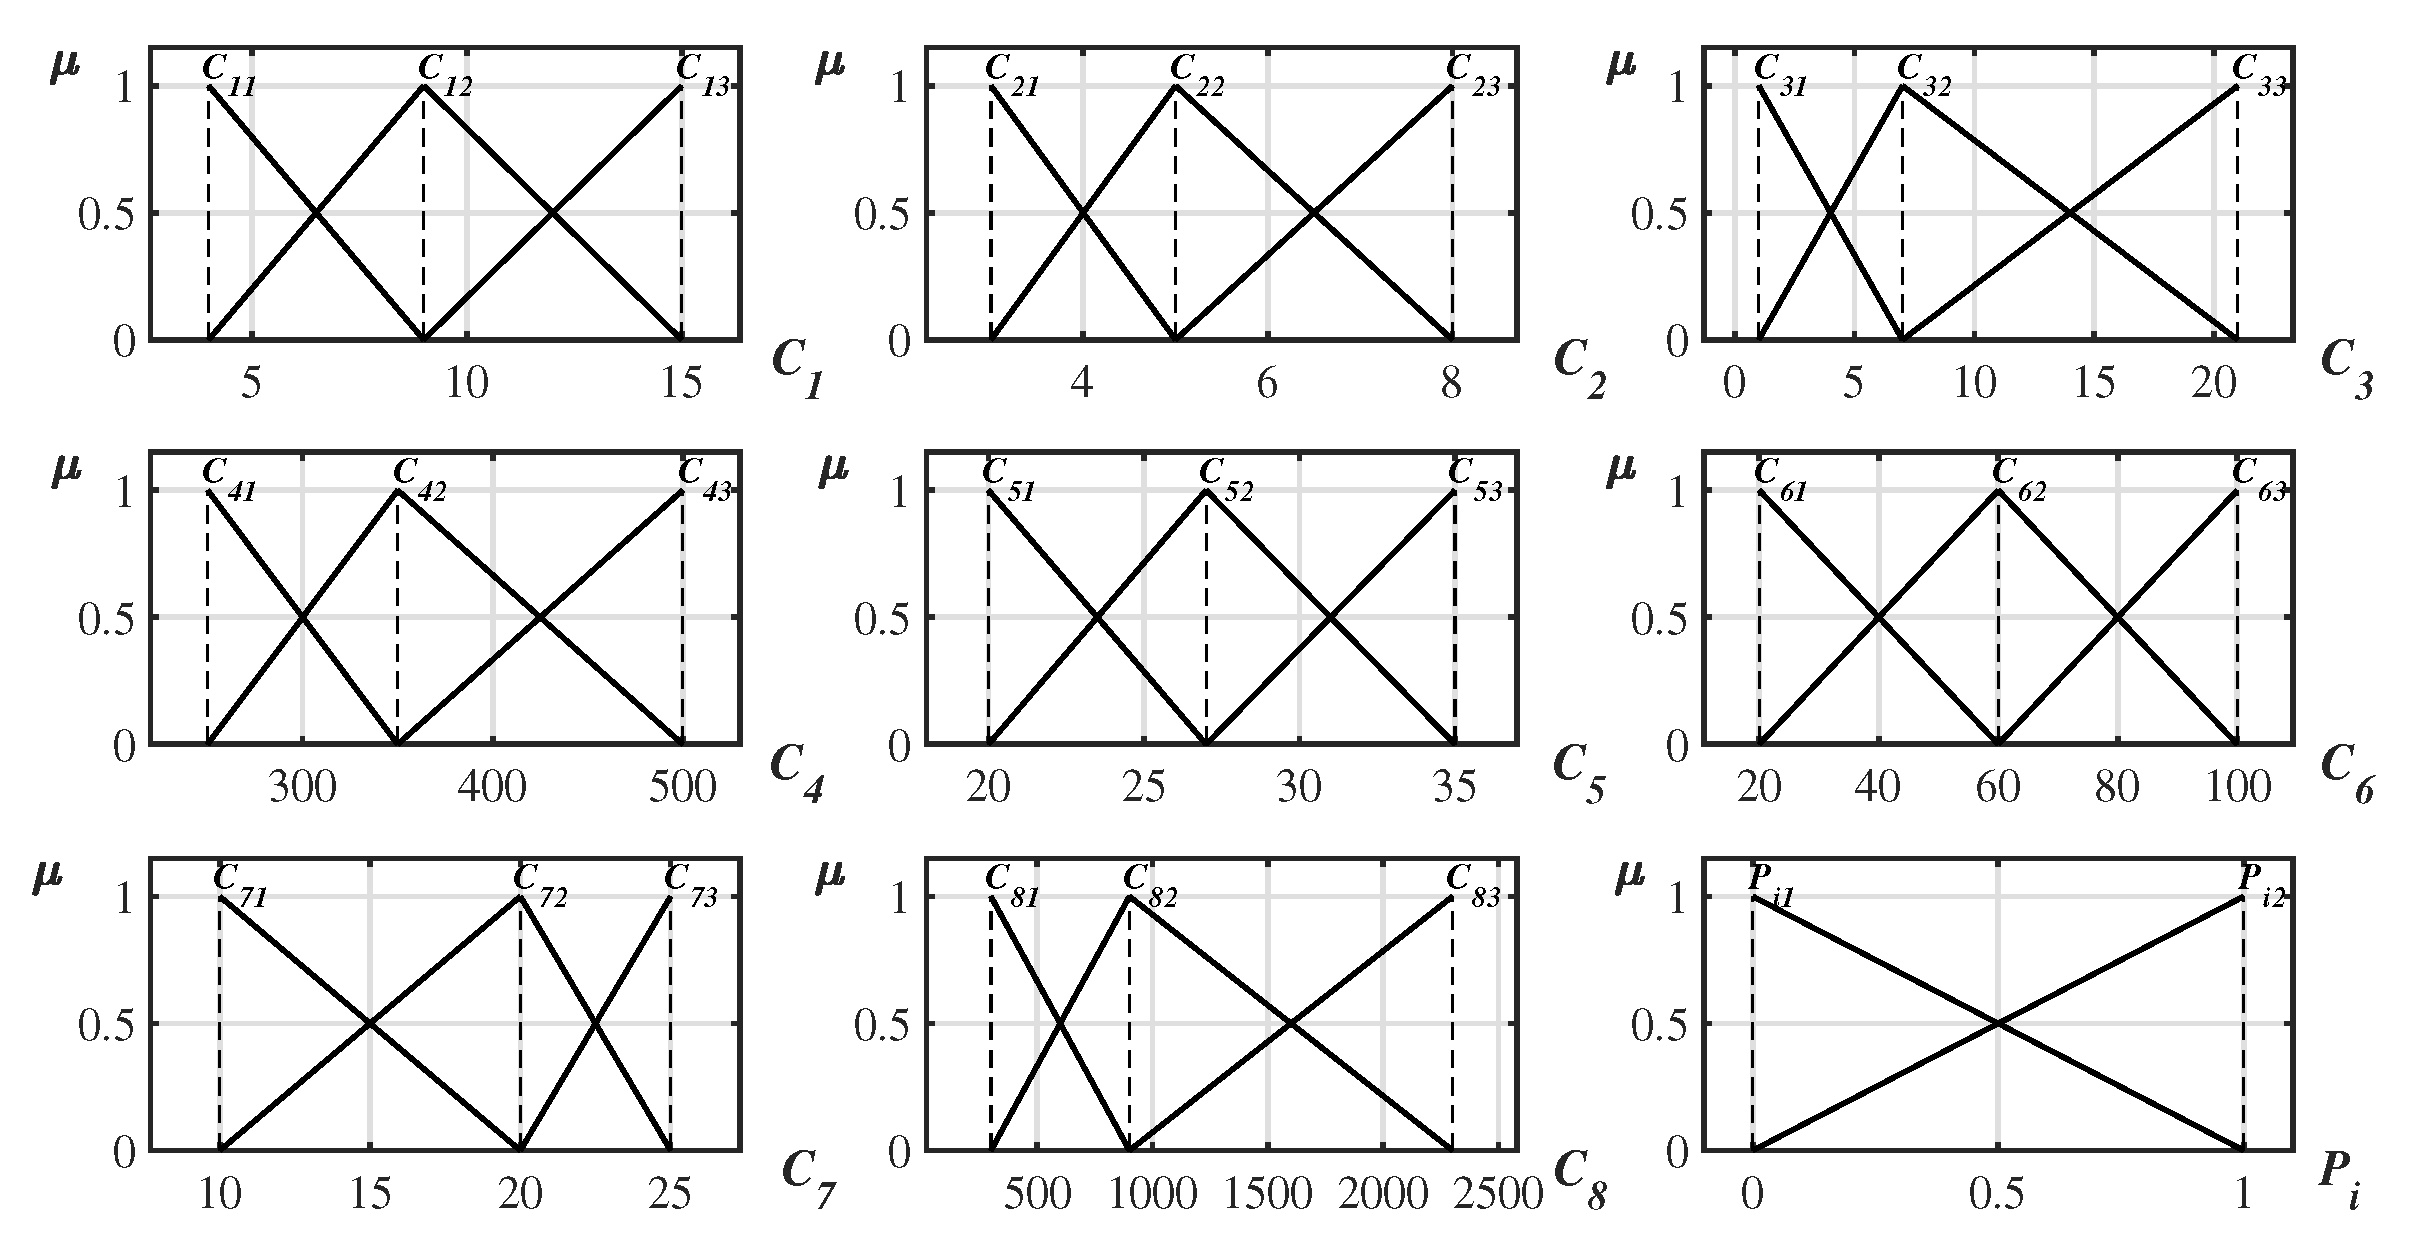
The expert identified two important criteria for the battery effectiveness assessment model, battery capacity, expressed in Ampere-hours [Ah] and charging time expressed in hours [H]. The former is a profit type criterion; hence the value increase implies the preference increase, whereas the latter is a cost-type criterion; hence the value increase implies the preference decrease. It should be noted that the relationship is rarely linear in such complex problems. The triangular fuzzy numbers of criteria and are depicted in Figure 3. The characteristic objects – are created using the Cartesian product of the fuzzy numbers’ cores of criteria and and are presented in Table 3. The space of the problem, including characteristic objects and alternatives, is presented in Figure 4.
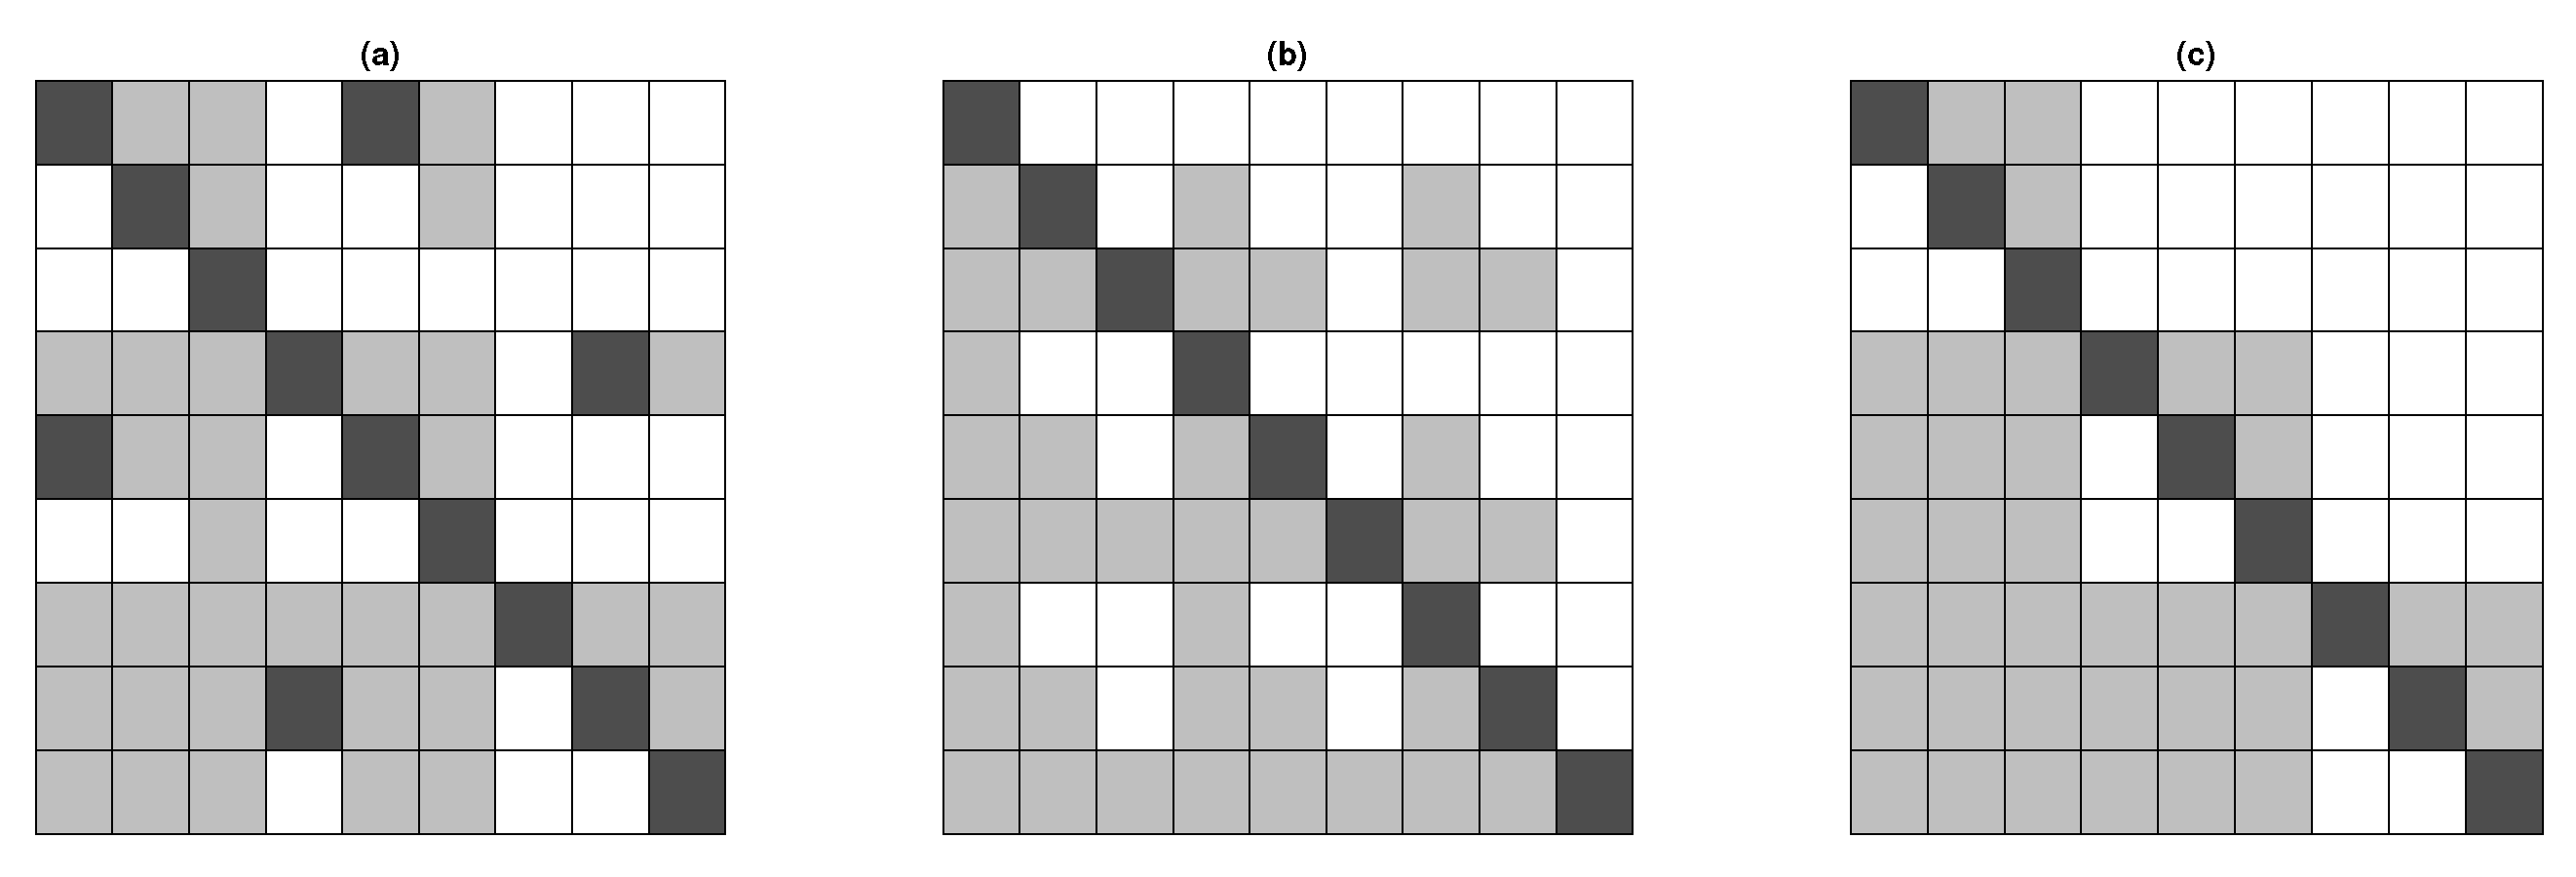
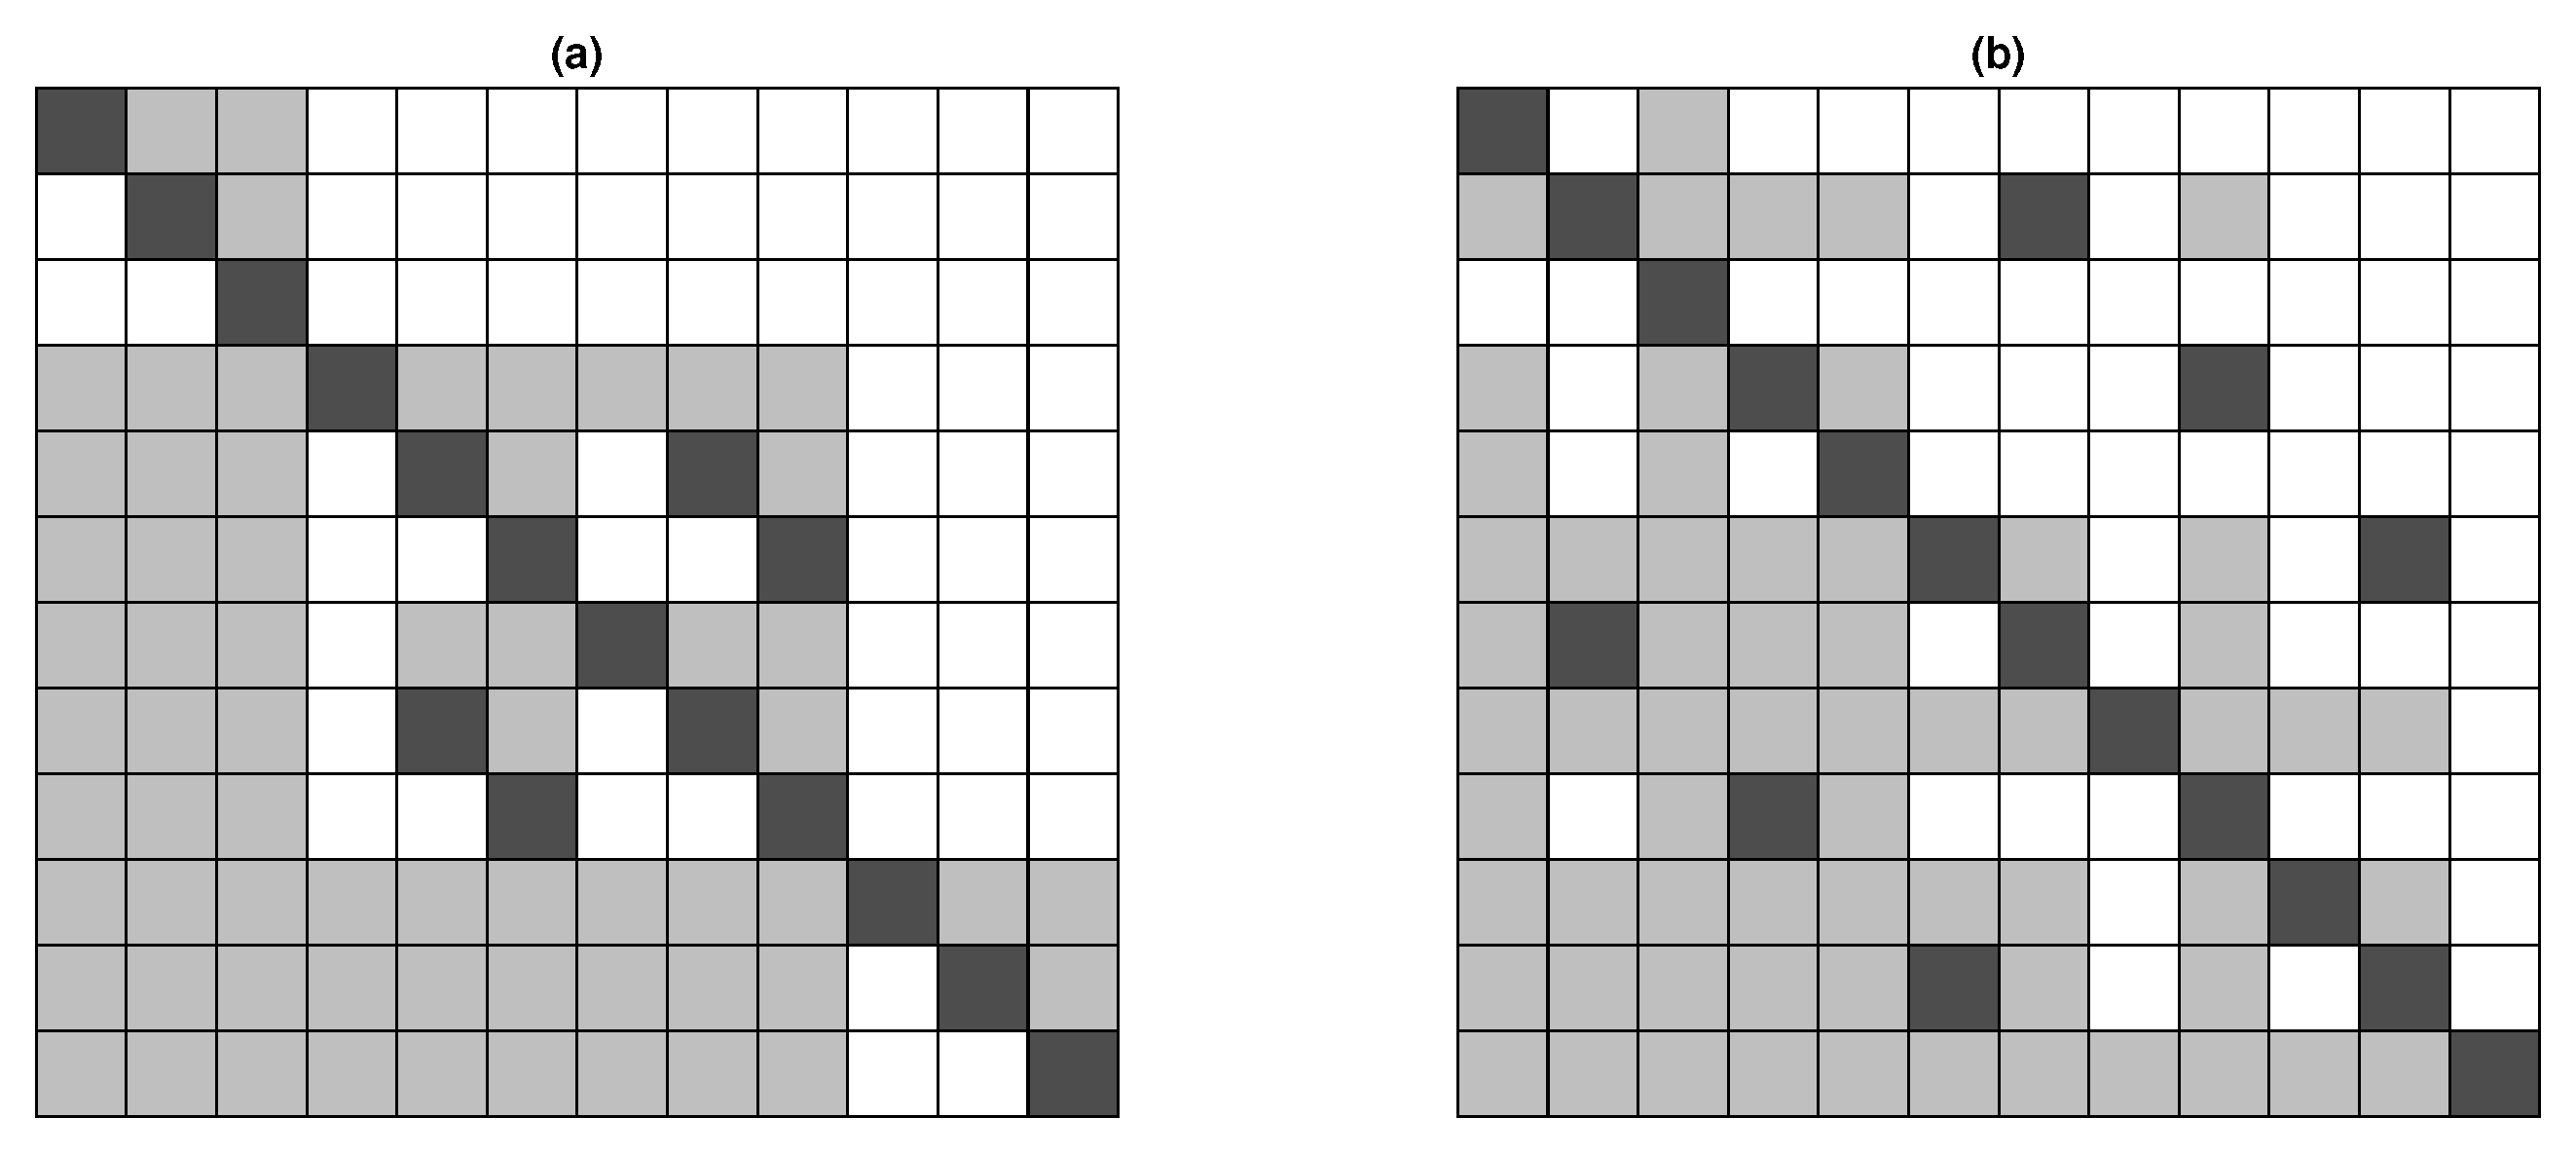
The expert performed 36 pairwise comparisons of the characteristic objects. As a result, the Matrix of Expert Judgment (MEJ) was determined, where each value was calculated using the Equation (21). The MEJ matrices are presented in Figure 5 and Figure 6, where the values of either 0, or 1 are represented by white, black and gray boxes, respectively. Consequently, the vector of the Summed Judgements (SJ) was calculated using Equation (22), and hence, it was to used to calculate the values of preference (P), presented in Table 3.
4.2. Engine Assessment Model
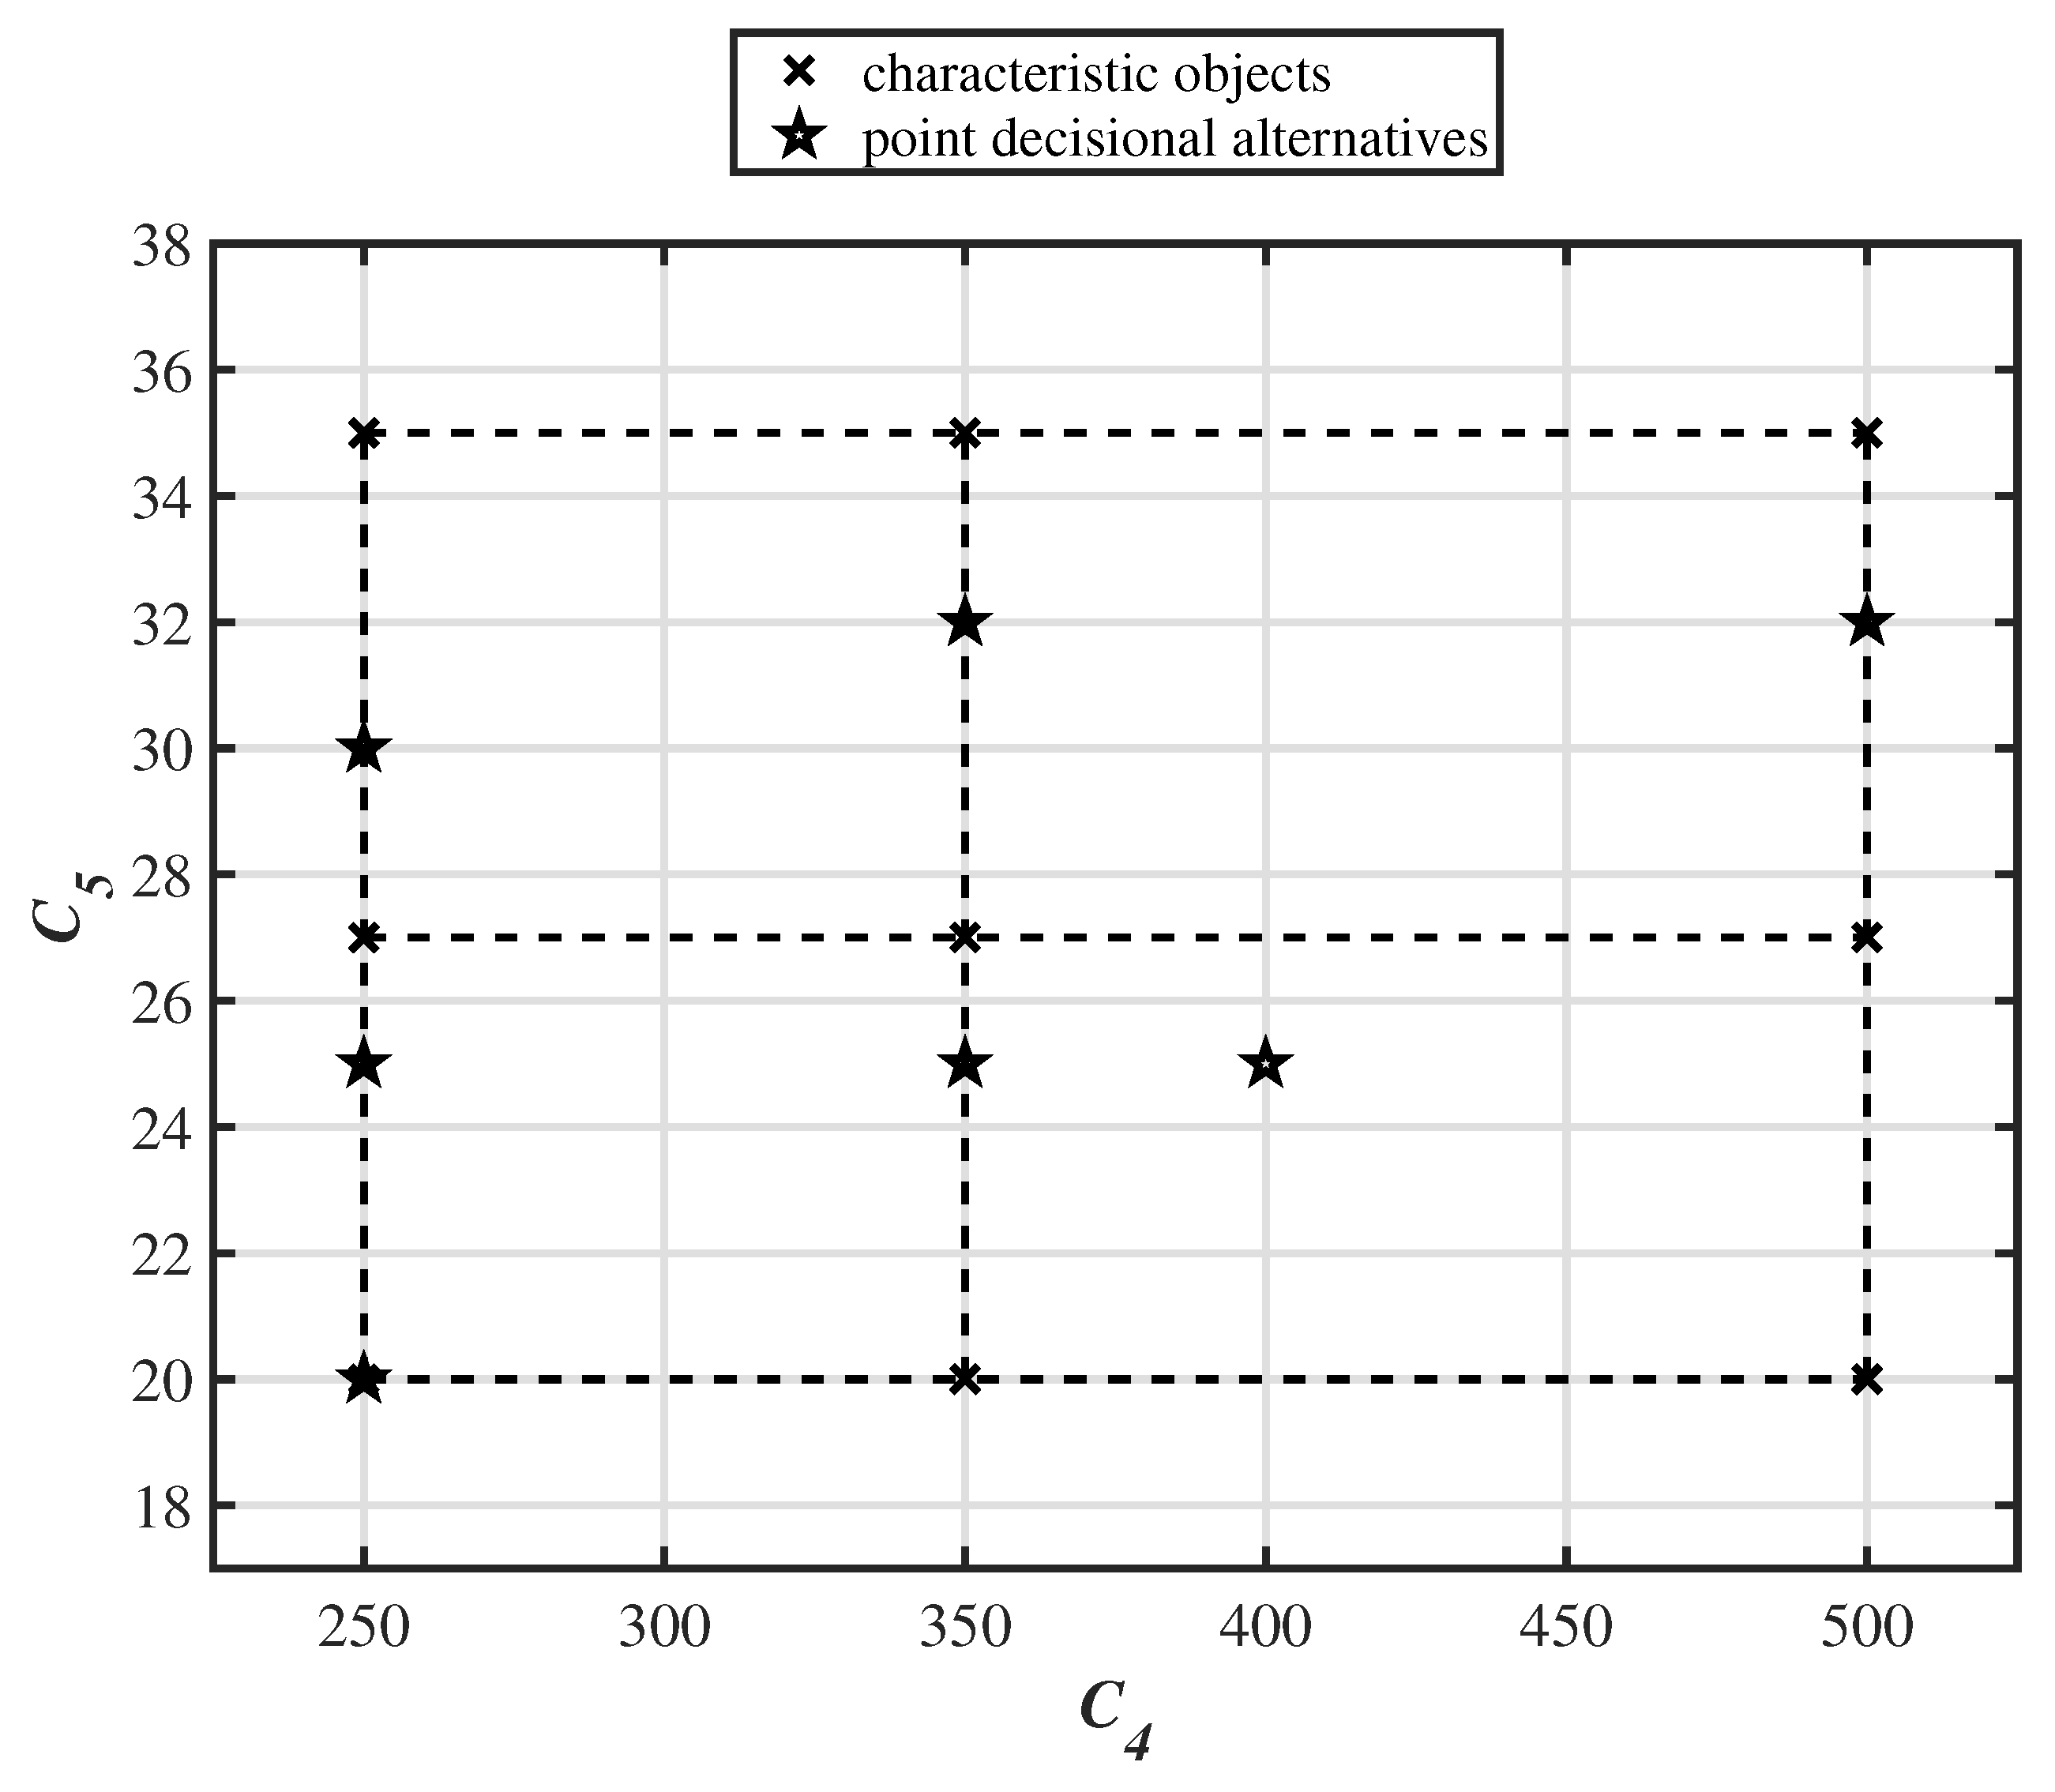
The expert identified two criteria for the engine assessment model, namely engine power, expressed in Watts [W] and maximum speed reached by electric bicycle in electric mode expressed in kilometers per hour [km/h]. Both are profit type criteria, hence as stated before, with the increase in values, preference increases. The triangular fuzzy numbers of criteria and are depicted in Figure 3. The characteristic objects – are created using the Cartesian product of the fuzzy numbers’ cores of criteria and and are presented in Table 4. The space of the problem, including characteristic objects and alternatives, is presented in Figure 7.
4.3. Comfort of Usage Assessment Model
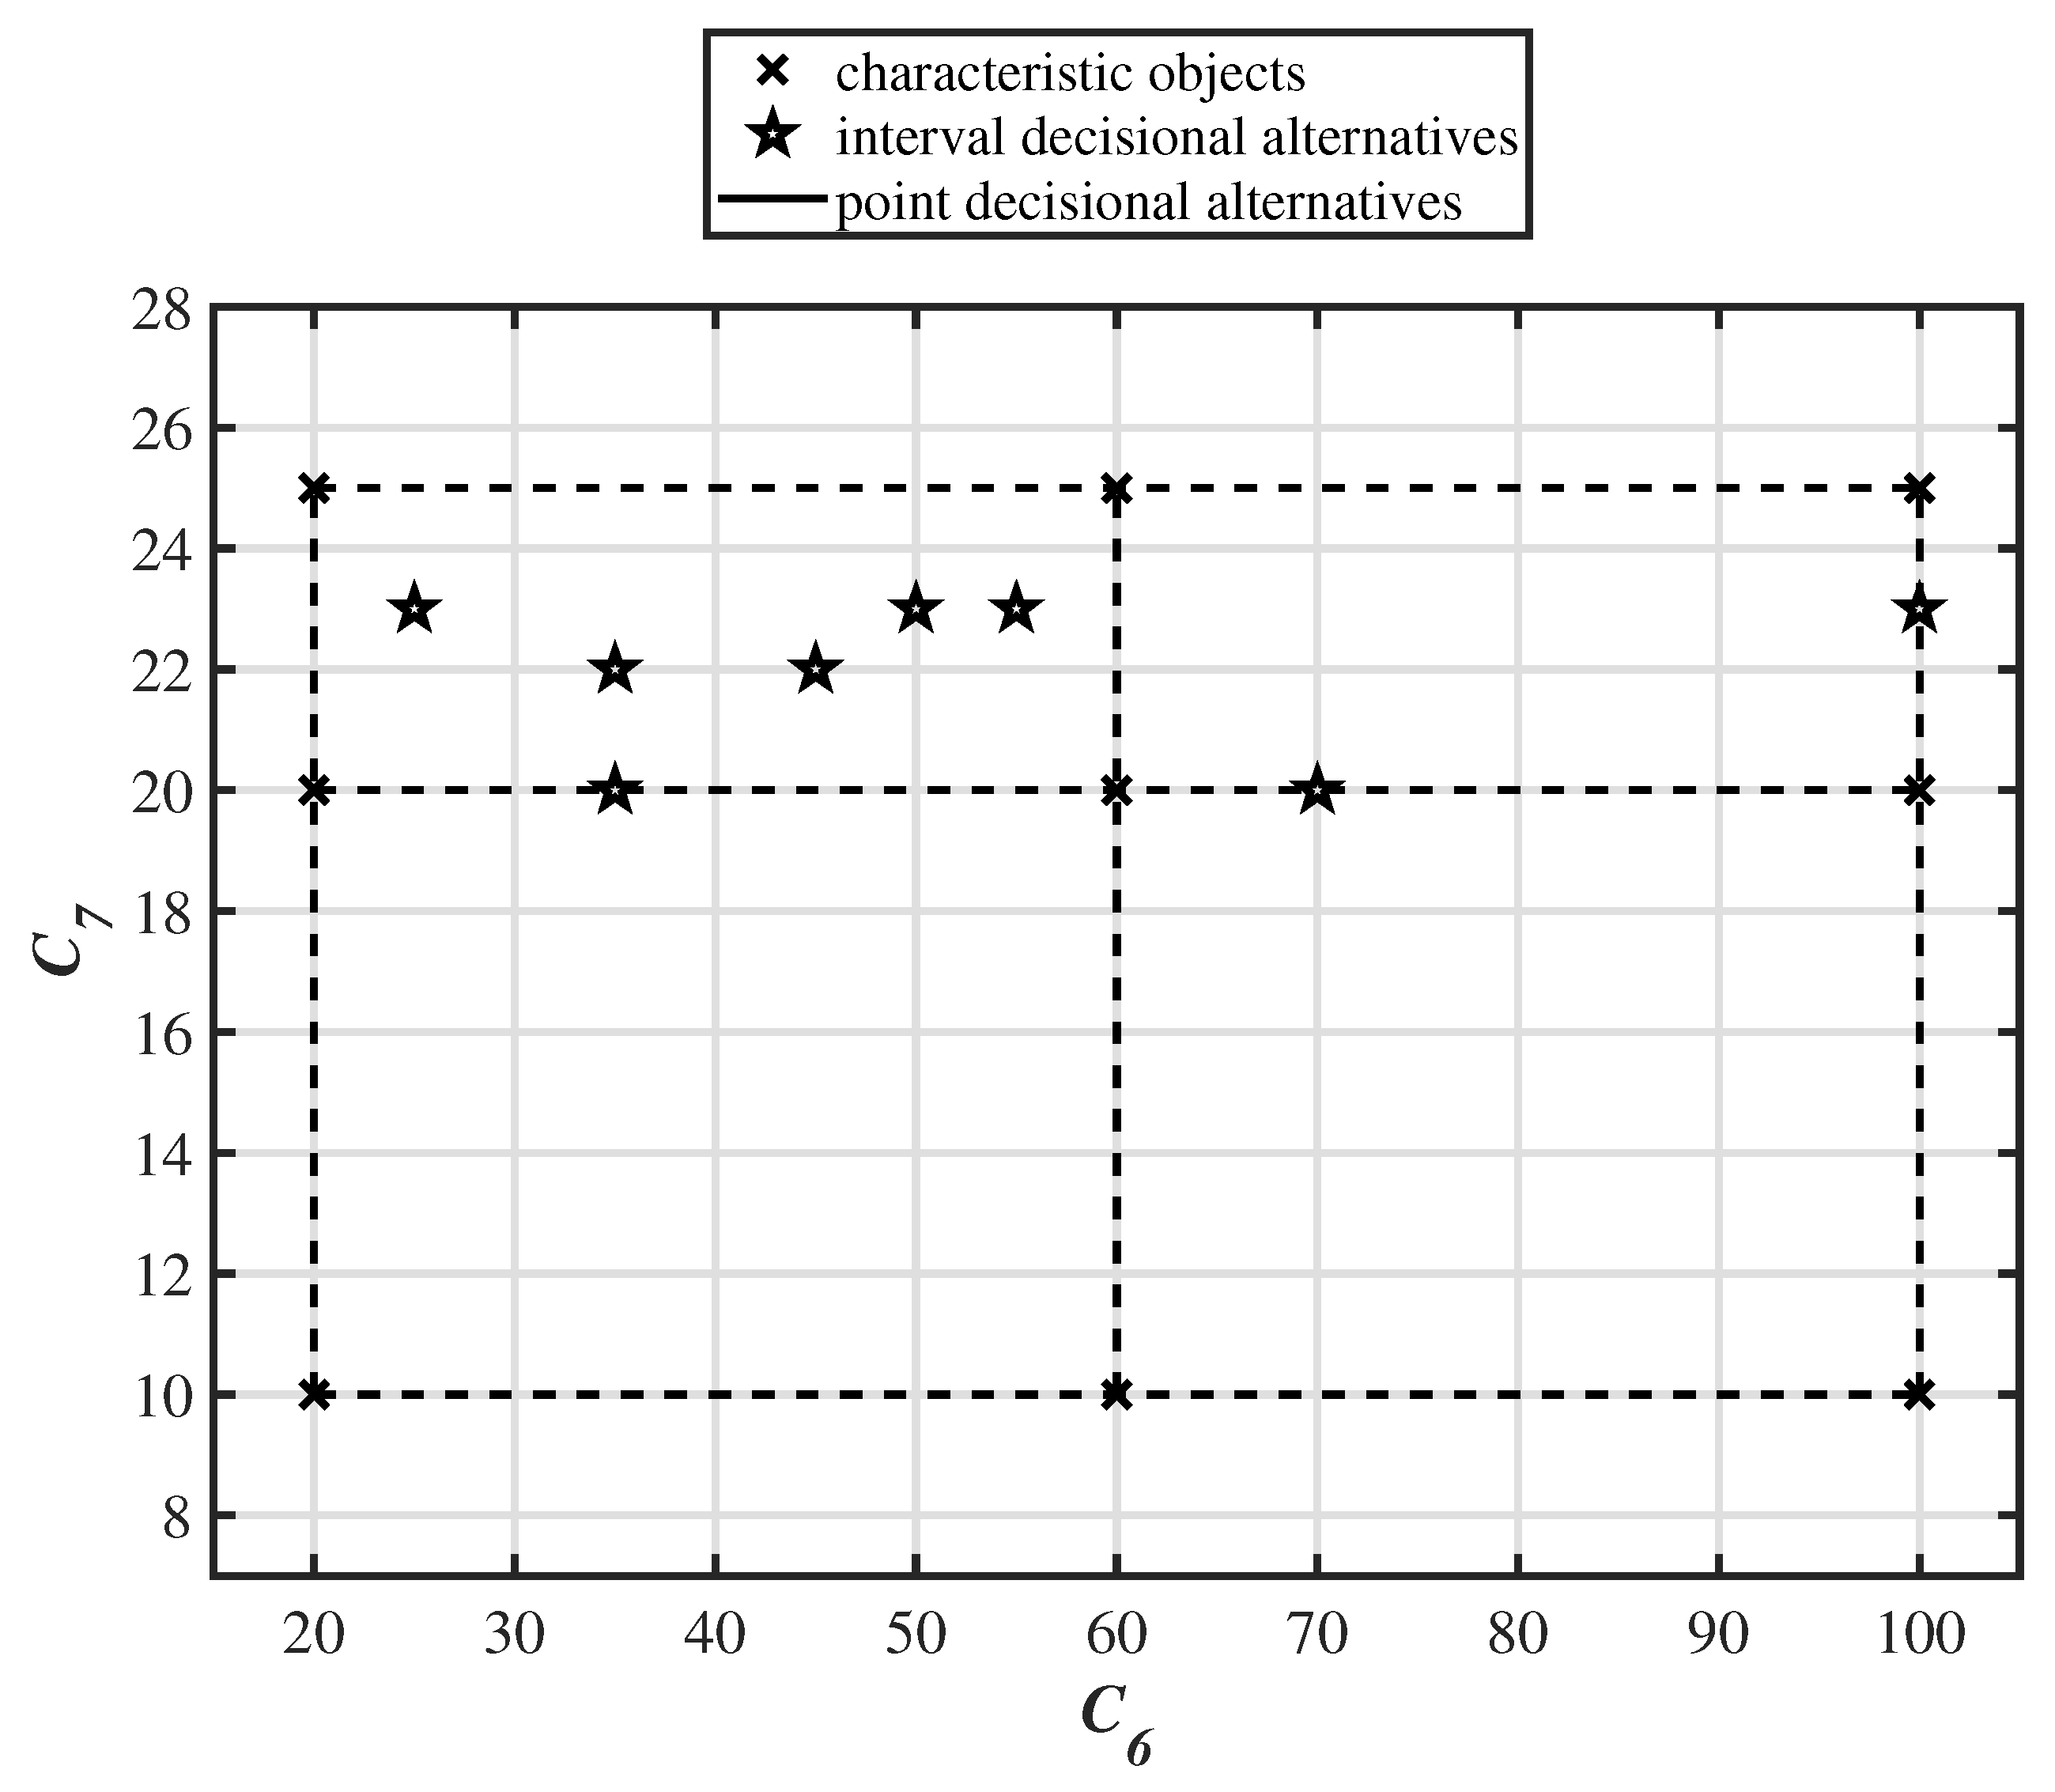
Two important criteria were selected for the engine assessment model, range, expressed in kilometers [km] and weight of the bicycle in kilograms [kg]. The first one is a profit type criterion and the second one is a cost-type criterion. The triangular fuzzy numbers of criteria and are shown in Figure 3. The characteristic objects – are created using the Cartesian product of the fuzzy numbers’ cores of criteria and and are presented in Table 5. The space of the problem, including characteristic objects and alternatives, is presented in Figure 8.
4.4. Drive System Assessment Model
For the model of drive system assessment, the variables from previous models are used, namely battery effectiveness assessment model and the engine assessment model, and respectively. Additionally, the third criterion is included—the number of gears available in the bicycle derailleur system . The aggregated variables , and criterion are all profit type. The triangular fuzzy numbers of criterion is presented in Figure 3. The characteristic objects – are presented in Table 6.
4.5. Electric Bicycle Assessment Model
The final model for the electric bicycle assessment has three input variables. Two aggregated variables were used, the output variable from the drive system assessment and the output variable from the comfort of usage assessment. Moreover, we include the third input—the criterion price . The aggregated variables , are both profit type, whereas the criterion is cost type. The triangular fuzzy numbers of criterion is shown in Figure 3. The characteristic objects – are presented in Table 7.
4.6. Final Ranking
The final preference and the ranking for the ten considered alternatives of electric bicycles are presented in Table 8. Concerning the case with the full knowledge, when we always assume the best value of the interval, then the best variant is bicycle Emu Crossbar (preference value ), slightly exceeding the Rattan bicycle (preference value ). Undoubtedly, the worst alternative is the ANCHEER Plus model (preference value ). The second worst, however, not that close to the least optimal one, is the Xiaomi QiCycle model (preference value ). The Emu Crossbar scored such high results due to the fact, that has the most extended range (up to 100 km) and the highest battery capacity (14.5 Ah), which outweighs its disadvantages, such as high price. However, when considering Rattan model (second best), it is worth stating that, although it has lower battery capacity than Emu Crossbar, it has also lower charging time (which is cost type), hence the overall preference for battery assessment is greater in Rattan model. Compared to Emu, Rattan is also two times cheaper and has a higher preference regarding engine assessment. However, its rather average range contributed to only second place.
However, these were the rankings under assuming full knowledge as the best value from the uncertainty intervals. When we do take them into account, the final ranking has to be interpreted differently—taking into example the Emu Crossbar, which the final preference interval is equal to [0.4219, 0.6119]. While considering the highest values from intervals made Emu clearly the the first, it is worth noticing how broad the interval is, mainly due to the fact that his range and his preference value for comfort of usage assessment have extensive intervals, 55–100 (km) and [0.3781, 0.8000], respectively. Thus, under some degree of uncertainty, the final ranking varies greatly. Hence, the Emu still might be first, but one has to be aware of the fact that considering the lowest values from the interval, Emu belongs closer to the end of the ranking.
On the contrary, the Rattan bicycle (second place), which also exhibits the problem of uncertainty, has a much lower range of the interval [0.5800, 0.6056]. Even with the lowest value, Rattan still has a high preference value (), whereas Emu had (). Therefore, interval numbers can be a useful indicator of the stability of the final ranking, under conditions of incomplete knowledge, which can easily change the definitive ranking of alternatives.
4.7. Practical Exploitation of the Identified Model
The proposed methodological aspects of the identification of the assessment model in the conditions of incomplete knowledge are presented on a set of 10 arbitrarily selected decision variants. In practice, the number of possible decision options is often much higher. Therefore, as a result of the analysis of literature and websites [81,82,83,84,85,86,87], the set of evaluated variants was extended by another 54 decision alternatives. The extended set was assessed using the identified model and decision-making system available on wwww.comet.edu.pl. Table 9 presents the analyzed set together with the determined assessments of preferences (P). The worst option was the California Bicycle Factory Retro S bike (with 0.3669 point). It had a low battery capacity (it was 8 ah), which was not compensated by charging time (it was 4 hours), low number of gears, low engine power, high weight, high price ($2499) and average maximum speed. The next variant was only improved by 0.0229 of point. On the other hand, the best option was the Blix Sol bike, which was rated 0.687 of point. The parameters were mostly medium; however, the low price and big range were crucial to the victory of this option.
It can often happen that some parameters describing variants are uncertain, e.g., the maximum distance may depend on the weight of the passenger, orography of the city and the climate (cold climate shorter distance). The given catalog values are very often averaged experimental results, therefore it seems justified to use interval numbers. It is difficult to assume that the vehicle will be moved in the same conditions as in laboratory tests.
5. Conclusions
Sustainable development is becoming a more complex problem, one that requires a modern approach with the use of various methods. In this paper, the sustainable city transport challenge was addressed in the context of selecting the electric bicycle. Methodically, the paper presents a successful attempt to adapt an MCDA method called COMET to the needs of evaluation of sustainable transport.
The fuzzy set theory with the COMET method was used to investigate and create the decision model under the condition of full knowledge and with some degree of uncertainty, using the interval numbers. As a result of the preformed research, also a practical contribution in the sustainable transport domain was obtained. The presented model for ebikes evaluation based on an extensive set of available options contains important domain knowledge supporting the decision makers in the process of evaluation and selection of proper variant of sustainable transport. Eight criteria were taken into consideration (battery capacity, charging time, number of gears, engine power, maximum speed, range, weight, and price); however, to reduce the amount of pairwise comparison, the final assessment model was restructured into sub-models, significantly reducing the complexity of the problem and restructuring the criteria into groups. Ten alternatives to electric bicycles were examined in details (from an extensive set of bikes presented in Table 9. The practical implications in the domain of sustainable transport provide a reference model for ebikes. It is worth adding that the proposed approach has considerable practical usability. The freely available software on the comet.edu.pl website results in the model being easy to validate even for non-experienced users.
For further study, it would be valuable to extend this model with additional criteria and sub-models, creating an even more detailed selection of electric bicycles. Additionally, further works concerning the incomplete knowledge case could be performed.
Author Contributions
Conceptualization: W.S., J.W.; Formal analysis: W.S., K.P.; Investigation: W.S., K.P., J.W.; Methodology: W.S., K.P.; Supervision: J.W.; Validation: J.W.; Visualization: W.S.; Writing—original draft: W.S., K.P.; Writing—review editing: J.W.
Acknowledgments
The work was supported by the National Science Centre, Decision No. 2016/23/N/HS4/01931 (WS), and by the project financed within the framework of the program of the Minister of Science and Higher Education under the name “Regional Excellence Initiative” in the years 2019-2022, project number 001/RID/2018/19, the amount of financing PLN 10.684.000,00 (JW).
Conflicts of Interest
The authors declare no conflict of interest.
References
- Conway, G. The Doubly Green Revolution: Food for All in the Twenty-First Century; Cornell University Press: Ithaca, NY, USA, 2019. [Google Scholar]
- Abdul-Manan, A.F. Uncertainty and differences in GHG emissions between electric and conventional gasoline vehicles with implications for transport policy making. Energy Policy 2015, 87, 1–7. [Google Scholar] [CrossRef]
- Rode, P.; Floater, G.; Thomopoulos, N.; Docherty, J.; Schwinger, P.; Mahendra, A.; Fang, W. Accessibility in cities: Transport and urban form. In Disrupting Mobility; Springer: Cham, Switzerland, 2017; pp. 239–273. [Google Scholar]
- Griggs, D.; Stafford-Smith, M.; Gaffney, O.; Rockström, J.; Öhman, M.C.; Shyamsundar, P.; Steffen, W.; Glaser, G.; Kanie, N.; Noble, I. Policy: Sustainable development goals for people and planet. Nature 2013, 495, 305–307. [Google Scholar] [CrossRef] [PubMed]
- Kampa, M.; Castanas, E. Human health effects of air pollution. Environ. Pollut. 2008, 151, 362–367. [Google Scholar] [CrossRef] [PubMed]
- Landrigan, P.J.; Fuller, R.; Acosta, N.J.; Adeyi, O.; Arnold, R.; Baldé, A.B.; Bertollini, R.; Bose-O’Reilly, S.; Boufford, J.I. The Lancet Commission on pollution and health. Lancet 2018, 391, 462–512. [Google Scholar] [CrossRef] [Green Version]
- Rees, W.; Wackernagel, M. Urban ecological footprints: Why cities cannot be sustainable—and why they are a key to sustainability. In Urban Ecology; Springer: Boston, MA, USA, 2008; pp. 537–555. [Google Scholar]
- Goldman, T.; Gorham, R. Sustainable urban transport: Four innovative directions. Technol. Soc. 2006, 28, 261–273. [Google Scholar] [CrossRef]
- Zhao, P. Sustainable urban expansion and transportation in a growing megacity: Consequences of urban sprawl for mobility on the urban fringe of Beijing. Habitat Int. 2010, 34, 236–243. [Google Scholar] [CrossRef]
- Pojani, D.; Stead, D. Sustainable Urban Transport in the Developing World: Beyond Megacities. Sustainability 2015, 7, 7784–7805. [Google Scholar] [CrossRef] [Green Version]
- De Gruyter, C.; Currie, G.; Rose, G. Sustainability Measures of Urban Public Transport in Cities: A World Review and Focus on the Asia/Middle East Region. Sustainability 2016, 9, 43. [Google Scholar] [CrossRef]
- Hidalgo, D.; Huizenga, C. Implementation of sustainable urban transport in Latin America. Res. Transp. Econ. 2013, 40, 66–77. [Google Scholar] [CrossRef]
- Mehar, S.; Zeadally, S.; Rémy, G.; Senouci, S.M. Sustainable Transportation Management System for a Fleet of Electric Vehicles. IEEE Trans. Intell. Transp. Syst. 2015, 16, 1401–1414. [Google Scholar] [CrossRef]
- Banister, D. Unsustainable Transport: City Transport in the New Century; Routledge: Abingdon, UK, 2005. [Google Scholar]
- Barfor, M.B.; Salling, K.B. A new composite decision support framework for strategic and sustainable transport appraisals. Transp. Res. Part A Policy Pract. 2018, 126, 2248–2260. [Google Scholar]
- Pérez, J.C.; Carrillo, M.H.; Montoya-Torres, J.R. Multi-criteria approaches for urban passenger transport systems: A literature review. Ann. Oper. Res. 2015, 226, 69–87. [Google Scholar] [CrossRef]
- Rajak, S.; Parthiban, P.; Dhanalakshmi, R. Sustainable transportation systems performance evaluation using fuzzy logic. Ecol. Indic. 2016, 71, 503–513. [Google Scholar] [CrossRef]
- Mukherjee, S. Selection of Alternative Fuels for Sustainable Urban Transportation under Multi-criteria Intuitionistic Fuzzy Environment. Fuzzy Inf. Eng. 2017, 9, 117–135. [Google Scholar] [CrossRef] [Green Version]
- Mardani, A.; Zavadskas, E.K.; Khalifah, Z.; Jusoh, A. Multiple criteria decision-making techniques in transportation systems: A systematic review of the state of the art literature. Transport 2016, 31, 359–385. [Google Scholar] [CrossRef]
- Sałabun, W.; Karczmarczyk, A. Using the COMET Method in the Sustainable City Transport Problem: An Empirical Study of the Electric Powered Cars. Procedia Comput. Sci. 2018, 126, 2248–2260. [Google Scholar] [CrossRef]
- Awasthia, A.; Chauhan, S.S. Using AHP and Dempster–Shafer theory for evaluating sustainable transport solutions. Environ. Model. Softw. 2011, 26, 787–796. [Google Scholar] [CrossRef]
- Aljohani, K.; Thompson, R.G. A Stakeholder-Based Evaluation of the Most Suitable and Sustainable Delivery Fleet for Freight Consolidation Policies in the Inner-City Area. Sustainability 2019, 11, 124. [Google Scholar] [CrossRef]
- Sałabun, W.; Wątróbski, J.; Piegat, A. Identification of a Multi-criteria Model of Location Assessment for Renewable Energy Sources. In Artificial Intelligence and Soft Computing; Lecture Notes in Computer Science; Springer: Cham, Switzerland, 2016; Volume 9692, pp. 321–332. [Google Scholar]
- Throne-Holst, H.; Stø, E.; Strandbakken, P. The role of consumption and consumers in zero emission strategies. J. Clean. Prod. 2007, 15, 1328–1336. [Google Scholar] [CrossRef]
- Wątróbski, J.; Ziemba, P.; Jankowski, J.; Zioło, M. Green Energy for a Green City—A Multi-Perspective Model Approach. Sustainability 2016, 8, 702. [Google Scholar] [CrossRef]
- Soares, J.; Canizes, B.; Lobo, C.; Vale, Z.; Morais, H. Electric vehicle scenario simulator tool for smart grid operators. Energies 2012, 5, 1881–1899. [Google Scholar] [CrossRef]
- Ziemba, P. Towards Strong Sustainability Management—A Generalized PROSA Method. Sustainability 2019, 11, 1555. [Google Scholar] [CrossRef]
- Ziemba, P.; Wątróbski, J.; Zioło, M.; Karczmarczyk, A. Using the PROSA Method in Offshore Wind Farm Location Problems. Energies 2017, 10, 1755. [Google Scholar] [CrossRef]
- Wątróbski, J.; Małecki, K.; Kijewska, K.; Iwan, S.; Karczmarczyk, A.; Thompson, R.G. Multi-Criteria Analysis of Electric Vans for City Logistics. Sustainability 2017, 9, 1453. [Google Scholar] [CrossRef]
- Sałabun, W.; Karczmarczyk, A.; Wątróbski, J. Decision-Making using the Hesitant Fuzzy Sets COMET Method: An Empirical Study of the Electric City Buses Selection. In Proceedings of the 2018 IEEE Symposium Series on Computational Intelligence (SSCI), Bangalore, India, 18–21 November 2018; pp. 1485–1492. [Google Scholar]
- Ziemba, P. Inter-Criteria Dependencies-Based Decision Support in the Sustainable wind Energy Management. Energies 2019, 12, 749. [Google Scholar] [CrossRef]
- Courty, N.; Flamary, R.; Tuia, D.; Rakotomamonjy, A. Optimal transport for domain adaptation. IEEE Trans. Pattern Anal. Mach. Intell. 2016, 39, 1853–1865. [Google Scholar] [CrossRef]
- De Goes, F.; Breeden, K.; Ostromoukhov, V.; Desbrun, M. Blue noise through optimal transport. ACM Trans. Graph. (TOG) 2012, 31, 171. [Google Scholar] [CrossRef]
- Kontou, E.; Yin, Y.; Lin, Z. Socially optimal electric driving range of plug-in hybrid electric vehicles. Transp. Res. Part D Transp. Environ. 2015, 39, 114–125. [Google Scholar] [CrossRef] [Green Version]
- Kenworthy, J.R. The eco-city: Ten key transport and planning dimensions for sustainable city development. Environ. Urban. 2006, 18, 67–85. [Google Scholar] [CrossRef]
- Chen, H.; Jia, B.; Lau, S.S.Y. Sustainable urban form for Chinese compact cities: Challenges of a rapid urbanized economy. Habitat Int. 2008, 32, 28–40. [Google Scholar] [CrossRef]
- Suzuki, H.; Cervero, R.; Iuchi, K. Transforming Cities with Transit: Transit and Land-Use Integration for Sustainable Urban Development; The World Bank: Washington, DC, USA, 2013. [Google Scholar]
- Bagaeen, S. Brand Dubai: The instant city; or the instantly recognizable city. Int. Plan. Stud. 2007, 12, 173–197. [Google Scholar] [CrossRef]
- Nidumolu, R.; Prahalad, C.K.; Rangaswami, M.R. Why sustainability is now the key driver of innovation. Harv. Bus. Rev. 2009, 87, 56–64. [Google Scholar]
- Coaffee, J. Risk, resilience, and environmentally sustainable cities. Energy Policy 2008, 36, 4633–4638. [Google Scholar] [CrossRef]
- Dekker, R.; Bloemhof, J.; Mallidis, I. Operations Research for green logistics–An overview of aspects, issues, contributions and challenges. Eur. J. Oper. Res. 2012, 219, 671–679. [Google Scholar] [CrossRef]
- Awasthi, A.; Chauhan, S.S. A hybrid approach integrating Affinity Diagram, AHP and fuzzy TOPSIS for sustainable city logistics planning. Appl. Math. Model. 2012, 36, 573–584. [Google Scholar] [CrossRef]
- Schliwa, G.; Armitage, R.; Aziz, S.; Evans, J.; Rhoades, J. Sustainable city logistics—Making cargo cycles viable for urban freight transport. Res. Transp. Bus. Manag. 2015, 15, 50–57. [Google Scholar] [CrossRef]
- Crainic, T.G.; Ricciardi, N.; Storchi, G. Models for evaluating and planning city logistics systems. Transp. Sci. 2009, 43, 432–454. [Google Scholar] [CrossRef]
- Richardson, B.C. Sustainable transport: Analysis frameworks. J. Transp. Geogr. 2005, 13, 29–39. [Google Scholar] [CrossRef]
- Kelly, C.; May, A.D.; Jopson, A. The development of an option generation tool to identify potential transport policy packages. Transp. Policy 2008, 15, 361–371. [Google Scholar] [CrossRef]
- Firnkorn, J.; Müller, M. What will be the environmental effects of new free-floating car-sharing systems? The case of car2go in Ulm. Ecol. Econ. 2011, 70, 1519–1528. [Google Scholar] [CrossRef]
- Firnkorn, J.; Müller, M. Selling mobility instead of cars: New business strategies of automakers and the impact on private vehicle holding. Bus. Strategy Environ. 2012, 21, 264–280. [Google Scholar] [CrossRef]
- Ampudia-Renuncio, M.; Guirao, B.; Molina, R. The impact of free-floating carsharing on sustainable cities: Analysis of first experiences in Madrid with the university campus. Sustain. Cities Soc. 2018, 43, 462–475. [Google Scholar] [CrossRef]
- Kopp, J.; Gerike, R.; Axhausen, K.W. Do sharing people behave differently? An empirical evaluation of the distinctive mobility patterns of free-floating car-sharing members. Transportation 2015, 42, 449–469. [Google Scholar] [CrossRef]
- Lehmann, S. Green urbanism: Formulating a series of holistic principles. SAPI EN. S. Surv. Perspect. Integr. Environ. Soc. 2010, 3, 2. [Google Scholar]
- Cherry, C.R.; Weinert, J.X.; Xinmiao, Y. Comparative environmental impacts of electric bikes in China. Transp. Res. Part D Transp. Environ. 2009, 14, 281–290. [Google Scholar] [CrossRef] [Green Version]
- Buehler, R.; Pucher, J.; Gerike, R.; Götschi, T. Reducing car dependence in the heart of Europe: Lessons from Germany, Austria, and Switzerland. Transp. Rev. 2017, 37, 4–28. [Google Scholar] [CrossRef]
- Offer, G.J.; Contestabile, M.; Howey, D.A.; Clague, R.; Brandon, N.P. Techno-economic and behavioural analysis of battery electric, hydrogen fuel cell and hybrid vehicles in a future sustainable road transport system in the UK. Energy Policy 2011, 39, 1939–1950. [Google Scholar] [CrossRef] [Green Version]
- Wątróbski, J.; Sałabun, W.; Karczmarczyk, A.; Wolski, W. Sustainable decision-making using the COMET method: An empirical study of the ammonium nitrate transport management. In Proceedings of the 2017 Federated Conference on Computer Science and Information Systems (FedCSIS), Prague, Czech Republic, 3–6 September 2017; pp. 949–958. [Google Scholar]
- Triantaphyllou, E. Multi-criteria decision making methods. In Multi-Criteria Decision Making Methods: A Comparative Study; Springer: Boston, MA, USA, 2000; pp. 5–21. [Google Scholar]
- Wang, X.; Triantaphyllou, E. Ranking irregularities when evaluating alternatives by using some ELECTRE methods. Omega 2008, 36, 45–63. [Google Scholar] [CrossRef]
- Zadeh, L.A. Fuzzy sets. Inf. Control 1965, 8, 338–353. [Google Scholar] [CrossRef] [Green Version]
- Piegat, A.; Sałabun, W. Comparative analysis of MCDM methods for assessing the severity of chronic liver disease. In International Conference on Artificial Intelligence and Soft Computing; Springer: Cham, Switzerland, 2015; pp. 228–238. [Google Scholar]
- Jankowski, J.; Sałabun, W.; Wątróbski, J. Identification of a multi-criteria assessment model of relation between editorial and commercial content in web systems. In Multimedia and Network Information Systems; Springer International Publishing: Cham, Switzerland, 2017; pp. 295–305. [Google Scholar]
- Sałabun, W.; Napierała, M.; Bykowski, J. The Identification of Multi-Criteria Model of the Signicficance of Drainage Pumping Stations in Poland. Acta Scientiarum Polonorum. Form. Circumiectus 2015, 14, 147–163. [Google Scholar]
- Faizi, S.; Rashid, T.; Sałabun, W.; Zafar, S.; Wątróbski, J. Decision making with uncertainty using hesitant fuzzy sets. Int. J. Fuzzy Syst. 2018, 20, 93–103. [Google Scholar] [CrossRef]
- Sałabun, W. Reduction in the number of comparisons required to create matrix of expert judgment in the comet method. Manag. Prod. Eng. Rev. 2014, 5, 62–69. [Google Scholar] [CrossRef]
- Faizi, S.; Sałabun, W.; Rashid, T.; Wątróbski, J.; Zafar, S. Group Decision-Making for Hesitant Fuzzy Sets Based on Characteristic Objects Method. Symmetry 2017, 9, 136. [Google Scholar] [CrossRef]
- Pedrycz, W.; Ekel, P.; Parreiras, R. Fuzzy Multicriteria Decision-Making: Models, Methods and Applications; John Wiley Sons: Hoboken, NJ, USA, 2011. [Google Scholar]
- Piegat, A. Fuzzy Modeling and Control (Studies in Fuzziness and Soft Computing); Physica: Heidelberg, Germany, 2001; 742p. [Google Scholar]
- Ross, T.J. Properties of membership functions, fuzzification, and defuzzification. In Fuzzy Logic with Engineering Applications, 3rd ed.; John Wiley Sons: Hoboken, NJ, USA, 2010; pp. 89–116. [Google Scholar]
- Sałabun, W.; Piegat, A. Comparative analysis of MCDM methods for the assessment of mortality in patients with acute coronary syndrome. Artif. Intell. Rev. 2017, 48, 557–571. [Google Scholar] [CrossRef]
- Salmeron-Manzano, E.; Manzano-Agugliaro, F. The electric bicycle: Worldwide research trends. Energies 2018, 11, 1894. [Google Scholar] [CrossRef]
- Apostolou, G.; Reinders, A.; Geurs, K. An overview of existing experiences with solar-powered e-bikes. Energies 2018, 11, 2129. [Google Scholar] [CrossRef]
- Manoj, E.; Isa, D.; Arelhi, R. Supercapacitor/battery hybrid powered electric bicycle via a smart boost converter. World Electr. Veh. J. 2010, 4, 280–286. [Google Scholar] [CrossRef]
- Berg, J.; Henriksson, M.; Ihlström, J. Comfort First! Vehicle-Sharing Systems in Urban Residential Areas: The Importance for Everyday Mobility and Reduction of Car Use among Pilot Users. Sustainability 2019, 11, 2521. [Google Scholar] [CrossRef]
- Baure, G.; Dubarry, M. Synthetic vs. Real Driving Cycles: A Comparison of Electric Vehicle Battery Degradation. Batteries 2019, 5, 42. [Google Scholar] [CrossRef]
- Timmermans, J.M.; Matheys, J.; Lataire, P.; Van Mierlo, J.; Cappelle, J. A comparative study of 12 electrically assisted bicycles. World Electr. Veh. J. 2009, 3, 93–103. [Google Scholar] [CrossRef]
- Florez, D.; Carrillo, H.; Gonzalez, R.; Herrera, M.; Hurtado-Velasco, R.; Cano, M.; Roa, S.; Manrique, T. Development of a Bike-Sharing System Based on Pedal-Assisted Electric Bicycles for Bogota City. Electronics 2018, 7, 337. [Google Scholar] [CrossRef]
- Roemer, F.; Mrosek, M.; Schmalfuss, S.; Lienkamp, M. New Approach for an Easily Detachable Electric Drive Unit for Off-the-Shelf Bicycles. World Electr. Veh. J. 2018, 9, 37. [Google Scholar] [CrossRef]
- Jung, H.; Silva, R.; Han, M. Scaling Trends of Electric Vehicle Performance: Driving Range, Fuel Economy, Peak Power Output, and Temperature Effect. World Electr. Veh. J. 2018, 9, 46. [Google Scholar] [CrossRef]
- Ling, Z.; Cherry, C.; MacArthur, J.; Weinert, J. Differences of cycling experiences and perceptions between e-bike and bicycle users in the United States. Sustainability 2017, 9, 1662. [Google Scholar] [CrossRef]
- Lee, K.; Chae, J.; Kim, J. A Courier Service with Electric Bicycles in an Urban Area: The Case in Seoul. Sustainability 2019, 11, 1255. [Google Scholar] [CrossRef]
- Wątróbski, J.; Jankowski, J.; Ziemba, P.; Karczmarczyk, A.; Zioło, M. Generalised framework for multi-criteria method selection. Omega 2019, 86, 107–124. [Google Scholar] [CrossRef]
- Car and Bike. Available online: https://auto.ndtv.com/compare-bikes (accessed on 5 June 2019).
- The Best Electric Bikes for 2019. Available online: https://www.digitaltrends.com/cool-tech/best-electric-bikes/ (accessed on 5 June 2019).
- Compare Electric Bikes. Available online: https://electricbikereview.com/compare/ (accessed on 5 June 2019).
- Best Electric Bike 2019: 10 e-Bikes You Should Be Considering. Available online: https://www.bikeradar.com/advice/buyers-guides/best-electric-bikes/ (accessed on 5 June 2019).
- The Best E-Bikes You Can Buy Right Now. Available online: https://www.bicycling.com/bikes-gear/a22132137/best-electric-bikes/ (accessed on 5 June 2019).
- Electric Bike. Available online: https://www.electricbike.com/ (accessed on 5 June 2019).
- Electric Bikes Compared: How to Buy the Best E-bike. Available online: https://www.cnet.com/news/electric-bikes-compared-how-to-buy-the-best-ebike/ (accessed on 5 June 2019).
Figure 1.
The procedure of the Characteristic Objects Method (COMET) to identify decision-making model.
Figure 1.
The procedure of the Characteristic Objects Method (COMET) to identify decision-making model.

Figure 2.
The hierarchical structure of the electric bicycle assessment problem.

Figure 3.
The sets of triangular numbers for each considered criterion and the aggregated criteria , where ; .
Figure 3.
The sets of triangular numbers for each considered criterion and the aggregated criteria , where ; .

Figure 4.
The space of the problem for the identification of .

Figure 5.
The matrix of expert judgement for (a), (b), and (c).

Figure 6.
The matrix of expert judgement for (a), and P (b).

Figure 7.
The space of the problem for the identification of .

Figure 8.
The space of the problem for the identification of .


Table 1.
Selected criteria – and their characteristic values {low, medium, high}.
| Name | Unit | Low | Medium | High | |
|---|---|---|---|---|---|
| battery capacity | Ah | 4 | 9 | 15 | |
| charging time | hours | 3 | 5 | 8 | |
| number of gears | units | 1 | 7 | 21 | |
| engine power | W | 250 | 350 | 500 | |
| maximum speed | km/h | 20 | 27 | 35 | |
| range | km | 20 | 60 | 100 | |
| weight | kg | 10 | 20 | 25 | |
| price | USD | 300 | 2500 | 6300 |
Table 2.
The performance table of the alternatives –.
| Name | |||||||||
|---|---|---|---|---|---|---|---|---|---|
| Emu Crossbar | 14.5 | [6, 8] | 7 | 250 | 25 | [55, 100] | 23 | 1560 | |
| Xiaomi QiCycle | 5.8 | 3 | 3 | 250 | 20 | 45 | 14.5 | 950 | |
| ANCHEER Plus | 8 | 5 | 21 | 250 | 25 | [25, 50] | 23 | 615 | |
| ECOTRIC | 12 | [5, 8] | 7 | 500 | 32 | 55 | 24.9 | 999 | |
| Merax 26” Aluminum | 8.8 | [5, 6] | 7 | 350 | 32 | [35, 45] | 22 | 690 | |
| Kemanner | 8 | [4, 6] | 21 | 250 | 25 | [35, 70] | 20 | [615, 700] | |
| Rattan | 10.4 | [4, 5] | 7 | 350 | 32 | 50 | 23.5 | 740 | |
| Aceshin | 8 | [4, 6] | 21 | 250 | 30 | 40 | 22.2 | 730 | |
| Shaofu 6AH | 4.4 | 3 | 1 | 350 | 25 | 20 | 12 | 390 | |
| Carrera Crossfuze | 11 | [6, 7] | 9 | 400 | 25 | 80 | 20.3 | 2300 |
Table 3.
The results for criteria (battery capacity), (charging time), and values for each .
| 4 | 3 | 0.3333 | |
| 4 | 5 | 0.1667 | |
| 4 | 8 | 0.0000 | |
| 9 | 3 | 0.8333 | |
| 9 | 5 | 0.5000 | |
| 9 | 8 | 0.1667 | |
| 15 | 3 | 1.0000 | |
| 15 | 5 | 0.6667 | |
| 15 | 8 | 0.5000 |
Table 4.
The results for criteria and and their characteristic objects’ values of preference P for .
Table 4.
The results for criteria and and their characteristic objects’ values of preference P for .
| Engine Power | Maximum Speed | ||
|---|---|---|---|
| 250 | 20 | 0.0000 | |
| 250 | 27 | 0.3750 | |
| 250 | 35 | 0.7500 | |
| 350 | 20 | 0.1250 | |
| 350 | 27 | 0.5000 | |
| 350 | 35 | 0.8750 | |
| 500 | 20 | 0.2500 | |
| 500 | 27 | 0.6250 | |
| 500 | 35 | 1.0000 |
Table 5.
The results for criteria (range) and (weight) and their characteristic objects’ values of preference P for .
Table 5.
The results for criteria (range) and (weight) and their characteristic objects’ values of preference P for .
| 20 | 10 | 0.2500 | |
| 20 | 20 | 0.1250 | |
| 20 | 25 | 0.0000 | |
| 60 | 10 | 0.6250 | |
| 60 | 20 | 0.5000 | |
| 60 | 25 | 0.3750 | |
| 100 | 10 | 1.0000 | |
| 100 | 20 | 0.8750 | |
| 100 | 25 | 0.7500 |
Table 6.
The results for battery assessment, number of gears and engine assessment and their corresponding characteristic objects’ values of preference P for .
Table 6.
The results for battery assessment, number of gears and engine assessment and their corresponding characteristic objects’ values of preference P for .
| 0 | 1 | 0 | 0.0000 | |
| 0 | 1 | 1 | 0.3750 | |
| 0 | 7 | 0 | 0.2500 | |
| 0 | 7 | 1 | 0.6250 | |
| 0 | 21 | 0 | 0.1250 | |
| 0 | 21 | 1 | 0.5000 | |
| 1 | 1 | 0 | 0.3750 | |
| 1 | 1 | 1 | 0.7500 | |
| 1 | 7 | 0 | 0.6250 | |
| 1 | 7 | 1 | 1.0000 | |
| 1 | 21 | 0 | 0.5000 | |
| 1 | 21 | 1 | 0.8750 |
Table 7.
The results for (drive system assessment), (comfort of usage assessment) and their corresponding characteristic objects’ values of preference P for .
Table 7.
The results for (drive system assessment), (comfort of usage assessment) and their corresponding characteristic objects’ values of preference P for .
| P | ||||
|---|---|---|---|---|
| 0 | 0 | 300 | 0.2222 | |
| 0 | 0 | 2500 | 0.1111 | |
| 0 | 0 | 6300 | 0.0000 | |
| 0 | 1 | 300 | 0.6667 | |
| 0 | 1 | 2500 | 0.5556 | |
| 0 | 1 | 6300 | 0.4444 | |
| 1 | 0 | 300 | 0.6667 | |
| 1 | 0 | 2500 | 0.5556 | |
| 1 | 0 | 6300 | 0.3333 | |
| 1 | 1 | 300 | 1.0000 | |
| 1 | 1 | 2500 | 0.8889 | |
| 1 | 1 | 6300 | 0.7778 |
Table 8.
Considered alternatives and their results –.
| P | |||||
|---|---|---|---|---|---|
| [0.4722, 0.5926] | 0.2679 | [0.5275, 0.5727] | [0.3781, 0.8000] | [0.4219, 0.6119] | |
| 0.5133 | 0 | 0.2758 | 0.4281 | 0.4063 | |
| 0.4333 | 0.2679 | 0.3880 | [0.0969, 0.3313] | [0.3752, 0.4693] | |
| [0.3333, 0.5833] | 0.8594 | [0.6973, 0,7910] | 0.3306 | [0.5308, 0.5686] | |
| [0.3778, 0.4867] | 0.7344 | [0.6671, 0.7079] | [0.2156, 0.3094] | [0.5264, 0.5778] | |
| [0.3333, 0.5833] | 0.2679 | [0.3505, 0.4442] | [0.2656, 0.5938] | [0.4116, 0.5959] | |
| [0.5389, 0.7055] | 0.7344 | [0.7275, 0.7900] | 0.3188 | [0.5800, 0.6056] | |
| [0.3333, 0.5833] | 0.5156 | [0.4433, 0.5371] | 0.2575 | [0.4414, 0.4804] | |
| 0.3733 | 0.3929 | 0.2873 | 0.225 | 0.4261 | |
| [0.3704, 0.4630] | 0.4345 | [0.5340, 0.5687] | 0.6800 | [0.4802, 0.4918] |
Table 9.
The results of the model for a wider domain of e-bikes according to [81,82,83,84,85,86,87].
| Name | P | |||||||||
|---|---|---|---|---|---|---|---|---|---|---|
| 2017 Raleigh Detour iE | 11.6 | 4 | 9 | 250 | 32 | 80 | 21.7 | 2399 | 0.5779 | |
| Aceshin | 8 | [4, 6] | 21 | 250 | 30 | 40 | 22.2 | 730 | [0.4414, 0.4804] | |
| ANCHEER Plus | 8 | 5 | 21 | 250 | 25 | [25, 50] | 23 | 615 | [0.3752, 0.4693] | |
| BESV CF1 | 8.4 | 5 | 10 | 250 | 28.8 | 64 | 22.4 | 1799 | 0.4810 | |
| BESV PSA1 | 10.5 | 5 | 7 | 250 | 30.4 | 72 | 19.5 | 1999 | 0.5569 | |
| Blix Aveny | 11 | 3 | 7 | 350 | 32 | 96 | 23.5 | 1899 | 0.6849 | |
| Blix Sol | 11 | 3 | 7 | 350 | 32 | 88 | 22 | 1599 | 0.6870 | |
| California Bicycle S | 8 | 4 | 1 | 250 | 32 | 56 | 22.6 | 2499 | 0.3669 | |
| Cannondale E-Rigid | 11 | 3.5 | 8 | 350 | 32 | 100 | 22.6 | 3490 | 0.6280 | |
| Carrera Crossfuze | 11 | [6, 7] | 9 | 400 | 25 | 80 | 20.3 | 2300 | [0.4802, 0.4918] | |
| Coboc ONE Soho | 9.6 | 2.5 | 1 | 250 | 24.8 | 88 | 13.1 | 5520 | 0.4016 | |
| CUBE Cross Pro 400 | 11 | 3.5 | 9 | 250 | 32 | 96 | 22.7 | 2599 | 0.6236 | |
| Desiknio Pinion Classic | 7 | 3 | 6 | 250 | 24.8 | 80 | 15.7 | 6135 | 0.3945 | |
| Desiknio Single Urban | 7 | 3 | 1 | 250 | 24.8 | 80 | 13.1 | 4415 | 0.3898 | |
| EcoMotion Tour e-Road | 10.4 | 4 | 7 | 350 | 32 | 83 | 20.2 | 1299 | 0.6763 | |
| E-Glide SS | 10.4 | 5 | 1 | 350 | 32 | 56 | 17.1 | 1099 | 0.4893 | |
| E-Glide ST | 11.4 | 6 | 10 | 500 | 32 | 80 | 24.4 | 1699 | 0.5838 | |
| e-Joe Gadis | 11 | 5 | 7 | 350 | 32 | 72 | 24.9 | 1699 | 0.5555 | |
| E-Lux Monaco | 10.5 | 6 | 9 | 500 | 32 | 88 | 24.8 | 1995 | 0.5912 | |
| ECOTRIC | 12 | [5, 8] | 7 | 500 | 32 | 55 | 24.9 | 999 | [0.5308, 0.5686] | |
| Emazing Coeus 73h3h | 8.7 | 4 | 7 | 350 | 32 | 88 | 20.2 | 1800 | 0.6591 | |
| Emazing Selene 73h3h | 8.7 | 4 | 7 | 350 | 32 | 88 | 21.9 | 2000 | 0.6336 | |
| Emu Crossbar | 14.5 | [6, 8] | 7 | 250 | 25 | [55, 100] | 23 | 1560 | [0.4219, 0.6119] | |
| Espin Flow | 11.6 | 4.5 | 8 | 350 | 35 | 80 | 24.3 | 1888 | 0.6095 | |
| EUNORAU E-TORQUE | 12.5 | 5 | 7 | 350 | 32 | 72 | 24.6 | 1599 | 0.5694 | |
| eVox KAB 375 | 7.8 | 4 | 8 | 350 | 35 | 100 | 20.4 | 2199 | 0.6831 | |
| Gazelle Avenue C8 | 14 | 4 | 8 | 250 | 32 | 100 | 23.8 | 2999 | 0.6167 | |
| Gazelle CityZen C8 HM | 11 | 3.5 | 8 | 350 | 32 | 94 | 23.1 | 2999 | 0.6204 | |
| Gazelle CityZen T9 HMB | 13.4 | 4 | 9 | 350 | 32 | 100 | 24.1 | 3499 | 0.6089 | |
| GenZe 200 Series | 9.6 | 3.5 | 8 | 350 | 32 | 56 | 22.6 | 1899 | 0.5399 | |
| IZIP E3 Brio | 11.6 | 5.5 | 7 | 250 | 32 | 80 | 25 | 1699 | 0.5600 | |
| IZIP E3 Loma | 11 | 5.5 | 7 | 250 | 32 | 80 | 24.9 | 1699 | 0.5582 | |
| Juiced OceanCurrent | 8.8 | 4 | 8 | 500 | 35 | 64 | 23.1 | 1299 | 0.6144 | |
| Junto Gen 1 | 11.6 | 6 | 11 | 350 | 32 | 96 | 22.1 | 2222 | 0.6140 | |
| Kalkhoff Agattu B7 | 11 | 3.5 | 7 | 250 | 32 | 100 | 24 | 2499 | 0.6353 | |
| Kemanner | 8 | [4, 6] | 21 | 250 | 25 | [35, 70] | 20 | [615, 700] | [0.4116, 0.5959] | |
| Merax 26” Aluminum | 8.8 | [5, 6] | 7 | 350 | 32 | [35, 45] | 22 | 690 | [0.5264, 0.5778] | |
| Optibike Rocky Mount. | 11.6 | 5 | 11 | 500 | 35 | 96 | 24.4 | 3995 | 0.5768 | |
| Orbea Katu-E 10 | 11 | 3.5 | 8 | 250 | 32 | 96 | 22.9 | 2999 | 0.6114 | |
| Populo Lift V2 | 8.7 | 4.5 | 7 | 250 | 32 | 56 | 22.1 | 1399 | 0.5273 | |
| Populo Scout | 13 | 4.5 | 8 | 350 | 32 | 80 | 24.7 | 1699 | 0.6010 | |
| Populo Sport | 10.4 | 3 | 1 | 250 | 32 | 48 | 15.7 | 999 | 0.5028 | |
| Populo Sport V3 | 8.7 | 4.5 | 1 | 250 | 32 | 56 | 16.7 | 999 | 0.4813 | |
| Propella 2.2 7-Speed | 6.8 | 2.5 | 7 | 250 | 28.8 | 56 | 16.8 | 1299 | 0.5486 | |
| Propella V2.0 Single-Speed | 6.8 | 2.5 | 1 | 250 | 25.6 | 56 | 13.6 | 1199 | 0.4495 | |
| PUBLIC D8 Electric | 8.8 | 4.5 | 8 | 350 | 32 | 88 | 24.8 | 2199 | 0.5841 | |
| Pure Cycles Volta 8-Speed | 5.8 | 4 | 8 | 250 | 32 | 40 | 17 | 1999 | 0.4433 | |
| Rattan | 10.4 | [4, 5] | 7 | 350 | 32 | 50 | 23.5 | 740 | [0.5800, 0.6056] | |
| Raleigh Sprite iE | 8.8 | 5 | 7 | 350 | 32 | 64 | 24.5 | 1899 | 0.5116 | |
| Raleigh Superbe iE | 8.8 | 4.5 | 7 | 350 | 32 | 64 | 22.7 | 1799 | 0.5450 | |
| Riese Müller Mixte | 13.4 | 3.5 | 10 | 350 | 32 | 100 | 21.9 | 3879 | 0.6238 | |
| Riese Müller NuVinci | 11 | 3.5 | 1 | 250 | 32 | 100 | 24.8 | 4489 | 0.4592 | |
| Schwinn Monroe 250 | 11.6 | 4.5 | 1 | 250 | 32 | 72 | 18.8 | 1199 | 0.5335 | |
| Schwinn Monroe 350 | 14 | 6 | 1 | 350 | 32 | 88 | 20.4 | 1499 | 0.5732 | |
| Scott E-Sub Evo | 11 | 3.5 | 8 | 350 | 32 | 100 | 22.4 | 4199 | 0.6060 | |
| Shaofu 6AH | 4.4 | 3 | 1 | 350 | 25 | 20 | 12 | 390 | 0.4261 | |
| Specialized Como 2.0 | 12.8 | 3.5 | 9 | 250 | 32 | 96 | 21.5 | 2600 | 0.6411 | |
| Specialized Como 3.0 | 12.8 | 4 | 9 | 250 | 32 | 80 | 20.7 | 2950 | 0.5711 | |
| Specialized Vado 3.0 | 12.5 | 3.5 | 10 | 250 | 32 | 100 | 24.5 | 3200 | 0.6027 | |
| Trek Lift+ Lowstep | 11.6 | 4 | 10 | 250 | 32 | 80 | 20.3 | 2799 | 0.5718 | |
| Trek Neko+ | 11.6 | 4 | 10 | 250 | 32 | 80 | 19.1 | 2999 | 0.5717 | |
| VoltBike Urban | 13 | 5.5 | 6 | 350 | 32 | 80 | 23.4 | 1199 | 0.6085 | |
| Xiaomi QiCycle | 5.8 | 3 | 3 | 250 | 20 | 45 | 14.5 | 950 | 0.4063 |
© 2019 by the authors. Licensee MDPI, Basel, Switzerland. This article is an open access article distributed under the terms and conditions of the Creative Commons Attribution (CC BY) license (http://creativecommons.org/licenses/by/4.0/).
Share and Cite
MDPI and ACS Style
Sałabun, W.; Palczewski, K.; Wątróbski, J. Multicriteria Approach to Sustainable Transport Evaluation under Incomplete Knowledge: Electric Bikes Case Study. Sustainability 2019, 11, 3314. https://doi.org/10.3390/su11123314
AMA Style
Sałabun W, Palczewski K, Wątróbski J. Multicriteria Approach to Sustainable Transport Evaluation under Incomplete Knowledge: Electric Bikes Case Study. Sustainability. 2019; 11(12):3314. https://doi.org/10.3390/su11123314
Chicago/Turabian StyleSałabun, Wojciech, Krzysztof Palczewski, and Jarosław Wątróbski. 2019. "Multicriteria Approach to Sustainable Transport Evaluation under Incomplete Knowledge: Electric Bikes Case Study" Sustainability 11, no. 12: 3314. https://doi.org/10.3390/su11123314
Note that from the first issue of 2016, this journal uses article numbers instead of page numbers. See further details here.